Embed Size (px)
Citation preview
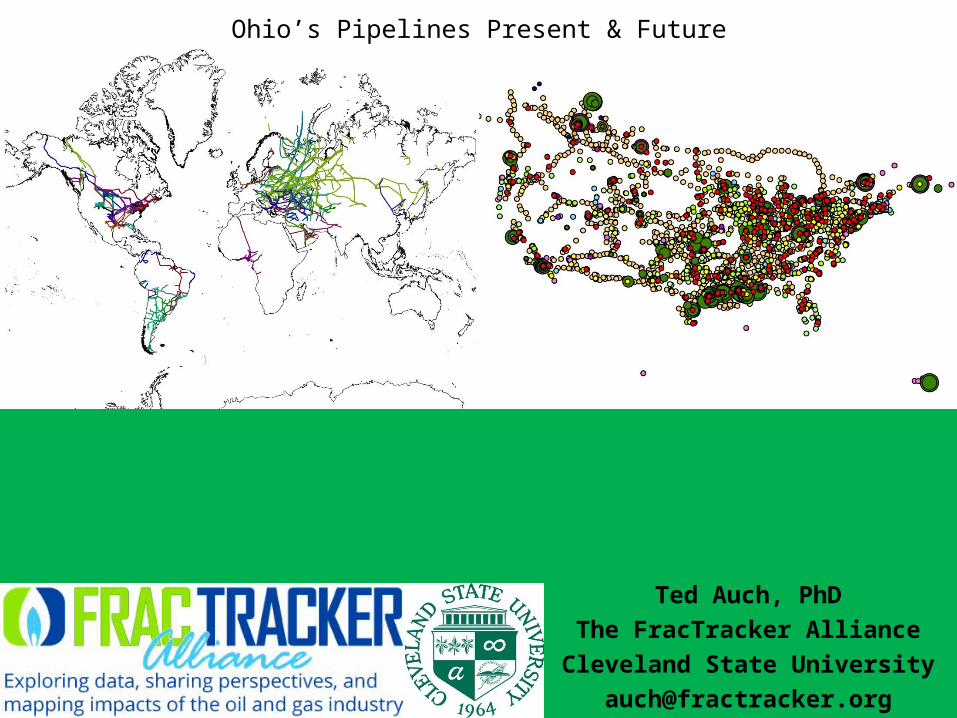
Ted Auch, PhDThe FracTracker Alliance
Cleveland State [email protected]
Ohio’s Pipelines Present & Future
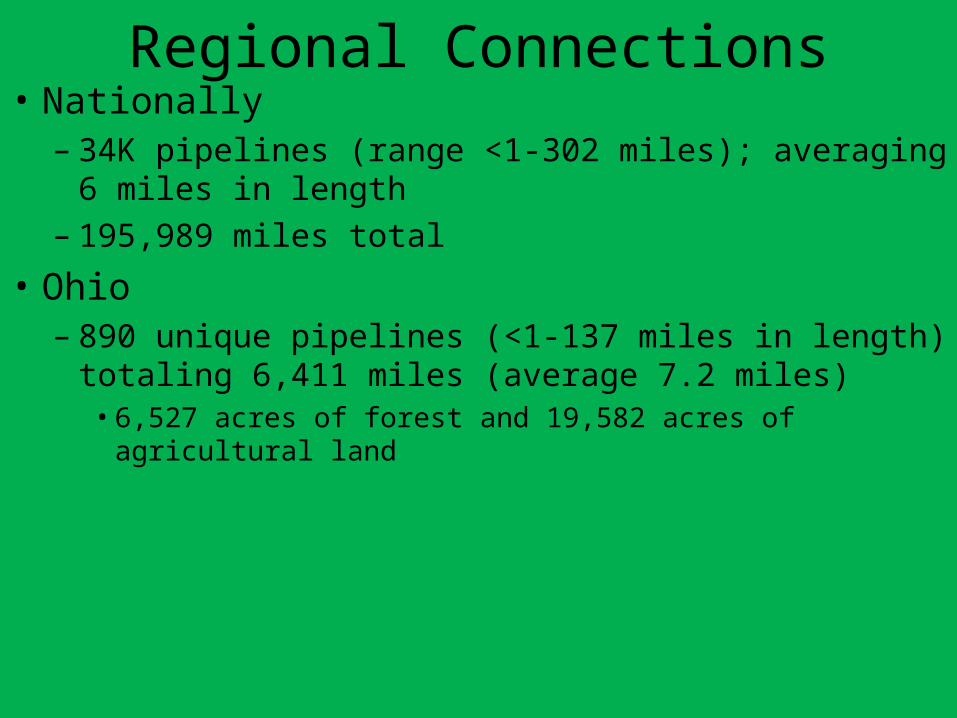
Regional Connections• Nationally– 34K pipelines (range <1-302 miles); averaging 6 miles in
length– 195,989 miles total
• Ohio– 890 unique pipelines (<1-137 miles in length) totaling
6,411 miles (average 7.2 miles)• 6,527 acres of forest and 19,582 acres of agricultural land
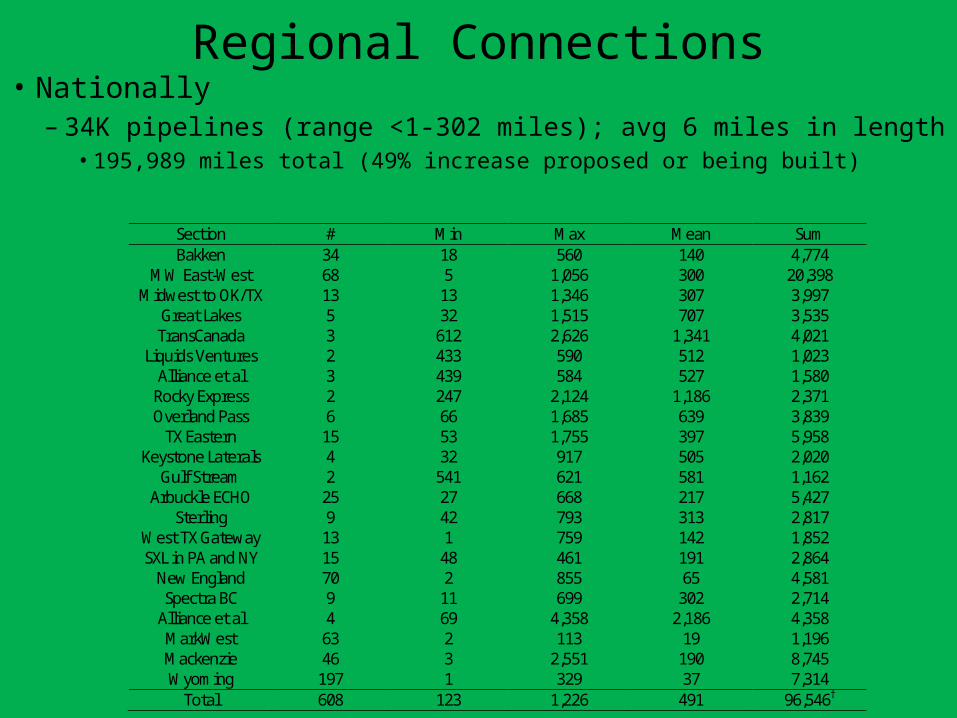
Regional Connections• Nationally– 34K pipelines (range <1-302 miles); avg 6 miles in length
• 195,989 miles total (49% increase proposed or being built)Section # Min Max Mean Sum Bakken 34 18 560 140 4,774
MW East-West 68 5 1,056 300 20,398 Midwest to OK/TX 13 13 1,346 307 3,997
Great Lakes 5 32 1,515 707 3,535 TransCanada 3 612 2,626 1,341 4,021
Liquids Ventures 2 433 590 512 1,023 Alliance et al 3 439 584 527 1,580
Rocky Express 2 247 2,124 1,186 2,371 Overland Pass 6 66 1,685 639 3,839
TX Eastern 15 53 1,755 397 5,958 Keystone Laterals 4 32 917 505 2,020
Gulf Stream 2 541 621 581 1,162 Arbuckle ECHO 25 27 668 217 5,427
Sterling 9 42 793 313 2,817 West TX Gateway 13 1 759 142 1,852 SXL in PA and NY 15 48 461 191 2,864
New England 70 2 855 65 4,581 Spectra BC 9 11 699 302 2,714
Alliance et al 4 69 4,358 2,186 4,358 MarkWest 63 2 113 19 1,196 Mackenzie 46 3 2,551 190 8,745 Wyoming 197 1 329 37 7,314
Total 608 123 1,226 491 96,546†
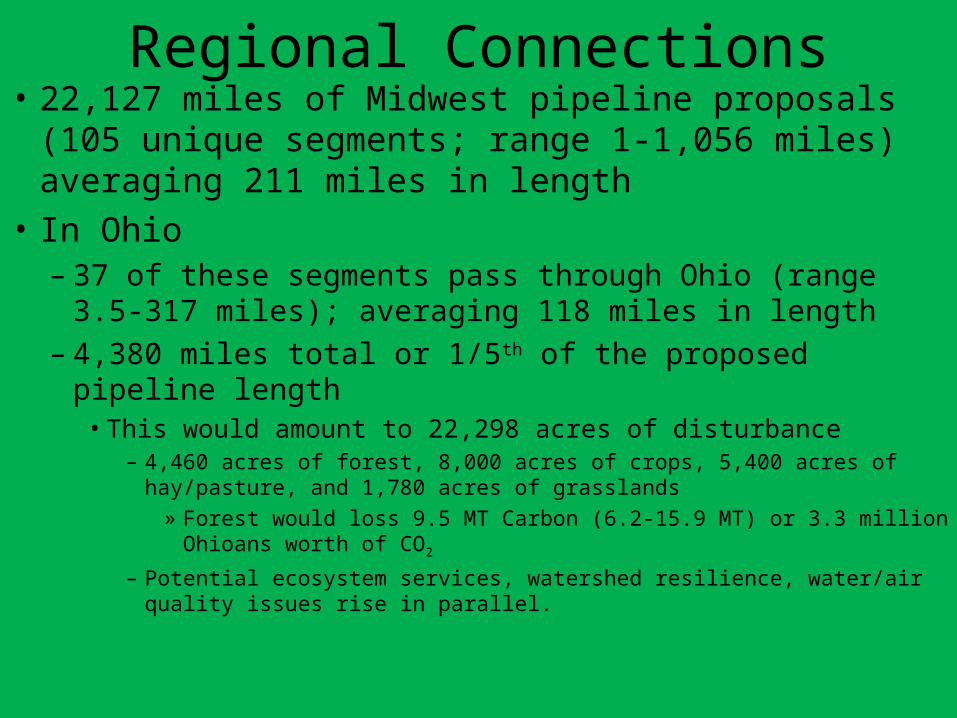
Regional Connections• 22,127 miles of Midwest pipeline proposals (105 unique
segments; range 1-1,056 miles) averaging 211 miles in length
• In Ohio– 37 of these segments pass through Ohio (range 3.5-317 miles);
averaging 118 miles in length– 4,380 miles total or 1/5th of the proposed pipeline length
• This would amount to 22,298 acres of disturbance– 4,460 acres of forest, 8,000 acres of crops, 5,400 acres of hay/pasture, and
1,780 acres of grasslands» Forest would loss 9.5 MT Carbon (6.2-15.9 MT) or 3.3 million Ohioans
worth of CO2
– Potential ecosystem services, watershed resilience, water/air quality issues rise in parallel.
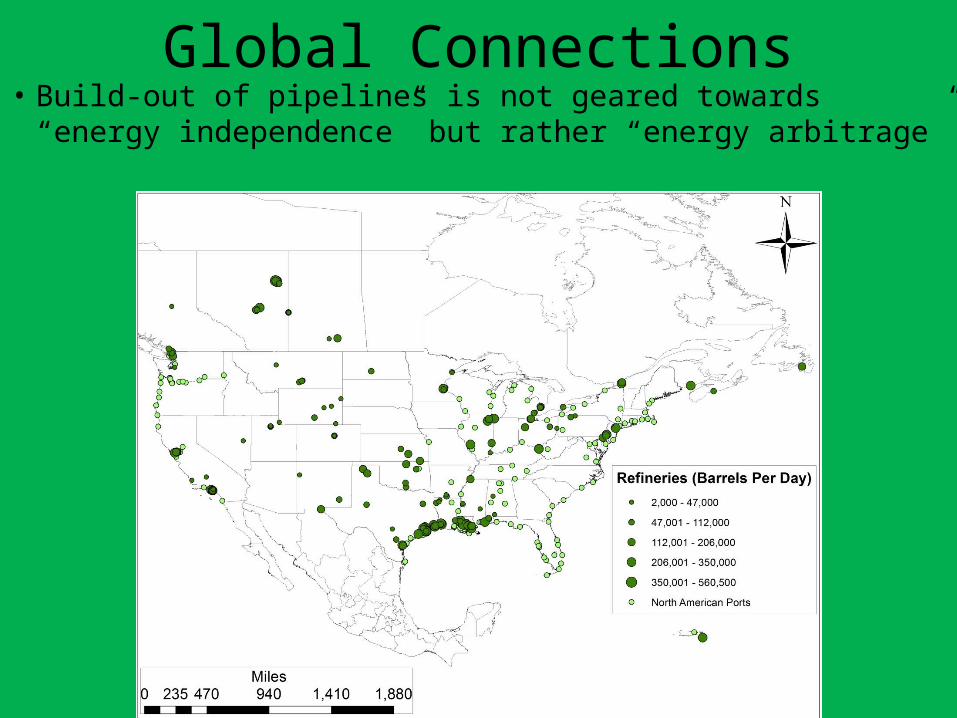
Global Connections• Build-out of pipelines is not geared towards “energy
independence” but rather “energy arbitrage”
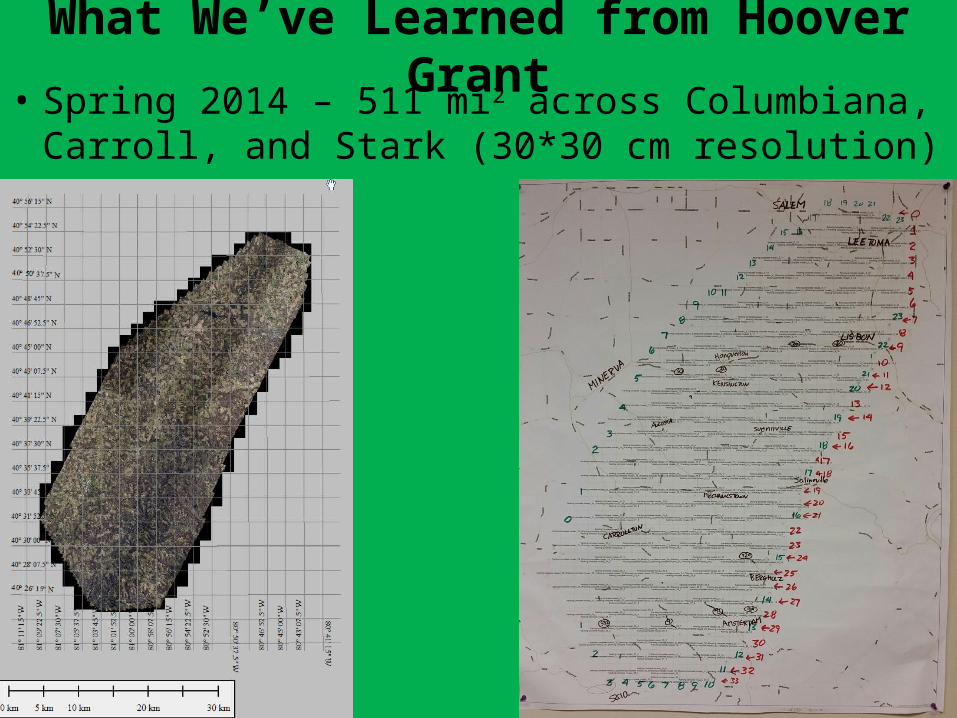
What We’ve Learned from Hoover Grant• Spring 2014 – 511 mi2 across Columbiana, Carroll,
and Stark (30*30 cm resolution)
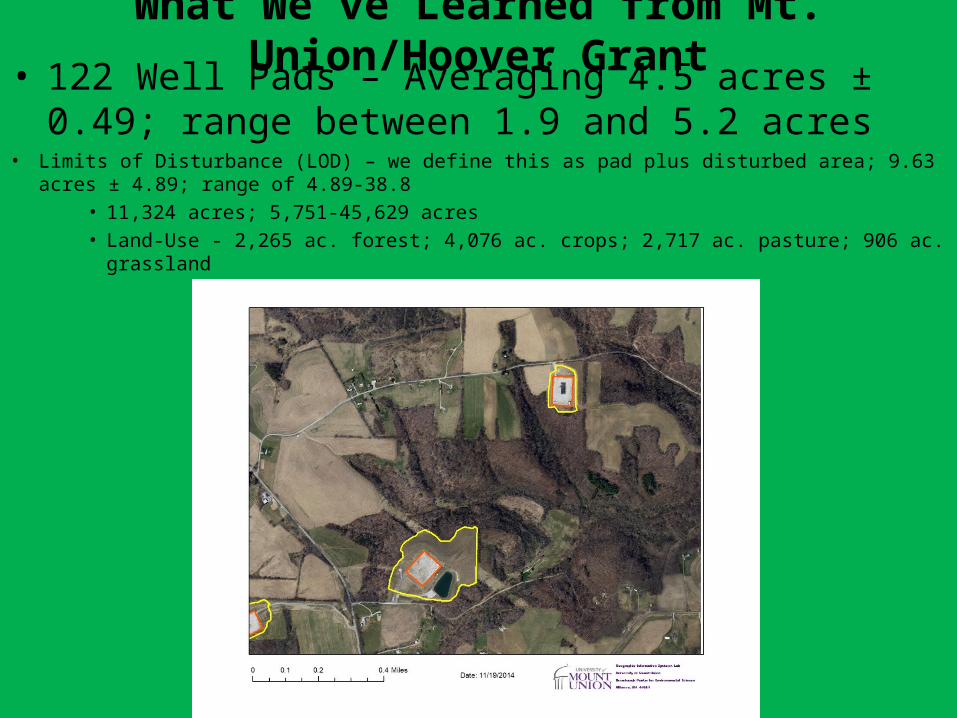
What We’ve Learned from Mt. Union/Hoover Grant• 122 Well Pads – Averaging 4.5 acres ± 0.49; range between
1.9 and 5.2 acres• Limits of Disturbance (LOD) – we define this as pad plus disturbed area; 9.63 acres ± 4.89;
range of 4.89-38.8• 11,324 acres; 5,751-45,629 acres• Land-Use - 2,265 ac. forest; 4,076 ac. crops; 2,717 ac. pasture; 906 ac. grassland
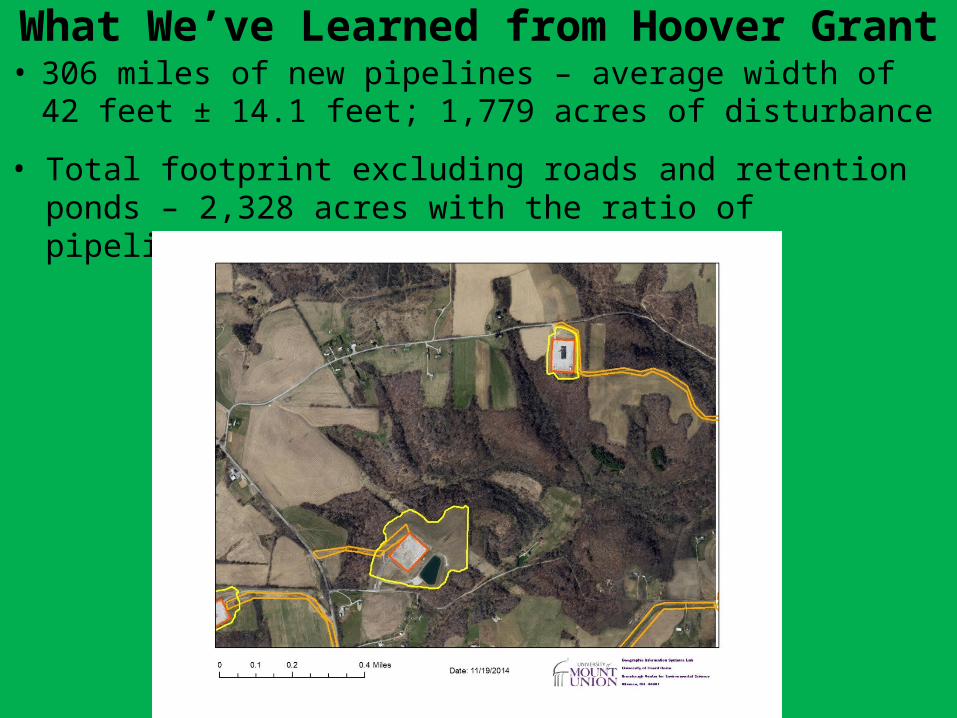
What We’ve Learned from Hoover Grant• 306 miles of new pipelines – average width of 42 feet ±
14.1 feet; 1,779 acres of disturbance• Total footprint excluding roads and retention ponds – 2,328 acres
with the ratio of pipelines to well pads being 3.3:1
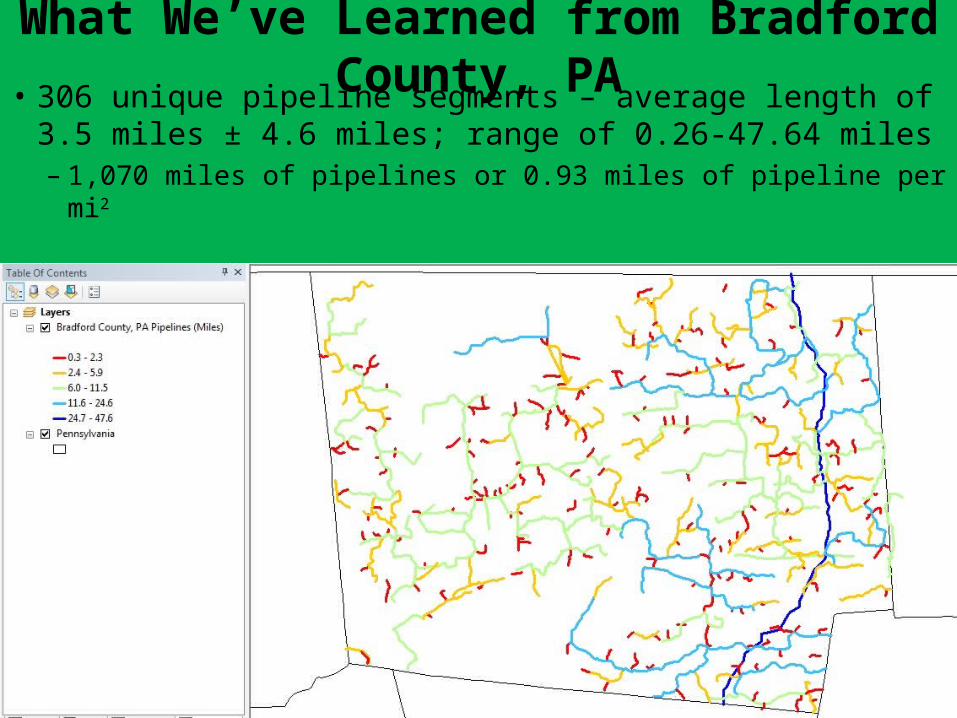
What We’ve Learned from Bradford County, PA
• 306 unique pipeline segments – average length of 3.5 miles ± 4.6 miles; range of 0.26-47.64 miles– 1,070 miles of pipelines or 0.93 miles of pipeline per mi2
The EQT & TETCO Proposals• 28 unique pipeline segments – average length of 27
miles; range of 0.96-104 miles– 751 miles of pipelines or 0.04 miles of pipeline per mi2
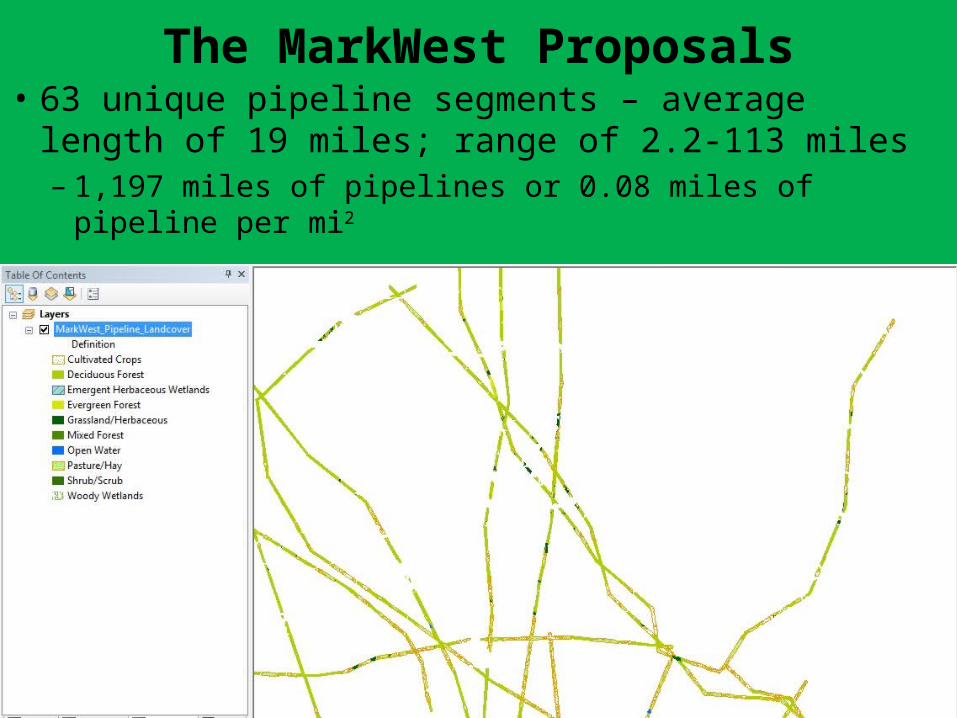
The MarkWest Proposals• 63 unique pipeline segments – average length of 19
miles; range of 2.2-113 miles– 1,197 miles of pipelines or 0.08 miles of pipeline per mi2
The MarkWest Proposals• Nearly 10,200 polygons– Average 3.3 acres of disturbance per segment; high of
2.6 mi2; total of 53 mi2
– 1,676 forested segments; 12.4 ac. Average and a total of 32.5 mi2 of forest removal for this proposal• 13.1 mi2 of agriculture; 5.3 mi2 of developed; 33 acres of
wetlands; 236 acres of open water traversed; 580 acres of grassland
– Forest displacement would remove 580,545 tons of Carbon (426-1,095K)• This is equivalent to 30.3 tons of CO2 (22.2-57.1 MT CO2)
• Amounts to the emissions of 1.69 million Ohioans (1.24-3.18 million Ohioans)
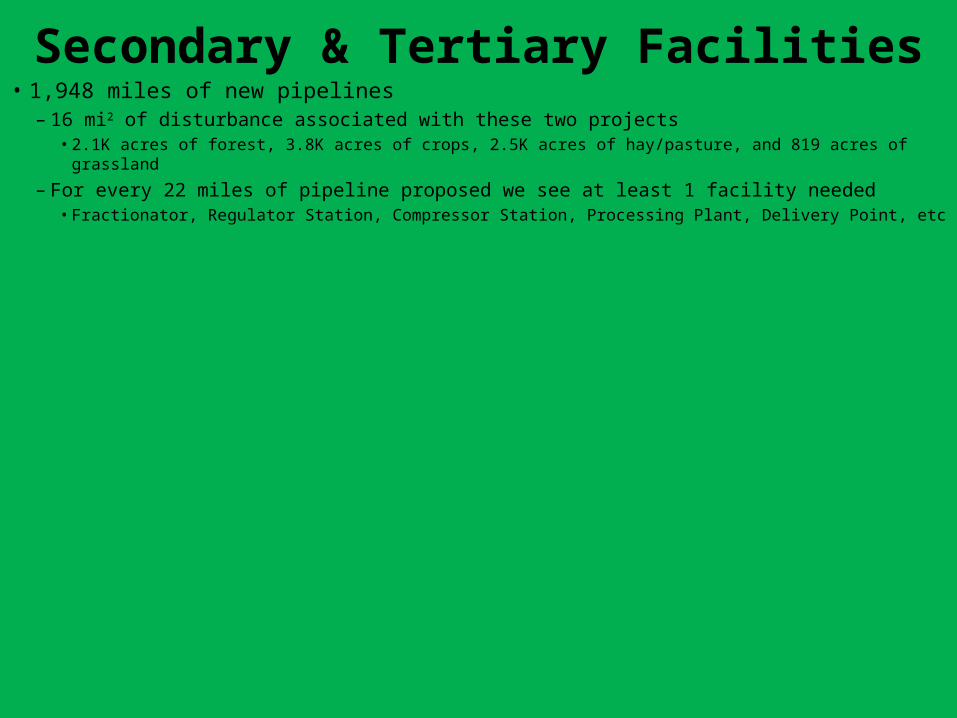
Secondary & Tertiary Facilities• 1,948 miles of new pipelines– 16 mi2 of disturbance associated with these two projects
• 2.1K acres of forest, 3.8K acres of crops, 2.5K acres of hay/pasture, and 819 acres of grassland
– For every 22 miles of pipeline proposed we see at least 1 facility needed• Fractionator, Regulator Station, Compressor Station, Processing Plant, Delivery Point, etc
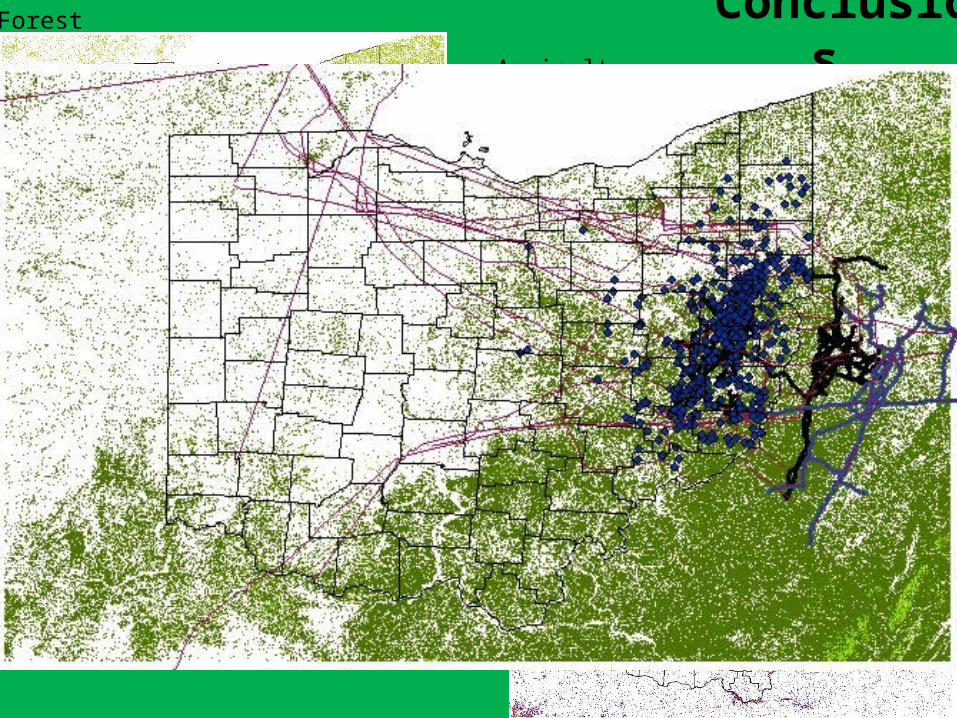
ConclusionsForest
Agriculture
Developed
Wetlands/Grasslands
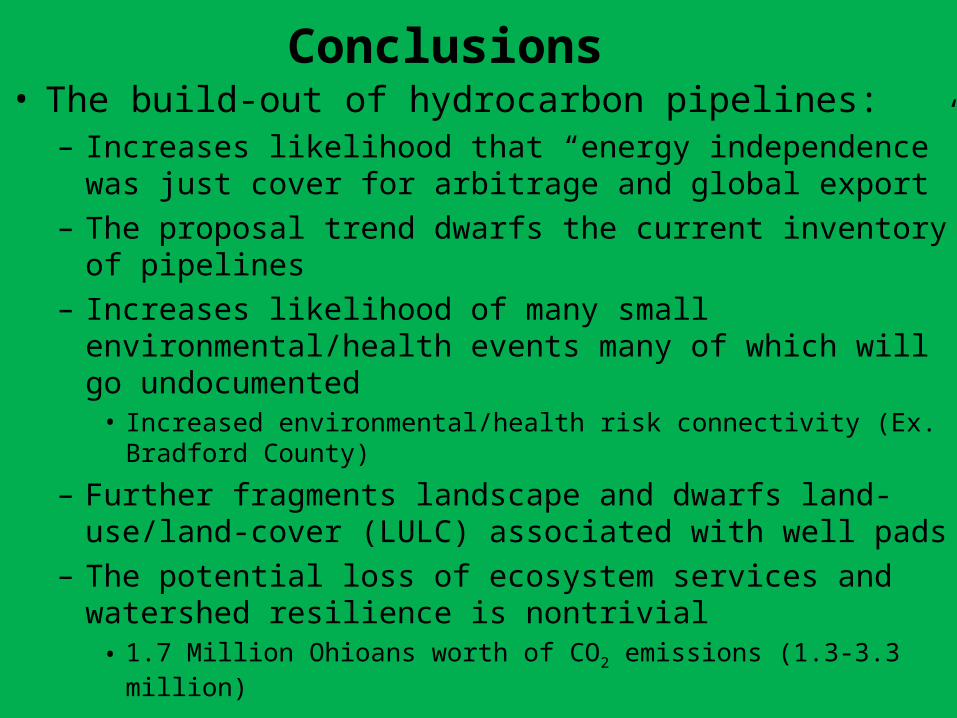
Conclusions• The build-out of hydrocarbon pipelines:– Increases likelihood that “energy independence” was just cover
for arbitrage and global export– The proposal trend dwarfs the current inventory of pipelines– Increases likelihood of many small environmental/health events
many of which will go undocumented• Increased environmental/health risk connectivity (Ex. Bradford County)
– Further fragments landscape and dwarfs land-use/land-cover (LULC) associated with well pads
– The potential loss of ecosystem services and watershed resilience is nontrivial• 1.7 Million Ohioans worth of CO2 emissions (1.3-3.3 million)