Embed Size (px)
Citation preview
TEEJAY LANKA PLC(Formerly known as TEXTURED JERSEY LANKA PLC)
Condensed Interim Financial Statements
Period Ended 31 December 2017
TEEJAY LANKA PLC
sgdBill Lam
Chairman
As the Group embarks on its final lap of the second half, and setting the foundation for its long-term growth plans, the business is cautious of the
future market challenges, mainly driven by selling price challenges in the market against the backdrop of increasing raw material prices. The cotton
price volatility is expected to continue to the next quarter as the market prepares to face yet another yarn price hike likely to experience during the
first quarter of the next financial year. However against these volatile market conditions, the Group remains Optimistic with new opportunities
emerging in new markets, new products coming through our Innovation pipeline, and several new Customers engaging the company. As a result of
India’s new Capacity coming into full swing, the Group will soon drive regional Solutions to its Customers to secure Teejay’s long term growth
trajectory. The strategic direction for the group continues to remain unchanged in general as a result.
Chairman’s Review
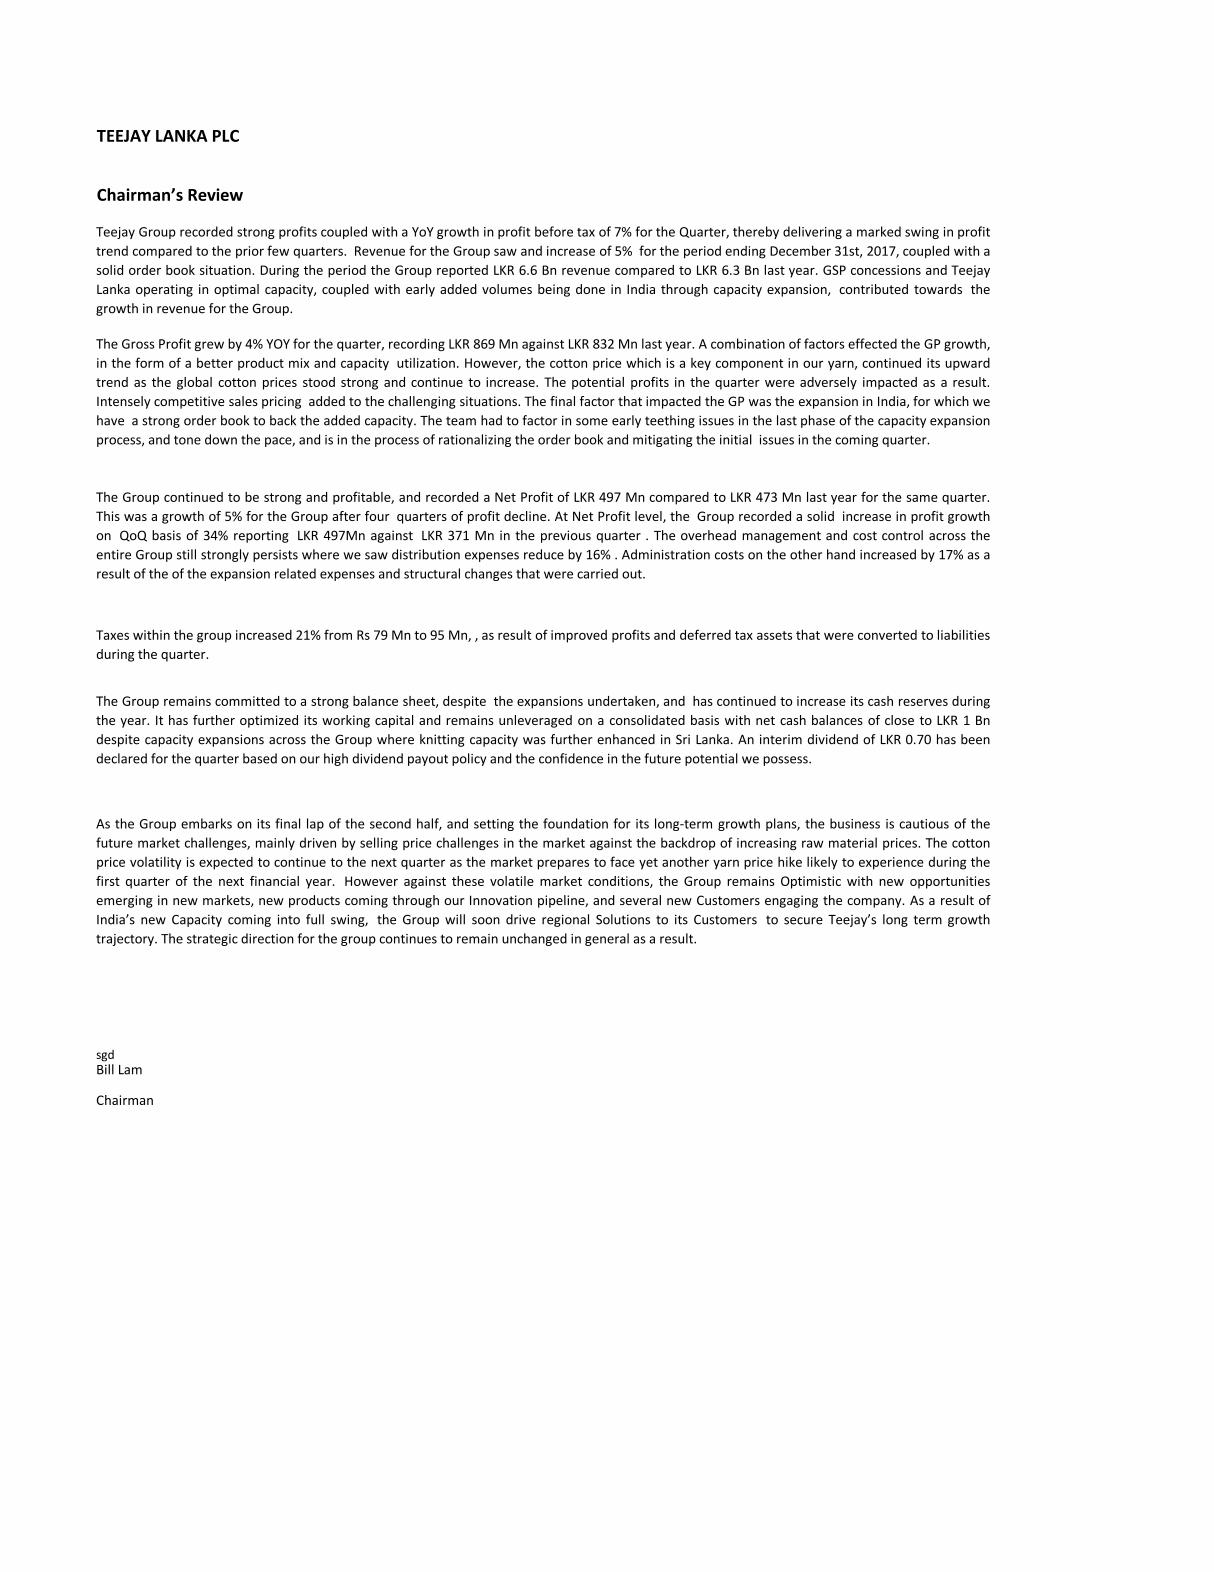
Teejay Group recorded strong profits coupled with a YoY growth in profit before tax of 7% for the Quarter, thereby delivering a marked swing in profit
trend compared to the prior few quarters. Revenue for the Group saw and increase of 5% for the period ending December 31st, 2017, coupled with a
solid order book situation. During the period the Group reported LKR 6.6 Bn revenue compared to LKR 6.3 Bn last year. GSP concessions and Teejay
Lanka operating in optimal capacity, coupled with early added volumes being done in India through capacity expansion, contributed towards the
growth in revenue for the Group.
The Gross Profit grew by 4% YOY for the quarter, recording LKR 869 Mn against LKR 832 Mn last year. A combination of factors effected the GP growth,
in the form of a better product mix and capacity utilization. However, the cotton price which is a key component in our yarn, continued its upward
trend as the global cotton prices stood strong and continue to increase. The potential profits in the quarter were adversely impacted as a result.
Intensely competitive sales pricing added to the challenging situations. The final factor that impacted the GP was the expansion in India, for which we
have a strong order book to back the added capacity. The team had to factor in some early teething issues in the last phase of the capacity expansion
process, and tone down the pace, and is in the process of rationalizing the order book and mitigating the initial issues in the coming quarter.
The Group continued to be strong and profitable, and recorded a Net Profit of LKR 497 Mn compared to LKR 473 Mn last year for the same quarter.
This was a growth of 5% for the Group after four quarters of profit decline. At Net Profit level, the Group recorded a solid increase in profit growth
on QoQ basis of 34% reporting LKR 497Mn against LKR 371 Mn in the previous quarter . The overhead management and cost control across the
entire Group still strongly persists where we saw distribution expenses reduce by 16% . Administration costs on the other hand increased by 17% as a
result of the of the expansion related expenses and structural changes that were carried out.
Taxes within the group increased 21% from Rs 79 Mn to 95 Mn, , as result of improved profits and deferred tax assets that were converted to liabilities
during the quarter.
The Group remains committed to a strong balance sheet, despite the expansions undertaken, and has continued to increase its cash reserves during
the year. It has further optimized its working capital and remains unleveraged on a consolidated basis with net cash balances of close to LKR 1 Bn
despite capacity expansions across the Group where knitting capacity was further enhanced in Sri Lanka. An interim dividend of LKR 0.70 has been
declared for the quarter based on our high dividend payout policy and the confidence in the future potential we possess.
TEEJAY LANKA PLC
Income Statement
(all amounts in Sri Lankan Rupees thousands)
Group
2017 2016 2017 2016 2017Unaudited Unaudited Variance Unaudited Unaudited Variance Audited
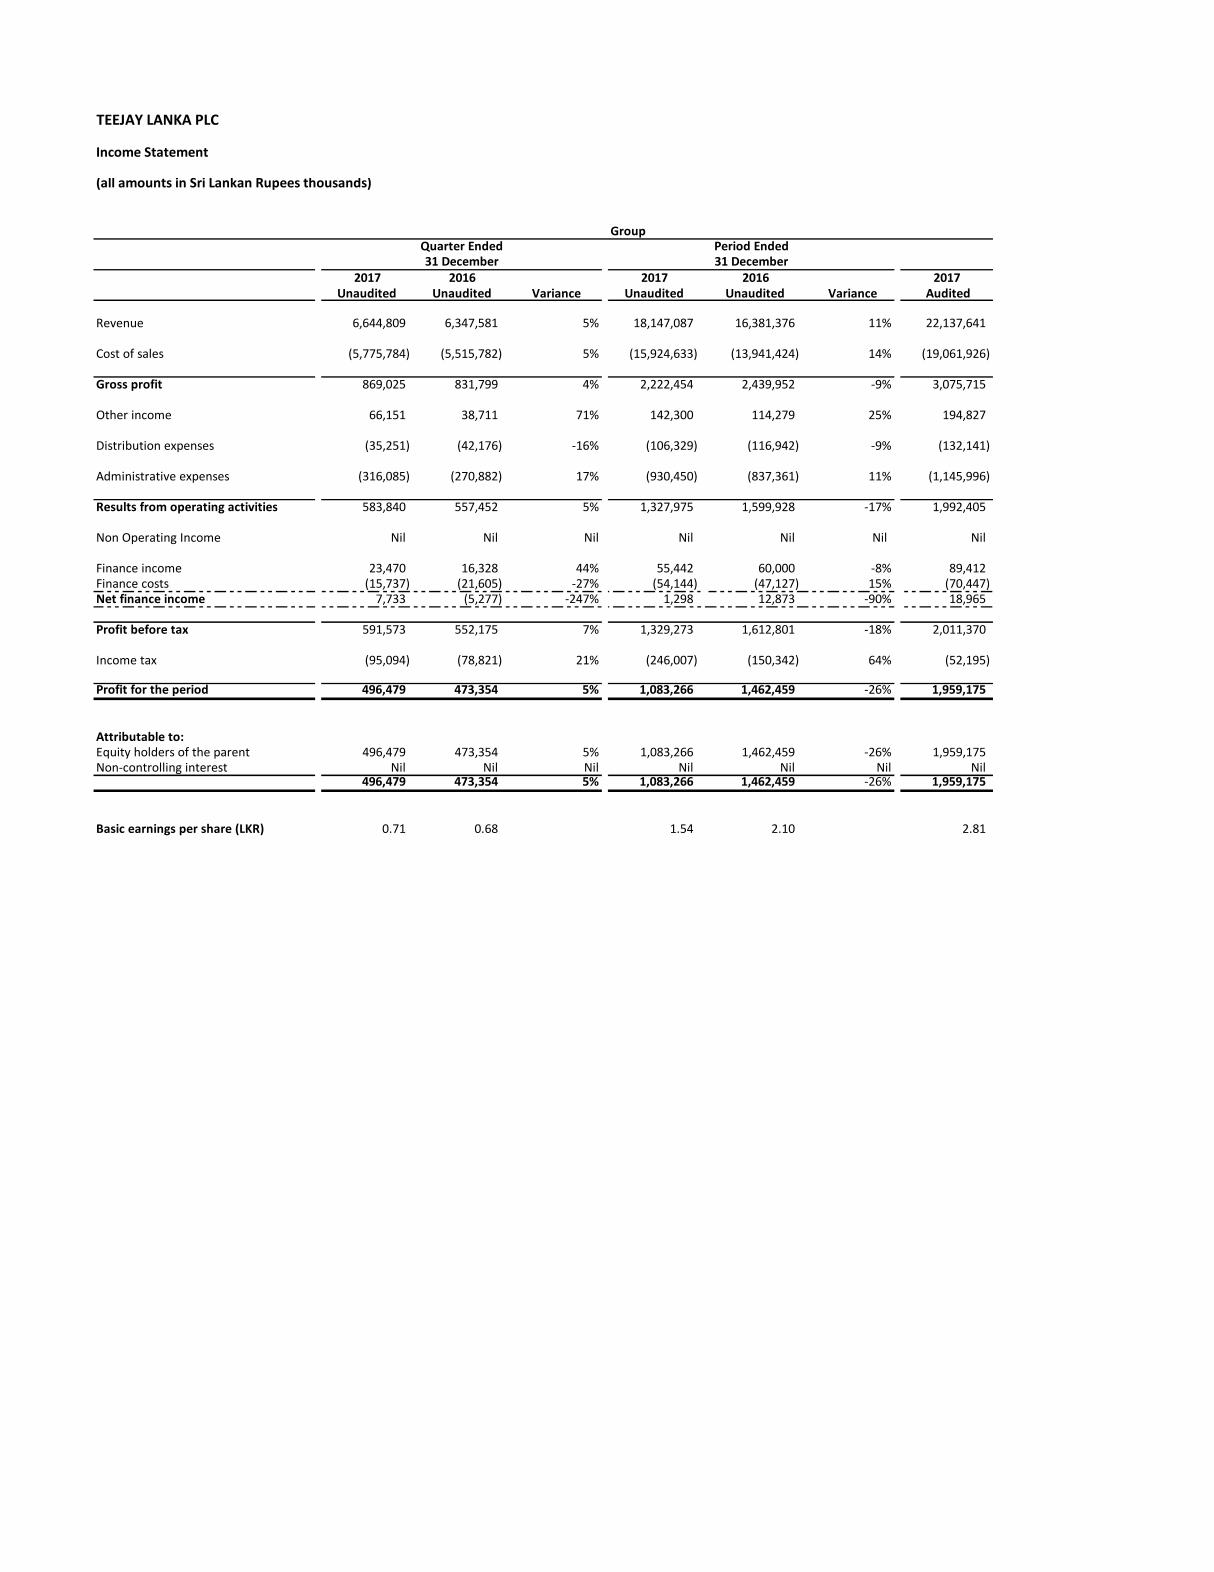
Revenue 6,644,809 6,347,581 5% 18,147,087 16,381,376 11% 22,137,641
Cost of sales (5,775,784) (5,515,782) 5% (15,924,633) (13,941,424) 14% (19,061,926)
Gross profit 869,025 831,799 4% 2,222,454 2,439,952 -9% 3,075,715
Other income 66,151 38,711 71% 142,300 114,279 25% 194,827
Distribution expenses (35,251) (42,176) -16% (106,329) (116,942) -9% (132,141)
Administrative expenses (316,085) (270,882) 17% (930,450) (837,361) 11% (1,145,996)
Results from operating activities 583,840 557,452 5% 1,327,975 1,599,928 -17% 1,992,405
Non Operating Income Nil Nil Nil Nil Nil Nil Nil
Finance income 23,470 16,328 44% 55,442 60,000 -8% 89,412 Finance costs (15,737) (21,605) -27% (54,144) (47,127) 15% (70,447) Net finance income 7,733 (5,277) -247% 1,298 12,873 -90% 18,965
Profit before tax 591,573 552,175 7% 1,329,273 1,612,801 -18% 2,011,370
Income tax (95,094) (78,821) 21% (246,007) (150,342) 64% (52,195)
Profit for the period 496,479 473,354 5% 1,083,266 1,462,459 -26% 1,959,175
Attributable to:Equity holders of the parent 496,479 473,354 5% 1,083,266 1,462,459 -26% 1,959,175 Non-controlling interest Nil Nil Nil Nil Nil Nil Nil
496,479 473,354 5% 1,083,266 1,462,459 -26% 1,959,175
Basic earnings per share (LKR) 0.71 0.68 1.54 2.10 2.81
Quarter Ended31 December 31 December
Period Ended
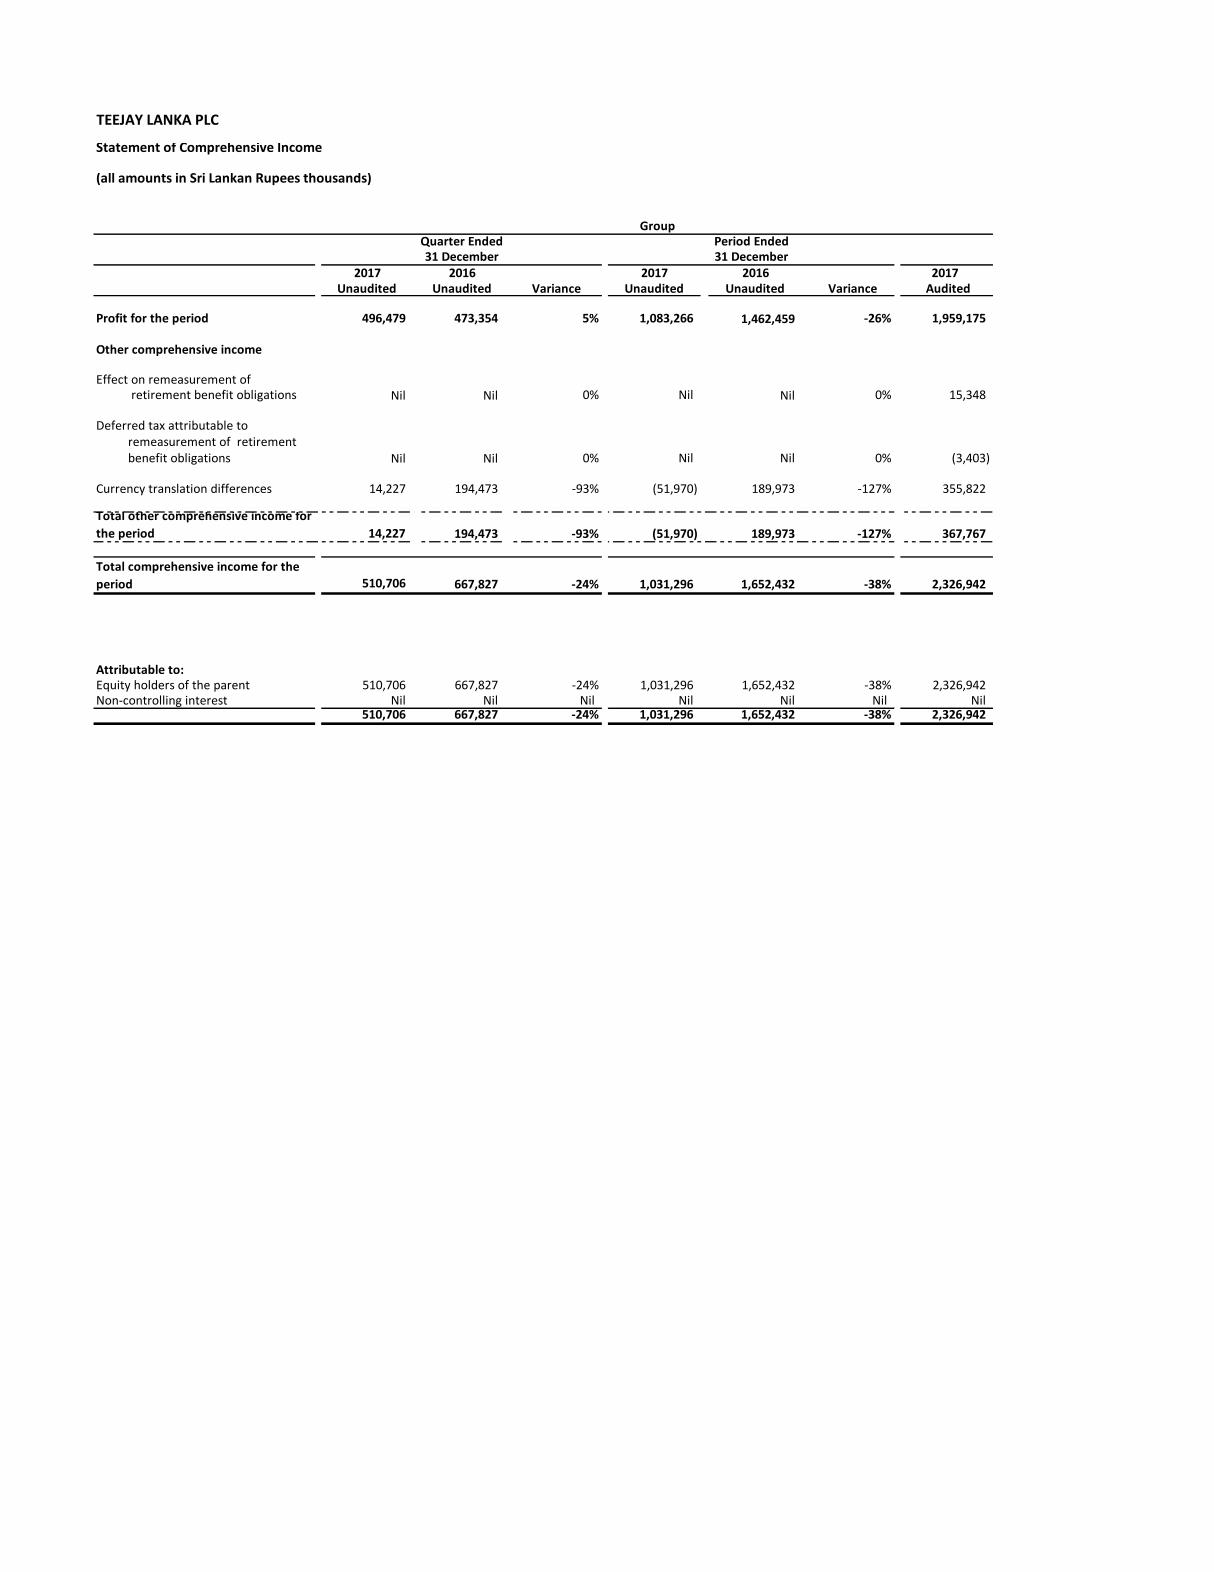
TEEJAY LANKA PLC
Statement of Comprehensive Income
(all amounts in Sri Lankan Rupees thousands)
2017 2016 2017 2016 2017Unaudited Unaudited Variance Unaudited Unaudited Variance Audited
Profit for the period 496,479 473,354 5% 1,083,266 1,462,459 -26% 1,959,175
Other comprehensive income
Effect on remeasurement of retirement benefit obligations Nil Nil 0% Nil Nil 0% 15,348
Deferred tax attributable to remeasurement of retirement benefit obligations Nil Nil 0% Nil Nil 0% (3,403)
Currency translation differences 14,227 194,473 -93% (51,970) 189,973 -127% 355,822
194,473 -93% (51,970) 189,973 -127% 367,767
510,706 667,827 -24% 1,031,296 1,652,432 -38% 2,326,942
Attributable to:Equity holders of the parent 510,706 667,827 -24% 1,031,296 1,652,432 -38% 2,326,942 Non-controlling interest Nil Nil Nil Nil Nil Nil Nil
510,706 667,827 -24% 1,031,296 1,652,432 -38% 2,326,942
Total comprehensive income for the
period
Total other comprehensive income for
the period 14,227
Quarter Ended31 December
Period Ended31 December
Group
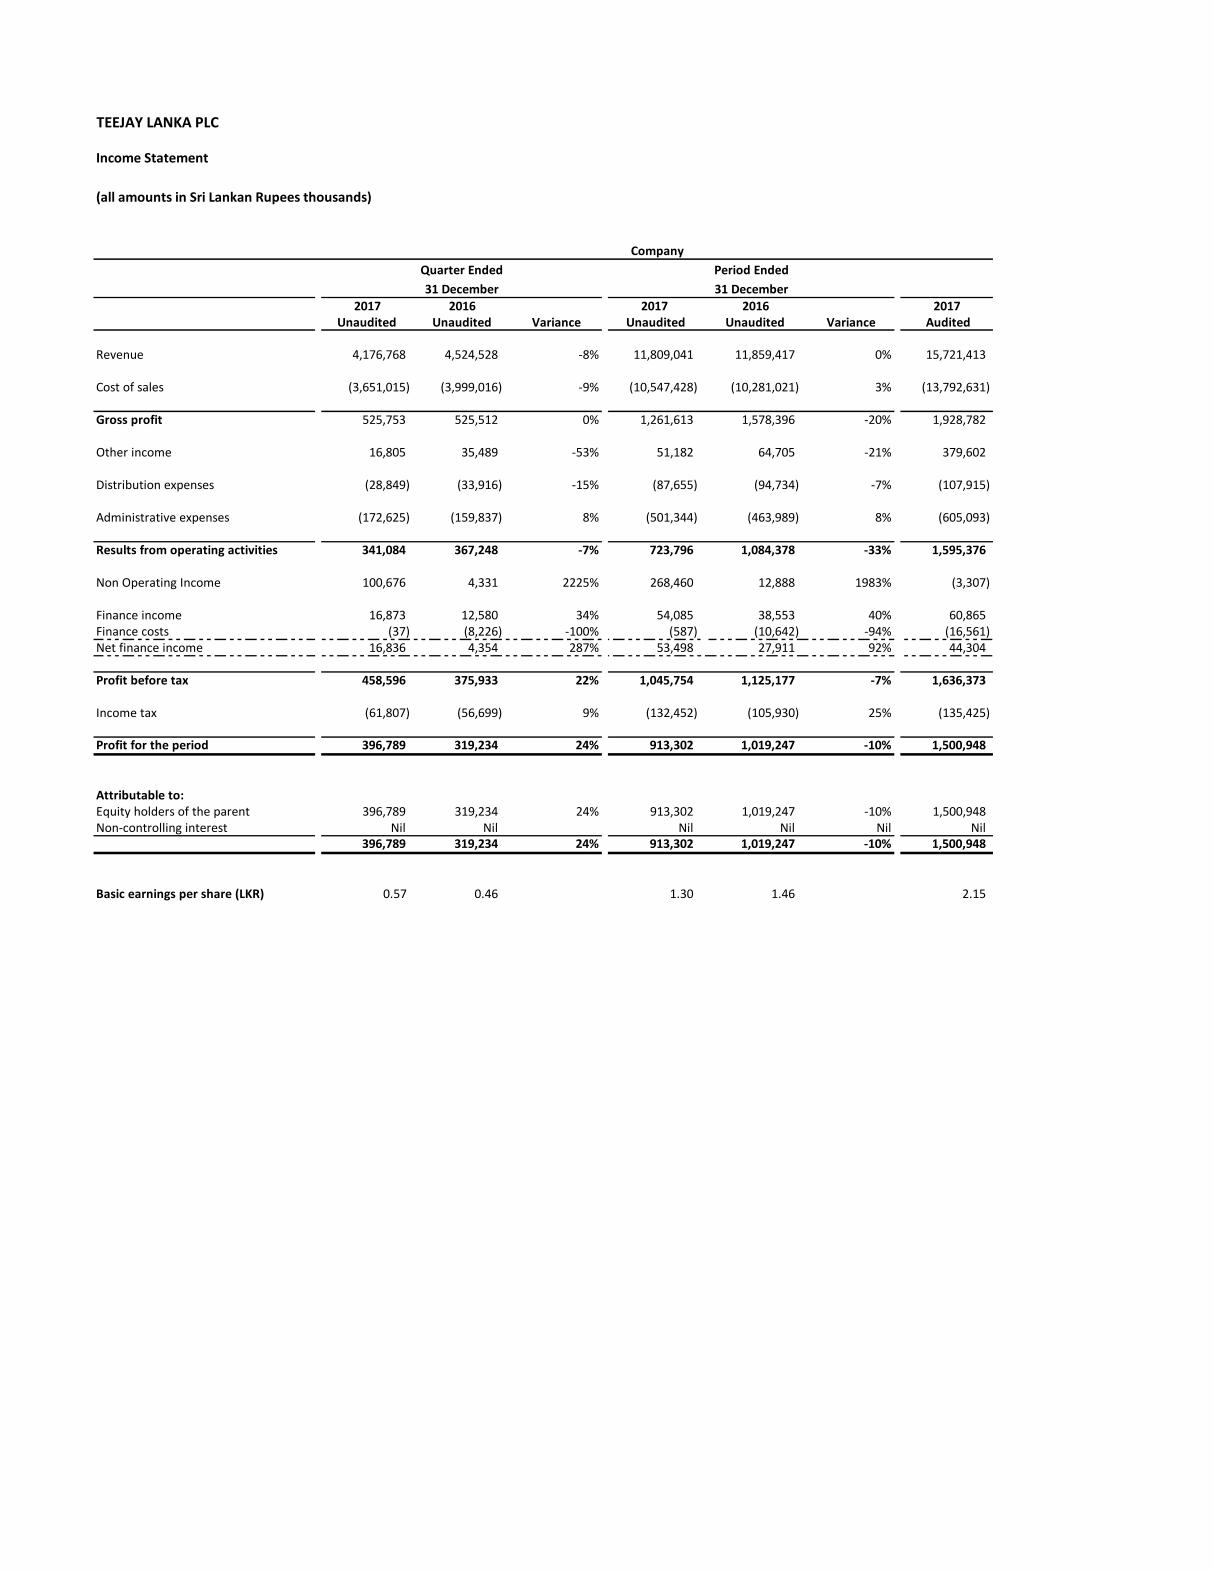
TEEJAY LANKA PLC
Income Statement
(all amounts in Sri Lankan Rupees thousands)
2017 2016 2017 2016 2017Unaudited Unaudited Variance Unaudited Unaudited Variance Audited
Revenue 4,176,768 4,524,528 -8% 11,809,041 11,859,417 0% 15,721,413
Cost of sales (3,651,015) (3,999,016) -9% (10,547,428) (10,281,021) 3% (13,792,631)
Gross profit 525,753 525,512 0% 1,261,613 1,578,396 -20% 1,928,782
Other income 16,805 35,489 -53% 51,182 64,705 -21% 379,602
Distribution expenses (28,849) (33,916) -15% (87,655) (94,734) -7% (107,915)
Administrative expenses (172,625) (159,837) 8% (501,344) (463,989) 8% (605,093)
Results from operating activities 341,084 367,248 -7% 723,796 1,084,378 -33% 1,595,376
Non Operating Income 100,676 4,331 2225% 268,460 12,888 1983% (3,307)
Finance income 16,873 12,580 34% 54,085 38,553 40% 60,865 Finance costs (37) (8,226) -100% (587) (10,642) -94% (16,561) Net finance income 16,836 4,354 287% 53,498 27,911 92% 44,304
Profit before tax 458,596 375,933 22% 1,045,754 1,125,177 -7% 1,636,373
Income tax (61,807) (56,699) 9% (132,452) (105,930) 25% (135,425)
Profit for the period 396,789 319,234 24% 913,302 1,019,247 -10% 1,500,948
Attributable to:Equity holders of the parent 396,789 319,234 24% 913,302 1,019,247 -10% 1,500,948 Non-controlling interest Nil Nil Nil Nil Nil Nil
396,789 319,234 24% 913,302 1,019,247 -10% 1,500,948
Basic earnings per share (LKR) 0.57 0.46 1.30 1.46 2.15
Period Ended
31 December
Company
Quarter Ended
31 December
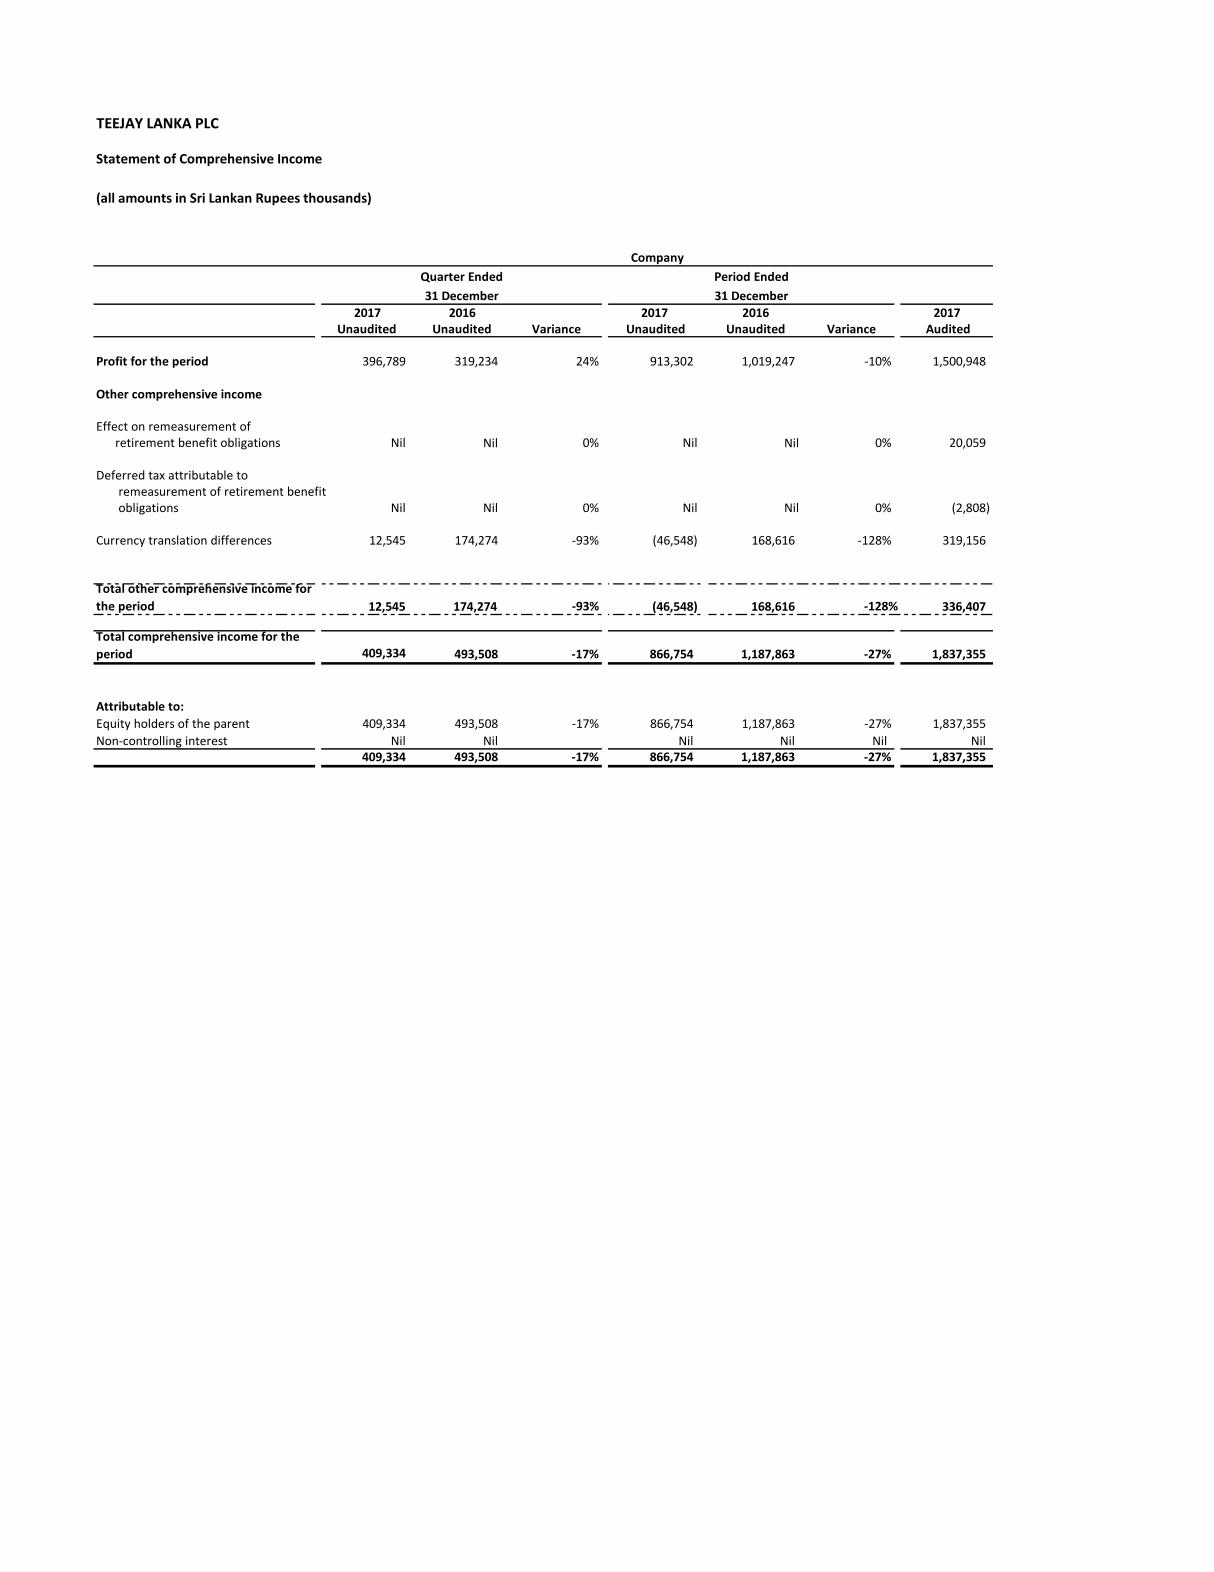
TEEJAY LANKA PLC
Statement of Comprehensive Income
(all amounts in Sri Lankan Rupees thousands)
2017 2016 2017 2016 2017Unaudited Unaudited Variance Unaudited Unaudited Variance Audited
Profit for the period 396,789 319,234 24% 913,302 1,019,247 -10% 1,500,948
Other comprehensive income
Effect on remeasurement of retirement benefit obligations Nil Nil 0% Nil Nil 0% 20,059
Deferred tax attributable to remeasurement of retirement benefit obligations Nil Nil 0% Nil Nil 0% (2,808)
Currency translation differences 12,545 174,274 -93% (46,548) 168,616 -128% 319,156
12,545 174,274 (46,548) 168,616 336,407
409,334 493,508 -17% 866,754 1,187,863 -27% 1,837,355
Attributable to:
Equity holders of the parent 409,334 493,508 -17% 866,754 1,187,863 -27% 1,837,355
Non-controlling interest Nil Nil NilNil Nil Nil Nil409,334 493,508 -17% 866,754 1,187,863 -27% 1,837,355
-93% -128%
Period Ended
31 December
Quarter Ended
31 December
Total other comprehensive income for
the period
Total comprehensive income for the
period
Company
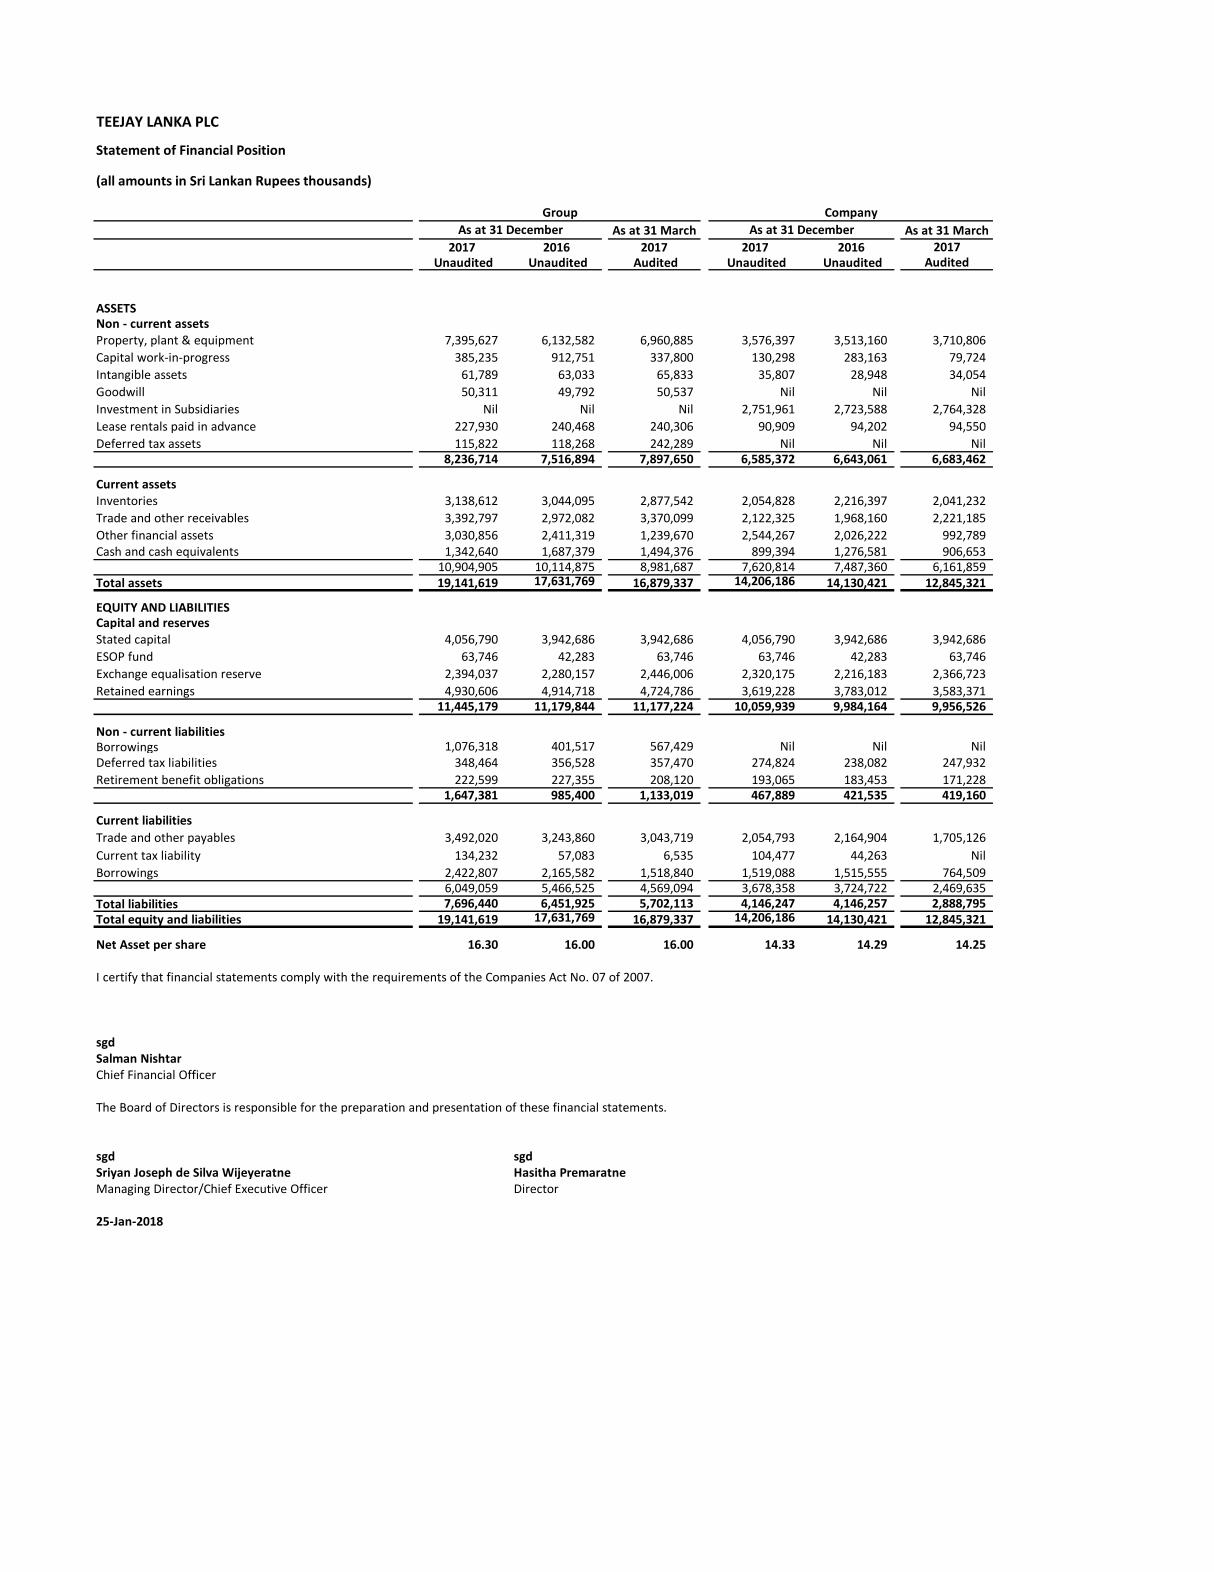
TEEJAY LANKA PLC
Statement of Financial Position
(all amounts in Sri Lankan Rupees thousands)
As at 31 March As at 31 March
2017 2016 2017 2017 2016 2017 Unaudited Unaudited Audited Unaudited Unaudited Audited
ASSETSNon - current assetsProperty, plant & equipment 7,395,627 6,132,582 6,960,885 3,576,397 3,513,160 3,710,806
Capital work-in-progress 385,235 912,751 337,800 130,298 283,163 79,724
Intangible assets 61,789 63,033 65,833 35,807 28,948 34,054
Goodwill 50,311 49,792 50,537 Nil Nil Nil
Investment in Subsidiaries Nil Nil Nil 2,751,961 2,723,588 2,764,328
Lease rentals paid in advance 227,930 240,468 240,306 90,909 94,202 94,550
Deferred tax assets 115,822 118,268 242,289 Nil Nil Nil8,236,714 7,516,894 7,897,650 6,585,372 6,643,061 6,683,462
Current assetsInventories 3,138,612 3,044,095 2,877,542 2,054,828 2,216,397 2,041,232
Trade and other receivables 3,392,797 2,972,082 3,370,099 2,122,325 1,968,160 2,221,185
Other financial assets 3,030,856 2,411,319 1,239,670 2,544,267 2,026,222 992,789 Cash and cash equivalents 1,342,640 1,687,379 1,494,376 899,394 1,276,581 906,653
10,904,905 10,114,875 8,981,687 7,620,814 7,487,360 6,161,859 Total assets 19,141,619 17,631,769 16,879,337 14,206,186 14,130,421 12,845,321
EQUITY AND LIABILITIESCapital and reservesStated capital 4,056,790 3,942,686 3,942,686 4,056,790 3,942,686 3,942,686
ESOP fund 63,746 42,283 63,746 63,746 42,283 63,746
Exchange equalisation reserve 2,394,037 2,280,157 2,446,006 2,320,175 2,216,183 2,366,723
Retained earnings 4,930,606 4,914,718 4,724,786 3,619,228 3,783,012 3,583,371 11,445,179 11,179,844 11,177,224 10,059,939 9,984,164 9,956,526
Non - current liabilitiesBorrowings 1,076,318 401,517 567,429 Nil Nil NilDeferred tax liabilities 348,464 356,528 357,470 274,824 238,082 247,932
Retirement benefit obligations 222,599 227,355 208,120 193,065 183,453 171,228 1,647,381 985,400 1,133,019 467,889 421,535 419,160
Current liabilities
Trade and other payables 3,492,020 3,243,860 3,043,719 2,054,793 2,164,904 1,705,126
Current tax liability 134,232 57,083 6,535 104,477 44,263 Nil
Borrowings 2,422,807 2,165,582 1,518,840 1,519,088 1,515,555 764,509 6,049,059 5,466,525 4,569,094 3,678,358 3,724,722 2,469,635
Total liabilities 7,696,440 6,451,925 5,702,113 4,146,247 4,146,257 2,888,795 Total equity and liabilities 19,141,619 17,631,769 16,879,337 14,206,186 14,130,421 12,845,321
Net Asset per share 16.30 16.00 16.00 14.33 14.29 14.25
I certify that financial statements comply with the requirements of the Companies Act No. 07 of 2007.
sgdSalman NishtarChief Financial Officer
The Board of Directors is responsible for the preparation and presentation of these financial statements.
sgd sgdSriyan Joseph de Silva Wijeyeratne Hasitha PremaratneManaging Director/Chief Executive Officer Director
25-Jan-2018
As at 31 December
Group Company
As at 31 December
TEEJAY LANKA PLC
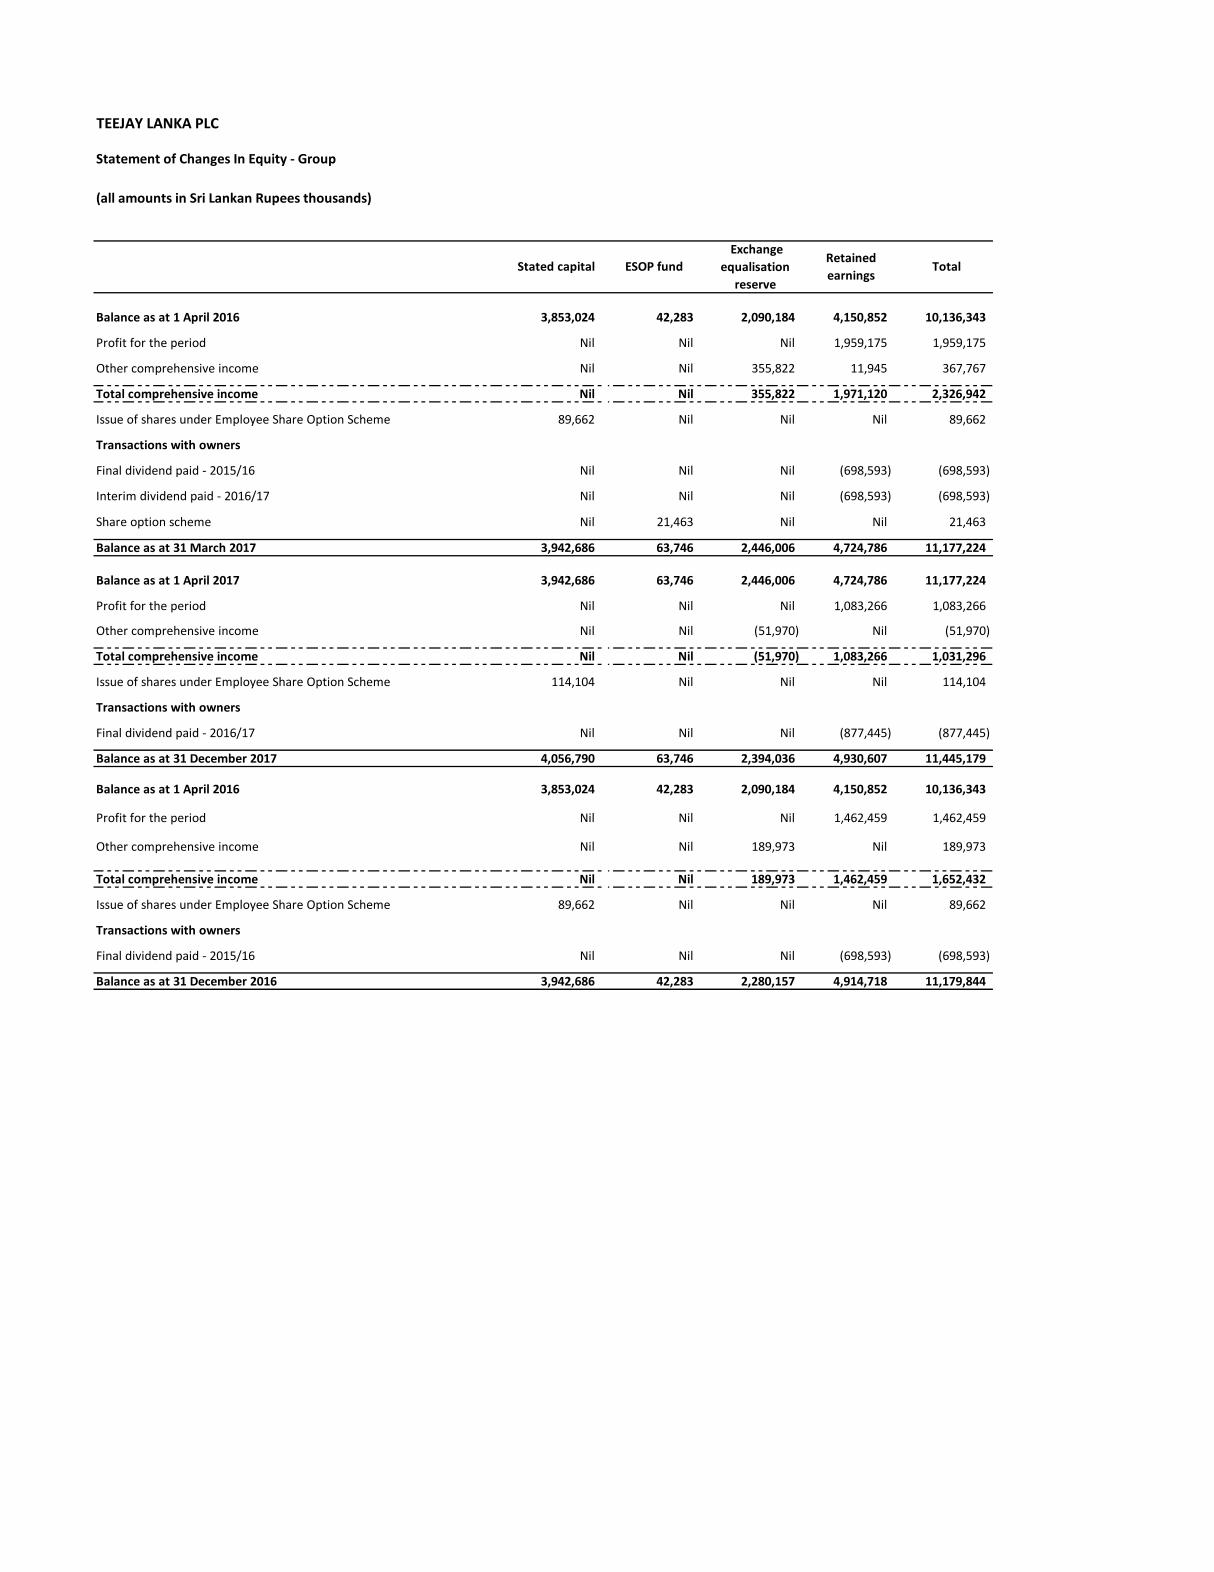
Statement of Changes In Equity - Group
(all amounts in Sri Lankan Rupees thousands)
Balance as at 1 April 2016 3,853,024 42,283 2,090,184 4,150,852 10,136,343
Profit for the period Nil Nil Nil 1,959,175 1,959,175
Other comprehensive income Nil Nil 355,822 11,945 367,767
Total comprehensive income Nil Nil 355,822 1,971,120 2,326,942
Issue of shares under Employee Share Option Scheme 89,662 Nil Nil Nil 89,662
Transactions with owners
Final dividend paid - 2015/16 Nil Nil Nil (698,593) (698,593)
Interim dividend paid - 2016/17 Nil Nil Nil (698,593) (698,593)
Share option scheme Nil 21,463 Nil Nil 21,463
Balance as at 31 March 2017 3,942,686 63,746 2,446,006 4,724,786 11,177,224
Balance as at 1 April 2017 3,942,686 63,746 2,446,006 4,724,786 11,177,224
Profit for the period Nil Nil Nil 1,083,266 1,083,266
Other comprehensive income Nil Nil (51,970) Nil (51,970)
Total comprehensive income Nil Nil (51,970) 1,083,266 1,031,296
Issue of shares under Employee Share Option Scheme 114,104 Nil Nil Nil 114,104
Transactions with owners
Final dividend paid - 2016/17 Nil Nil Nil (877,445) (877,445)
Balance as at 31 December 2017 4,056,790 63,746 2,394,036 4,930,607 11,445,179
Balance as at 1 April 2016 3,853,024 42,283 2,090,184 4,150,852 10,136,343
Profit for the period Nil Nil Nil 1,462,459 1,462,459
Other comprehensive income Nil Nil 189,973 Nil 189,973
Total comprehensive income Nil Nil 189,973 1,462,459 1,652,432
Issue of shares under Employee Share Option Scheme 89,662 Nil Nil Nil 89,662
Transactions with owners
Final dividend paid - 2015/16 Nil Nil Nil (698,593) (698,593)
Balance as at 31 December 2016 3,942,686 42,283 2,280,157 4,914,718 11,179,844
Exchange
equalisation
reserve
ESOP fund TotalStated capitalRetained
earnings
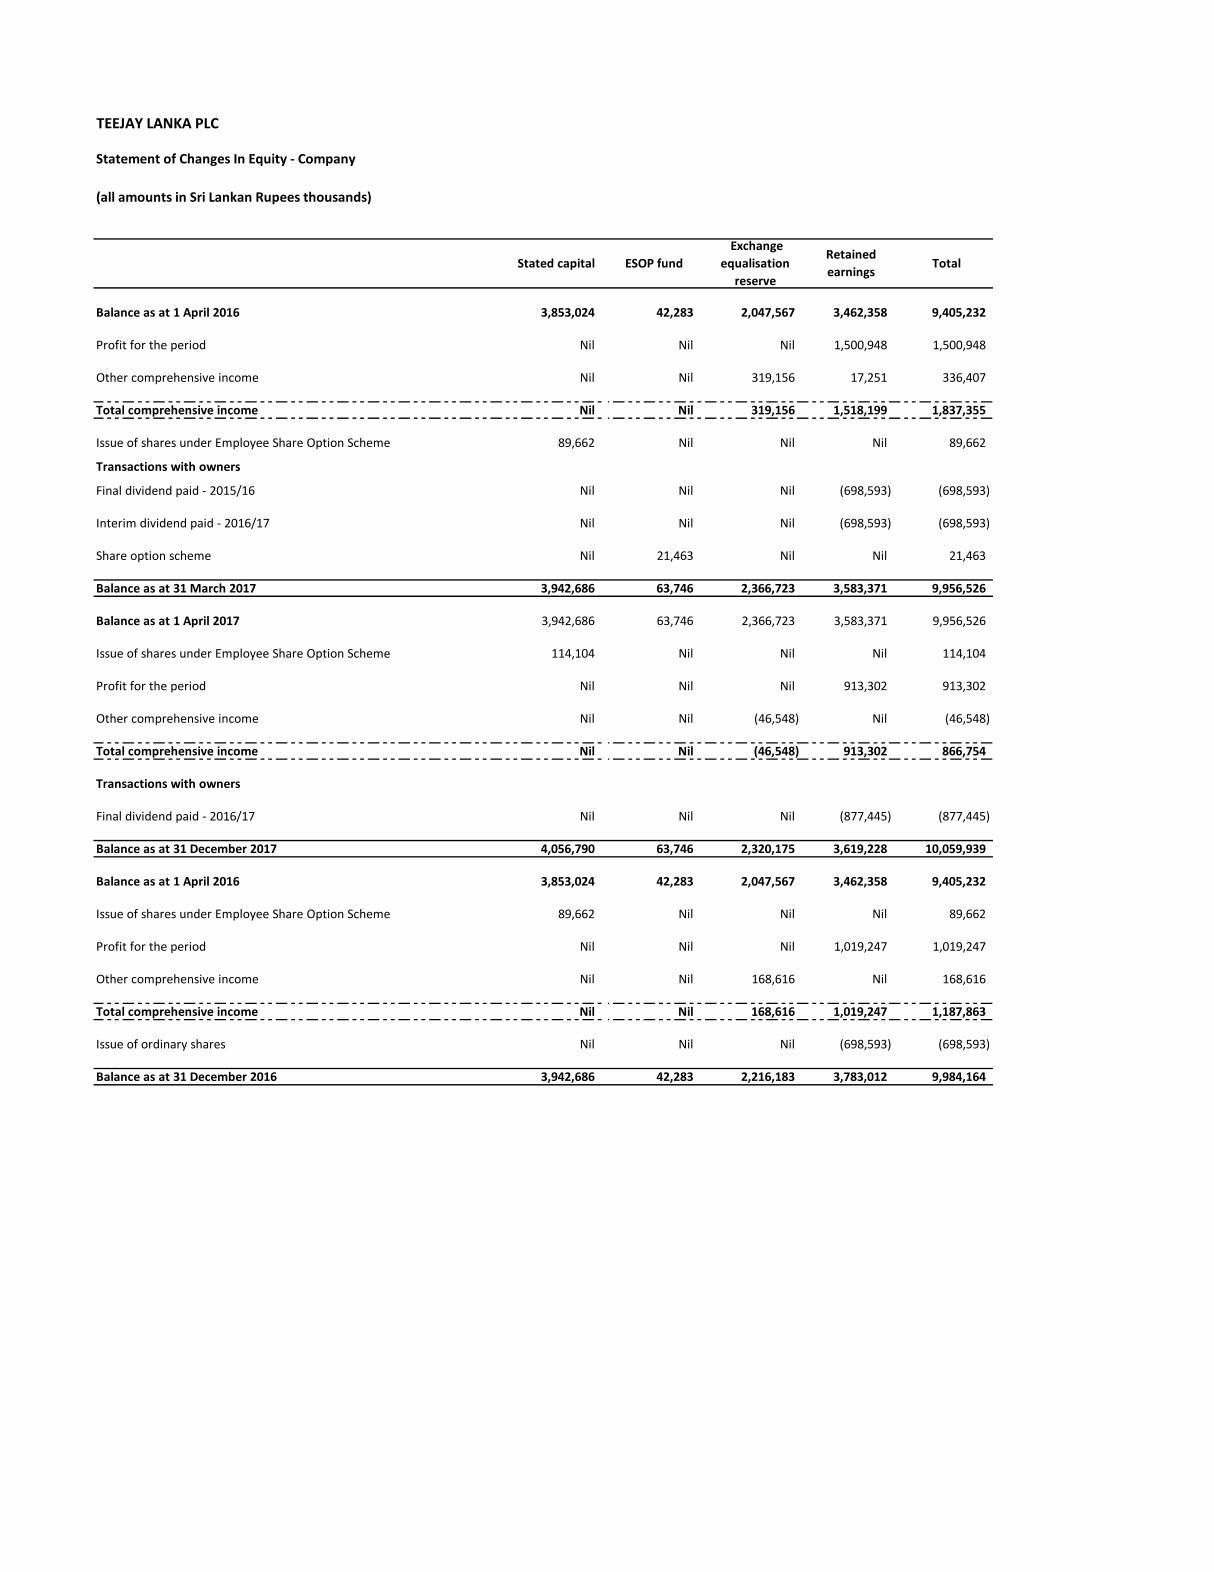
TEEJAY LANKA PLC
Statement of Changes In Equity - Company
(all amounts in Sri Lankan Rupees thousands)
Balance as at 1 April 2016 3,853,024 42,283 2,047,567 3,462,358 9,405,232
Profit for the period Nil Nil Nil 1,500,948 1,500,948
Other comprehensive income Nil Nil 319,156 17,251 336,407
Total comprehensive income Nil Nil 319,156 1,518,199 1,837,355
Issue of shares under Employee Share Option Scheme 89,662 Nil Nil Nil 89,662
Transactions with owners
Final dividend paid - 2015/16 Nil Nil Nil (698,593) (698,593)
Interim dividend paid - 2016/17 Nil Nil Nil (698,593) (698,593)
Share option scheme Nil 21,463 Nil Nil 21,463
Balance as at 31 March 2017 3,942,686 63,746 2,366,723 3,583,371 9,956,526
Balance as at 1 April 2017 3,942,686 63,746 2,366,723 3,583,371 9,956,526
Issue of shares under Employee Share Option Scheme 114,104 Nil Nil Nil 114,104
Profit for the period Nil Nil Nil 913,302 913,302
Other comprehensive income Nil Nil (46,548) Nil (46,548)
Total comprehensive income Nil Nil (46,548) 913,302 866,754
Transactions with owners
Final dividend paid - 2016/17 Nil Nil Nil (877,445) (877,445)
Balance as at 31 December 2017 4,056,790 63,746 2,320,175 3,619,228 10,059,939
Balance as at 1 April 2016 3,853,024 42,283 2,047,567 3,462,358 9,405,232
Issue of shares under Employee Share Option Scheme 89,662 Nil Nil Nil 89,662
Profit for the period Nil Nil Nil 1,019,247 1,019,247
Other comprehensive income Nil Nil 168,616 Nil 168,616
Total comprehensive income Nil Nil 168,616 1,019,247 1,187,863
Issue of ordinary shares Nil Nil Nil (698,593) (698,593)
Balance as at 31 December 2016 3,942,686 42,283 2,216,183 3,783,012 9,984,164
Stated capital ESOP fund
Exchange
equalisation
reserve
Retained
earningsTotal
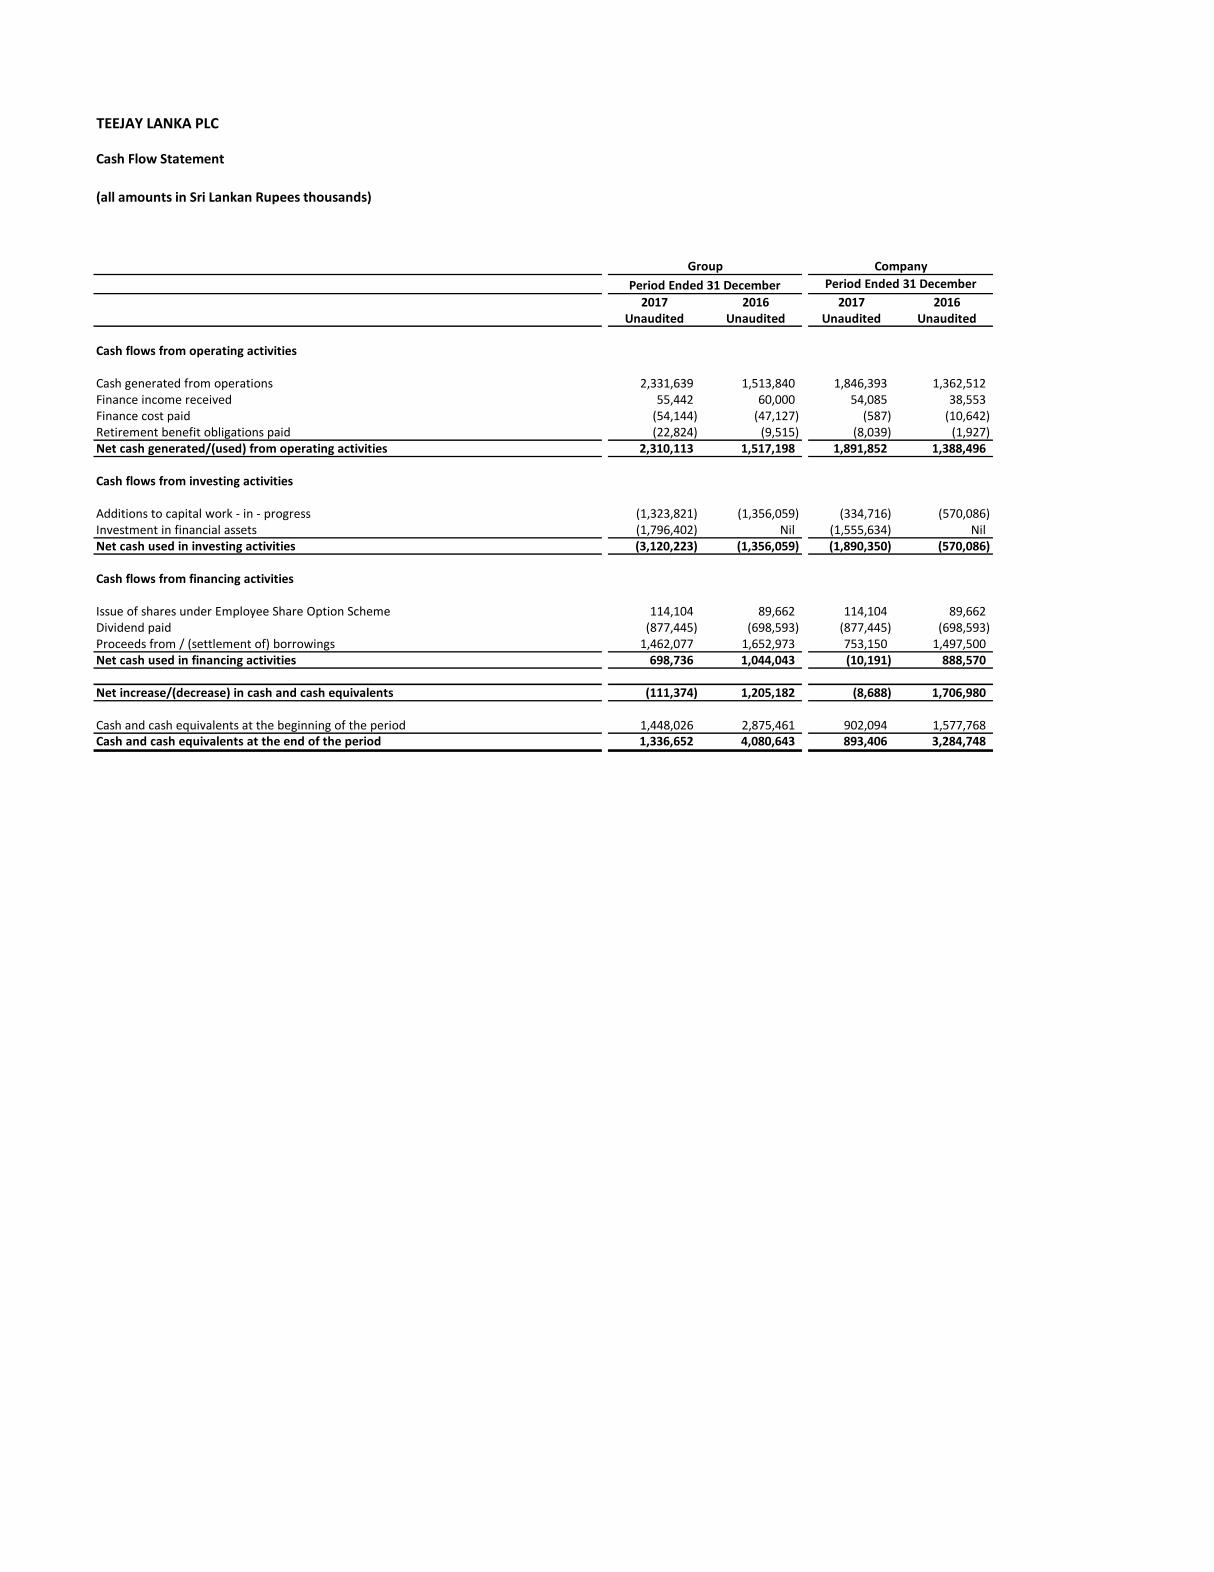
TEEJAY LANKA PLC
Cash Flow Statement
(all amounts in Sri Lankan Rupees thousands)
2017 2016 2017 2016Unaudited Unaudited Unaudited Unaudited
Cash flows from operating activities
Cash generated from operations 2,331,639 1,513,840 1,846,393 1,362,512 Finance income received 55,442 60,000 54,085 38,553 Finance cost paid (54,144) (47,127) (587) (10,642) Retirement benefit obligations paid (22,824) (9,515) (8,039) (1,927) Net cash generated/(used) from operating activities 2,310,113 1,517,198 1,891,852 1,388,496
Cash flows from investing activities
Additions to capital work - in - progress (1,323,821) (1,356,059) (334,716) (570,086) Investment in financial assets (1,796,402) Nil (1,555,634) NilNet cash used in investing activities (3,120,223) (1,356,059) (1,890,350) (570,086)
Cash flows from financing activities
Issue of shares under Employee Share Option Scheme 114,104 89,662 114,104 89,662 Dividend paid (877,445) (698,593) (877,445) (698,593) Proceeds from / (settlement of) borrowings 1,462,077 1,652,973 753,150 1,497,500 Net cash used in financing activities 698,736 1,044,043 (10,191) 888,570
Net increase/(decrease) in cash and cash equivalents (111,374) 1,205,182 (8,688) 1,706,980
Cash and cash equivalents at the beginning of the period 1,448,026 2,875,461 902,094 1,577,768 Cash and cash equivalents at the end of the period 1,336,652 4,080,643 893,406 3,284,748
Period Ended 31 DecemberPeriod Ended 31 December
CompanyGroup
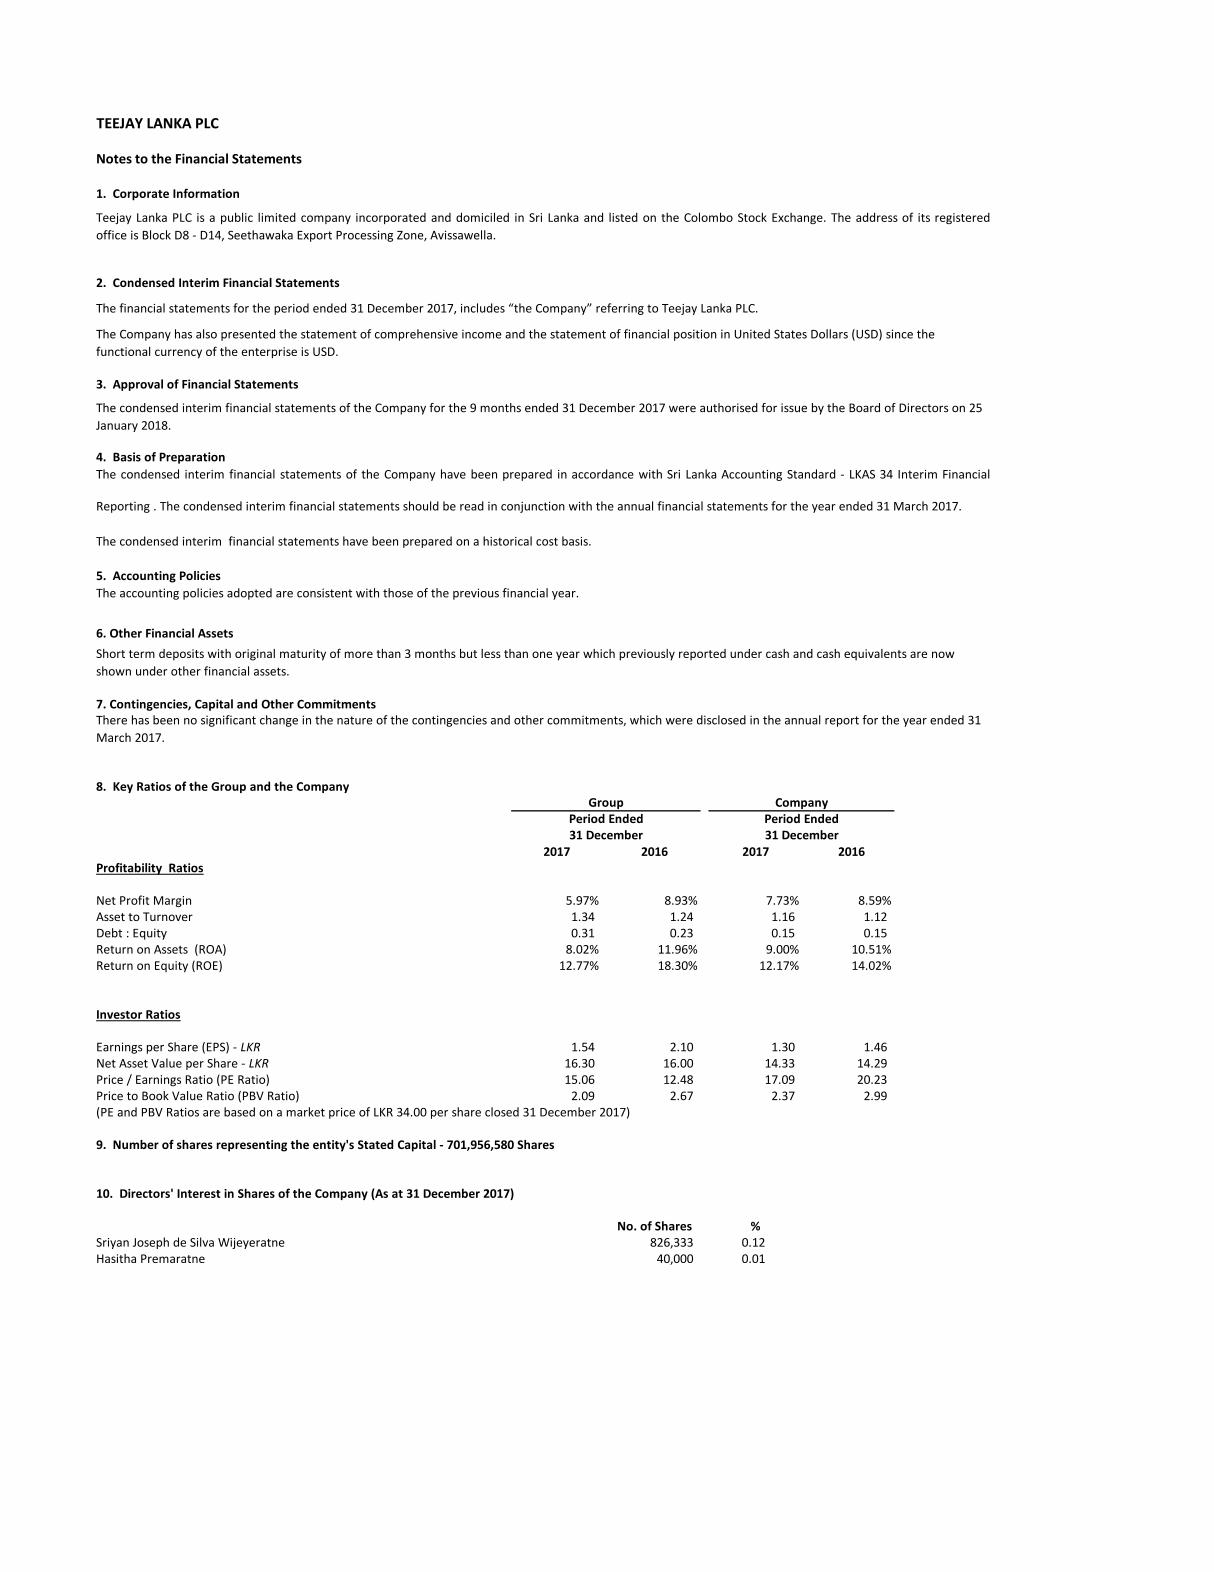
TEEJAY LANKA PLC
Notes to the Financial Statements
1. Corporate Information
2. Condensed Interim Financial Statements
3. Approval of Financial Statements
4. Basis of Preparation
5. Accounting Policies
6. Other Financial Assets
7. Contingencies, Capital and Other Commitments
8. Key Ratios of the Group and the Company
2017 2016 2017 2016Profitability Ratios
Net Profit Margin 5.97% 8.93% 7.73% 8.59%Asset to Turnover 1.34 1.24 1.16 1.12 Debt : Equity 0.31 0.23 0.15 0.15 Return on Assets (ROA) 8.02% 11.96% 9.00% 10.51%Return on Equity (ROE) 12.77% 18.30% 12.17% 14.02%
Investor Ratios
Earnings per Share (EPS) - LKR 1.54 2.10 1.30 1.46 Net Asset Value per Share - LKR 16.30 16.00 14.33 14.29 Price / Earnings Ratio (PE Ratio) 15.06 12.48 17.09 20.23 Price to Book Value Ratio (PBV Ratio) 2.09 2.67 2.37 2.99 (PE and PBV Ratios are based on a market price of LKR 34.00 per share closed 31 December 2017)
9. Number of shares representing the entity's Stated Capital - 701,956,580 Shares
10. Directors' Interest in Shares of the Company (As at 31 December 2017)
No. of Shares %Sriyan Joseph de Silva Wijeyeratne 826,333 0.12Hasitha Premaratne 40,000 0.01
GroupPeriod Ended31 December
Company
Teejay Lanka PLC is a public limited company incorporated and domiciled in Sri Lanka and listed on the Colombo Stock Exchange. The address of its registered
office is Block D8 - D14, Seethawaka Export Processing Zone, Avissawella.
The financial statements for the period ended 31 December 2017, includes “the Company” referring to Teejay Lanka PLC.
The condensed interim financial statements of the Company have been prepared in accordance with Sri Lanka Accounting Standard - LKAS 34 Interim Financial
Reporting . The condensed interim financial statements should be read in conjunction with the annual financial statements for the year ended 31 March 2017.
Period Ended31 December
The accounting policies adopted are consistent with those of the previous financial year.
There has been no significant change in the nature of the contingencies and other commitments, which were disclosed in the annual report for the year ended 31
March 2017.
Short term deposits with original maturity of more than 3 months but less than one year which previously reported under cash and cash equivalents are now
shown under other financial assets.
The condensed interim financial statements have been prepared on a historical cost basis.
The Company has also presented the statement of comprehensive income and the statement of financial position in United States Dollars (USD) since the
functional currency of the enterprise is USD.
The condensed interim financial statements of the Company for the 9 months ended 31 December 2017 were authorised for issue by the Board of Directors on 25
January 2018.
TEEJAY LANKA PLC
Notes to the Financial Statements
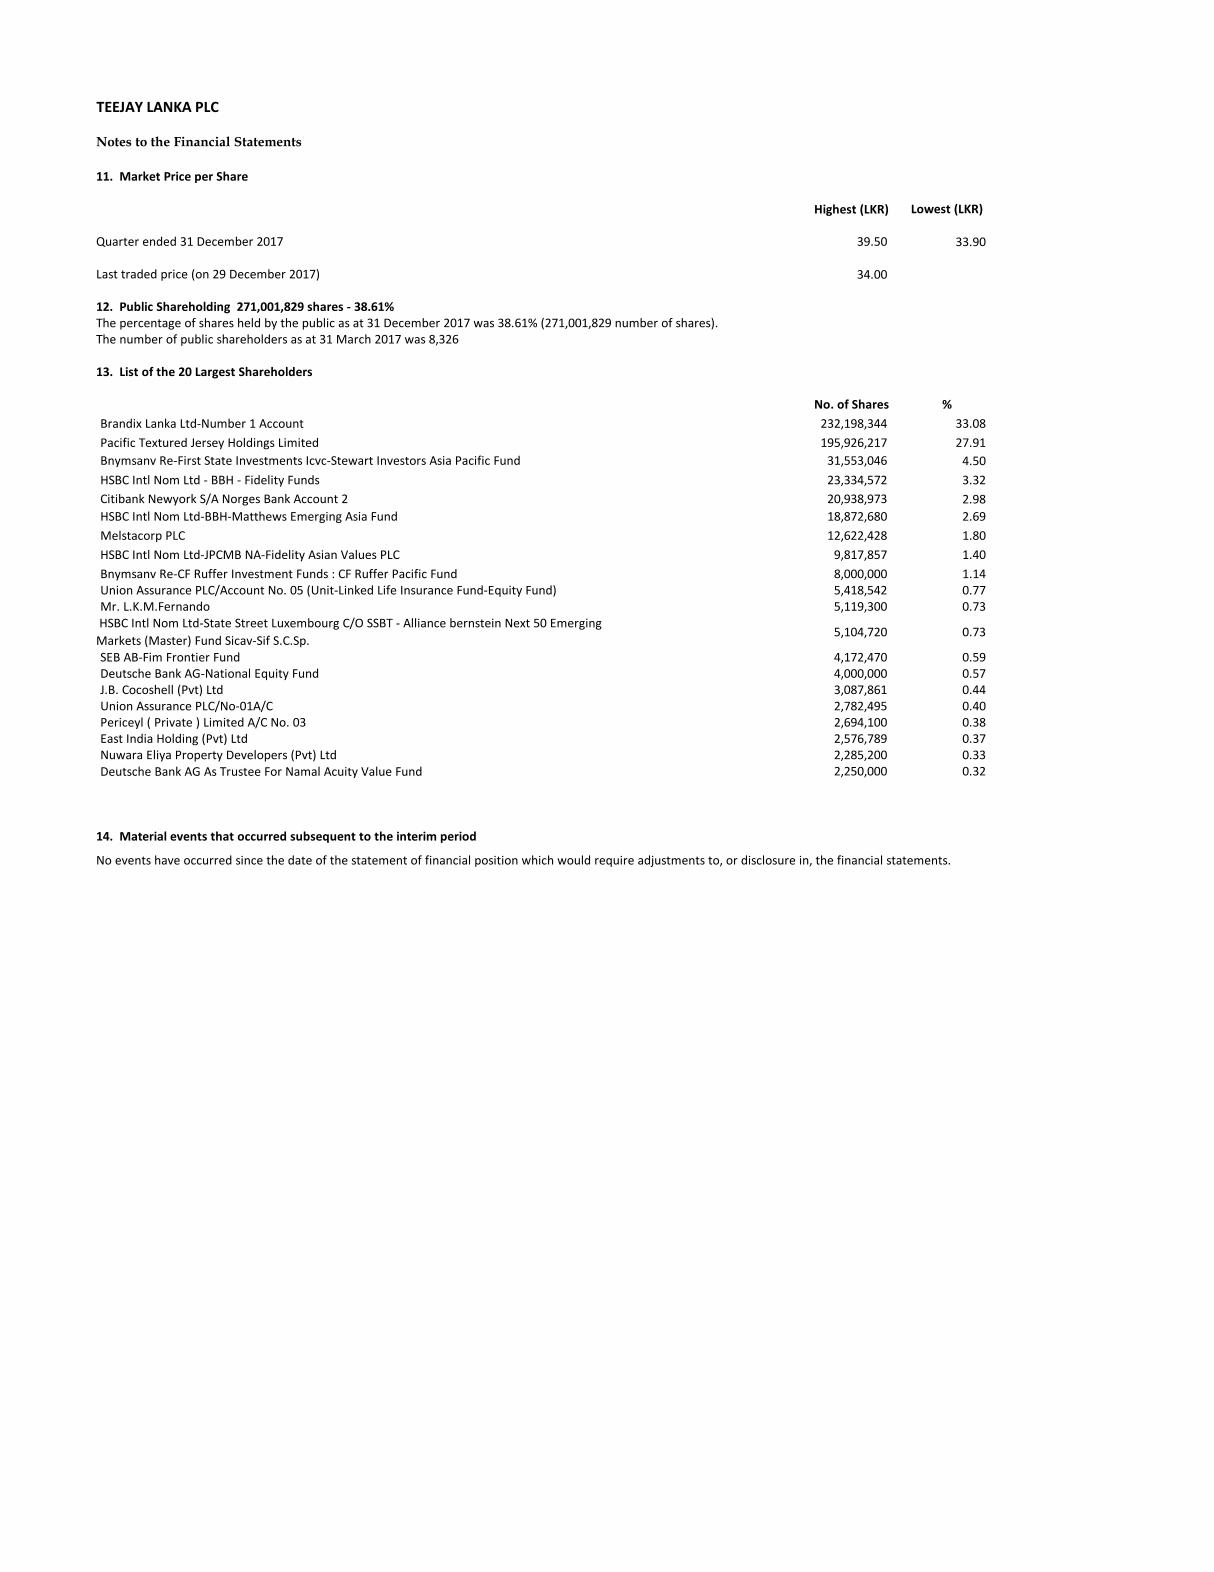
11. Market Price per Share
Highest (LKR) Lowest (LKR)
Quarter ended 31 December 2017 39.50 33.90
Last traded price (on 29 December 2017) 34.00
12. Public Shareholding 271,001,829 shares - 38.61%The percentage of shares held by the public as at 31 December 2017 was 38.61% (271,001,829 number of shares).The number of public shareholders as at 31 March 2017 was 8,326
13. List of the 20 Largest Shareholders
No. of Shares %
Brandix Lanka Ltd-Number 1 Account 232,198,344 33.08
Pacific Textured Jersey Holdings Limited 195,926,217 27.91
Bnymsanv Re-First State Investments Icvc-Stewart Investors Asia Pacific Fund 31,553,046 4.50
HSBC Intl Nom Ltd - BBH - Fidelity Funds 23,334,572 3.32
Citibank Newyork S/A Norges Bank Account 2 20,938,973 2.98
HSBC Intl Nom Ltd-BBH-Matthews Emerging Asia Fund 18,872,680 2.69
Melstacorp PLC 12,622,428 1.80
HSBC Intl Nom Ltd-JPCMB NA-Fidelity Asian Values PLC 9,817,857 1.40
Bnymsanv Re-CF Ruffer Investment Funds : CF Ruffer Pacific Fund 8,000,000 1.14 Union Assurance PLC/Account No. 05 (Unit-Linked Life Insurance Fund-Equity Fund) 5,418,542 0.77 Mr. L.K.M.Fernando 5,119,300 0.73
5,104,720 0.73
SEB AB-Fim Frontier Fund 4,172,470 0.59 Deutsche Bank AG-National Equity Fund 4,000,000 0.57 J.B. Cocoshell (Pvt) Ltd 3,087,861 0.44 Union Assurance PLC/No-01A/C 2,782,495 0.40 Periceyl ( Private ) Limited A/C No. 03 2,694,100 0.38 East India Holding (Pvt) Ltd 2,576,789 0.37 Nuwara Eliya Property Developers (Pvt) Ltd 2,285,200 0.33 Deutsche Bank AG As Trustee For Namal Acuity Value Fund 2,250,000 0.32
14. Material events that occurred subsequent to the interim period
No events have occurred since the date of the statement of financial position which would require adjustments to, or disclosure in, the financial statements.
HSBC Intl Nom Ltd-State Street Luxembourg C/O SSBT - Alliance bernstein Next 50 Emerging
Markets (Master) Fund Sicav-Sif S.C.Sp.
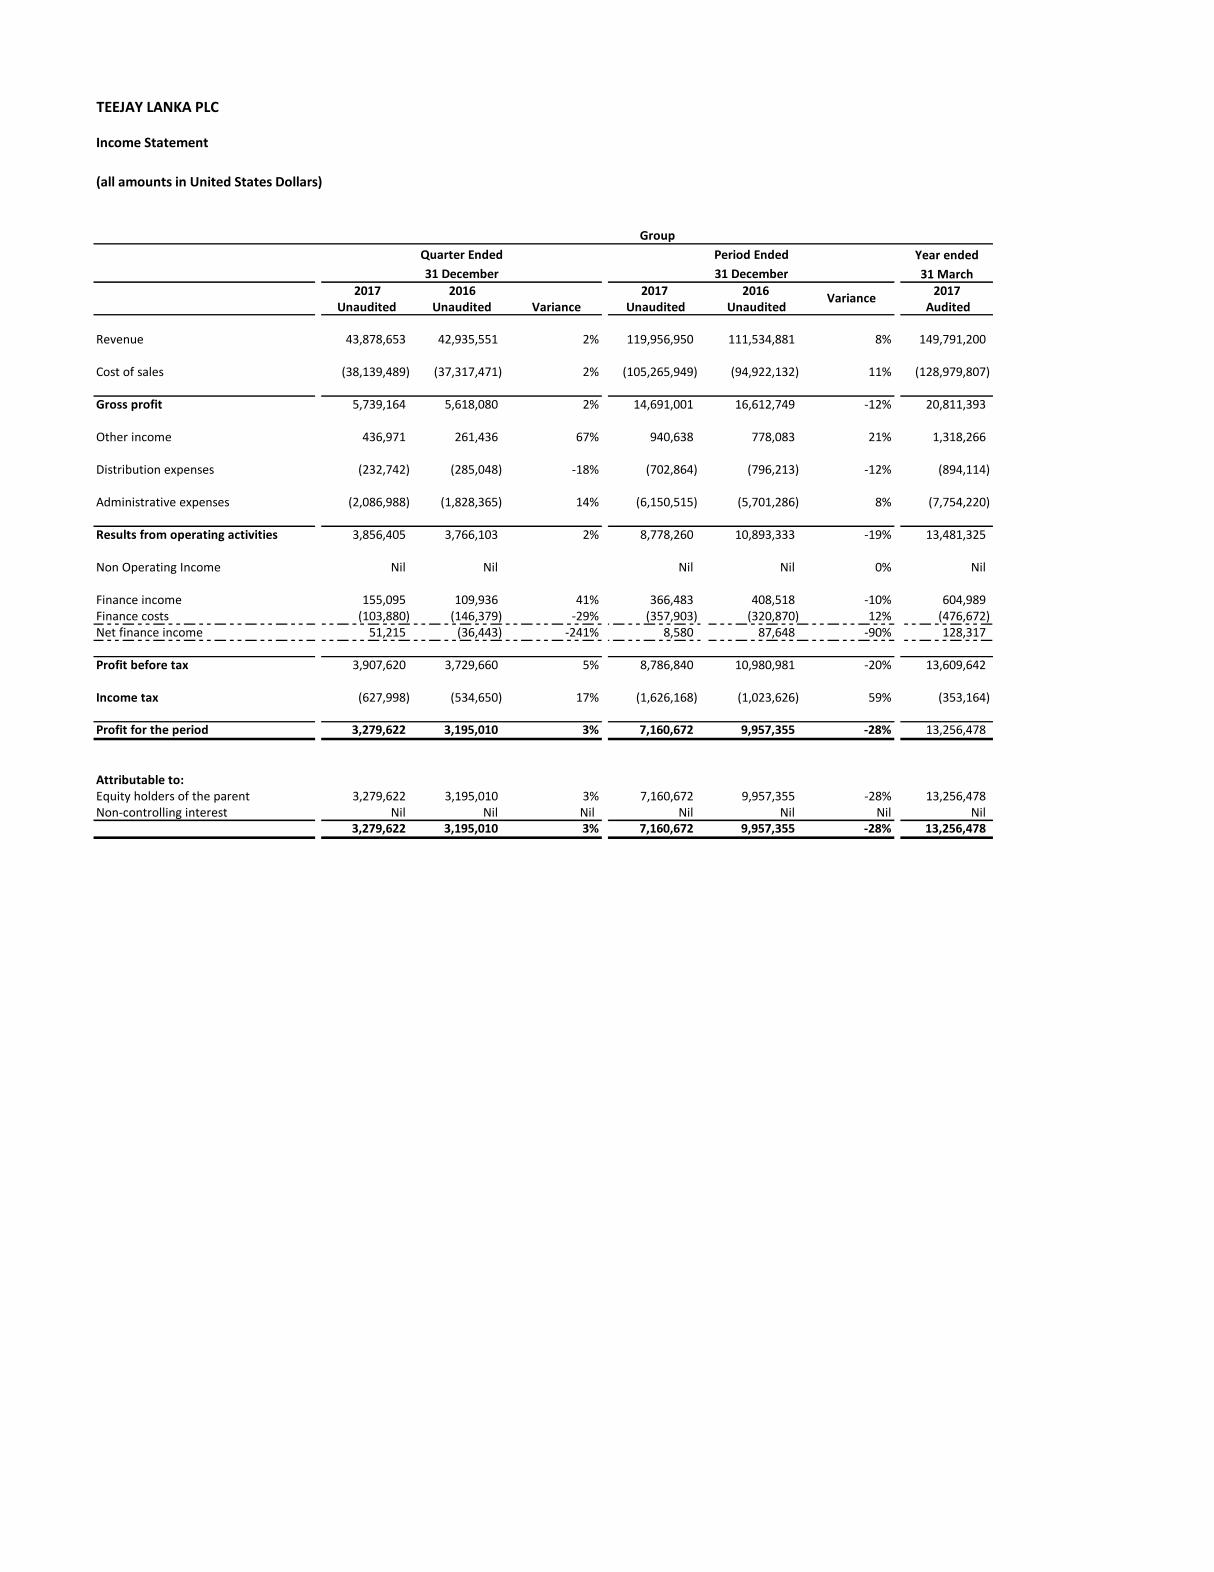
TEEJAY LANKA PLC
Income Statement
(all amounts in United States Dollars)
Year ended
31 March2017 2016 2017 2016 2017
Unaudited Unaudited Variance Unaudited Unaudited Audited
Revenue 43,878,653 42,935,551 2% 119,956,950 111,534,881 8% 149,791,200
Cost of sales (38,139,489) (37,317,471) 2% (105,265,949) (94,922,132) 11% (128,979,807)
Gross profit 5,739,164 5,618,080 2% 14,691,001 16,612,749 -12% 20,811,393
Other income 436,971 261,436 67% 940,638 778,083 21% 1,318,266
Distribution expenses (232,742) (285,048) -18% (702,864) (796,213) -12% (894,114)
Administrative expenses (2,086,988) (1,828,365) 14% (6,150,515) (5,701,286) 8% (7,754,220)
Results from operating activities 3,856,405 3,766,103 2% 8,778,260 10,893,333 -19% 13,481,325
Non Operating Income Nil Nil Nil Nil 0% Nil
Finance income 155,095 109,936 41% 366,483 408,518 -10% 604,989 Finance costs (103,880) (146,379) -29% (357,903) (320,870) 12% (476,672) Net finance income 51,215 (36,443) -241% 8,580 87,648 -90% 128,317
Profit before tax 3,907,620 3,729,660 5% 8,786,840 10,980,981 -20% 13,609,642
Income tax (627,998) (534,650) 17% (1,626,168) (1,023,626) 59% (353,164)
Profit for the period 3,279,622 3,195,010 3% 7,160,672 9,957,355 -28% 13,256,478
Attributable to:Equity holders of the parent 3,279,622 3,195,010 3% 7,160,672 9,957,355 -28% 13,256,478 Non-controlling interest Nil Nil Nil Nil Nil Nil Nil
3,279,622 3,195,010 3% 7,160,672 9,957,355 -28% 13,256,478
Group
Quarter Ended
31 December
Variance
31 December
Period Ended
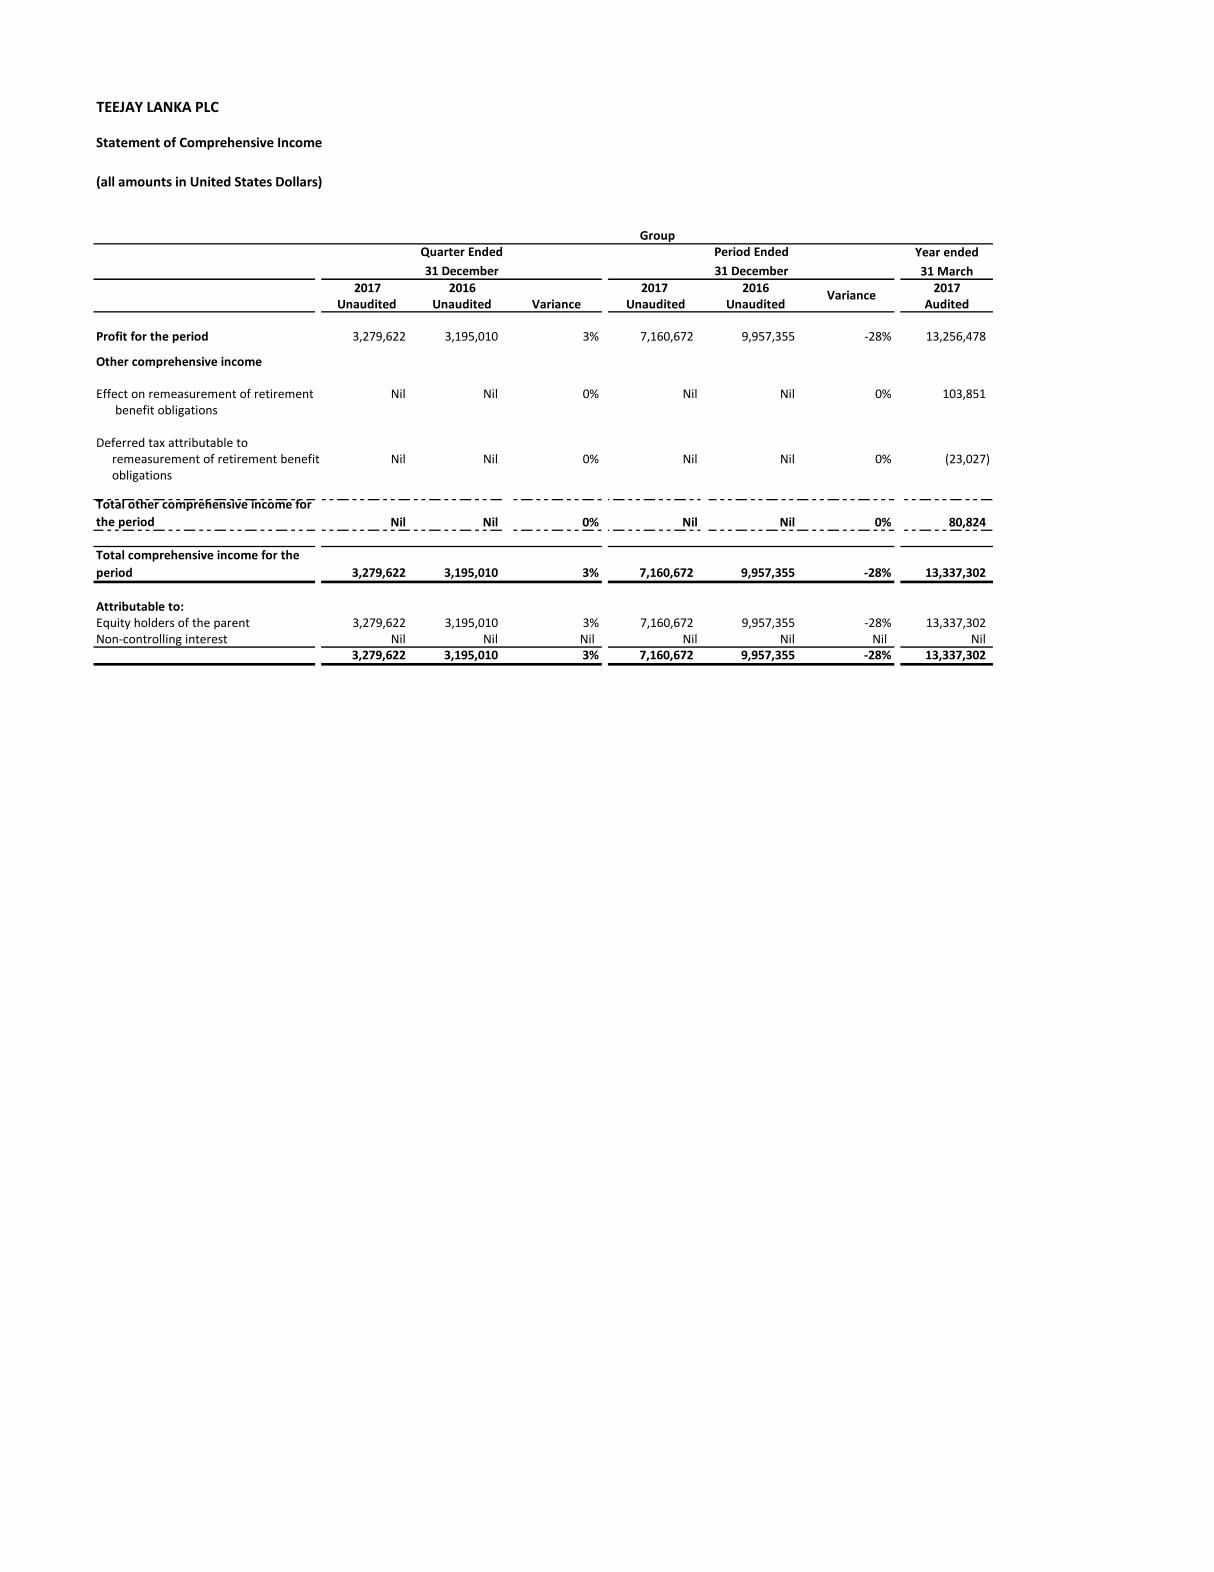
TEEJAY LANKA PLC
Statement of Comprehensive Income
(all amounts in United States Dollars)
Year ended
31 March2017 2016 2017 2016 2017
Unaudited Unaudited Variance Unaudited Unaudited Audited
Profit for the period 3,279,622 3,195,010 3% 7,160,672 9,957,355 -28% 13,256,478
Other comprehensive income
Effect on remeasurement of retirement Nil Nil 0% Nil Nil 0% 103,851 benefit obligations
Deferred tax attributable to remeasurement of retirement benefit Nil Nil 0% Nil Nil 0% (23,027) obligations
Nil Nil 0% Nil Nil 0% 80,824
3,279,622 3,195,010 3% 7,160,672 9,957,355 -28% 13,337,302
Attributable to:Equity holders of the parent 3,279,622 3,195,010 3% 7,160,672 9,957,355 -28% 13,337,302 Non-controlling interest Nil Nil Nil Nil NilNil NilNil Nil
3,279,622 3,195,010 3% 7,160,672 9,957,355 -28% 13,337,302
Period Ended
31 December
Variance
Quarter Ended
31 December
Group
Total comprehensive income for the
period
Total other comprehensive income for
the period
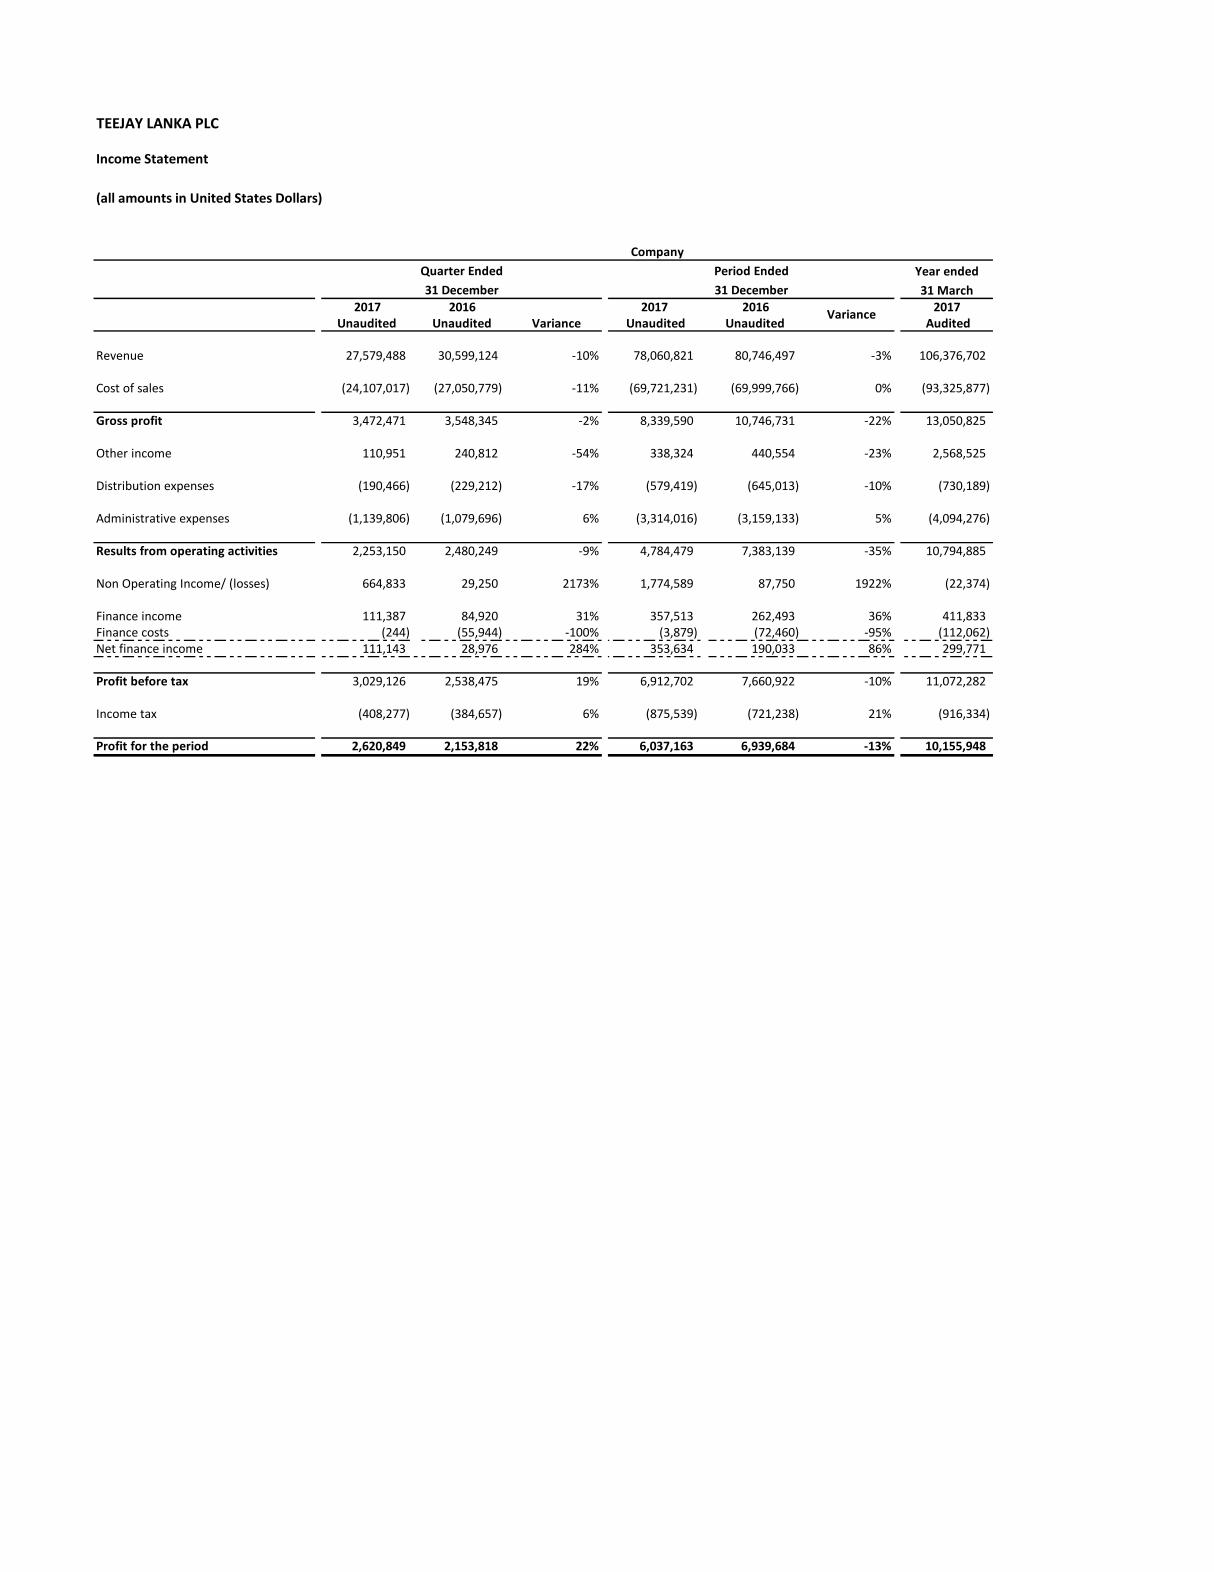
TEEJAY LANKA PLC
Income Statement
(all amounts in United States Dollars)
Year ended
31 March2017 2016 2017 2016 2017
Unaudited Unaudited Variance Unaudited Unaudited Audited
Revenue 27,579,488 30,599,124 -10% 78,060,821 80,746,497 -3% 106,376,702
Cost of sales (24,107,017) (27,050,779) -11% (69,721,231) (69,999,766) 0% (93,325,877)
Gross profit 3,472,471 3,548,345 -2% 8,339,590 10,746,731 -22% 13,050,825
Other income 110,951 240,812 -54% 338,324 440,554 -23% 2,568,525
Distribution expenses (190,466) (229,212) -17% (579,419) (645,013) -10% (730,189)
Administrative expenses (1,139,806) (1,079,696) 6% (3,314,016) (3,159,133) 5% (4,094,276)
Results from operating activities 2,253,150 2,480,249 -9% 4,784,479 7,383,139 -35% 10,794,885
Non Operating Income/ (losses) 664,833 29,250 2173% 1,774,589 87,750 1922% (22,374)
Finance income 111,387 84,920 31% 357,513 262,493 36% 411,833 Finance costs (244) (55,944) -100% (3,879) (72,460) -95% (112,062) Net finance income 111,143 28,976 284% 353,634 190,033 86% 299,771
Profit before tax 3,029,126 2,538,475 19% 6,912,702 7,660,922 -10% 11,072,282
Income tax (408,277) (384,657) 6% (875,539) (721,238) 21% (916,334)
Profit for the period 2,620,849 2,153,818 22% 6,037,163 6,939,684 -13% 10,155,948
Period Ended
31 December
Variance
Quarter Ended
31 December
Company
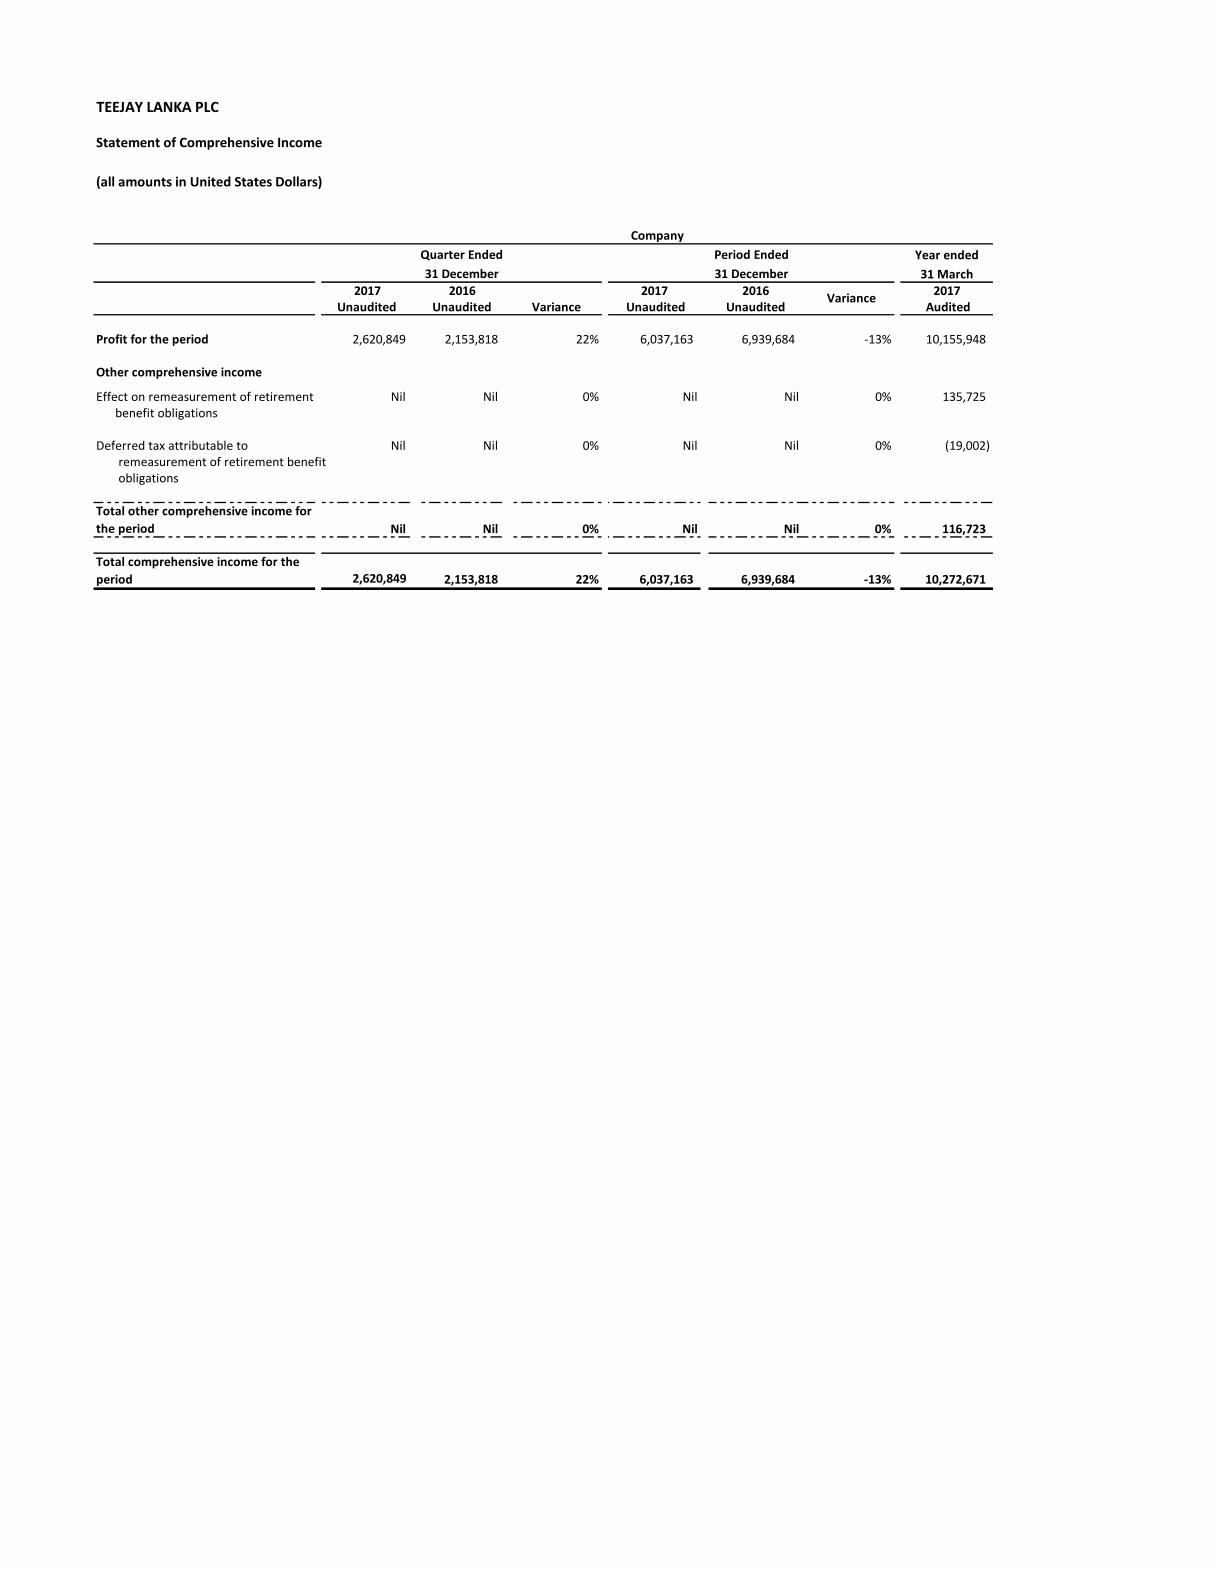
TEEJAY LANKA PLC
Statement of Comprehensive Income
(all amounts in United States Dollars)
Year ended
31 March2017 2016 2017 2016 2017
Unaudited Unaudited Variance Unaudited Unaudited Audited
Profit for the period 2,620,849 2,153,818 22% 6,037,163 6,939,684 -13% 10,155,948
Other comprehensive income
Effect on remeasurement of retirement Nil Nil 0% Nil Nil 0% 135,725 benefit obligations
Deferred tax attributable to Nil Nil 0% Nil Nil 0% (19,002) remeasurement of retirement benefit obligations
Nil Nil 0% Nil Nil 0% 116,723
2,620,849 2,153,818 22% 6,037,163 6,939,684 -13% 10,272,671
Period Ended
31 December
Quarter Ended
Company
Total comprehensive income for the
period
Total other comprehensive income for
the period
31 December
Variance
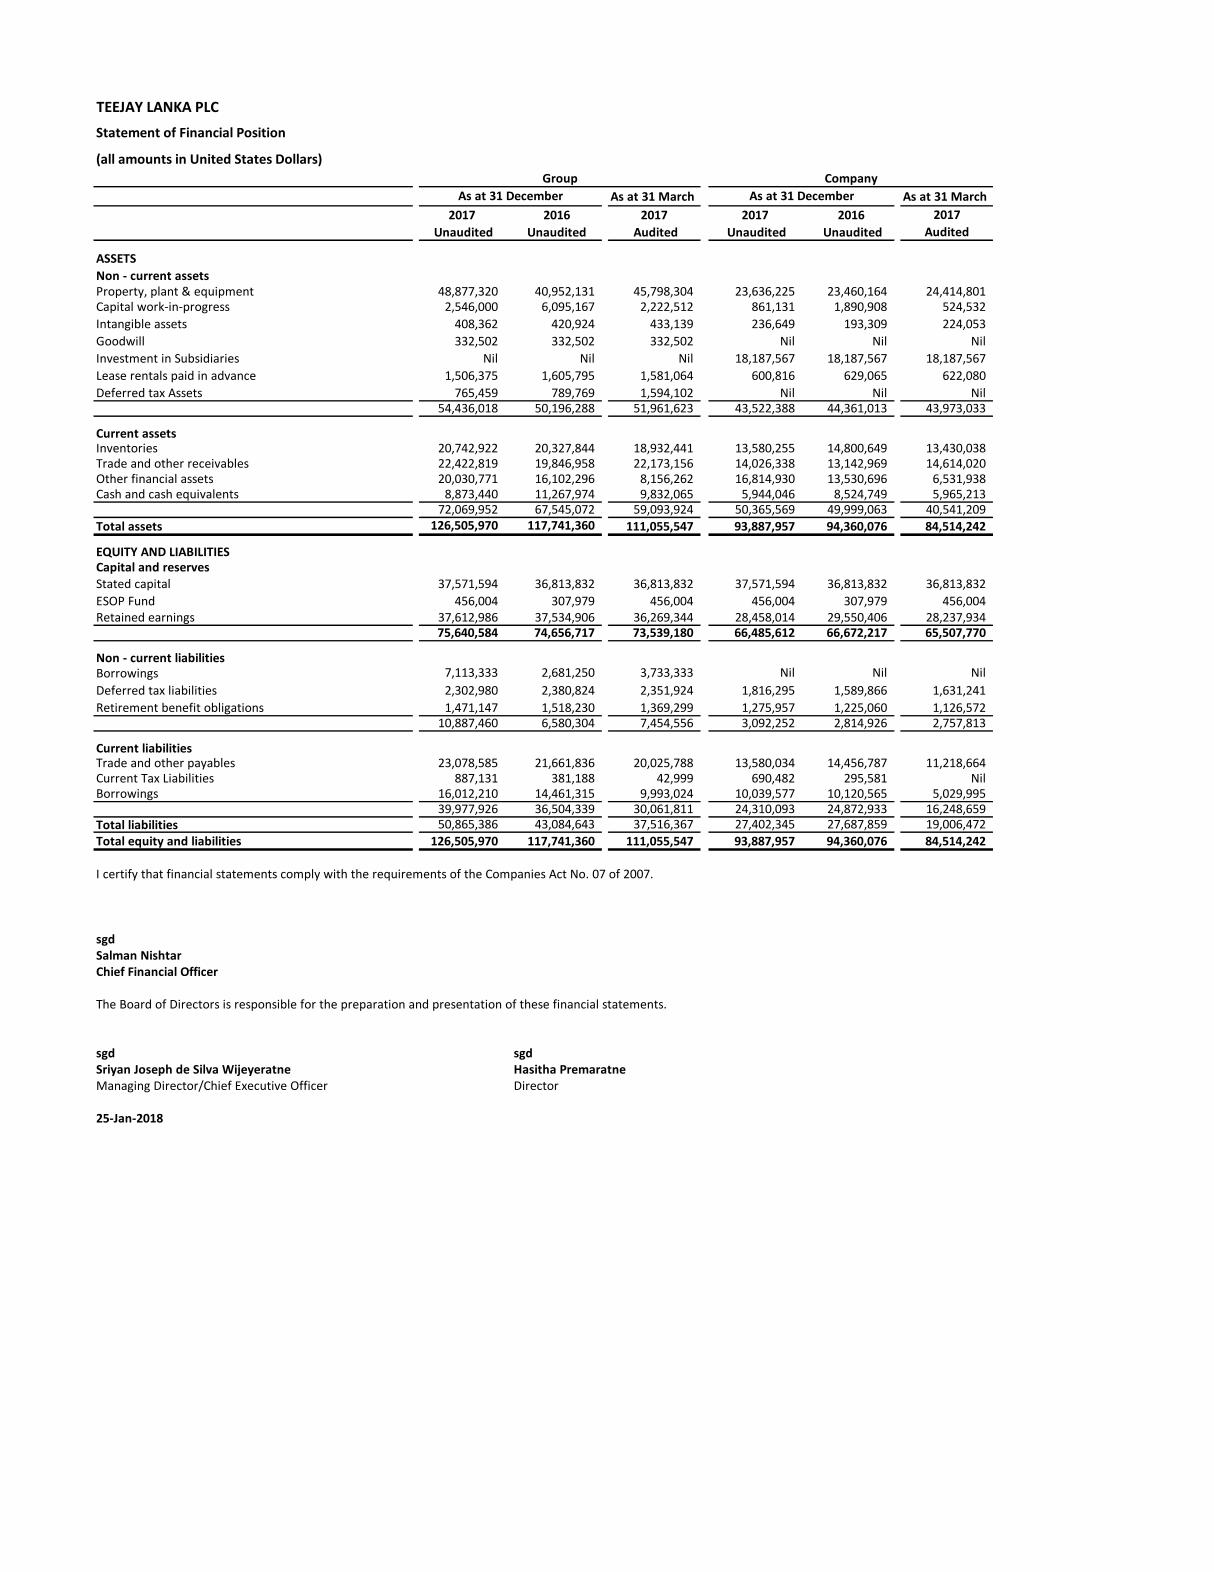
TEEJAY LANKA PLC
Statement of Financial Position
(all amounts in United States Dollars)
As at 31 March As at 31 March
2017 2016 2017 2017 2016 2017
Unaudited Unaudited Audited Unaudited Unaudited Audited
ASSETS
Non - current assetsProperty, plant & equipment 48,877,320 40,952,131 45,798,304 23,636,225 23,460,164 24,414,801 Capital work-in-progress 2,546,000 6,095,167 2,222,512 861,131 1,890,908 524,532
Intangible assets 408,362 420,924 433,139 236,649 193,309 224,053
Goodwill 332,502 332,502 332,502 Nil Nil Nil
Investment in Subsidiaries Nil Nil Nil 18,187,567 18,187,567 18,187,567
Lease rentals paid in advance 1,506,375 1,605,795 1,581,064 600,816 629,065 622,080
Deferred tax Assets 765,459 789,769 1,594,102 Nil Nil Nil54,436,018 50,196,288 51,961,623 43,522,388 44,361,013 43,973,033
Current assetsInventories 20,742,922 20,327,844 18,932,441 13,580,255 14,800,649 13,430,038 Trade and other receivables 22,422,819 19,846,958 22,173,156 14,026,338 13,142,969 14,614,020 Other financial assets 20,030,771 16,102,296 8,156,262 16,814,930 13,530,696 6,531,938 Cash and cash equivalents 8,873,440 11,267,974 9,832,065 5,944,046 8,524,749 5,965,213
72,069,952 67,545,072 59,093,924 50,365,569 49,999,063 40,541,209
Total assets 126,505,970 117,741,360 111,055,547 93,887,957 94,360,076 84,514,242
EQUITY AND LIABILITIESCapital and reservesStated capital 37,571,594 36,813,832 36,813,832 37,571,594 36,813,832 36,813,832
ESOP Fund 456,004 307,979 456,004 456,004 307,979 456,004 Retained earnings 37,612,986 37,534,906 36,269,344 28,458,014 29,550,406 28,237,934
75,640,584 74,656,717 73,539,180 66,485,612 66,672,217 65,507,770
Non - current liabilitiesBorrowings 7,113,333 2,681,250 3,733,333 Nil Nil Nil
Deferred tax liabilities 2,302,980 2,380,824 2,351,924 1,816,295 1,589,866 1,631,241
Retirement benefit obligations 1,471,147 1,518,230 1,369,299 1,275,957 1,225,060 1,126,572 10,887,460 6,580,304 7,454,556 3,092,252 2,814,926 2,757,813
Current liabilitiesTrade and other payables 23,078,585 21,661,836 20,025,788 13,580,034 14,456,787 11,218,664 Current Tax Liabilities 887,131 381,188 42,999 690,482 295,581 NilBorrowings 16,012,210 14,461,315 9,993,024 10,039,577 10,120,565 5,029,995
39,977,926 36,504,339 30,061,811 24,310,093 24,872,933 16,248,659 Total liabilities 50,865,386 43,084,643 37,516,367 27,402,345 27,687,859 19,006,472
Total equity and liabilities 126,505,970 117,741,360 111,055,547 93,887,957 94,360,076 84,514,242
I certify that financial statements comply with the requirements of the Companies Act No. 07 of 2007.
sgdSalman NishtarChief Financial Officer
The Board of Directors is responsible for the preparation and presentation of these financial statements.
sgd sgdSriyan Joseph de Silva Wijeyeratne Hasitha PremaratneManaging Director/Chief Executive Officer Director
25-Jan-2018
Company
As at 31 December
Group
As at 31 December