Embed Size (px)
Citation preview

TEKLA WORLDHEALTHCARE FUND
Semiannual ReportMarch 31, 2017
(Unaudited)
Merrill Corp - Tekla World Healthcare Fund Semi-Annual Report [Funds] 333-202638 03-31-2017 ED [AUX] | bjasper | 23-May-17 12:12 | 17-11963-1.aa | Sequence: 1CHKSUM Content: 32882 Layout: 5804 Graphics: 61909 CLEAN
JOB: 17-11963-1 CYCLE#;BL#: 12; 0 TRIM: 5.375" x 8.375" COMPOSITECOLORS: Black, PANTONE 306 U, PANTONE 641 U, ~note-color 2 GRAPHICS: Tekla_306_641.eps V1.5

TEKLA WORLDHEALTHCARE FUND
Distribution policy: The Fund has implemented a managed distribution policy (the Policy) thatprovides for monthly distributions at a rate set by the Board of Trustees. Under the current Policy,the Fund intends to make monthly distributions at a rate of $0.1167 per share to shareholders ofrecord. The Policy would result in a return of capital to shareholders if the amount of the distribu-tion exceeds the Fund’s net investment income and realized capital gains. A return of capital mayoccur, for example, when some or all of the money that you invested in the Fund is paid back toyou. A return of capital distribution does not necessarily reflect the Fund’s investment performanceand should not be confused with “yield” or “income.”
The amounts and sources of distributions reported in the Fund’s notices pursuant to Section 19(a) ofthe Investment Company Act of 1940 are only estimates and are not being provided for tax report-ing purposes. The actual amounts and sources of the amounts for tax reporting purposes will de-pend upon the Fund’s investment experience during its fiscal year and may be subject to changesbased on tax regulations. The Fund will send you a Form 1099-DIV for the calendar year that tellsyou how to report distributions for federal income tax purposes.
You should not draw any conclusions about the Fund’s investment performance from the amountof distributions pursuant to the Policy or from the terms of the Policy. The Policy has been estab-lished by the Trustees and may be changed or terminated by them without shareholder approval.The Trustees regularly review the Policy and the frequency and rate of distributions consideringthe purpose and effect of the Policy, the financial market environment, and the Fund’s income,capital gains and capital available to pay distributions. The suspension or termination of the Policycould have the effect of creating a trading discount or widening an existing trading discount. Atthis time there are no reasonably foreseeable circumstances that might cause the Trustees to ter-minate the Policy.
Consider these risks before investing: As with any investment company that invests in equitysecurities, the Fund is subject to market risk—the possibility that the prices of equity securities willdecline over short or extended periods of time. As a result, the value of an investment in theFund’s shares will fluctuate with the market generally and market sectors in particular. You couldlose money over short or long periods of time. Political and economic news can influence market-wide trends and can cause disruptions in the U.S. or world financial markets. Other factors may beignored by the market as a whole but may cause movements in the price of one company’s stockor the stock of companies in one or more industries. All of these factors may have a greater impacton initial public offerings and emerging company shares. Different types of equity securities tendto shift into and out of favor with investors, depending on market and economic conditions. Theperformance of funds that invest in equity securities of Healthcare Companies may at times bebetter or worse than the performance of funds that focus on other types of securities or that havea broader investment style.
Merrill Corp - Tekla World Healthcare Fund Semi-Annual Report [Funds] 333-202638 03-31-2017 ED [AUX] | bjasper | 23-May-17 12:12 | 17-11963-1.aa | Sequence: 2CHKSUM Content: 63044 Layout: 43474 Graphics: No Graphics CLEAN
JOB: 17-11963-1 CYCLE#;BL#: 12; 0 TRIM: 5.375" x 8.375" COMPOSITECOLORS: Black, PANTONE 306 U, ~note-color 2 GRAPHICS: none V1.5
TEKLA WORLDHEALTHCARE FUND
Dear Shareholders,
Dating back to the early 1980’s, many of us in the drug developmentworld have felt that we have been in the midst of a revolution in thediscovery, development and use of a new generation of medicinalproducts. It had only been in the 1970s that key cloning and similartechniques were developed that allowed the subsequent creation ofbiological and antibody based products capable of dramatically changingthe nature of drug therapy. These new technologies were seen as havingthe potential to cure numerous diseases or improve the quality and extentof life for many individuals with a myriad of diseases. This prophecy hascome to pass. There are few who would say that the world has notmaterially benefitted from biotechnology or genomic technologies sincetheir late twentieth century advent. Nearly every drug discovery anddevelopment effort in academics, in government, and in the private sectoruses and benefits from these technologies. In the last 30 or so years wehave seen the creation of new medical therapies that have saved orextended lives and/or have turned otherwise lethal conditions intomanageable situations. This has been most obvious to us in the areas ofcancer and rare diseases, but is evident in nearly every area of medicine.
Progress, however, has not always been smooth or straight upwards toinevitable success. The 80’s saw the development of many drugs whichreplaced proteins/enzymes that were deficient in patients with diseasessuch as diabetes or conditions such as anemia; but in this period, wealso experienced tough economic times which slowed progress. Thedevelopment of antibody based products, a remarkably effective approachto drug development, became common after approval of the first suchproduct in 1986. And the genomic age began. While there were manyother positive developments, the 90’s ended with just a handful ofprofitable biotech companies but also with the creation of a spate ofInitial Public Offerings (IPOs), that augured a new generation ofbiotech/pharma developments, many based on the promise of genomicsthat would further change the pace and nature of new medical productdevelopment. Some of these companies have gone on to do great things;others though were more speculative and were slow to reach theirpotential or did not get there at all. During this period of great success,the biotech industry also faced challenges. For example, the U.S. Presidentand the UK Prime Minister suggested in the 2000 timeframe that maybewe didn’t need traditional patent protection for novel inventions. Thishas been thought by some as being a cause of the 70% drawdown of the
1
Merrill Corp - Tekla World Healthcare Fund Semi-Annual Report [Funds] 333-202638 03-31-2017 ED [AUX] | thunt | 23-May-17 14:25 | 17-11963-1.ba | Sequence: 1CHKSUM Content: 13020 Layout: 64896 Graphics: No Graphics CLEAN
JOB: 17-11963-1 CYCLE#;BL#: 13; 0 TRIM: 5.375" x 8.375" COMPOSITECOLORS: Black, PANTONE 306 U, ~note-color 2 GRAPHICS: none V1.5

biotech sector in the early part of the twenty-first century. The sectorrebounded a bit in the mid-2000s but was heartily challenged, as was theentire U.S. economy, by the Great Recession of the 2008-9 timeframe.
Since its 2009 nadir, the biotech and healthcare sectors have reboundedimpressively. Returns through mid-2015 were notable, with the biotechand healthcare sectors each substantively outperforming the broadS&P 500® Index* (“SPX”) as a host of new and novel products came tomarket. These successes spawned a second large group of IPOs thatfunded a wave of biotech and other healthcare companies poised todevelop new and notable products in the areas of immuno-oncology,orphan diseases, antibiotics, gene therapy, gene editing and a host ofother scientific areas.
Having said this, after reaching a mid-year 2015 high nearly 400% aboveits 2009 low point, the biotech sector was again challenged by claims,peaking during the 2016 U.S. Presidential campaign, that drug prices havegotten too high. A tweet by one of the Presidential candidates is thoughtby some to have been a significant contributor to the 40% retreat in thebiotech sector which occurred during the latter half of 2015 and the earlypart of 2016.
Biotechnology, Healthcare, and S&P 500 Performance2009 – 2017
The biotech sector traded in a relatively narrow range for most of 2016,appearing to test the February 2016 low coincident with the U.S.Presidential election. However, in a surprise to many, the biotech sector(and the market in general) rebounded strongly with the election ofPresident Trump, recovering approximately 50% of the prior drawdownwithin a few weeks after the election. The biotech sector has since tradedin a range and is now (as of late April 2017) at approximately the samelevel as was reached in the post-election run up.
Of course, now the question is, where do we go from here? We providesupport for our views in the following pages but the bottom line is thatwe are generally optimistic. As noted, the market has just created a
700
500
400
600
300
200
100
02012201120102009 2013 2014 2016 20172015
Nasdaq Biotechnology Index®
S&P Composite 1500® Healthcare IndexS&P 500® Index
All indices = 100 on Dec 31 2008
2
Merrill Corp - Tekla World Healthcare Fund Semi-Annual Report [Funds] 333-202638 03-31-2017 ED [AUX] | thunt | 23-May-17 14:25 | 17-11963-1.ba | Sequence: 2CHKSUM Content: 57666 Layout: 39170 Graphics: 26595 CLEAN
JOB: 17-11963-1 CYCLE#;BL#: 13; 0 TRIM: 5.375" x 8.375" COMPOSITECOLORS: Black, PANTONE 306 U, ~note-color 2 GRAPHICS: 11963-1_NBI_09_highlights_L.eps V1.5

generation of well funded new public companies with many interestingproducts in development. The existing profitable biotech companies aregrowing faster than the broad market and we expect them to continue todo so. The Food and Drug Administration (FDA) continues to approveproducts at a relative elevated rate and the new Administration speaks ofbeing business friendly. No less important, after the recent sector pullback,the profitable biotech sector is at a lower valuation than the broad market.Many things can change or unexpected problems can occur, especiallyin the short term. But, given our emphasis on fundamentals, we leantowards optimism in our view of the future.
As always, we thank you for your consideration of the Tekla Funds. Pleasecall our investor support services agent Destra Capital or us if you haveany questions.
Be well,
Daniel R. Omstead, Ph.D.President and Portfolio Manager
3
Merrill Corp - Tekla World Healthcare Fund Semi-Annual Report [Funds] 333-202638 03-31-2017 ED [AUX] | thunt | 23-May-17 14:25 | 17-11963-1.ba | Sequence: 3CHKSUM Content: 35288 Layout: 45456 Graphics: 3077 CLEAN
JOB: 17-11963-1 CYCLE#;BL#: 13; 0 TRIM: 5.375" x 8.375" COMPOSITECOLORS: Black, PANTONE 306 U, ~note-color 2 GRAPHICS: Daniel_Omstead_k_New.eps, daniel_r_omstead_pms306_sig.eps V1.5

Perspective on the Biotechnology and Healthcare Sectors
Since President Trump’s election, there has been a rebound in both thebroad market and the biotech and healthcare sectors after a significantdownturn in late 2015 and early 2016. In fact, as of late April 2017, thebiotech sector has regained approximately 50% of the decline seen inthe first two months of 2016.
The question now is what to think about the biotech and healthcaresector going forward? Will we see continued politicization of healthcarewith a focus on drug pricing and uncertainty about how/whether torepeal/replace Obamacare? Or will we see reduced rhetoric and a focuson the fundamentals of the sector? Is there an opportunity to see thesector move forward or will continued uncertainty hold the sector back?In order to come to a conclusion, we take into consideration the followingfundamentals.
We note that healthcare spending, both in the U.S. and throughout theOrganisation for Economic Co-operation and Development (OECD)countries, continues to grow as a percentage of the Gross DomesticProduct (GDP). We also note that healthcare represents a significantportion of the broad SPX. One cannot exclude the possibility that otherfactors will dominate the markets, but we are generally optimistic aboutthe intermediate and long term future of healthcare in general and biotechin particular.
4
Merrill Corp - Tekla World Healthcare Fund Semi-Annual Report [Funds] 333-202638 03-31-2017 ED [AUX] | thunt | 23-May-17 14:25 | 17-11963-1.ba | Sequence: 4CHKSUM Content: 35147 Layout: 46344 Graphics: No Graphics CLEAN
JOB: 17-11963-1 CYCLE#;BL#: 13; 0 TRIM: 5.375" x 8.375" COMPOSITECOLORS: Black, ~note-color 2 GRAPHICS: none V1.5

S&P 500® Index Composition by Global IndustryClassification Standard Sector
Healthcare Spending as a Percentage of GDP1980 – 2015
We also note that long term secular population growth rates continue inthe U.S. and in many other countries. We have previously reported thatpeople tend to spend more on healthcare as they age. The followingchart depicts population growth in key geographies. Note that in allgeographies depicted, the general population is expected to grow through2050 and that the proportion of older citizens is also expected to grow.
1980 1985 1990 20151995 2000 2005 2010
United States (16.9%)
Switzerland (11.5%)
Japan (11.2%)
Germany (11.1%)
Sweden (11.1%)
France (11%)
Denmark (10.6%)
Belgium (10.4%)
Netherlands (10.8%) Austria (10.4%)
Canada (10.1%)
Norway (9.9%)
United Kingdom (9.8%)
4
6
8
12
10
14
16
18
ConsumerDiscretionary12.49%
Utilities3.17%
ConsumerStaples9.27%
Energy6.31%
Financials14.12%
Health Care13.96%
Industrials10.14%
InformationTechnology
22.54%
Materials2.85%
Real Estate2.91%
TelecommunicationServices
2.25%
5
Merrill Corp - Tekla World Healthcare Fund Semi-Annual Report [Funds] 333-202638 03-31-2017 ED [AUX] | thunt | 23-May-17 14:25 | 17-11963-1.ba | Sequence: 5CHKSUM Content: 26936 Layout: 55290 Graphics: 43429 CLEAN
JOB: 17-11963-1 CYCLE#;BL#: 13; 0 TRIM: 5.375" x 8.375" COMPOSITECOLORS: Black, PANTONE 306 U, ~note-color 2 GRAPHICS: 11963-1_SP500_comp_P.eps, 11963-1_spending_L.eps V1.5
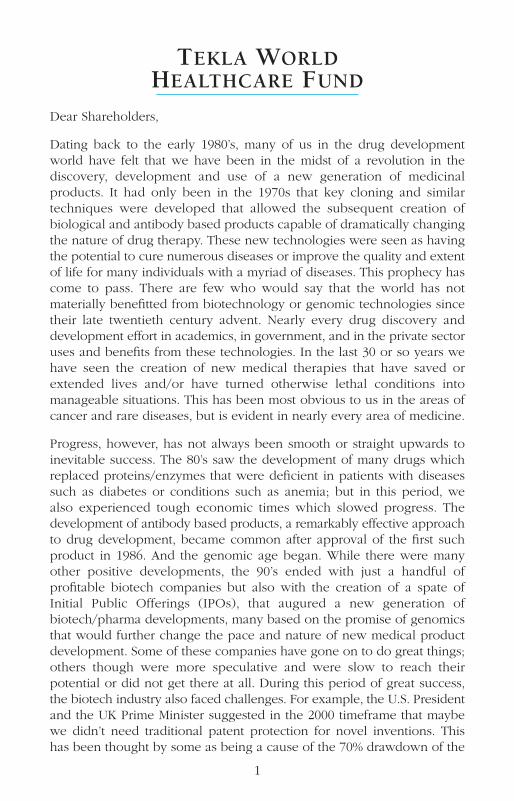
Population 65 to 84 Years and 85 Years and Over in theWorld’s Four Largest Countries: 2012, 2030, and 2050
In addition to population growth, per capita healthcare spending hasbeen growing. In the U.S., for example, Centers for Medicare & MedicaidServices (CMS) healthcare related spending is expected to grow at 5.8%per year, 1.3% faster than U.S. GDP growth. Moreover, prescription drugspending is projected to grow at 6.7% per year. While per capitahealthcare spending in the U.S. is higher than in other OECD countries,a similar trend exists in other OECD countries.
Per Capita Healthcare Spending by Country1970 – 2015
While population growth in broad geographies continues, so doesinnovation. As we have previously described, impressive newdevelopments in immuno-oncology, gene therapy, gene editing and thelike are occurring rapidly. These developments are part of a general trendthat may lead to new and better medical therapies. In the following charts,evidence of this trend is depicted in the form of general trends in the
1970 1975 1980 1985 1990 20151995 2000 2005 2010
Australia (4420)
Canada (4608)
France (4407)
Germany (5267)
Italy (3272)
Japan (4150)
Mexico (1052)
Korea (2488)
Netherlands (5343)
Poland (1677)
Spain (3153)
Sweden (5228)
Switzerland (6935)
Turkey (1064)
United Kingdom (4003)
United States (9451)
0
1,000
2,000
4,000
3,000
5,000
6,000
7,000
8,000
9,000
10,000United States
0
50
100
150
200
300
250
350M
illio
ns
United States China India Indonesia2012 2030 2050 2012 2030 2050 2012 2030 2050 2012 2030 2050
65-84 Years Old 85 years and over
6
Merrill Corp - Tekla World Healthcare Fund Semi-Annual Report [Funds] 333-202638 03-31-2017 ED [AUX] | thunt | 23-May-17 14:25 | 17-11963-1.ba | Sequence: 6CHKSUM Content: 25201 Layout: 57250 Graphics: 21520 CLEAN
JOB: 17-11963-1 CYCLE#;BL#: 13; 0 TRIM: 5.375" x 8.375" COMPOSITECOLORS: Black, PANTONE 306 U, ~note-color 2 GRAPHICS: 11963-1_OECD_spend_L.eps, 11963-1_population_B.eps V1.5

number of National Institute of Health (“NIH”) funded scientific papers,the number of clinical trials undertaken and in the number new medicaltherapies approved.
NIH Funded Papers1985 – 2013
Total Number of Registered Studies Over Time
2000 – 2016
0
10
20
30
40
50
60
70
80
90
100
1985
Num
ber (
1000
’s)
1986
1987
1988
1989
1990
1991
1992
1993
1994
1995
1996
1997
1998
1999
2000
2001
2002
2003
2004
2005
2006
2007
2008
2009
2010
2011
2012
2013
20000
50,000
100,000
150,000
200,000
250,000
2005 2010 2015
7
Merrill Corp - Tekla World Healthcare Fund Semi-Annual Report [Funds] 333-202638 03-31-2017 ED [AUX] | thunt | 23-May-17 14:25 | 17-11963-1.ba | Sequence: 7CHKSUM Content: 24563 Layout: 8150 Graphics: 58140 CLEAN
JOB: 17-11963-1 CYCLE#;BL#: 13; 0 TRIM: 5.375" x 8.375" COMPOSITECOLORS: Black, PANTONE 306 U, ~note-color 2 GRAPHICS: 11963-1_papers_B.eps, 11963-1_reg_studies_B.eps V1.5
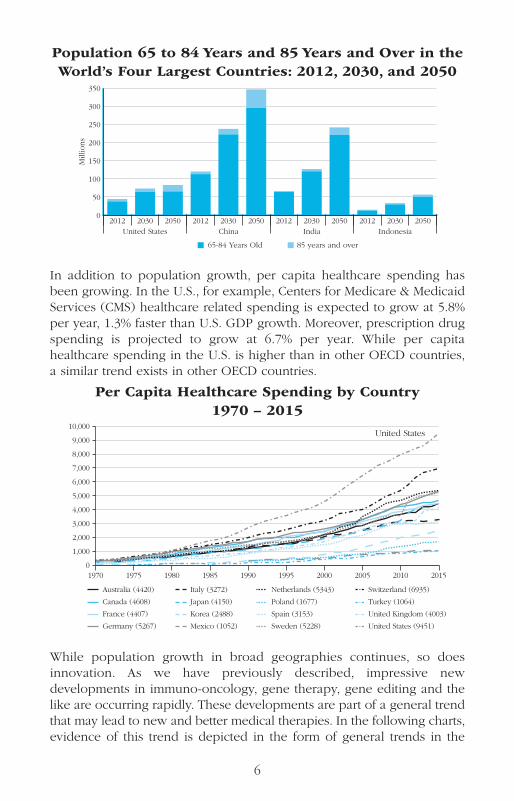
FDA New Molecular Entity and New Biologic LicenseApplication Filings and Approvals
2006 – 2015
It is our general view that more scientific papers lead to more drugsbeing evaluated in clinical trials and, in turn, ultimately to more productapprovals. We believe these are factors that drive biotech and healthcaresector performance. Note that in terms of new FDA approvals, more than40 New Molecular Entities (NMEs) were approved by the FDA in 2014and 2015 whereas fewer than 30 were approved annually in the periodfrom 2006-2010.
We also note that given the recent pullback in the biotech and healthcaresectors, valuations within these sectors have become attractive. Thefollowing chart depicts Price/Earnings ratios for these sectors comparedto the broad SPX over the last five years. It is clear that the valuation ofboth the biotech and healthcare sectors (e.g. the S&P Composite 1500®
Health Care Index* (“S15HLTH”) and the more focused S&P Composite 1500®
Biotechnology Index*) are now more attractive than that of the SPX.
Biotechnology, Healthcare, and S&P 500 Price to Earnings Ratio
2013 – 2017
0
5
10
15
20
25
30
35
40
45
50
2006 2007 2008 2009 2010 2011 2012 2013 2014 2015
NME/BLA Approvals NME/BLA Filings
22
26
18
2426
21
30
39
27
41 4535 3436
23
41 41
36
41 40
30
25
20
15
10
5
0
2013 2014 2016 20172015
S&P Composite 1500® Biotechnology IndexS&P Composite 1500® Healthcare IndexS&P 500® Index
8
Merrill Corp - Tekla World Healthcare Fund Semi-Annual Report [Funds] 333-202638 03-31-2017 ED [AUX] | thunt | 23-May-17 14:25 | 17-11963-1.ba | Sequence: 8CHKSUM Content: 26496 Layout: 23504 Graphics: 33260 CLEAN
JOB: 17-11963-1 CYCLE#;BL#: 13; 0 TRIM: 5.375" x 8.375" COMPOSITECOLORS: Black, PANTONE 306 U, ~note-color 2 GRAPHICS: 11963-1_NME_BLA_B.eps, 11963-1_PE_Ratio_L.eps V1.5
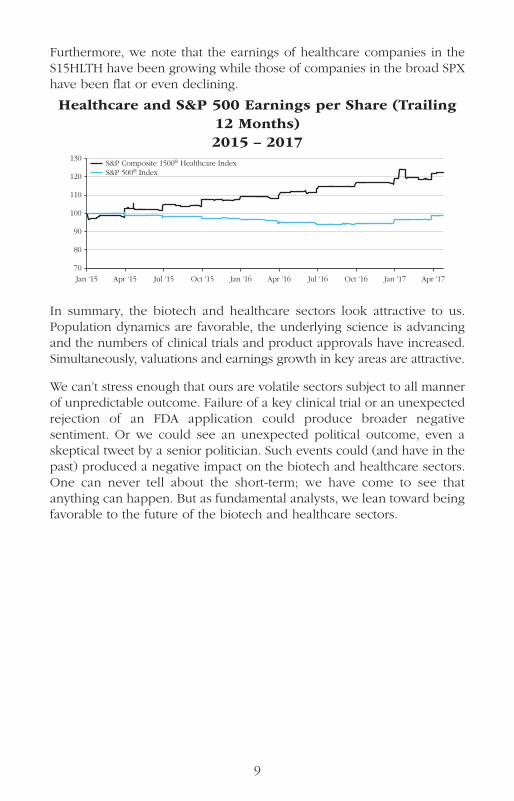
Furthermore, we note that the earnings of healthcare companies in theS15HLTH have been growing while those of companies in the broad SPXhave been flat or even declining.
Healthcare and S&P 500 Earnings per Share (Trailing12 Months)2015 – 2017
In summary, the biotech and healthcare sectors look attractive to us.Population dynamics are favorable, the underlying science is advancingand the numbers of clinical trials and product approvals have increased.Simultaneously, valuations and earnings growth in key areas are attractive.
We can’t stress enough that ours are volatile sectors subject to all mannerof unpredictable outcome. Failure of a key clinical trial or an unexpectedrejection of an FDA application could produce broader negativesentiment. Or we could see an unexpected political outcome, even askeptical tweet by a senior politician. Such events could (and have in thepast) produced a negative impact on the biotech and healthcare sectors.One can never tell about the short-term; we have come to see thatanything can happen. But as fundamental analysts, we lean toward beingfavorable to the future of the biotech and healthcare sectors.
130
120
110
100
90
80
70
Jan ‘15 Apr ‘15 Jan ‘16 Apr ‘16 Jul ‘16 Oct ‘16 Jan ‘17 Apr ‘17Jul ‘15 Oct ‘15
S&P Composite 1500® Healthcare IndexS&P 500® Index
9
Merrill Corp - Tekla World Healthcare Fund Semi-Annual Report [Funds] 333-202638 03-31-2017 ED [AUX] | thunt | 23-May-17 14:25 | 17-11963-1.ba | Sequence: 9CHKSUM Content: 64763 Layout: 58969 Graphics: 35405 CLEAN
JOB: 17-11963-1 CYCLE#;BL#: 13; 0 TRIM: 5.375" x 8.375" COMPOSITECOLORS: Black, PANTONE 306 U, ~note-color 2 GRAPHICS: 11963-1_Index_Earn_L.eps V1.5
TEKLA WORLDHEALTHCARE FUND
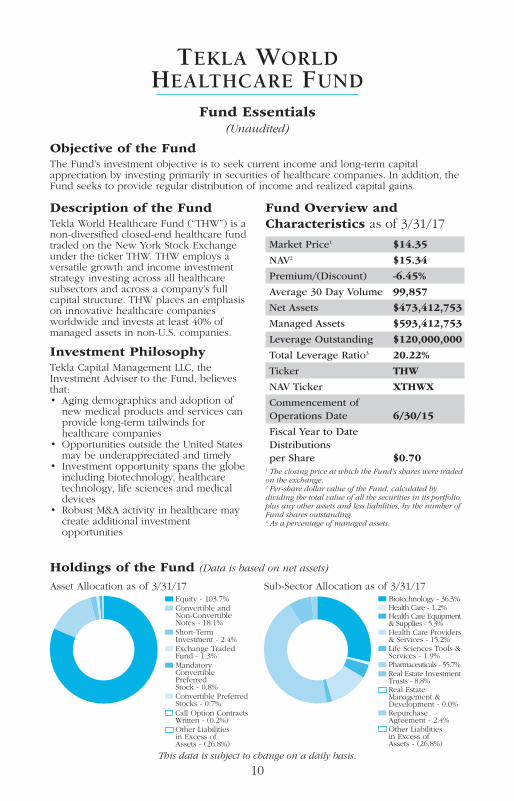
Description of the FundTekla World Healthcare Fund (“THW”) is anon-diversified closed-end healthcare fundtraded on the New York Stock Exchangeunder the ticker THW. THW employs aversatile growth and income investmentstrategy investing across all healthcaresubsectors and across a company’s fullcapital structure. THW places an emphasison innovative healthcare companiesworldwide and invests at least 40% ofmanaged assets in non-U.S. companies.
Investment PhilosophyTekla Capital Management LLC, theInvestment Adviser to the Fund, believesthat:• Aging demographics and adoption of
new medical products and services canprovide long-term tailwinds forhealthcare companies
• Opportunities outside the United Statesmay be underappreciated and timely
• Investment opportunity spans the globeincluding biotechnology, healthcaretechnology, life sciences and medicaldevices
• Robust M&A activity in healthcare maycreate additional investmentopportunities
Fund Overview andCharacteristics as of 3/31/17
Market Price1 $14.35
NAV2 $15.34
Premium/(Discount) -6.45%
Average 30 Day Volume 99,857
Net Assets $473,412,753
Managed Assets $593,412,753
Leverage Outstanding $120,000,000
Total Leverage Ratio3 20.22%
Ticker THW
NAV Ticker XTHWX
Commencement ofOperations Date 6/30/15
Fiscal Year to DateDistributionsper Share $0.70
1 The closing price at which the Fund’s shares were tradedon the exchange.2 Per-share dollar value of the Fund, calculated bydividing the total value of all the securities in its portfolio,plus any other assets and less liabilities, by the number ofFund shares outstanding.3 As a percentage of managed assets.
Holdings of the Fund (Data is based on net assets)
Asset Allocation as of 3/31/17 Sub-Sector Allocation as of 3/31/17Equity - 103.7%Convertible and Non-Convertible Notes - 18.1%
Mandatory Convertible Preferred Stock - 0.8%Convertible Preferred Stocks - 0.7%
Exchange Traded Fund - 1.3%
Other Liabilities in Excess of Assets - (26.8%)
Short-TermInvestment - 2.4%
Call Option ContractsWritten - (0.2%)
Biotechnology - 36.3%
Health Care Equipment & Supplies - 5.3%
Health Care - 1.2%
Health Care Providers & Services - 15.2%Life Sciences Tools & Services - 1.9%Pharmaceuticals - 55.7%Real Estate Investment Trusts - 8.8%
Repurchase Agreement - 2.4%
Real Estate Management & Development - 0.0%
Other Liabilities in Excess of Assets - (26.8%)
This data is subject to change on a daily basis.
Fund Essentials(Unaudited)
Objective of the FundThe Fund’s investment objective is to seek current income and long-term capitalappreciation by investing primarily in securities of healthcare companies. In addition, theFund seeks to provide regular distribution of income and realized capital gains.
10
Merrill Corp - Tekla World Healthcare Fund Semi-Annual Report [Funds] 333-202638 03-31-2017 ED [AUX] | thunt | 23-May-17 14:25 | 17-11963-1.ba | Sequence: 10CHKSUM Content: 61842 Layout: 30137 Graphics: 15413 CLEAN
JOB: 17-11963-1 CYCLE#;BL#: 13; 0 TRIM: 5.375" x 8.375" COMPOSITECOLORS: Black, PANTONE 306 U, ~HTML color, ~note-color 2, ~watermark GRAPHICS: 11963-1 ast allo_Peps.eps, 11963-1 sub sect allo_P.eps V1.5

TEKLA WORLDHEALTHCARE FUND
11
Largest Holdings by Issuer(Excludes Short-Term Investments)
As of March 31, 2017(Unaudited)
% of NetIssuer – Sector Assets Gilead Sciences, Inc. – Biotechnology 6.0%Allergan plc – Pharmaceuticals 5.0%Novartis AG – Pharmaceuticals 4.4%Medtronic plc – Health Care Equipment & Supplies 3.9%GlaxoSmithKline plc – Pharmaceuticals 3.6%Teva Pharmaceutical Industries Ltd. – Pharmaceuticals 3.3%Roche Holding AG – Pharmaceuticals 3.3%Galapagos NV – Biotechnology 3.1%AstraZeneca PLC – Pharmaceuticals 3.1%Sanofi – Pharmaceuticals 2.9%Eli Lilly & Company – Pharmaceuticals 2.7%Johnson & Johnson – Pharmaceuticals 2.4%UCB SA – Pharmaceuticals 2.3%Jazz Pharmaceuticals plc – Pharmaceuticals 2.3%Vertex Pharmaceuticals Incorporated – Biotechnology 2.3%Shire plc – Pharmaceuticals 2.2%CVS Health Corporation – Health Care Providers & Services 2.2%Mallinckrodt plc – Pharmaceuticals 2.1%Hikma Pharmaceuticals PLC – Health Care Providers & Services 2.0%Mylan N.V. – Pharmaceuticals 1.9%
COUNTRY DIVERSIFICATION % of Net % of ManagedAs of March 31, 2017 (Unaudited) Assets Assets Australia 1.2% 0.9%Belgium 5.5% 4.3%China 0.7% 0.5%Denmark 1.5% 1.2%France 5.6% 4.4%Germany 1.6% 1.3%Ireland 17.6% 14.0%Israel 3.8% 3.1%Japan 1.1% 0.9%Netherlands 2.9% 2.3%Spain 0.6% 0.5%Switzerland 7.2% 5.7%United Kingdom 10.1% 8.0%United States 67.4% 53.8%
Merrill Corp - Tekla World Healthcare Fund Semi-Annual Report [Funds] 333-202638 03-31-2017 ED [AUX] | thunt | 23-May-17 14:25 | 17-11963-1.ba | Sequence: 11CHKSUM Content: 46473 Layout: 30857 Graphics: No Graphics CLEAN
JOB: 17-11963-1 CYCLE#;BL#: 13; 0 TRIM: 5.375" x 8.375" COMPOSITECOLORS: Black, PANTONE 306 U, ~note-color 2 GRAPHICS: none V1.5

Fund Performance
THW is a closed-end fund which invests predominantly in healthcarecompanies. Subject to regular consideration, the Trustees of THW haveinstituted a policy of making monthly distributions to shareholders.
The Fund seeks to benefit from the earnings growth of the healthcareindustry while capturing income. Income is derived from multiple sourcesincluding equity dividends, fixed income coupons, real estate investmenttrust distributions, convertible securities coupons and selective equitycovered call writing premiums. In order to accomplish its objectives, THWoften holds a majority of its assets in equities. Allocation of assets tovarious healthcare sectors can vary significantly as can the percentage ofthe portfolio which is overwritten. Under normal market conditions, theFund expects to invest at least 40 percent of its managed assets incompanies organized or located outside of the U.S. or companies that doa substantial amount of business outside the U.S. (“Foreign Issuers”).
The Fund may invest up to 20 percent of managed assets, measured atthe time of investment, in non-convertible debt of healthcare companies.It may also invest up to 20 percent of managed assets in healthcare REITs.The Fund may also hold up to 30 percent of managed assets inconvertible securities and may invest a portion of its assets in restrictedsecurities. In order to generate additional “current” income THW oftensells (or writes) calls against a material portion of its equity assets. Theportion of equity assets overwritten can vary, but usually represents lessthan 20 percent of managed assets. At times, the overwritten portion ofassets is materially less than 20 percent of managed assets. The use ofcovered calls is intended to produce “current” income, but may limitupside in bullish markets. The Fund may also use leverage to enhanceyield. The Fund may incur leverage up to 20 percent of managed assetsat the time of borrowing. “Managed assets” means the total assets of theFund (including any assets attributable to borrowings for investmentpurposes) minus the sum of the Fund’s accrued liabilities (other thanliabilities representing borrowings for investment purposes).
The Fund considers investments in companies of all sizes and in allhealthcare subsectors, including but not limited to, biotechnology,pharmaceuticals, healthcare equipment, healthcare supplies, life sciencetools and services, healthcare distributors, managed healthcare, healthcaretechnology, and healthcare facilities. The Fund expects to invest at least40 percent of managed assets in Foreign Issuers and emphasizesinnovation, investing both in public and pre-public venture companies.The Fund considers its pre-public and other restricted investments to bea differentiating characteristic. Among the various healthcare subsectors,
12
Merrill Corp - Tekla World Healthcare Fund Semi-Annual Report [Funds] 333-202638 03-31-2017 ED [AUX] | thunt | 23-May-17 14:25 | 17-11963-1.ba | Sequence: 12CHKSUM Content: 45261 Layout: 55522 Graphics: No Graphics CLEAN
JOB: 17-11963-1 CYCLE#;BL#: 13; 0 TRIM: 5.375" x 8.375" COMPOSITECOLORS: Black, ~note-color 2 GRAPHICS: none V1.5

THW has considered the biotechnology subsector, including both pre-public and public companies, to be a key contributor to the healthcaresector. The Fund holds biotech assets, including both public and pre-public, often representing 25-35% of net assets.
There is no commonly published index which matches the investmentstrategy of THW. With respect to the Fund’s equity investments, THWoften holds 20-40% of its assets in biotechnology. By contrast, the S&PGlobal 1200® Health Care Index* (“SGH”) consists of more than 100 globalcompanies representing most or all of the healthcare subsectors in whichTHW typically invests; biotechnology often represents up to 20% of thisindex. By contrast, the NASDAQ Biotechnology Index®* (“NBI”), whichcontains approximately 180 securities, is much more narrowlyconstructed. The vast majority of this index is comprised of biotechnology,pharmaceutical and life science tools companies. In recent years,biotechnology has often represented 72-82% of the NBI. Neither the SGHnor NBI indices contain any material amount of pre-public companyassets.
The S&P 500® Health Care Corporate Bond Index* (“SP5HCBIT”)measures the performance of U.S. corporate debt issued by constituentsin the healthcare sector of the SPX. This index is generally reflective ofthe debt assets in which THW invests, though the Fund invests in theSPX index debt components as well as those of smaller capitalizationcompanies.
The FTSE NAREIT Health Care Property Sector Index®* (“FNHEA”) iscomprised of U.S. publicly traded REITs in the healthcare sector. Thisindex is generally reflective of the REITs in which THW invests.
We present both NAV and stock returns for the Fund in comparison toseveral commonly published indices. We note that THW is a dynamicallyconfigured multi-asset class global healthcare growth and income fund.There is no readily available index comprised of similar characteristics toTHW and to which THW can directly be compared. Therefore, we providereturns for a number of indices representing the major components of THW’sassets. Having said this, we note that there are no readily available indicesrepresenting the covered call strategy employed by THW or the restrictedsecurity components of THW. The following data for available funds overthe six-month and one-year periods are provided for comparison.
Fund Performance for the Period Ended March 31, 2017
Period THW NAV THW MKT NBI SGH SPX SP5HCBIT FNHEA
6 month 0.39 2.87 1.63 3.15 10.12 -2.02 -4.621 year 8.83 12.91 13.04 9.23 17.16 1.68 9.62
13
Merrill Corp - Tekla World Healthcare Fund Semi-Annual Report [Funds] 333-202638 03-31-2017 ED [AUX] | thunt | 23-May-17 14:25 | 17-11963-1.ba | Sequence: 13CHKSUM Content: 9328 Layout: 32563 Graphics: No Graphics CLEAN
JOB: 17-11963-1 CYCLE#;BL#: 13; 0 TRIM: 5.375" x 8.375" COMPOSITECOLORS: Black, ~note-color 2 GRAPHICS: none V1.5

Performance data quoted represents past performance, which is no guarantee of future results, and current performancemay be lower or higher than the figures shown. The NAV total return takes into account the Fund’s total annual expensesand does not reflect transaction charges. If transaction charges were reflected, NAV total return would be reduced. Alldistributions are assumed to be reinvested either in accordance with the dividend reinvestment plan (DRIP) for marketprice returns or NAV for NAV returns. The market price returns reflect the reinvestment at the closing market price on thelast business day of the month.
Portfolio Highlights as of March 31, 2017
Among other investments, THW’s performance benefitted in the past yearby the following:
Esperion Therapeutics Inc. (ESPR) is a small-cap cardiology company witha drug in late stage development for treating high cholesterol. The stocktraded up on news from a competitor company which suggested to somethat Esperion’s drug might have a faster path to regulatory approval thanpreviously expected.
Sanofi (SNY) is a large cap international diversified pharmaceuticalscompany that appears to have expectations with respect to its basediabetes business and has progressed their pipeline assets.
Galapagos NV (GLPG) a Belgium based biotech has potential best in classtreatments for cystic fibrosis (partnered with Abbvie Inc.) and a JAKinhibitor for the treatment of Rheumatoid arthritis. GLPG also has a deepproprietary pipeline that we believe will continue to build value for thecompany. We continue to believe that the depth of GLPG’s pipeline makeit an attractive take-out target for 2017.
Among other examples, THW’s performance was negatively impacted bythe following investments:
Although we view Teva Pharmaceuticals (TEVA) as one of the leadinghigh quality global specialty pharmaceuticals companies, the stock hasunderperformed due to sector wide pricing pressures in the generic spaceand company-specific concerns about their high margin specialtybusiness. We see this as having the potential to turn around in the nearto mid-term.
0.42.9
Performance6 Month
1.6 3.2
13.010.1
-2.0-4.6
8.812.9
9.2
17.2
1.7
9.6
Performance1 Year
THW
NAV
THW
MKT NB
I
NBI
SGH
SPX
SP5H
CBIT
FNHE
A
THW
NAV
THW
MKT SG
H
SPX
SP5H
CBIT
FNHE
A
14
Merrill Corp - Tekla World Healthcare Fund Semi-Annual Report [Funds] 333-202638 03-31-2017 ED [AUX] | thunt | 23-May-17 14:25 | 17-11963-1.ba | Sequence: 14CHKSUM Content: 46311 Layout: 18939 Graphics: 33819 CLEAN
JOB: 17-11963-1 CYCLE#;BL#: 13; 0 TRIM: 5.375" x 8.375" COMPOSITECOLORS: Black, PANTONE 306 U, ~note-color 2 GRAPHICS: 11963-1_fund_perf_B.eps V1.5

Puma Biotechnology Inc. (PBYI) is a biopharmaceutical company whoselead asset for adjuvant breast cancer is under review at the FDA. Thestock has been under pressure among other things due to the lead drug’stoxicity profile and positive data from their leading competitor. We believethe stock will recover after some near term volatility with an appreciationof both the manageability of the main toxicity and the large role for thedrug in a large subset of breast cancer patients.
15
*The trademarks NASDAQ Biotechnology Index®, S&P Composite 1500® Healthcare Index, S&P Composite 1500®
Biotechnology Index, S&P Global 1200® Health Care Index, S&P 500® Health Care Corporate Bond Index, FTSE NAREITHealthcare Property Sector Index®, and S&P 500® Index referenced in this report are the property of their respectiveowners. These trademarks are not owned by or associated with the Fund or its service providers, including TeklaCapital Management LLC.
Merrill Corp - Tekla World Healthcare Fund Semi-Annual Report [Funds] 333-202638 03-31-2017 ED [AUX] | thunt | 23-May-17 14:25 | 17-11963-1.ba | Sequence: 15CHKSUM Content: 26645 Layout: 50727 Graphics: No Graphics CLEAN
JOB: 17-11963-1 CYCLE#;BL#: 13; 0 TRIM: 5.375" x 8.375" COMPOSITECOLORS: Black, ~note-color 2 GRAPHICS: none V1.5

16
The accompanying notes are an integral part of these financial statements.
PRINCIPAL CONVERTIBLE AND NON-CONVERTIBLE AMOUNT NOTES - 18.1% of Net Assets VALUE
CONVERTIBLE NOTES (Restricted) (a) - 0.0% of Net Assets
United States - 0.0% $70,629 IlluminOss Medical, Inc. Promissory Note,
8.00%, due 3/31/18 $70,629 TOTAL CONVERTIBLE NOTES 70,629
NON-CONVERTIBLE NOTES - 18.1% of Net Assets Ireland - 1.4% 3,000,000 Endo Ltd/Endo Finance LLC/Endo Finco Inc.,
6.50% due 2/1/25 (b) 2,557,500 4,000,000 Grifols Worldwide Operations Ltd.,
5.25% due 4/1/22 4,152,000 6,709,500
United Kingdom - 0.9% 4,000,000 Hikma Pharmaceuticals PLC,
4.25% due 4/10/20 4,027,520 4,027,520 United States - 15.8% 3,200,000 AbbVie Inc., 4.50% due 5/14/35 3,177,939 4,100,000 Actavis Funding SCS, 4.55% due 3/15/35 4,111,144 2,000,000 Amgen Inc., 3.63% due 5/22/24 2,049,636 4,475,000 Amgen Inc., 4.66% due 6/15/51 4,477,783 2,790,000 Baxalta Inc., 4.00% due 6/23/25 2,842,737 1,200,000 Becton Dickinson and Co.,
3.73% due 12/15/24 1,235,248 3,000,000 DaVita, Inc., 5.00% due 5/1/25 3,007,500 4,000,000 EMD Finance LLC, 3.25% due 3/19/25 (b) 3,952,836 2,890,000 Envision Healthcare Corporation,
5.63% due 7/15/22 2,962,250 1,385,000 Express Scripts Holding Company,
3.50% due 6/15/24 1,364,129 3,000,000 Gilead Sciences, Inc., 4.60% due 9/1/35 3,090,660 2,000,000 GlaxoSmithKline Capital Inc.,
2.80% due 3/18/23 2,002,050 1,200,000 HCA Holdings Inc., 5.25% due 4/15/25 1,275,000
TEKLA WORLDHEALTHCARE FUND
SCHEDULE OF INVESTMENTSMARCH 31, 2017
(Unaudited)
Merrill Corp - Tekla World Healthcare Fund Semi-Annual Report [Funds] 333-202638 03-31-2017 ED [AUX] | bjasper | 23-May-17 12:12 | 17-11963-1.ca | Sequence: 1CHKSUM Content: 30687 Layout: 50906 Graphics: No Graphics CLEAN
JOB: 17-11963-1 CYCLE#;BL#: 12; 0 TRIM: 5.375" x 8.375" COMPOSITECOLORS: Black, PANTONE 306 U, ~note-color 2 GRAPHICS: none V1.5

17
The accompanying notes are an integral part of these financial statements.
PRINCIPAL AMOUNT United States - continued VALUE $2,500,000 HCA Holdings Inc., 5.38% due 2/1/25 $2,606,250 2,000,000 HCA Holdings Inc., 5.88% due 5/1/23 2,160,000 2,630,000 HCP, Inc., 4.20% due 3/1/24 2,693,144 3,000,000 HealthSouth Corporation,
5.75% due 11/1/24 3,022,500 8,000,000 Mallinckrodt International Finance SA/
Mallinckrodt CB LLC, 5.50% due 4/15/25 (b) 7,360,000 1,200,000 McKesson Corporation, 3.80% due 3/15/24 1,245,467 1,200,000 Medtronic Inc., 4.38% due 3/15/35 1,257,978 1,463,000 Merck & Co., Inc., 2.75% due 2/10/25 1,444,256 2,115,000 Novartis Capital Corporation.,
3.40% due 5/6/24 2,182,841 4,000,000 Omega Healthcare Investors, Inc.,
5.88% due 3/15/24 4,127,176 3,500,000 Senior Housing Properties Trust,
4.75% due 5/1/24 3,579,590 3,000,000 Tenet Healthcare Corporation.,
6.75% due 6/15/23 2,947,500 5,000,000 Zimmer Biomet Holdings, Inc.,
4.25% due 8/15/35 4,700,425 74,876,039
TOTAL NON-CONVERTIBLE NOTES 85,613,059
TOTAL CONVERTIBLE AND NON-CONVERTIBLE NOTES(Cost $85,584,520) 85,683,688
CONVERTIBLE PREFERRED (Restricted) (a) (c) - 0.7% SHARES of Net Assets
United States - 0.7% 1,307,690 BioClin Therapeutics, Inc. Series A 849,999 505,049 BioClin Therapeutics, Inc. Series B 377,777 1,333,333 GenomeDx Biosciences, Inc. Series C 2,000,000 219,196 IlluminOss Medical, Inc. Series AA 219,196 206,483 IlluminOss Medical, Inc. Junior Preferred 206,483 TOTAL CONVERTIBLE PREFERRED
(Cost $3,452,469) 3,653,455
TEKLA WORLDHEALTHCARE FUND
SCHEDULE OF INVESTMENTSMARCH 31, 2017(Unaudited, continued)
Merrill Corp - Tekla World Healthcare Fund Semi-Annual Report [Funds] 333-202638 03-31-2017 ED [AUX] | bjasper | 23-May-17 12:12 | 17-11963-1.ca | Sequence: 2CHKSUM Content: 24612 Layout: 18184 Graphics: No Graphics CLEAN
JOB: 17-11963-1 CYCLE#;BL#: 12; 0 TRIM: 5.375" x 8.375" COMPOSITECOLORS: Black, PANTONE 306 U, ~note-color 2 GRAPHICS: none V1.5
18
The accompanying notes are an integral part of these financial statements.
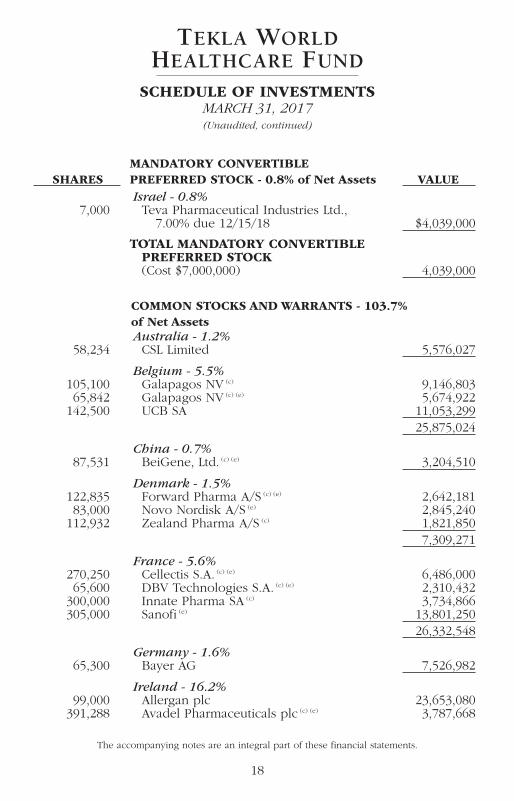
MANDATORY CONVERTIBLE SHARES PREFERRED STOCK - 0.8% of Net Assets VALUE Israel - 0.8% 7,000 Teva Pharmaceutical Industries Ltd.,
7.00% due 12/15/18 $4,039,000 TOTAL MANDATORY CONVERTIBLE
PREFERRED STOCK(Cost $7,000,000) 4,039,000
COMMON STOCKS AND WARRANTS - 103.7% of Net Assets Australia - 1.2% 58,234 CSL Limited 5,576,027 Belgium - 5.5% 105,100 Galapagos NV (c) 9,146,803 65,842 Galapagos NV (c) (e) 5,674,922 142,500 UCB SA 11,053,299 25,875,024 China - 0.7% 87,531 BeiGene, Ltd. (c) (e) 3,204,510
Denmark - 1.5% 122,835 Forward Pharma A/S (c) (e) 2,642,181 83,000 Novo Nordisk A/S (e) 2,845,240 112,932 Zealand Pharma A/S (c) 1,821,850 7,309,271
France - 5.6% 270,250 Cellectis S.A. (c) (e) 6,486,000 65,600 DBV Technologies S.A. (c) (e) 2,310,432 300,000 Innate Pharma SA (c) 3,734,866 305,000 Sanofi (e) 13,801,250 26,332,548 Germany - 1.6% 65,300 Bayer AG 7,526,982 Ireland - 16.2% 99,000 Allergan plc 23,653,080 391,288 Avadel Pharmaceuticals plc (c) (e) 3,787,668
TEKLA WORLDHEALTHCARE FUND
SCHEDULE OF INVESTMENTSMARCH 31, 2017(Unaudited, continued)
Merrill Corp - Tekla World Healthcare Fund Semi-Annual Report [Funds] 333-202638 03-31-2017 ED [AUX] | bjasper | 23-May-17 12:12 | 17-11963-1.ca | Sequence: 3CHKSUM Content: 25150 Layout: 25585 Graphics: No Graphics CLEAN
JOB: 17-11963-1 CYCLE#;BL#: 12; 0 TRIM: 5.375" x 8.375" COMPOSITECOLORS: Black, PANTONE 306 U, ~note-color 2 GRAPHICS: none V1.5

19
The accompanying notes are an integral part of these financial statements.
SHARES Ireland - continued VALUE 248,248 Endo International plc (c) $2,770,448 162,900 Horizon Pharma plc (c) 2,407,662 74,290 Jazz Pharmaceuticals plc (c) (d) 10,781,708 61,900 Mallinckrodt plc (c) 2,758,883 216,000 Medtronic plc 17,400,960 37,300 Perrigo Company plc 2,476,347 60,513 Shire plc (e) 10,543,180 76,579,936 Israel - 3.0% 516,598 Foamix Pharmaceuticals Ltd. (c) 2,557,160 368,300 Teva Pharmaceutical Industries Ltd. (e) 11,818,747 14,375,907 Japan - 1.1% 88,000 Ono Pharmaceutical Co. Ltd. 1,821,576 35,100 Sosei Group Corporation (c) 3,430,234 5,251,810 Netherlands - 2.9% 1,405,324 Affimed N.V. (c) 3,232,245 232,352 Mylan N.V. (c) 9,059,404 241,021 uniQure N.V. (c) 1,393,101 13,684,750 Spain - 0.6% 166,000 Grifols, S.A. (e) 3,133,250 Switzerland - 7.2% 248,800 Novartis AG (e) 18,478,376 484,000 Roche Holding AG (e) 15,502,520 33,980,896 United Kingdom - 9.2% 1,069,868 Adaptimmune Therapeutics plc (c) (e) 5,894,973 463,800 AstraZeneca PLC (e) 14,442,732 6,300 Cardinal Health, Inc. 513,765 359,000 GlaxoSmithKline plc (e) 15,135,440 215,000 Hikma Pharmaceuticals PLC 5,336,291 1,282,978 Verona Pharma plc (c) 2,306,682 513,192 Verona Pharma plc, warrants
(Restricted, expiration 7/31/17) (a) (c) 42,096 43,671,979
TEKLA WORLDHEALTHCARE FUND
SCHEDULE OF INVESTMENTSMARCH 31, 2017(Unaudited, continued)
Merrill Corp - Tekla World Healthcare Fund Semi-Annual Report [Funds] 333-202638 03-31-2017 ED [AUX] | bjasper | 23-May-17 12:12 | 17-11963-1.ca | Sequence: 4CHKSUM Content: 11964 Layout: 37342 Graphics: No Graphics CLEAN
JOB: 17-11963-1 CYCLE#;BL#: 12; 0 TRIM: 5.375" x 8.375" COMPOSITECOLORS: Black, PANTONE 306 U, ~note-color 2 GRAPHICS: none V1.5
20
The accompanying notes are an integral part of these financial statements.
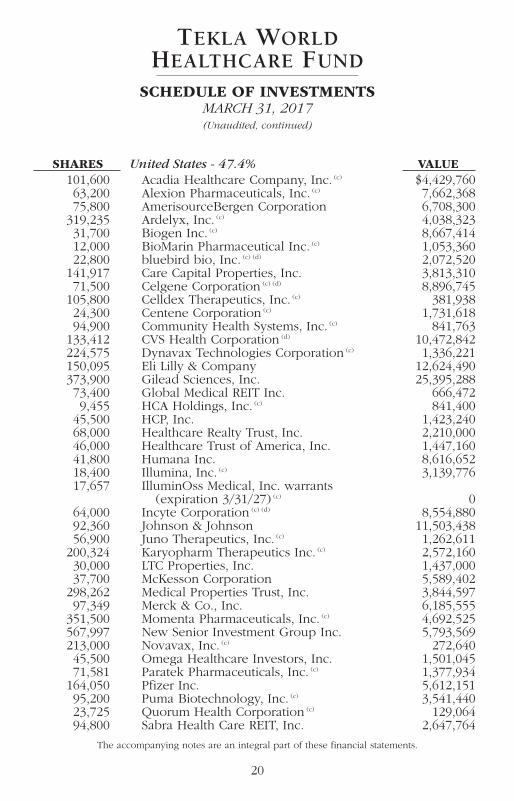
SHARES United States - 47.4% VALUE 101,600 Acadia Healthcare Company, Inc. (c) $4,429,760 63,200 Alexion Pharmaceuticals, Inc. (c) 7,662,368 75,800 AmerisourceBergen Corporation 6,708,300 319,235 Ardelyx, Inc. (c) 4,038,323 31,700 Biogen Inc. (c) 8,667,414 12,000 BioMarin Pharmaceutical Inc. (c) 1,053,360 22,800 bluebird bio, Inc. (c) (d) 2,072,520 141,917 Care Capital Properties, Inc. 3,813,310 71,500 Celgene Corporation (c) (d) 8,896,745 105,800 Celldex Therapeutics, Inc. (c) 381,938 24,300 Centene Corporation (c) 1,731,618 94,900 Community Health Systems, Inc. (c) 841,763 133,412 CVS Health Corporation (d) 10,472,842 224,575 Dynavax Technologies Corporation (c) 1,336,221 150,095 Eli Lilly & Company 12,624,490 373,900 Gilead Sciences, Inc. 25,395,288 73,400 Global Medical REIT Inc. 666,472 9,455 HCA Holdings, Inc. (c) 841,400 45,500 HCP, Inc. 1,423,240 68,000 Healthcare Realty Trust, Inc. 2,210,000 46,000 Healthcare Trust of America, Inc. 1,447,160 41,800 Humana Inc. 8,616,652 18,400 Illumina, Inc. (c) 3,139,776 17,657 IlluminOss Medical, Inc. warrants
(expiration 3/31/27) (c) 0 64,000 Incyte Corporation (c) (d) 8,554,880 92,360 Johnson & Johnson 11,503,438 56,900 Juno Therapeutics, Inc. (c) 1,262,611 200,324 Karyopharm Therapeutics Inc. (c) 2,572,160 30,000 LTC Properties, Inc. 1,437,000 37,700 McKesson Corporation 5,589,402 298,262 Medical Properties Trust, Inc. 3,844,597 97,349 Merck & Co., Inc. 6,185,555 351,500 Momenta Pharmaceuticals, Inc. (c) 4,692,525 567,997 New Senior Investment Group Inc. 5,793,569 213,000 Novavax, Inc. (c) 272,640 45,500 Omega Healthcare Investors, Inc. 1,501,045 71,581 Paratek Pharmaceuticals, Inc. (c) 1,377,934 164,050 Pfizer Inc. 5,612,151 95,200 Puma Biotechnology, Inc. (c) 3,541,440 23,725 Quorum Health Corporation (c) 129,064 94,800 Sabra Health Care REIT, Inc. 2,647,764
TEKLA WORLDHEALTHCARE FUND
SCHEDULE OF INVESTMENTSMARCH 31, 2017(Unaudited, continued)
Merrill Corp - Tekla World Healthcare Fund Semi-Annual Report [Funds] 333-202638 03-31-2017 ED [AUX] | bjasper | 23-May-17 12:12 | 17-11963-1.ca | Sequence: 5CHKSUM Content: 5259 Layout: 31541 Graphics: No Graphics CLEAN
JOB: 17-11963-1 CYCLE#;BL#: 12; 0 TRIM: 5.375" x 8.375" COMPOSITECOLORS: Black, PANTONE 306 U, ~note-color 2 GRAPHICS: none V1.5
21
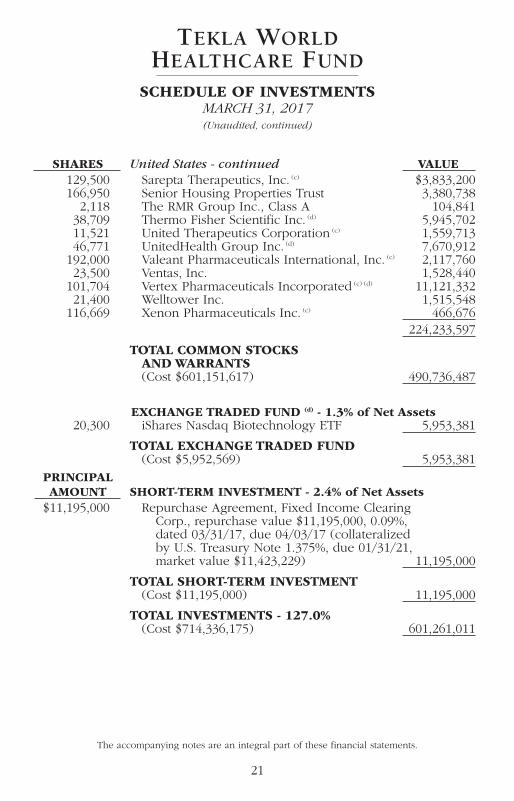
The accompanying notes are an integral part of these financial statements.
SHARES United States - continued VALUE 129,500 Sarepta Therapeutics, Inc. (c) $3,833,200 166,950 Senior Housing Properties Trust 3,380,738 2,118 The RMR Group Inc., Class A 104,841 38,709 Thermo Fisher Scientific Inc. (d) 5,945,702 11,521 United Therapeutics Corporation (c) 1,559,713 46,771 UnitedHealth Group Inc. (d) 7,670,912 192,000 Valeant Pharmaceuticals International, Inc. (c) 2,117,760 23,500 Ventas, Inc. 1,528,440 101,704 Vertex Pharmaceuticals Incorporated (c) (d) 11,121,332 21,400 Welltower Inc. 1,515,548 116,669 Xenon Pharmaceuticals Inc. (c) 466,676 224,233,597
TOTAL COMMON STOCKS AND WARRANTS(Cost $601,151,617) 490,736,487
EXCHANGE TRADED FUND (d) - 1.3% of Net Assets 20,300 iShares Nasdaq Biotechnology ETF 5,953,381 TOTAL EXCHANGE TRADED FUND
(Cost $5,952,569) 5,953,381 PRINCIPAL AMOUNT SHORT-TERM INVESTMENT - 2.4% of Net Assets $11,195,000 Repurchase Agreement, Fixed Income Clearing
Corp., repurchase value $11,195,000, 0.09%, dated 03/31/17, due 04/03/17 (collateralized by U.S. Treasury Note 1.375%, due 01/31/21, market value $11,423,229) 11,195,000
TOTAL SHORT-TERM INVESTMENT(Cost $11,195,000) 11,195,000
TOTAL INVESTMENTS - 127.0%(Cost $714,336,175) 601,261,011
TEKLA WORLDHEALTHCARE FUND
SCHEDULE OF INVESTMENTSMARCH 31, 2017(Unaudited, continued)
Merrill Corp - Tekla World Healthcare Fund Semi-Annual Report [Funds] 333-202638 03-31-2017 ED [AUX] | bjasper | 23-May-17 12:12 | 17-11963-1.ca | Sequence: 6CHKSUM Content: 40150 Layout: 19657 Graphics: No Graphics CLEAN
JOB: 17-11963-1 CYCLE#;BL#: 12; 0 TRIM: 5.375" x 8.375" COMPOSITECOLORS: Black, PANTONE 306 U, ~note-color 2 GRAPHICS: none V1.5
22
The accompanying notes are an integral part of these financial statements.
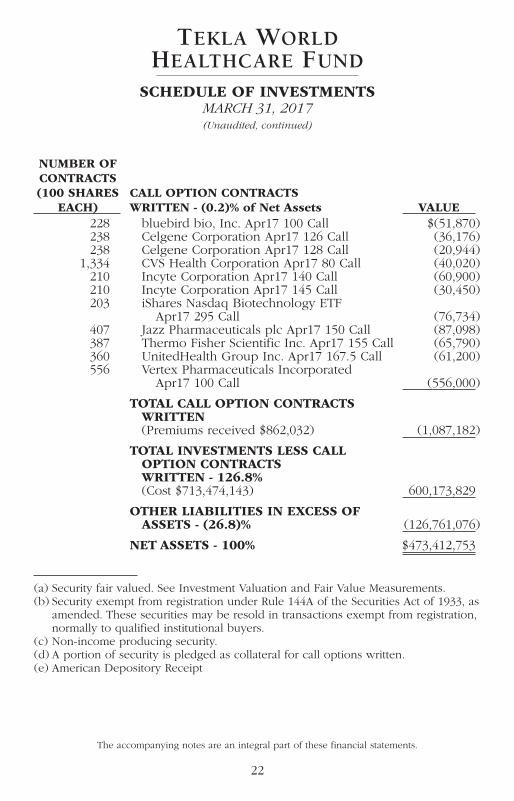
NUMBER OF CONTRACTS (100 SHARES CALL OPTION CONTRACTS EACH) WRITTEN - (0.2)% of Net Assets VALUE 228 bluebird bio, Inc. Apr17 100 Call $(51,870) 238 Celgene Corporation Apr17 126 Call (36,176) 238 Celgene Corporation Apr17 128 Call (20,944) 1,334 CVS Health Corporation Apr17 80 Call (40,020) 210 Incyte Corporation Apr17 140 Call (60,900) 210 Incyte Corporation Apr17 145 Call (30,450) 203 iShares Nasdaq Biotechnology ETF
Apr17 295 Call (76,734) 407 Jazz Pharmaceuticals plc Apr17 150 Call (87,098) 387 Thermo Fisher Scientific Inc. Apr17 155 Call (65,790) 360 UnitedHealth Group Inc. Apr17 167.5 Call (61,200) 556 Vertex Pharmaceuticals Incorporated
Apr17 100 Call (556,000) TOTAL CALL OPTION CONTRACTS
WRITTEN(Premiums received $862,032) (1,087,182)
TOTAL INVESTMENTS LESS CALL OPTION CONTRACTS WRITTEN - 126.8%(Cost $713,474,143) 600,173,829
OTHER LIABILITIES IN EXCESS OF ASSETS - (26.8)% (126,761,076)
NET ASSETS - 100% $473,412,753
(a) Security fair valued. See Investment Valuation and Fair Value Measurements.(b) Security exempt from registration under Rule 144A of the Securities Act of 1933, as
amended. These securities may be resold in transactions exempt from registration,normally to qualified institutional buyers.
(c) Non-income producing security.(d) A portion of security is pledged as collateral for call options written.(e) American Depository Receipt
TEKLA WORLDHEALTHCARE FUND
SCHEDULE OF INVESTMENTSMARCH 31, 2017(Unaudited, continued)
Merrill Corp - Tekla World Healthcare Fund Semi-Annual Report [Funds] 333-202638 03-31-2017 ED [AUX] | bjasper | 23-May-17 12:12 | 17-11963-1.ca | Sequence: 7CHKSUM Content: 5926 Layout: 33691 Graphics: No Graphics CLEAN
JOB: 17-11963-1 CYCLE#;BL#: 12; 0 TRIM: 5.375" x 8.375" COMPOSITECOLORS: Black, PANTONE 306 U, ~note-color 2 GRAPHICS: none V1.5
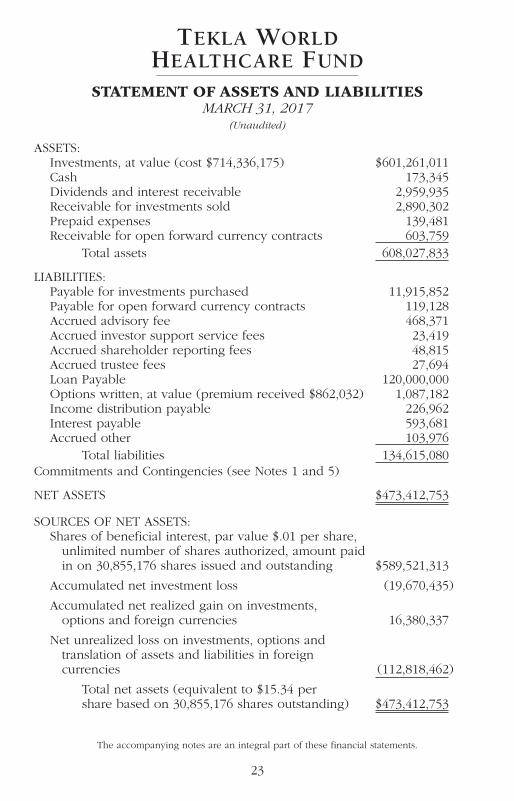
ASSETS:Investments, at value (cost $714,336,175) $601,261,011Cash 173,345Dividends and interest receivable 2,959,935Receivable for investments sold 2,890,302Prepaid expenses 139,481Receivable for open forward currency contracts 603,759
Total assets 608,027,833
LIABILITIES:Payable for investments purchased 11,915,852Payable for open forward currency contracts 119,128Accrued advisory fee 468,371Accrued investor support service fees 23,419Accrued shareholder reporting fees 48,815Accrued trustee fees 27,694Loan Payable 120,000,000Options written, at value (premium received $862,032) 1,087,182Income distribution payable 226,962Interest payable 593,681Accrued other 103,976
Total liabilities 134,615,080Commitments and Contingencies (see Notes 1 and 5)
NET ASSETS $473,412,753
SOURCES OF NET ASSETS:Shares of beneficial interest, par value $.01 per share,
unlimited number of shares authorized, amount paid in on 30,855,176 shares issued and outstanding $589,521,313
Accumulated net investment loss (19,670,435)
Accumulated net realized gain on investments, options and foreign currencies 16,380,337
Net unrealized loss on investments, options and translation of assets and liabilities in foreign currencies (112,818,462)
Total net assets (equivalent to $15.34 per share based on 30,855,176 shares outstanding) $473,412,753
The accompanying notes are an integral part of these financial statements.
TEKLA WORLDHEALTHCARE FUND
STATEMENT OF ASSETS AND LIABILITIESMARCH 31, 2017
(Unaudited)
23
Merrill Corp - Tekla World Healthcare Fund Semi-Annual Report [Funds] 333-202638 03-31-2017 ED [AUX] | bjasper | 23-May-17 12:12 | 17-11963-1.da | Sequence: 1CHKSUM Content: 19755 Layout: 1779 Graphics: No Graphics CLEAN
JOB: 17-11963-1 CYCLE#;BL#: 12; 0 TRIM: 5.375" x 8.375" COMPOSITECOLORS: Black, PANTONE 306 U, ~note-color 2 GRAPHICS: none V1.5

INVESTMENT INCOME:Dividend income (net of foreign tax of $261,759) $4,754,354Interest and other income 2,171,551
Total investment income 6,925,905
EXPENSES:Advisory fees 2,838,193Interest expense 1,099,228Investor support service fees 141,910Custodian fees 84,184Legal fees 82,564Trustees’ fees and expenses 72,793Shareholder reporting 53,439Administration fees 49,853Auditing fees 22,348Transfer agent fees 13,947Other (see Note 2) 178,977
Total expenses 4,637,436
Net investment income 2,288,469
REALIZED AND UNREALIZED GAIN (LOSS):Net realized gain (loss) on:
Investments 7,074,369Closed or expired option contracts written 4,211,147Foreign currency transactions 3,141,352
Net realized gain 14,426,868Change in unrealized appreciation (depreciation)
Investments (17,808,602)Option contracts written (801,270)Foreign currency (14,750)Forward contracts 387,322
Change in unrealized appreciation (depreciation) (18,237,300)
Net realized and unrealized gain (loss) (3,810,432)
Net decrease in net assets resulting from operations ($1,521,963)
The accompanying notes are an integral part of these financial statements.
TEKLA WORLDHEALTHCARE FUND
STATEMENT OF OPERATIONSSIX MONTHS ENDED MARCH 31, 2017
(Unaudited)
24
Merrill Corp - Tekla World Healthcare Fund Semi-Annual Report [Funds] 333-202638 03-31-2017 ED [AUX] | bjasper | 23-May-17 12:12 | 17-11963-1.da | Sequence: 2CHKSUM Content: 18336 Layout: 55362 Graphics: No Graphics CLEAN
JOB: 17-11963-1 CYCLE#;BL#: 12; 0 TRIM: 5.375" x 8.375" COMPOSITECOLORS: Black, PANTONE 306 U, ~note-color 2 GRAPHICS: none V1.5
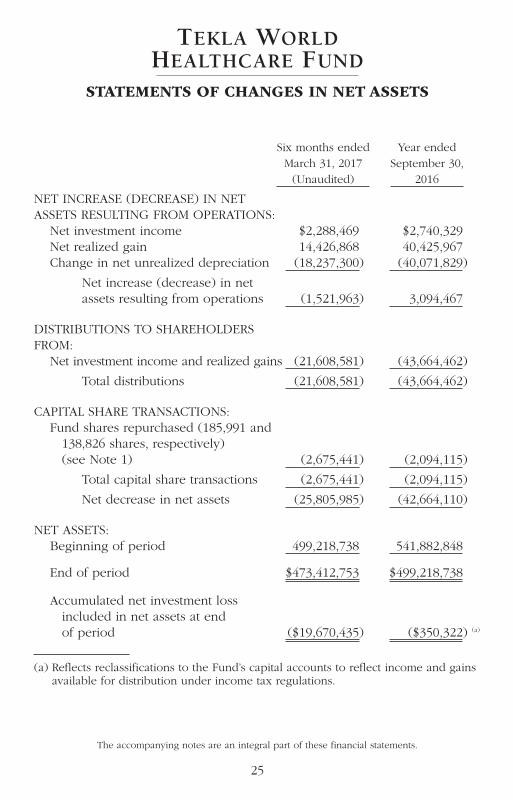
Six months ended Year ended March 31, 2017 September 30, (Unaudited) 2016 NET INCREASE (DECREASE) IN NET ASSETS RESULTING FROM OPERATIONS:
Net investment income $2,288,469 $2,740,329Net realized gain 14,426,868 40,425,967Change in net unrealized depreciation (18,237,300) (40,071,829)
Net increase (decrease) in net assets resulting from operations (1,521,963) 3,094,467
DISTRIBUTIONS TO SHAREHOLDERS FROM:
Net investment income and realized gains (21,608,581) (43,664,462) Total distributions (21,608,581) (43,664,462)
CAPITAL SHARE TRANSACTIONS:Fund shares repurchased (185,991 and
138,826 shares, respectively) (see Note 1) (2,675,441) (2,094,115)
Total capital share transactions (2,675,441) (2,094,115) Net decrease in net assets (25,805,985) (42,664,110)
NET ASSETS:Beginning of period 499,218,738 541,882,848
End of period $473,412,753 $499,218,738
Accumulated net investment loss included in net assets at end of period ($19,670,435) ($350,322) (a)
(a) Reflects reclassifications to the Fund’s capital accounts to reflect income and gainsavailable for distribution under income tax regulations.
The accompanying notes are an integral part of these financial statements.
TEKLA WORLDHEALTHCARE FUND
STATEMENTS OF CHANGES IN NET ASSETS
25
Merrill Corp - Tekla World Healthcare Fund Semi-Annual Report [Funds] 333-202638 03-31-2017 ED [AUX] | bjasper | 23-May-17 12:12 | 17-11963-1.da | Sequence: 3CHKSUM Content: 12228 Layout: 12319 Graphics: No Graphics CLEAN
JOB: 17-11963-1 CYCLE#;BL#: 12; 0 TRIM: 5.375" x 8.375" COMPOSITECOLORS: Black, PANTONE 306 U, ~note-color 2 GRAPHICS: none V1.5

CASH FLOWS FROM OPERATING ACTIVITIES:Purchases of portfolio securities ($134,161,728)Purchases to close option contracts written (834,356)Net maturities of short-term investments 8,867,000Sales of portfolio securities 144,780,468Proceeds from option contracts written 4,769,163Interest income received 2,273,430Dividend income received 3,606,728Other operating receipts (expenses paid) (4,831,857)
Net cash provided from operating activities 24,468,848
CASH FLOWS FROM FINANCING ACTIVITIES:Cash distributions paid (21,630,994)Fund shares sold (2,675,441)
Net cash used for financing activities (24,306,435)
NET INCREASE IN CASH 162,413
CASH AT BEGINNING OF YEAR 10,932
CASH AT END OF SIX MONTHS $173,345
RECONCILIATION OF NET INCREASE IN NET ASSETSRESULTING FROM OPERATIONS TO NET CASHPROVIDED FROM OPERATING ACTIVITIES:
Net decrease in net assets resulting from operations ($1,521,963)Purchases of portfolio securities (134,161,728)Purchases to close option contracts written (834,356)Net maturities of short-term investments 8,867,000Sales of portfolio securities 144,780,468Proceeds from option contracts written 4,769,163Accretion of discount (25,361)Net realized gain on investments, options and
foreign currencies (14,426,868)Decrease in net unrealized appreciation (depreciation)
on investments, options and foreign currencies 18,237,300Increase in dividends and interest receivable (1,020,386)Decrease in accrued expenses (62,745)Increase in prepaid expenses and interest payable (131,676)
Net cash provided from operating activities $24,468,848
The accompanying notes are an integral part of these financial statements.
TEKLA WORLDHEALTHCARE FUND
STATEMENT OF CASH FLOWSSIX MONTHS ENDED MARCH 31, 2017
(Unaudited)
26
Merrill Corp - Tekla World Healthcare Fund Semi-Annual Report [Funds] 333-202638 03-31-2017 ED [AUX] | bjasper | 23-May-17 12:12 | 17-11963-1.da | Sequence: 4CHKSUM Content: 5574 Layout: 52110 Graphics: No Graphics CLEAN
JOB: 17-11963-1 CYCLE#;BL#: 12; 0 TRIM: 5.375" x 8.375" COMPOSITECOLORS: Black, PANTONE 306 U, ~note-color 2 GRAPHICS: none V1.5

For the period Six months June 30, ended Year ended 2015 to March 31, 2017 September 30, September 30, (Unaudited) 2016 2015 (1)
OPERATING PERFORMANCE FOR A SHARE
OUTSTANDING THROUGHOUT EACH YEAR
Net asset value per share, beginning of period $16.08 $17.38 $19.10(2)
Net investment income (loss) (3) 0.07 0.09 (0.02)
Net realized and unrealized gain (loss) (0.12) (0.06) (1.47)
Total increase (decrease) from investment operations (0.05) 0.03 (1.49)
Distributions to shareholders from:
Income distributions to shareholders (0.70) (1.40) (0.23)
Total distributions (0.70) (1.40) (0.23)
Increase resulting from shares repurchased (3) 0.01 0.07 —
Net asset value per share, end of period $15.34 $16.08 $17.38
Per share market value, end of period $14.35 $14.68 $14.38
Total investment return at market value 2.87%* 12.34% (27.07%)*
Total investment return at net asset value 0.39%* 1.81% (7.46%)*
RATIOS
Expenses to average net assets 2.02%** 1.70% 1.32%**
Expenses, excluding interest expense, to average net assets 1.54%** 1.47% 1.32%**
Net investment income (loss) to average net assets 1.00%** 0.53% (0.37%)**
SUPPLEMENTAL DATA
Net assets at end of period (in millions) $473 $499 $542
Portfolio turnover rate 22.62%* 67.00% 58.96%*
* Not annualized.
** Annualized.
(1) Commenced operations on June 30, 2015.
(2) Net asset value beginning of period reflects a deduction of $0.90 per share sales charge from theinitial offering price of $20.00 per share.
(3) Computed using average shares outstanding.
The accompanying notes are an integral part of these financial statements.
TEKLA WORLDHEALTHCARE FUND
FINANCIAL HIGHLIGHTS
27
Merrill Corp - Tekla World Healthcare Fund Semi-Annual Report [Funds] 333-202638 03-31-2017 ED [AUX] | bjasper | 23-May-17 12:12 | 17-11963-1.ea | Sequence: 1CHKSUM Content: 57830 Layout: 31451 Graphics: No Graphics CLEAN
JOB: 17-11963-1 CYCLE#;BL#: 12; 0 TRIM: 5.375" x 8.375" COMPOSITECOLORS: Black, PANTONE 306 U, ~note-color 2 GRAPHICS: none V1.5
(1) Organization and Significant Accounting PoliciesTekla World Healthcare Fund (the Fund) is a Massachusetts business trust formed on March 5,2015 and registered under the Investment Company Act of 1940 as a non-diversified closed-end management investment company. The Fund commenced operations on June 30, 2015.The investment objective is to seek current income and long-term capital appreciation throughinvestments in U.S. and non-U.S. companies engaged in the healthcare industry (includingequity securities and debt securities). The Fund invests primarily in securities of public andprivate companies believed by the Fund’s Investment Adviser, Tekla Capital Management LLC(the Adviser), to have significant potential for above-average growth.
The preparation of these financial statements requires the use of certain estimates by manage-ment in determining the Fund’s assets, liabilities, revenues and expenses. Actual results coulddiffer from these estimates and such differences could be material. The following is a summaryof significant accounting policies followed by the Fund, which are in conformity with ac-counting principles generally accepted in the United States of America (“GAAP”). The Fund isan investment company and follows accounting and reporting guidance in the Financial Ac-counting Standards Board Accounting Standards Codification 946. Events or transactions oc-curring after March 31, 2017, through the date that the financial statements were issued, havebeen evaluated in the preparation of these financial statements.
Investment ValuationShares of publicly traded companies listed on national securities exchanges or trading in theover-the-counter market are typically valued at the last sale price, as of the close of trading,generally 4 p.m., Eastern time. The Fund holds securities or other assets that are denominatedin a foreign currency. The Fund will normally use the currency exchange rates as of 4:00 p.m.(Eastern Time) when valuing such assets. The Board of Trustees of the Fund (the “Trustees”)has established and approved fair valuation policies and procedures with respect to securitiesfor which quoted prices may not be available or which do not reflect fair value. Convertiblebonds, corporate and government bonds are valued using a third-party pricing service. Con-vertible bonds are valued using this pricing service only on days when there is no sale reported.Puts and calls generally are valued at the close of regular trading on the securities or commodi-ties exchange on which they are primarily traded. Options on securities generally are valued attheir last sale price in the case of exchange traded options or, in the case of OTC-traded options,the average of the last sale price as obtained from two or more dealers unless there is only onedealer, in which case that dealer’s price is used. Forward foreign currency contracts are valuedon the basis of the value of the underlying currencies at the prevailing forward exchange rates.Restricted securities of companies that are publicly traded are typically valued based on theclosing market quote on the valuation date adjusted for the impact of the restriction as deter-mined in good faith by the Adviser also using fair valuation policies and procedures approvedby the Trustees described below. Non-exchange traded warrants of publicly traded companiesare generally valued using the Black-Scholes model, which incorporates both observable andunobservable inputs. Short-term investments with a maturity of 60 days or less are generallyvalued at amortized cost, which approximates fair value.
Convertible preferred shares, warrants or convertible note interests in private companies, andother restricted securities, as well as shares of publicly traded companies for which marketquotations are not readily available, such as stocks for which trading has been halted or for
TEKLA WORLDHEALTHCARE FUND
NOTES TO FINANCIAL STATEMENTSMARCH 31, 2017
(Unaudited)
28
Merrill Corp - Tekla World Healthcare Fund Semi-Annual Report [Funds] 333-202638 03-31-2017 ED [AUX] | bjasper | 23-May-17 12:12 | 17-11963-1.fa | Sequence: 1CHKSUM Content: 22175 Layout: 19278 Graphics: No Graphics CLEAN
JOB: 17-11963-1 CYCLE#;BL#: 12; 0 TRIM: 5.375" x 8.375" COMPOSITECOLORS: Black, PANTONE 306 U, ~note-color 2 GRAPHICS: none V1.5

which there are no current day sales, or which do not reflect fair value, are typically valuedin good faith, based upon the recommendations made by the Adviser pursuant to fair valuationpolicies and procedures approved by the Trustees.
The Adviser has a Valuation Sub-Committee comprised of senior management which reportsto the Valuation Committee of the Board at least quarterly. Each fair value determination isbased on a consideration of relevant factors, including both observable and unobservable in-puts. Observable and unobservable inputs the Adviser considers may include (i) the existenceof any contractual restrictions on the disposition of securities; (ii) information obtained fromthe company, which may include an analysis of the company’s financial statements, the com-pany’s products or intended markets or the company’s technologies; (iii) the price of the sameor similar security negotiated at arm’s length in an issuer’s completed subsequent round of fi-nancing; (iv) the price and extent of public trading in similar securities of the issuer or ofcomparable companies; or (v) a probability and time value adjusted analysis of contractualterms. Where available and appropriate, multiple valuation methodologies are applied to con-firm fair value. Significant unobservable inputs identified by the Adviser are often used in thefair value determination. A significant change in any of these inputs may result in a significantchange in the fair value measurement. Due to the uncertainty inherent in the valuation process,such estimates of fair value may differ significantly from the values that would have beenused had a ready market for the investments existed, and differences could be material. Addi-tionally, changes in the market environment and other events that may occur over the life ofthe investments may cause the gains or losses ultimately realized on these investments to bedifferent from the valuations used at the date of these financial statements.
Options on SecuritiesAn option contract is a contract in which the writer (seller) of the option grants the buyer ofthe option, upon payment of a premium, the right to purchase from (call option) or sell to (putoption) the writer a designated instrument at a specified price within a specified period oftime. Certain options, including options on indices, will require cash settlement by the Fund ifthe option is exercised. The Fund enters into option contracts in order to hedge against potentialadverse price movements in the value of portfolio assets, as a temporary substitute for sellingselected investments, to lock in the purchase price of a security or currency which it expectsto purchase in the near future, as a temporary substitute for purchasing selected investments,or to enhance potential gain or to gain or hedge exposure to financial market risk.
The Fund’s obligation under an exchange traded written option or investment in an exchange-traded purchased option is valued at the last sale price or in the absence of a sale, the meanbetween the closing bid and asked prices. Gain or loss is recognized when the option contractexpires, is exercised or is closed.
If the Fund writes a covered call option, the Fund foregoes, in exchange for the premium, theopportunity to profit during the option period from an increase in the market value of the un-derlying security above the exercise price. If the Fund writes a put option it accepts the riskof a decline in the market value of the underlying security below the exercise price. Over-the-counter options have the risk of the potential inability of counterparties to meet the terms oftheir contracts. The Fund’s maximum exposure to purchased options is limited to the premiuminitially paid. In addition, certain risks may arise upon entering into option contracts includingthe risk that an illiquid secondary market will limit the Fund’s ability to close out an option
TEKLA WORLDHEALTHCARE FUND
NOTES TO FINANCIAL STATEMENTSMARCH 31, 2017
(continued)
29
Merrill Corp - Tekla World Healthcare Fund Semi-Annual Report [Funds] 333-202638 03-31-2017 ED [AUX] | bjasper | 23-May-17 12:12 | 17-11963-1.fa | Sequence: 2CHKSUM Content: 35420 Layout: 12201 Graphics: No Graphics CLEAN
JOB: 17-11963-1 CYCLE#;BL#: 12; 0 TRIM: 5.375" x 8.375" COMPOSITECOLORS: Black, PANTONE 306 U, ~note-color 2 GRAPHICS: none V1.5
contract prior to the expiration date and that a change in the value of the option contract maynot correlate exactly with changes in the value of the securities or currencies hedged.
All options on securities and securities indices written by the Fund are required to be covered.When the Fund writes a call option, this means that during the life of the option the Fund mayown or have the contractual right to acquire the securities subject to the option or may maintainwith the Fund’s custodian in a segregated account appropriate liquid securities in an amount atleast equal to the market value of the securities underlying the option. When the Fund writes aput option, this means that the Fund will maintain with the Fund’s custodian in a segregated ac-count appropriate liquid securities in an amount at least equal to the exercise price of the option.
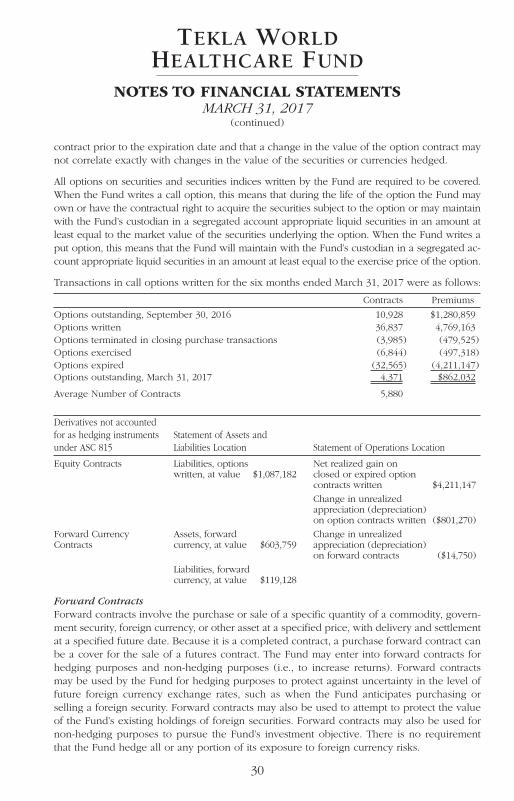
Transactions in call options written for the six months ended March 31, 2017 were as follows:
Contracts Premiums
Options outstanding, September 30, 2016 10,928 $1,280,859Options written 36,837 4,769,163Options terminated in closing purchase transactions (3,985) (479,525)Options exercised (6,844) (497,318)Options expired (32,565) (4,211,147) Options outstanding, March 31, 2017 4,371 $862,032 Average Number of Contracts 5,880
Derivatives not accounted for as hedging instruments Statement of Assets and under ASC 815 Liabilities Location Statement of Operations Location
Equity Contracts Liabilities, options Net realized gain onwritten, at value $1,087,182 closed or expired option
contracts written $4,211,147
Change in unrealizedappreciation (depreciation)on option contracts written ($801,270)
Forward Currency Assets, forward Change in unrealizedContracts currency, at value $603,759 appreciation (depreciation)
on forward contracts ($14,750)
Liabilities, forwardcurrency, at value $119,128
Forward ContractsForward contracts involve the purchase or sale of a specific quantity of a commodity, govern-ment security, foreign currency, or other asset at a specified price, with delivery and settlementat a specified future date. Because it is a completed contract, a purchase forward contract canbe a cover for the sale of a futures contract. The Fund may enter into forward contracts forhedging purposes and non-hedging purposes (i.e., to increase returns). Forward contractsmay be used by the Fund for hedging purposes to protect against uncertainty in the level offuture foreign currency exchange rates, such as when the Fund anticipates purchasing orselling a foreign security. Forward contracts may also be used to attempt to protect the valueof the Fund’s existing holdings of foreign securities. Forward contracts may also be used fornon-hedging purposes to pursue the Fund’s investment objective. There is no requirementthat the Fund hedge all or any portion of its exposure to foreign currency risks.
TEKLA WORLDHEALTHCARE FUND
NOTES TO FINANCIAL STATEMENTSMARCH 31, 2017
(continued)
30
Merrill Corp - Tekla World Healthcare Fund Semi-Annual Report [Funds] 333-202638 03-31-2017 ED [AUX] | bjasper | 23-May-17 12:12 | 17-11963-1.fa | Sequence: 3CHKSUM Content: 2085 Layout: 41128 Graphics: No Graphics CLEAN
JOB: 17-11963-1 CYCLE#;BL#: 12; 0 TRIM: 5.375" x 8.375" COMPOSITECOLORS: Black, PANTONE 306 U, ~note-color 2 GRAPHICS: none V1.5

The following forward contracts were held as of March 31, 2017:
Settlement Settlement Current UnrealizedDescription Counterparty Date Currency Value Value Gain/(Loss)
Contracts Sold:
Australian Dollar Goldman Sachs Bank 04/28/17 4,723,770 AUD $3,607,543 $3,607,404 $139
British Pound Goldman Sachs Bank 04/28/17 15,092,856 GBP 18,801,322 18,920,450 (119,128)
Danish Krone Goldman Sachs Bank 04/28/17 17,494,092 DKK 2,544,299 2,511,506 32,793
Euro Goldman Sachs Bank 04/28/17 28,898,130 EUR 31,269,222 30,861,683 407,539
Isreali Sheqel Goldman Sachs Bank 04/28/17 27,527,380 ILS 7,617,084 7,604,634 12,450
Japanese Yen Goldman Sachs Bank 04/28/17 437,550,349 JPY 3,943,440 3,933,552 9,888
Swiss Franc Goldman Sachs Bank 04/28/17 15,794,935 CHF 15,931,628 15,790,678 140,950 $83,229,907 $484,631
Average Notional Amount of Forward Contracts $81,964,115
Investment Transactions and IncomeInvestment transactions are recorded on a trade date basis. Gains and losses from sales of in-vestments are recorded using the identified cost method. Interest income is recorded on theaccrual basis, adjusted for amortization of premiums and accretion of discounts. Dividend in-come is recorded on the ex-dividend date, less any foreign taxes withheld. Upon notificationfrom issuers, some of the dividend income received may be redesignated as a reduction ofcost of the related investment if it represents a return of capital.
The aggregate cost of purchases and proceeds from sales of investment securities (other thanshort-term investments) for the six months ended March 31, 2017 totaled $129,169,704 and$139,832,806, respectively.
Repurchase AgreementsIn managing short-term investments the Fund may from time to time enter into transactions inrepurchase agreements. In a repurchase agreement, the Fund’s custodian takes possession ofthe underlying collateral securities from the counterparty, the market value of which is at leastequal to the principal, including accrued interest, of the repurchase transaction at all times. Inthe event of default or bankruptcy by the other party to the agreement, realization and/or re-tention of the collateral by the Fund may be delayed. The Fund may enter into repurchasetransactions with any broker, dealer, registered clearing agency or bank. Repurchase agreementtransactions are not counted for purposes of the limitations imposed on the Fund’s investmentin debt securities.
Distribution PolicyPursuant to a Securities and Exchange Commission exemptive order the Fund may make pe-riodic distributions that include capital gains as frequently as 12 times in any one taxable yearin respect of its common shares, and the Fund has implemented a managed distribution policy(the Policy) providing for monthly distributions at a rate set by the Board of Trustees. Underthe current Policy, the Fund intends to make monthly distributions at a rate of $0.1167 pershare to shareholders of record. If taxable income and net long-term realized gains exceedthe amount required to be distributed under the Policy, the Fund will at a minimum make dis-tributions necessary to comply with the requirements of the Internal Revenue Code. The Policy
TEKLA WORLDHEALTHCARE FUND
NOTES TO FINANCIAL STATEMENTSMARCH 31, 2017
(continued)
31
Merrill Corp - Tekla World Healthcare Fund Semi-Annual Report [Funds] 333-202638 03-31-2017 ED [AUX] | bjasper | 23-May-17 12:12 | 17-11963-1.fa | Sequence: 4CHKSUM Content: 8349 Layout: 13283 Graphics: No Graphics CLEAN
JOB: 17-11963-1 CYCLE#;BL#: 12; 0 TRIM: 5.375" x 8.375" COMPOSITECOLORS: Black, PANTONE 306 U, ~note-color 2 GRAPHICS: none V1.5

has been established by the Trustees and may be changed by them without shareholder approval. The Trustees regularly review the Policy and the frequency and distribution rateconsidering the purpose and effect of the Policy, the financial market environment, and theFund’s income, capital gains and capital available to pay distributions.
Share Repurchase ProgramIn March 2017, the Trustees approved the renewal of the share repurchase program to allow theFund to purchase in the open market up to 7% of its outstanding common shares for a sevenmonth period ending July 14, 2018. Prior to this renewal, in December 2016, the Trustees ap-proved the renewal of the share repurchase program to allow the Fund to repurchase up to 12%of its outstanding shares for a one year period ending December 14, 2017. The share repurchaseprogram is intended to enhance shareholder value and potentially reduce the discount betweenthe market price of the Fund’s shares and the Fund’s net asset value.
During the six months ended March 31, 2017 and the Fund repurchased 185,991 shares at atotal cost of $2,675,441. The weighted average discount per share between the cost of repur-chase and net asset value applicable to such shares at the date of repurchase was 5.80%.
During the year ended September 30, 2016, the Fund repurchased 138,826 shares at a totalcost of $2,094,115. The weighted average discount per share between the cost of repurchaseand net asset value applicable to such shares at the date of repurchase was 8.54%.
Federal TaxesIt is the Fund’s policy to comply with the requirements of the Internal Revenue Code applicableto regulated investment companies and to distribute to its shareholders substantially all of itstaxable income and its net realized capital gains, if any. Therefore, no Federal income orexcise tax provision is required.
As of March 31, 2017, the Fund had no uncertain tax positions that would require financialstatement recognition or disclosure. The Fund’s federal tax returns are subject to examinationby the Internal Revenue Service for a period of three years.
DistributionsThe Fund records all distributions to shareholders on the ex-dividend date. Such distributionsare determined in conformity with income tax regulations, which may differ from GAAP. Thesedifferences include temporary and permanent differences from losses on wash sale transac-tions, installment sale adjustments and ordinary loss netting to reduce short term capital gains.Reclassifications are made to the Fund’s capital accounts to reflect income and gains availablefor distribution under income tax regulations.
Statement of Cash FlowsThe cash amount shown in the Statement of Cash Flows is the amount included in the Fund’sStatement of Assets and Liabilities and represents cash on hand at March 31, 2017.
Commitments and ContingenciesUnder the Fund’s organizational documents, its officers and Trustees may be indemnifiedagainst certain liabilities and expenses arising out of the performance of their duties to theFund. Additionally, in the normal course of business, the Fund enters into agreements withservice providers that may contain indemnification clauses. The Fund’s maximum exposure
TEKLA WORLDHEALTHCARE FUND
NOTES TO FINANCIAL STATEMENTSMARCH 31, 2017
(continued)
32
Merrill Corp - Tekla World Healthcare Fund Semi-Annual Report [Funds] 333-202638 03-31-2017 ED [AUX] | bjasper | 23-May-17 12:12 | 17-11963-1.fa | Sequence: 5CHKSUM Content: 5830 Layout: 38398 Graphics: No Graphics CLEAN
JOB: 17-11963-1 CYCLE#;BL#: 12; 0 TRIM: 5.375" x 8.375" COMPOSITECOLORS: Black, PANTONE 306 U, ~note-color 2 GRAPHICS: none V1.5
under these agreements is unknown as this would involve future claims that may be madeagainst the Fund that have not yet occurred. However, based on experience, the Fund expectsthe risk of loss to be remote.
Loan PayableThe Fund maintains a $125,000,000 line of credit with the Bank of Nova Scotia (the “Line ofCredit”) which expires on January 3, 2018. As of March 31, 2017, the Fund had drawn down$120,000,000 from the Line of Credit, which was the maximum borrowing outstanding during theperiod. The Fund is charged interest at the rate of 0.70% above the relevant LIBOR rate adjustedby the Statutory Reserve Rate for borrowing (per annum). The Fund is also charged a commitmentfee on the daily unused balance of the line of credit at the rate of 0.10% (per annum). Per theLine of Credit agreement, the Fund paid an upfront fee of 0.10% on the total line of credit balance,which is being amortized through January 4, 2018. The Fund pledges its investment securities asthe collateral for the line of credit per the terms of the agreement. The weighted average interestrate and the average outstanding loan payable for the period from October 1, 2016 to March 31,2017 were 1.7769% and $120,000,000, respectively. The stated carrying amount of the line ofcredit approximates its fair value based upon the short term nature of the borrowings and the in-terest rates being based upon the market terms. The borrowings under the line of credit wouldbe considered as Level 2 in the fair value hierarchy (See Note 3) at March 31, 2017.
Investor Support ServicesThe Fund has retained Destra Capital Investment LLC to provide investor support services inconnection with the ongoing operation of the Fund. The Fund will pay Destra a fee in an an-nual amount equal to (i) 0.12% of the average aggregate daily value of the Fund’s ManagedAssets from June, 2015 to June 30, 2016 and (ii) 0.05% of the average aggregate daily value ofthe Fund’s Managed Assets from June 30, 2016 through the remaining term of the investorsupport services agreement.
(2) Investment Advisory and Other Affiliated FeesThe Fund has entered into an Investment Advisory Agreement (the Advisory Agreement) withthe Adviser. Pursuant to the terms of the Advisory Agreement, the Fund pays the Adviser amonthly fee at the rate when annualized of 1.00% of the average daily value of the Fund’sManaged Assets. Managed Assets means the total assets of the Fund minus the Fund’s liabilitiesother than the loan payable.
The Fund has entered into a Services Agreement (the Agreement) with the Adviser. Pursuantto the terms of the Agreement, the Fund reimburses the Adviser for certain services related toa portion of the payment of salary and provision of benefits to the Fund’s Chief ComplianceOfficer. During the six months ended March 31, 2017, these payments amounted to $22,823and are included in the Other category of expenses in the Statement of Operations, togetherwith insurance and other expenses incurred to unaffiliated entities. Expenses incurred pursuantto the Agreement as well as certain expenses paid for by the Adviser are allocated to the Fundin an equitable fashion as approved by the Trustees or officers of the Fund who are alsoofficers of the Adviser.
The Fund pays compensation to Independent Trustees in the form of a retainer, attendance fees,and additional compensation to Board and Committee chairpersons. The Fund does not paycompensation directly to Trustees or officers of the Fund who are also officers of the Adviser.
TEKLA WORLDHEALTHCARE FUND
NOTES TO FINANCIAL STATEMENTSMARCH 31, 2017
(continued)
33
Merrill Corp - Tekla World Healthcare Fund Semi-Annual Report [Funds] 333-202638 03-31-2017 ED [AUX] | bjasper | 23-May-17 12:12 | 17-11963-1.fa | Sequence: 6CHKSUM Content: 12554 Layout: 21509 Graphics: No Graphics CLEAN
JOB: 17-11963-1 CYCLE#;BL#: 12; 0 TRIM: 5.375" x 8.375" COMPOSITECOLORS: Black, PANTONE 306 U, ~note-color 2 GRAPHICS: none V1.5

(3) Fair Value MeasurementsThe Fund uses a three-tier hierarchy to prioritize the assumptions, referred to as inputs, usedin valuation techniques to measure fair value. The three-tier hierarchy of inputs is summarizedin the three broad levels. Level 1 includes quoted prices in active markets for identical invest-ments. Level 2 includes prices determined using other significant observable inputs (includingquoted prices for similar investments, interest rates, credit risk, etc.). The independent pricingvendor may value bank loans and debt securities at an evaluated bid price by employingmethodologies designed to identify the market value for such securities and such securitiesare considered Level 2 in the fair value hierarchy. Level 3 includes prices determined usingsignificant unobservable inputs (including the Fund’s own assumptions in determining thefair value of investments). These inputs or methodology used for valuing securities are notnecessarily an indication of the risk associated with investing in those securities.
The following is a summary of the inputs used as of March 31, 2017 to value the Fund’s netassets. For the six months ended March 31, 2017, there were no transfers between Levels 1, 2and 3. The Fund accounts for transfers between levels at the beginning of the period.
Assets at Value Level 1 Level 2 Level 3 Total
Convertible Notes United States — — $70,629 $70,629
Non-Convertible Notes Ireland — $6,709,500 — 6,709,500United Kingdom — 4,027,520 — 4,027,520United States — 74,876,039 — 74,876,039
Convertible Preferred United States — — 3,653,455 3,653,455
Mandatory Convertible Preferred Stock Israel $4,039,000 — — 4,039,000
Common Stocks and Warrants Australia 5,576,027 — — 5,576,027Belgium 25,875,024 — — 25,875,024China 3,204,510 — — 3,204,510Denmark 7,309,271 — — 7,309,271France 26,332,548 — — 26,332,548Germany 7,526,982 — — 7,526,982Ireland 76,579,936 — — 76,579,936Israel 14,375,907 — — 14,375,907Japan 5,251,810 — — 5,251,810Netherlands 13,684,750 — — 13,684,750Spain 3,133,250 — — 3,133,250Switzerland 33,980,896 — — 33,980,896United Kingdom 43,629,883 — 42,096 43,671,979United States 224,233,597 — — 224,233,597
Exchange Traded Fund 5,953,381 — — 5,953,381
Short-term Investment — 11,195,000 — 11,195,000 Total $500,686,772 $96,808,059 $3,766,180 $601,261,011
TEKLA WORLDHEALTHCARE FUND
NOTES TO FINANCIAL STATEMENTSMARCH 31, 2017
(continued)
34
Merrill Corp - Tekla World Healthcare Fund Semi-Annual Report [Funds] 333-202638 03-31-2017 ED [AUX] | bjasper | 23-May-17 12:12 | 17-11963-1.fa | Sequence: 7CHKSUM Content: 5752 Layout: 12555 Graphics: No Graphics CLEAN
JOB: 17-11963-1 CYCLE#;BL#: 12; 0 TRIM: 5.375" x 8.375" COMPOSITECOLORS: Black, PANTONE 306 U, ~note-color 2 GRAPHICS: none V1.5

The following is a reconciliation of Level 3 assets for which significant unobservable inputswere used to determine fair value.
Net realized gain (loss) Net and change Cost of Proceeds transfers Balance Balance as of in unrealized purchases from in as of September 30, appreciation and sales and (out of) March 31,Level 3 Assets 2016 (depreciation) conversions conversions Level 3 2017
Convertible Notes United States $0 $0 $70,629 $0 $0 $70,629
Convertible Preferred United States 2,916,063 (618) 738,010 0 0 3,653,455
Common Stocks and Warrants 0United Kingdom 88,800 (47,652) 948 0 0 42,096
Total $3,004,863 ($48,270) $809,587 $0 $0 $3,766,180 Net change in unrealized appreciation (depreciation) from
investments still held as of March 31, 2017 ($48,270)
The following is a quantitative disclosure about significant unobservable inputs used in thedetermination of the fair value of Level 3 assets.
Fair Value at Range March 31, 2017 Valuation Technique Unobservable Input (Weighted Average)
Private Companies and Other Restricted $42,096 Income approach, Discount for lack 80% (80%)Securities Black-Scholes of marketability
3,724,084 Probability–weighted Discount rate 17.37%-56.30% (33.79%) expected return model Price to sales 1.56-19.93 (8.94) multiple
$3,766,180
(4) Private Companies and Other Restricted SecuritiesThe Fund may invest in private companies and other restricted securities if these securitieswould currently comprise 10% or less of Managed Assets. The value of these securities repre-sented 1% of the Fund’s Managed Assets at March 31, 2017.
The following table details the acquisition date, cost, carrying value per unit, and value of theFund’s private companies and other restricted securities at March 31, 2017. The Fund on itsown does not have the right to demand that such securities be registered.
Acquisition Carrying Value Security (#) Date Cost per Unit Value
BioClin Therapeutics, Inc. Series A Cvt. Pfd 1/19/16, 10/24/16 $850,559 $0.65 $849,999Series B Cvt. Pfd 3/3/17 377,777 0.75 377,777
GenomeDx Biosciences, Inc. Series C Cvt. Pfd 2/22/16 2,001,569 1.50 2,000,000
TEKLA WORLDHEALTHCARE FUND
NOTES TO FINANCIAL STATEMENTSMARCH 31, 2017
(continued)
35
Merrill Corp - Tekla World Healthcare Fund Semi-Annual Report [Funds] 333-202638 03-31-2017 ED [AUX] | bjasper | 23-May-17 12:12 | 17-11963-1.fa | Sequence: 8CHKSUM Content: 37953 Layout: 24331 Graphics: No Graphics CLEAN
JOB: 17-11963-1 CYCLE#;BL#: 12; 0 TRIM: 5.375" x 8.375" COMPOSITECOLORS: Black, PANTONE 306 U, ~HTML color, ~note-color 2, ~watermark GRAPHICS: none V1.5

Acquisition Carrying Value Security (#) Date Cost per Unit Value
IlluminOss Medical, Inc. Series AA Cvt. Pfd 1/21/16 $152,275 $1.00 $219,196Junior Preferred Cvt. Pfd 1/21/16 70,289 1.00 206,483Cvt. Promissory Note 3/28/17 70,629 100.00 70,629
Verona Pharma plc Warrants (expiration 7/31/17) 7/28/16 1,829 0.08 42,096
$3,524,927 $3,766,180
(#) See Schedule of Investments and corresponding footnotes for more information on each issuer.
TEKLA WORLDHEALTHCARE FUND
NOTES TO FINANCIAL STATEMENTSMARCH 31, 2017
(continued)
36
Merrill Corp - Tekla World Healthcare Fund Semi-Annual Report [Funds] 333-202638 03-31-2017 ED [AUX] | bjasper | 23-May-17 12:12 | 17-11963-1.fa | Sequence: 9CHKSUM Content: 4414 Layout: 51643 Graphics: No Graphics CLEAN
JOB: 17-11963-1 CYCLE#;BL#: 12; 0 TRIM: 5.375" x 8.375" COMPOSITECOLORS: Black, PANTONE 306 U, ~note-color 2 GRAPHICS: none V1.5

The Investment Advisory Agreement (the Advisory Agreement) between the Fund and theAdviser provides that the Advisory Agreement will continue in effect so long as its continu-ance is approved at least annually by (i) the Trustees of the Fund or the shareholders byaffirmative vote of a majority of the outstanding shares and (ii) a majority of the Trustees ofthe Fund who are not interested persons (the Independent Trustees), by vote cast in personat a meeting called for the purpose of voting on such approval.
After considering the matter in a meeting held on March 23, 2017, the Board, and theIndependent Trustees voting separately, determined that the terms of the Advisory Agreementare fair and reasonable and approved the continuance of the Advisory Agreement as being inthe best interests of the Fund and its shareholders. In making its determination, the Boardconsidered materials that were specifically prepared by the Adviser at the request of the Boardand Fund counsel for purposes of the contract review process, including comparisons of (i) theFund’s performance to its primary benchmark, the S&P Global 1200® Health Care Index (SGH),and to other investment companies, (ii) the Fund’s expenses and expense ratios to those of apeer group of other investment companies, and (iii) the Adviser’s profitability with respect toits services for the Fund to the profitability of other investment advisers. The Trustees tookinto account that the Adviser presently provides investment management services only to theFund and to Tekla Life Sciences Investors, Tekla Healthcare Investors and Tekla HealthcareOpportunities Fund and does not derive any significant benefit from its relationship with theFund other than receipt of advisory fees pursuant to the Advisory Agreement, market researchand potential marketing exposure for the Adviser. The Board also received and reviewed infor-mation throughout the year about the portfolio performance, the investment strategy, the portfolio management team and the fees and expenses of the Fund.
In approving the Advisory Agreement, the Board considered, among other things, the nature,extent, and quality of the services to be provided by the Adviser, the investment performanceof the Fund and the Adviser, the costs of services provided and profits realized by the Adviserand its affiliates, and whether fee levels reflect any economies of scale for the benefit of Fundshareholders and the extent to which economies of scale would be realized as the Fundgrows. The Board reviewed information about the foregoing factors and considered changes,if any, in such information since its previous approval. The Board also evaluated the financialstrength of the Adviser and the capability of the personnel of the Adviser, specifically thestrength and background of its investment analysts. Fund counsel provided the Board withthe statutory and regulatory requirements for approval and disclosure of investment advisoryagreements. The Board, including the Independent Trustees, evaluated all of the foregoingand, considering all factors together, determined in the exercise of its business judgment thatthe continuance of the Advisory Agreement is in the best interests of the Fund and its share-holders. The following provides more detail on certain factors considered by the Trusteesand the Board’s conclusions with respect to each such factor.
The nature, extent and quality of the services to be provided by the Adviser. On a regular basisthe Board considers the roles and responsibilities of the Adviser as a whole, along with spe-cific portfolio management, support and trading functions the Adviser provides to the Fund.The Trustees considered the nature, extent and quality of the services provided by the Adviserto the Fund. The Trustees continue to be satisfied with the quality and value of the investmentadvisory services provided to the Fund by the Adviser, and, in particular, the managementstyle and discipline followed by the Adviser and the quality of the Adviser’s research, trading,portfolio management, compliance and administrative personnel. The Trustees also took intoaccount the Adviser’s significant investment in its business through the addition of portfoliomanagement and administrative staff in recent years and the Adviser’s commitment to con-tinue to build out its infrastructure as future circumstances require.
TEKLA WORLDHEALTHCARE FUND
INVESTMENT ADVISORY AGREEMENT APPROVAL
37
Merrill Corp - Tekla World Healthcare Fund Semi-Annual Report [Funds] 333-202638 03-31-2017 ED [AUX] | bjasper | 23-May-17 12:12 | 17-11963-1.ga | Sequence: 1CHKSUM Content: 44436 Layout: 1497 Graphics: No Graphics CLEAN
JOB: 17-11963-1 CYCLE#;BL#: 12; 0 TRIM: 5.375" x 8.375" COMPOSITECOLORS: Black, PANTONE 306 U, ~note-color 2 GRAPHICS: none V1.5

The investment performance of the Fund and the Adviser. On a regular basis the Board reviewsperformance information for the Fund and discusses the Fund’s investment strategy with theAdviser. The Trustees reviewed performance information for the Fund and, in particular, per-formance information for the past one-year period; comparisons of the Fund’s performanceto its benchmark, the SGH and other investment companies; and information relating to theperformance of the Fund’s venture capital portfolio. The Trustees noted that the performanceinformation reviewed reflects a view only of the Fund’s performance as of a certain date,and that the results might be significantly different if a different date is selected to generatethe performance information.
In considering the Fund’s relative performance, the Trustees noted that, although an inde-pendent service provider had been engaged to help identify the appropriate benchmark andpeer group for the Fund, the Fund’s unique strategy presents challenges when comparingthe Fund’s performance to a single benchmark or a peer group, as no single benchmark orfund within the peer group contains this same strategy. In particular, the Trustees noted thatthe Fund employs a growth and income investment strategy, which requires for the Fund toseek to generate income by investing in income producing securities (such as convertibledebt) and writing call options intended to generate current income based on the option pre-miums. The Trustees observed that neither the Fund’s primary benchmark (the SGH) nor thefunds included in the Fund’s peer group have similar exposures seeking income generation.In light of these differences, the Trustees recognized the more limited usefulness of theseperformance comparisons for the Fund.
With respect to the performance of the Fund against its primary benchmark, the Trusteesnoted that the performance of the benchmark has exceeded the Fund’s returns measured bynet asset value over the reported one-year period. With respect to the net asset value per-formance of the Fund against a peer group, the Trustees noted that the Fund lagged its peergroup for the one-year period, but the Trustees also noted that the Fund had been in oper-ations only since June 30, 2015.
The Trustees continue to be satisfied with the investment performance of the Fund and theAdviser, including the use of leverage.
The costs of services to be provided and profits to be realized by the Adviser from its relationshipwith the Fund. The Trustees considered the various services provided by the Adviser to theFund and reviewed comparative information regarding the expenses and expense ratios ofthe Fund and a peer group of other investment companies. The Trustees noted that theAdviser’s fees are within the range of fees presented in the comparative information andnoted that a portion of the Fund’s investment portfolio is invested in venture and restrictedsecurities, a portfolio management service that can warrant higher management fees thanthose charged by the Adviser pursuant to the Advisory Agreement. The Trustees also consid-ered financial information provided by the Adviser, including financial statements of theAdviser and a comparison of the Adviser’s profitability with respect to its services for theFund to the profitability of other investment advisers. Based on the information provided toand evaluated by the Trustees, the Trustees concluded that the fees charged by the Adviserare fair and reasonable in light of the quality and nature of the services provided by theAdviser and that the profitability of the Adviser’s relationship with the Fund has not beenexcessive. The fees charged by the Adviser are within a reasonable range of fees as comparedto fees charged by other investment advisers, and the services provided by the Adviser andthe amounts paid under the Advisory Agreement are sufficiently favorable in comparison tothe services rendered and fees charged by others for similar services to warrant a findingthat fees to be paid by the Fund are fair.
TEKLA WORLDHEALTHCARE FUND
INVESTMENT ADVISORY AGREEMENT APPROVAL(continued)
38
Merrill Corp - Tekla World Healthcare Fund Semi-Annual Report [Funds] 333-202638 03-31-2017 ED [AUX] | bjasper | 23-May-17 12:12 | 17-11963-1.ga | Sequence: 2CHKSUM Content: 61072 Layout: 31090 Graphics: No Graphics CLEAN
JOB: 17-11963-1 CYCLE#;BL#: 12; 0 TRIM: 5.375" x 8.375" COMPOSITECOLORS: Black, PANTONE 306 U, ~note-color 2 GRAPHICS: none V1.5

Whether fee levels reflect economies of scale and the extent to which economies of scale wouldbe realized as the Fund grows. The Trustees considered the advisory fee schedule in theAdvisory Agreement and noted that it does not provide for breakpoints that might reducethe effective fee to the extent that the Fund’s net assets should increase. The Trustees deter-mined that, given the closed-end structure of the Fund and the fact that the Fund has no cur-rent plans to seek additional assets beyond maintaining its dividend reinvestment plan andany significant growth in its assets generally will occur through appreciation in the value ofthe Fund’s investment portfolio (rather than sales of additional shares in the Fund), the Fund’sadvisory fee schedule is satisfactory and fair.
TEKLA WORLDHEALTHCARE FUND
INVESTMENT ADVISORY AGREEMENT APPROVAL(continued)
39
Merrill Corp - Tekla World Healthcare Fund Semi-Annual Report [Funds] 333-202638 03-31-2017 ED [AUX] | bjasper | 23-May-17 12:12 | 17-11963-1.ga | Sequence: 3CHKSUM Content: 12641 Layout: 1497 Graphics: No Graphics CLEAN
JOB: 17-11963-1 CYCLE#;BL#: 12; 0 TRIM: 5.375" x 8.375" COMPOSITECOLORS: Black, PANTONE 306 U, ~note-color 2 GRAPHICS: none V1.5

PRIVACY NOTICE: If you are a registered shareholder of the Fund, the Fund and TeklaCapital Management LLC, the Fund’s investment adviser, may receive nonpublic personalinformation about you from the information collected by the transfer agent from your trans-actions in Fund shares. Any nonpublic personal information is not disclosed to third parties,except as permitted or required by law. In connection with servicing your account and effect-ing transactions, the information received may be shared with the investment adviser andnon-affiliates, including transfer agents, custodians or other service companies. Access toyour nonpublic personal information is restricted to employees who need to know that infor-mation to provide products or services to you. To maintain the security of your nonpublicpersonal information, physical, electronic, and procedural safeguards are in place that complywith federal standards. The policies and practices described above apply to both current andformer shareholders.
If your Fund shares are held in “street name” at a bank or brokerage, we do not have accessto your personal information and you should refer to your bank’s or broker’s privacy policiesfor a statement of the treatment of your personal information.
FOR MORE INFORMATION: A description of the Fund’s proxy voting policies and proce-dures and information on how the Fund voted proxies relating to portfolio securities duringthe most recent 12-month period ended June 30 is available (i) without charge, upon requestby calling 1-800-451-2597; (ii) by writing to Tekla Capital Management LLC at 100 FederalStreet, 19th Floor, Boston, MA 02110; (iii) on the Fund’s website at www.Teklacap.com; and(iv) on the SEC’s website at http://www.sec.gov.
The Fund’s complete Schedule of Investments for the first and third quarters of its fiscal yearwill be filed quarterly with the SEC on Form N-Q. A link to this Schedule of Investments willbe available on the Fund’s website at www.Teklacap.com, or the SEC’s website athttp://www.sec.gov. The Fund’s Form N-Q may be reviewed and copied at the SEC’s PublicReference Room in Washington, DC or by calling 1-800-SEC-0330.
You can find information regarding the Fund at the Fund’s website, www.Teklacap.com. TheFund regularly posts information to its website, including information regarding daily sharepricing and distributions and press releases, and maintains links to the Fund’s SEC filings.The Fund currently publishes and distributes quarterly fact cards, including performance,portfolio holdings and sector information for each fiscal quarter. These fact cards will beavailable on the Fund’s website and by request from the Fund’s marketing and investor sup-port services agent, Destra Capital Investments, at 1-877-855-3434.
DISTRIBUTION POLICY: The Fund has a fixed distribution policy as described in the Notesto Financial Statements. For more information contact your financial adviser.
SHARE REPURCHASE PROGRAM: In March 2017, the Trustees reauthorized the share repur-chase program to allow the Fund to repurchase up to 7% of its outstanding shares for a sevenmonth period ending July 14, 2018. The current share repurchase program allows the Fundto repurchase up to 12% of its outstanding shares for a one year period ending onDecember 14, 2017.
PORTFOLIO MANAGEMENT: Daniel R. Omstead, Ph.D., Jason C. Akus, M.D./M.B.A., TimothyGasperoni, M.B.A, Ph.D., Christian M. Richard, M.B.A, M.S., Christopher Abbott, Robert Benson,CFA, CAIA, Amanda Birdsey-Benson, Ph.D., Alan Kwan, M.B.A, Ph.D., and Joshua A.W.Mosberg, Ph.D. are members of a team that analyzes investments on behalf of the Fund.Dr. Omstead exercises ultimate decision making authority with respect to investments.
HOUSEHOLDING: A number of banks, brokers and financial advisers have instituted “house-holding”. Under this practice, which has been approved by the SEC, only one copy of shareholder documents may be delivered to multiple shareholders who share the sameaddress and satisfy other conditions. Householding is intended to reduce expenses and elim-inate duplicate mailings of shareholder documents. If you do not want the mailing of yourshareholder documents to be combined with those of other members of your household,please contact your bank, broker or financial adviser.
TEKLA WORLDHEALTHCARE FUND
40
Merrill Corp - Tekla World Healthcare Fund Semi-Annual Report [Funds] 333-202638 03-31-2017 ED [AUX] | bjasper | 23-May-17 12:12 | 17-11963-1.ga | Sequence: 4CHKSUM Content: 10426 Layout: 30983 Graphics: No Graphics CLEAN
JOB: 17-11963-1 CYCLE#;BL#: 12; 0 TRIM: 5.375" x 8.375" COMPOSITECOLORS: Black, PANTONE 306 U, ~note-color 2 GRAPHICS: none V1.5

TEKLA WORLDHEALTHCARE FUND
New York Stock Exchange Symbol: THWNAV Symbol: XTHWX
100 Federal Street, 19th FloorBoston, Massachusetts 02110
(617) 772-8500www.teklacap.com
OfficersDaniel R. Omstead, Ph.D., President
Laura Woodward, CPA, Chief Compliance Officer,Secretary and Treasurer
TrusteesMichael W. Bonney
Rakesh K. Jain, Ph.D.Daniel R. Omstead, Ph.D.
Oleg M. Pohotsky, M.B.A., J.D.William S. Reardon, CPAUwe E. Reinhardt, Ph.D.Lucinda H. Stebbins, CPA
Investment AdviserTekla Capital Management LLC
Administrator & CustodianState Street Bank and Trust Company
Transfer AgentComputershare, Inc.
Legal CounselDechert LLP
Shareholders with questions regarding share transfers may calltheir bank, broker or financial adviser or the Transfer Agent at
1-800-426-5523
Daily net asset value may be obtained fromour website (www.teklacap.com) or by calling
(617) 772-8500
Merrill Corp - Tekla World Healthcare Fund Semi-Annual Report [Funds] 333-202638 03-31-2017 ED [AUX] | bjasper | 23-May-17 12:12 | 17-11963-1.za | Sequence: 1CHKSUM Content: 29796 Layout: 36705 Graphics: No Graphics CLEAN
JOB: 17-11963-1 CYCLE#;BL#: 12; 0 TRIM: 5.375" x 8.375" COMPOSITECOLORS: Black, PANTONE 306 U, ~note-color 2 GRAPHICS: none V1.5