Embed Size (px)
Citation preview
∂ Telecom Italia Finance Group
Half-Year Condensed Consolidated Financial Statements at June 30, 2017
Unaudited Half-Year Condensed Consolidated Financial Statements as at June 30, 2017, which have been authorized by the Board of Directors held on July 26, 2017

Half-Year Condensed Consolidated Financial Statements at June 30, 2017
Table of Contents
2 Telecom Italia Finance Group
Half-Year Condensed Consolidated Financial Statements at June 30, 2017
Table of Contents
Telecom Italia Finance Group 1
Table of Contents
Directors’ report ................................................................................................................................................................................ 3
The Business Units ....................................................................................................................................................................... 3
Key operating Financial Data .................................................................................................................................................... 3
Consolidated financial position and cash flows performance .......................................................................................... 6
Main changes in the regulatory framework ........................................................................................................................... 7
Events subsequent to June 30, 2017 ........................................................................................................................................ 7
Business outlook for the year 2017 .......................................................................................................................................... 7
Main risks and uncertainties ...................................................................................................................................................... 7
Information for investors ............................................................................................................................................................ 8
Consolidated Statements of Financial Position ........................................................................................................................ 9
Assets .............................................................................................................................................................................................. 9
Equity and Liabilities .................................................................................................................................................................. 10
Separate Consolidated Income Statements ............................................................................................................................ 11
Consolidated Statements of Comprehensive Income ........................................................................................................... 12
Consolidated Statements of Changes in Equity ..................................................................................................................... 13
Consolidated Statements of Cash Flows .................................................................................................................................. 14
Notes to the Half-Year Accounts ................................................................................................................................................ 15
Form, content and other general information ............................................................................................... 15
Accounting policies ............................................................................................................................................... 16
Scope of consolidation ......................................................................................................................................... 17
Goodwill ................................................................................................................................................................... 18
Intangible assets with a finite useful life ......................................................................................................... 18
Tangible assets (owned and under finance leases) ...................................................................................... 19
Investments ............................................................................................................................................................. 19
Financial assets (non-current and current) ................................................................................................... 20
Trade and miscellaneous receivables and other current assets ............................................................... 21
Equity ...................................................................................................................................................................... 22
Financial liabilities (non-current and current) .............................................................................................. 22
Net financial debt ................................................................................................................................................24
Derivatives .............................................................................................................................................................24
Supplementary disclosures on financial instruments ................................................................................ 25
Provisions ...............................................................................................................................................................28
Trade and miscellaneous payables and other current liabilities .............................................................28
Contingent liabilities, other information, commitments and guarantees ............................................. 29
Finance income and expenses ........................................................................................................................ 30
Segment reporting .............................................................................................................................................. 32
Related party transactions................................................................................................................................ 33
Equity compensation plans ............................................................................................................................... 35
Other information ............................................................................................................................................... 37
Events subsequent to June 30, 2017 ............................................................................................................... 37
List of companies of the Telecom Italia Finance Group ............................................................................ 37
Half-Year Condensed Consolidated Financial Statements at June 30, 2017
Table of Contents
2 Telecom Italia Finance Group
Certification of the Consolidated Financial Statements pursuant to Luxembourg Transparency Law ................... 38
Half-Year Condensed Consolidated Financial Statements at June 30, 2017
Directors’ report
Telecom Italia Finance Group 3
Directors’ report
The Business Units
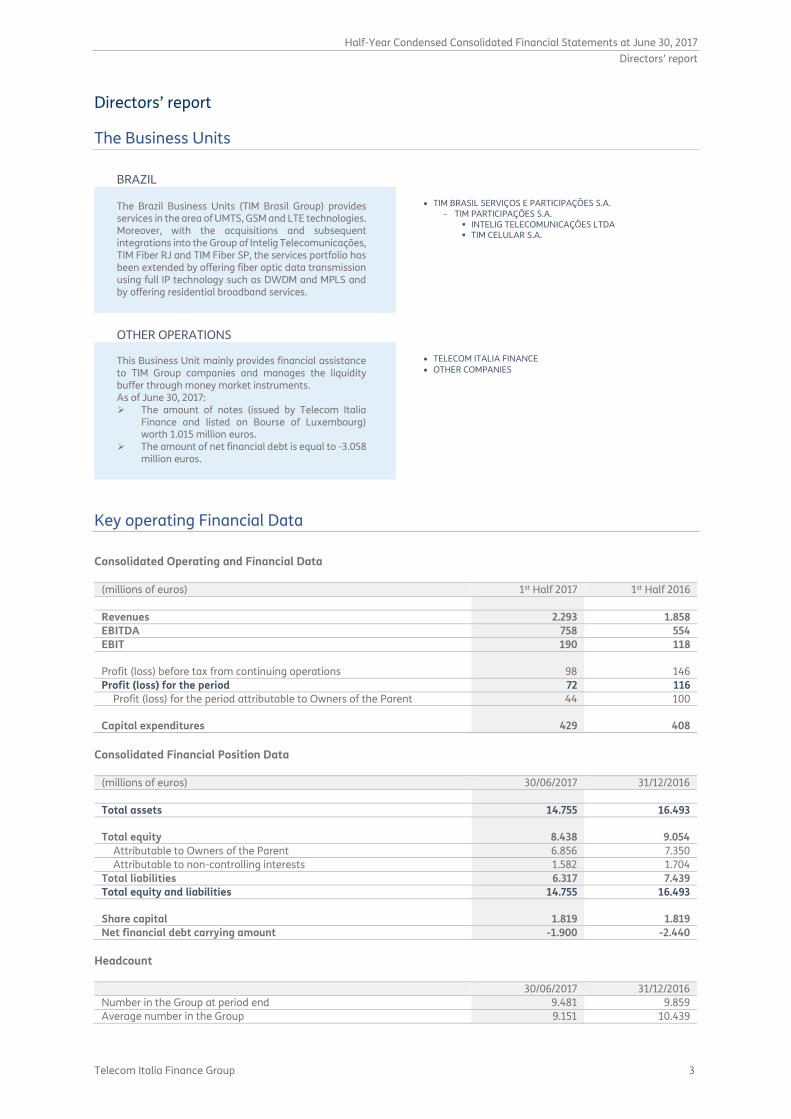
BRAZIL The Brazil Business Units (TIM Brasil Group) provides services in the area of UMTS, GSM and LTE technologies. Moreover, with the acquisitions and subsequent integrations into the Group of Intelig Telecomunicações, TIM Fiber RJ and TIM Fiber SP, the services portfolio has been extended by offering fiber optic data transmission using full IP technology such as DWDM and MPLS and by offering residential broadband services.
TIM BRASIL SERVIÇOS E PARTICIPAÇÕES S.A. - TIM PARTICIPAÇÕES S.A.
INTELIG TELECOMUNICAÇÕES LTDA TIM CELULAR S.A.
OTHER OPERATIONS This Business Unit mainly provides financial assistance to TIM Group companies and manages the liquidity buffer through money market instruments. As of June 30, 2017: The amount of notes (issued by Telecom Italia
Finance and listed on Bourse of Luxembourg) worth 1.015 million euros.
The amount of net financial debt is equal to -3.058 million euros.
TELECOM ITALIA FINANCE
OTHER COMPANIES
Key operating Financial Data
Consolidated Operating and Financial Data
(millions of euros) 1st Half 2017 1st Half 2016
Revenues 2.293 1.858
EBITDA 758 554
EBIT 190 118
Profit (loss) before tax from continuing operations 98 146
Profit (loss) for the period 72 116
Profit (loss) for the period attributable to Owners of the Parent 44 100
Capital expenditures 429 408
Consolidated Financial Position Data
(millions of euros) 30/06/2017 31/12/2016
Total assets 14.755 16.493
Total equity 8.438 9.054
Attributable to Owners of the Parent 6.856 7.350
Attributable to non-controlling interests 1.582 1.704
Total liabilities 6.317 7.439
Total equity and liabilities 14.755 16.493
Share capital 1.819 1.819
Net financial debt carrying amount -1.900 -2.440
Headcount
30/06/2017 31/12/2016
Number in the Group at period end 9.481 9.859
Average number in the Group 9.151 10.439
Half-Year Condensed Consolidated Financial Statements at June 30, 2017
Directors’ report
4 Telecom Italia Finance Group
Highlights
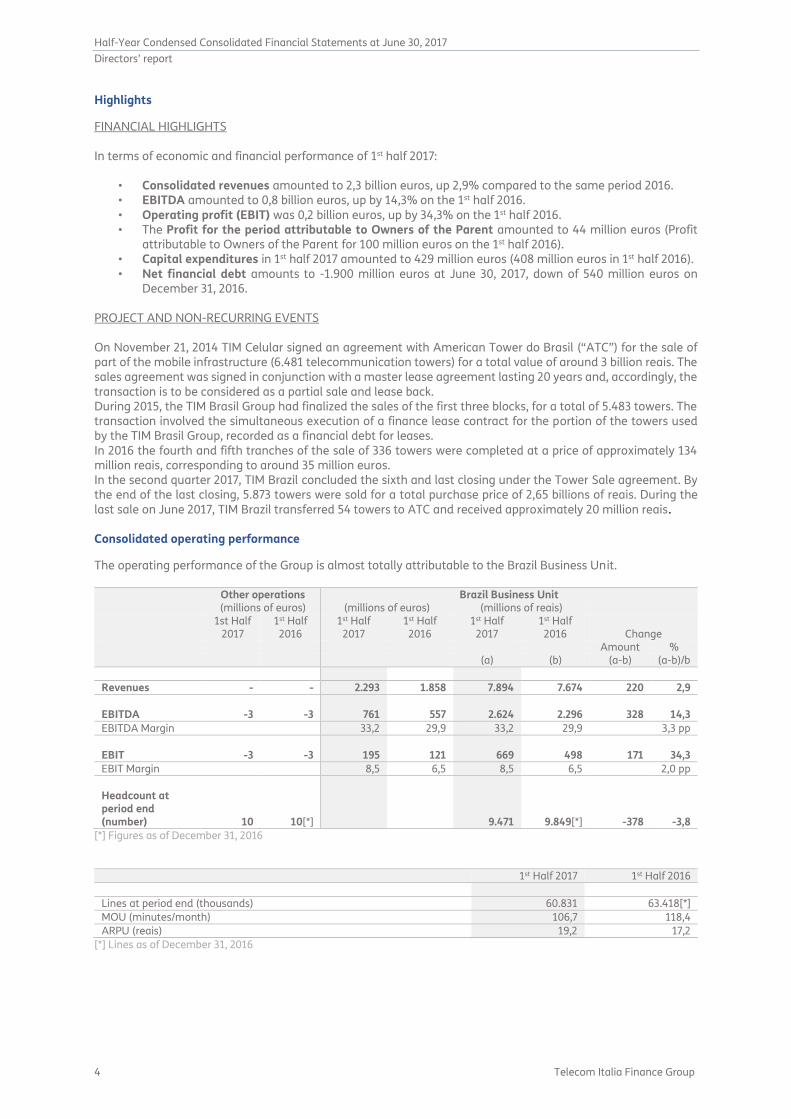
FINANCIAL HIGHLIGHTS In terms of economic and financial performance of 1st half 2017:
• Consolidated revenues amounted to 2,3 billion euros, up 2,9% compared to the same period 2016. • EBITDA amounted to 0,8 billion euros, up by 14,3% on the 1st half 2016. • Operating profit (EBIT) was 0,2 billion euros, up by 34,3% on the 1st half 2016. • The Profit for the period attributable to Owners of the Parent amounted to 44 million euros (Profit
attributable to Owners of the Parent for 100 million euros on the 1st half 2016). • Capital expenditures in 1st half 2017 amounted to 429 million euros (408 million euros in 1st half 2016). • Net financial debt amounts to -1.900 million euros at June 30, 2017, down of 540 million euros on
December 31, 2016. PROJECT AND NON-RECURRING EVENTS On November 21, 2014 TIM Celular signed an agreement with American Tower do Brasil (“ATC”) for the sale of part of the mobile infrastructure (6.481 telecommunication towers) for a total value of around 3 billion reais. The sales agreement was signed in conjunction with a master lease agreement lasting 20 years and, accordingly, the transaction is to be considered as a partial sale and lease back. During 2015, the TIM Brasil Group had finalized the sales of the first three blocks, for a total of 5.483 towers. The transaction involved the simultaneous execution of a finance lease contract for the portion of the towers used by the TIM Brasil Group, recorded as a financial debt for leases. In 2016 the fourth and fifth tranches of the sale of 336 towers were completed at a price of approximately 134 million reais, corresponding to around 35 million euros. In the second quarter 2017, TIM Brazil concluded the sixth and last closing under the Tower Sale agreement. By the end of the last closing, 5.873 towers were sold for a total purchase price of 2,65 billions of reais. During the last sale on June 2017, TIM Brazil transferred 54 towers to ATC and received approximately 20 million reais.
Consolidated operating performance
The operating performance of the Group is almost totally attributable to the Brazil Business Unit.
Other operations Brazil Business Unit (millions of euros) (millions of euros) (millions of reais)
1st Half
2017 1st Half 2016
1st Half 2017
1st Half 2016
1st Half 2017
1st Half 2016 Change
Amount % (a) (b) (a-b) (a-b)/b
Revenues - - 2.293 1.858 7.894 7.674 220 2,9
EBITDA -3 -3 761 557 2.624 2.296 328 14,3
EBITDA Margin 33,2 29,9 33,2 29,9 3,3 pp
EBIT -3 -3 195 121 669 498 171 34,3
EBIT Margin 8,5 6,5 8,5 6,5 2,0 pp
Headcount at period end (number) 10 10[*] 9.471 9.849[*] -378 -3,8
[*] Figures as of December 31, 2016
1st Half 2017 1st Half 2016
Lines at period end (thousands) 60.831 63.418[*]
MOU (minutes/month) 106,7 118,4
ARPU (reais) 19,2 17,2
[*] Lines as of December 31, 2016
Half-Year Condensed Consolidated Financial Statements at June 30, 2017
Directors’ report
Telecom Italia Finance Group 5
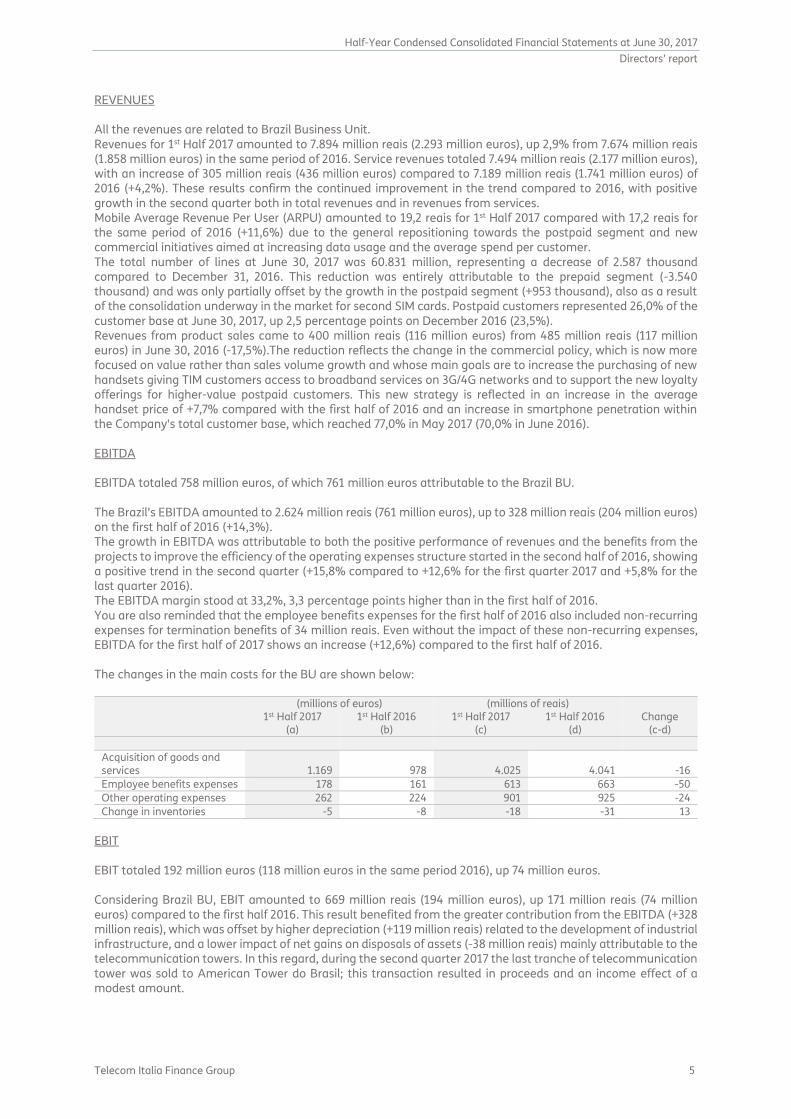
REVENUES All the revenues are related to Brazil Business Unit. Revenues for 1st Half 2017 amounted to 7.894 million reais (2.293 million euros), up 2,9% from 7.674 million reais (1.858 million euros) in the same period of 2016. Service revenues totaled 7.494 million reais (2.177 million euros), with an increase of 305 million reais (436 million euros) compared to 7.189 million reais (1.741 million euros) of 2016 (+4,2%). These results confirm the continued improvement in the trend compared to 2016, with positive growth in the second quarter both in total revenues and in revenues from services. Mobile Average Revenue Per User (ARPU) amounted to 19,2 reais for 1st Half 2017 compared with 17,2 reais for the same period of 2016 (+11,6%) due to the general repositioning towards the postpaid segment and new commercial initiatives aimed at increasing data usage and the average spend per customer. The total number of lines at June 30, 2017 was 60.831 million, representing a decrease of 2.587 thousand compared to December 31, 2016. This reduction was entirely attributable to the prepaid segment (-3.540 thousand) and was only partially offset by the growth in the postpaid segment (+953 thousand), also as a result of the consolidation underway in the market for second SIM cards. Postpaid customers represented 26,0% of the customer base at June 30, 2017, up 2,5 percentage points on December 2016 (23,5%). Revenues from product sales came to 400 million reais (116 million euros) from 485 million reais (117 million euros) in June 30, 2016 (-17,5%).The reduction reflects the change in the commercial policy, which is now more focused on value rather than sales volume growth and whose main goals are to increase the purchasing of new handsets giving TIM customers access to broadband services on 3G/4G networks and to support the new loyalty offerings for higher-value postpaid customers. This new strategy is reflected in an increase in the average handset price of +7,7% compared with the first half of 2016 and an increase in smartphone penetration within the Company's total customer base, which reached 77,0% in May 2017 (70,0% in June 2016). EBITDA EBITDA totaled 758 million euros, of which 761 million euros attributable to the Brazil BU. The Brazil’s EBITDA amounted to 2.624 million reais (761 million euros), up to 328 million reais (204 million euros) on the first half of 2016 (+14,3%). The growth in EBITDA was attributable to both the positive performance of revenues and the benefits from the projects to improve the efficiency of the operating expenses structure started in the second half of 2016, showing a positive trend in the second quarter (+15,8% compared to +12,6% for the first quarter 2017 and +5,8% for the last quarter 2016). The EBITDA margin stood at 33,2%, 3,3 percentage points higher than in the first half of 2016. You are also reminded that the employee benefits expenses for the first half of 2016 also included non-recurring expenses for termination benefits of 34 million reais. Even without the impact of these non-recurring expenses, EBITDA for the first half of 2017 shows an increase (+12,6%) compared to the first half of 2016. The changes in the main costs for the BU are shown below:
(millions of euros) (millions of reais) 1st Half 2017 1st Half 2016 1st Half 2017 1st Half 2016 Change (a) (b) (c) (d) (c-d)
Acquisition of goods and services 1.169 978 4.025 4.041 -16
Employee benefits expenses 178 161 613 663 -50
Other operating expenses 262 224 901 925 -24
Change in inventories -5 -8 -18 -31 13
EBIT EBIT totaled 192 million euros (118 million euros in the same period 2016), up 74 million euros. Considering Brazil BU, EBIT amounted to 669 million reais (194 million euros), up 171 million reais (74 million euros) compared to the first half 2016. This result benefited from the greater contribution from the EBITDA (+328 million reais), which was offset by higher depreciation (+119 million reais) related to the development of industrial infrastructure, and a lower impact of net gains on disposals of assets (-38 million reais) mainly attributable to the telecommunication towers. In this regard, during the second quarter 2017 the last tranche of telecommunication tower was sold to American Tower do Brasil; this transaction resulted in proceeds and an income effect of a modest amount.
Half-Year Condensed Consolidated Financial Statements at June 30, 2017
Directors’ report
6 Telecom Italia Finance Group
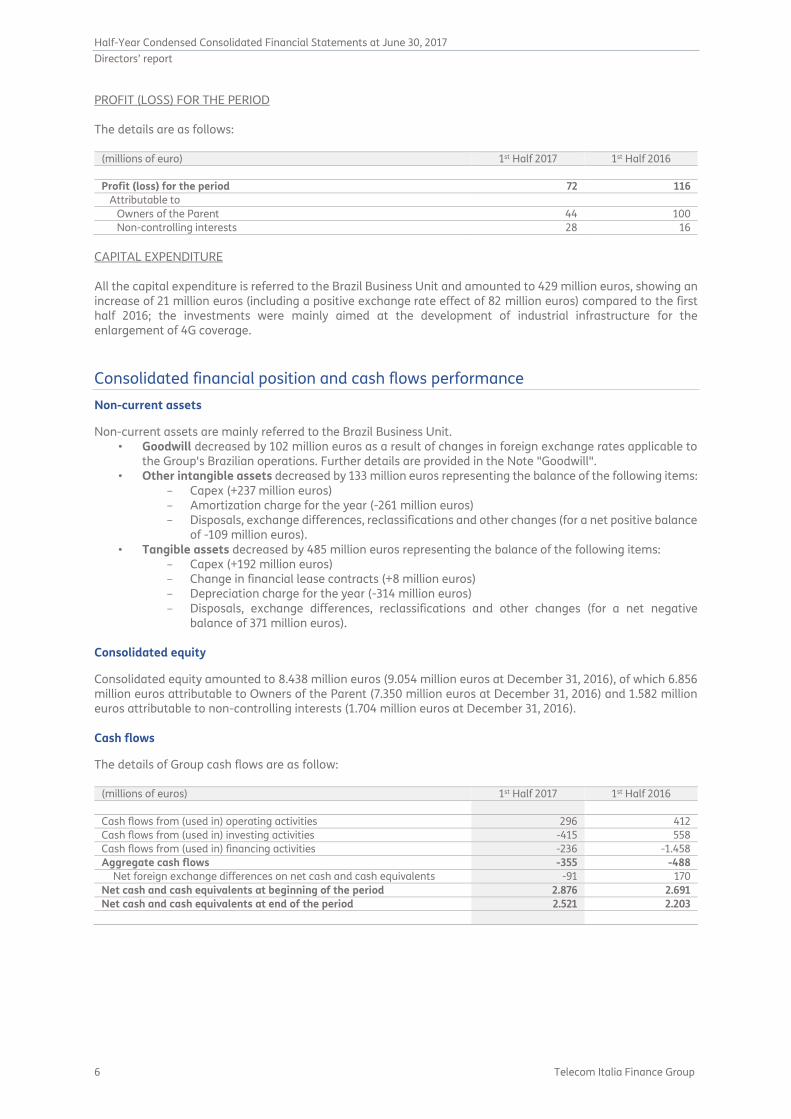
PROFIT (LOSS) FOR THE PERIOD The details are as follows:
(millions of euro) 1st Half 2017 1st Half 2016
Profit (loss) for the period 72 116
Attributable to
Owners of the Parent 44 100
Non-controlling interests 28 16
CAPITAL EXPENDITURE All the capital expenditure is referred to the Brazil Business Unit and amounted to 429 million euros, showing an increase of 21 million euros (including a positive exchange rate effect of 82 million euros) compared to the first half 2016; the investments were mainly aimed at the development of industrial infrastructure for the enlargement of 4G coverage.
Consolidated financial position and cash flows performance
Non-current assets
Non-current assets are mainly referred to the Brazil Business Unit. • Goodwill decreased by 102 million euros as a result of changes in foreign exchange rates applicable to
the Group's Brazilian operations. Further details are provided in the Note "Goodwill". • Other intangible assets decreased by 133 million euros representing the balance of the following items:
- Capex (+237 million euros) - Amortization charge for the year (-261 million euros) - Disposals, exchange differences, reclassifications and other changes (for a net positive balance
of -109 million euros). • Tangible assets decreased by 485 million euros representing the balance of the following items:
- Capex (+192 million euros) - Change in financial lease contracts (+8 million euros) - Depreciation charge for the year (-314 million euros) - Disposals, exchange differences, reclassifications and other changes (for a net negative
balance of 371 million euros). Consolidated equity
Consolidated equity amounted to 8.438 million euros (9.054 million euros at December 31, 2016), of which 6.856 million euros attributable to Owners of the Parent (7.350 million euros at December 31, 2016) and 1.582 million euros attributable to non-controlling interests (1.704 million euros at December 31, 2016). Cash flows
The details of Group cash flows are as follow:
(millions of euros) 1st Half 2017 1st Half 2016
Cash flows from (used in) operating activities 296 412
Cash flows from (used in) investing activities -415 558
Cash flows from (used in) financing activities -236 -1.458
Aggregate cash flows -355 -488
Net foreign exchange differences on net cash and cash equivalents -91 170
Net cash and cash equivalents at beginning of the period 2.876 2.691
Net cash and cash equivalents at end of the period 2.521 2.203
Half-Year Condensed Consolidated Financial Statements at June 30, 2017
Directors’ report
Telecom Italia Finance Group 7
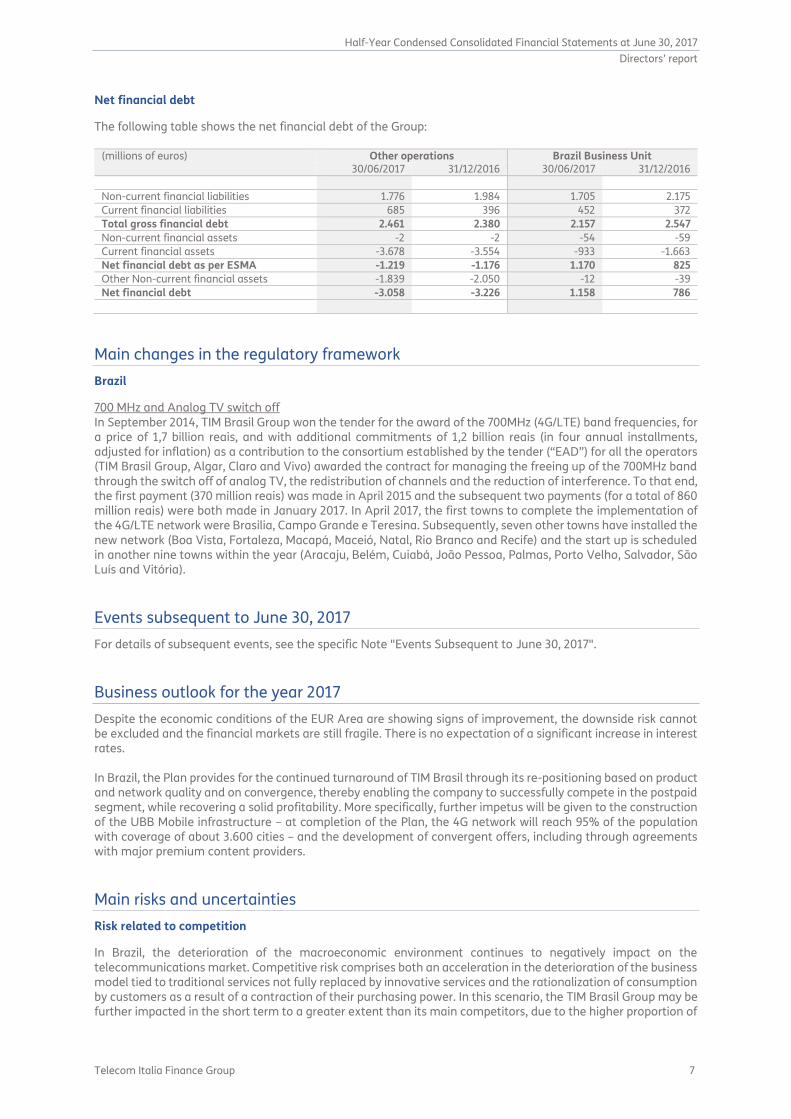
Net financial debt
The following table shows the net financial debt of the Group:
(millions of euros) Other operations Brazil Business Unit 30/06/2017 31/12/2016 30/06/2017 31/12/2016
Non-current financial liabilities 1.776 1.984 1.705 2.175
Current financial liabilities 685 396 452 372
Total gross financial debt 2.461 2.380 2.157 2.547
Non-current financial assets -2 -2 -54 -59
Current financial assets -3.678 -3.554 -933 -1.663
Net financial debt as per ESMA -1.219 -1.176 1.170 825
Other Non-current financial assets -1.839 -2.050 -12 -39
Net financial debt -3.058 -3.226 1.158 786
Main changes in the regulatory framework
Brazil
700 MHz and Analog TV switch off In September 2014, TIM Brasil Group won the tender for the award of the 700MHz (4G/LTE) band frequencies, for a price of 1,7 billion reais, and with additional commitments of 1,2 billion reais (in four annual installments, adjusted for inflation) as a contribution to the consortium established by the tender (“EAD”) for all the operators (TIM Brasil Group, Algar, Claro and Vivo) awarded the contract for managing the freeing up of the 700MHz band through the switch off of analog TV, the redistribution of channels and the reduction of interference. To that end, the first payment (370 million reais) was made in April 2015 and the subsequent two payments (for a total of 860 million reais) were both made in January 2017. In April 2017, the first towns to complete the implementation of the 4G/LTE network were Brasilia, Campo Grande e Teresina. Subsequently, seven other towns have installed the new network (Boa Vista, Fortaleza, Macapá, Maceió, Natal, Rio Branco and Recife) and the start up is scheduled in another nine towns within the year (Aracaju, Belém, Cuiabá, João Pessoa, Palmas, Porto Velho, Salvador, São Luís and Vitória).
Events subsequent to June 30, 2017
For details of subsequent events, see the specific Note "Events Subsequent to June 30, 2017".
Business outlook for the year 2017
Despite the economic conditions of the EUR Area are showing signs of improvement, the downside risk cannot be excluded and the financial markets are still fragile. There is no expectation of a significant increase in interest rates. In Brazil, the Plan provides for the continued turnaround of TIM Brasil through its re-positioning based on product and network quality and on convergence, thereby enabling the company to successfully compete in the postpaid segment, while recovering a solid profitability. More specifically, further impetus will be given to the construction of the UBB Mobile infrastructure – at completion of the Plan, the 4G network will reach 95% of the population with coverage of about 3.600 cities – and the development of convergent offers, including through agreements with major premium content providers.
Main risks and uncertainties
Risk related to competition
In Brazil, the deterioration of the macroeconomic environment continues to negatively impact on the telecommunications market. Competitive risk comprises both an acceleration in the deterioration of the business model tied to traditional services not fully replaced by innovative services and the rationalization of consumption by customers as a result of a contraction of their purchasing power. In this scenario, the TIM Brasil Group may be further impacted in the short term to a greater extent than its main competitors, due to the higher proportion of
Half-Year Condensed Consolidated Financial Statements at June 30, 2017
Directors’ report
8 Telecom Italia Finance Group
customers with prepaid services, which are more affected by the current macroeconomic situation, and by a slowdown in their replacement with postpaid customers. Risks related to business continuity
Our success depends heavily on the ability to deliver the services we provide through the IT infrastructure and network on a continuous and uninterrupted basis. The infrastructure is susceptible to interruptions due to failures of information and communication technologies, lack of electricity, floods, storms and human errors. Unexpected problems in installations, system failures, hardware and software failures, computer viruses or hacker attacks could affect the quality of services and cause service interruptions. Each of these events could result in a reduction in traffic and a reduction in revenues and/or in an increase of restoration costs, with an adverse impact on the level of customer satisfaction and number of customers, as well as our reputation. Financial risks
For details of financial risks, see the specific Note "Financial risks management" in the annual consolidated financial statements at December 31, 2016. Group internal control and risk management
The internal control and risk management system consists of the set of rules, procedures and organizational structures that, through a process of identifying, measuring, managing and monitoring the principal risks, allows the sound, fair and consistent operation of the company in line with the pre-established objectives. It is organized and operates according to the principles and criteria of the Corporate Governance Code of the TIM Group, to which the TIF Group adheres, and involves several components that act in a coordinated way according to their respective responsibilities – the responsibility of the Board of Directors to direct and provide strategic supervision, the responsibility of the Executive Directors and management to control and manage, the responsibility of the control and risk Committee and the Head of the Group Audit Department to monitor and provide support to the Board of Directors.
Information for investors
Brazil – shares
Regarding the trading of shares issued by Group companies on regulated markets, the ordinary shares of TIM Participações S.A. are listed in Brazil (BOVESPA index). The ordinary shares of TIM Participações S.A. are also listed on the NYSE (New York Stock Exchange); trading occurs through ADS (American Depositary Shares) that represent 5 ordinary shares of TIM Participações S.A.
Half-Year Condensed Consolidated Financial Statements at June 30, 2017
Consolidated Statements of Financial Position
Telecom Italia Finance Group 9
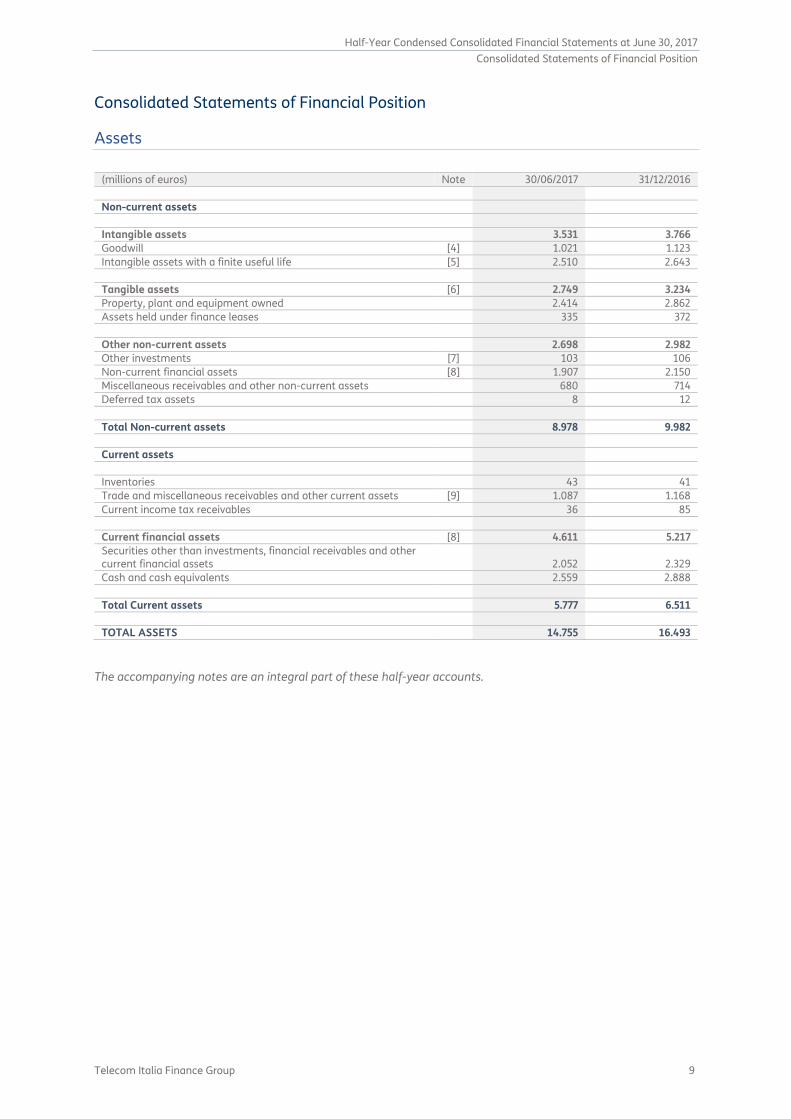
Consolidated Statements of Financial Position
Assets
(millions of euros) Note 30/06/2017 31/12/2016
Non-current assets
Intangible assets 3.531 3.766
Goodwill [4] 1.021 1.123
Intangible assets with a finite useful life [5] 2.510 2.643
Tangible assets [6] 2.749 3.234
Property, plant and equipment owned 2.414 2.862
Assets held under finance leases 335 372
Other non-current assets 2.698 2.982
Other investments [7] 103 106
Non-current financial assets [8] 1.907 2.150
Miscellaneous receivables and other non-current assets 680 714
Deferred tax assets 8 12
Total Non-current assets 8.978 9.982
Current assets
Inventories 43 41
Trade and miscellaneous receivables and other current assets [9] 1.087 1.168
Current income tax receivables 36 85
Current financial assets [8] 4.611 5.217
Securities other than investments, financial receivables and other current financial assets 2.052 2.329
Cash and cash equivalents 2.559 2.888
Total Current assets 5.777 6.511
TOTAL ASSETS 14.755 16.493
The accompanying notes are an integral part of these half-year accounts.
Half-Year Condensed Consolidated Financial Statements at June 30, 2017
Consolidated Statements of Financial Position
10 Telecom Italia Finance Group
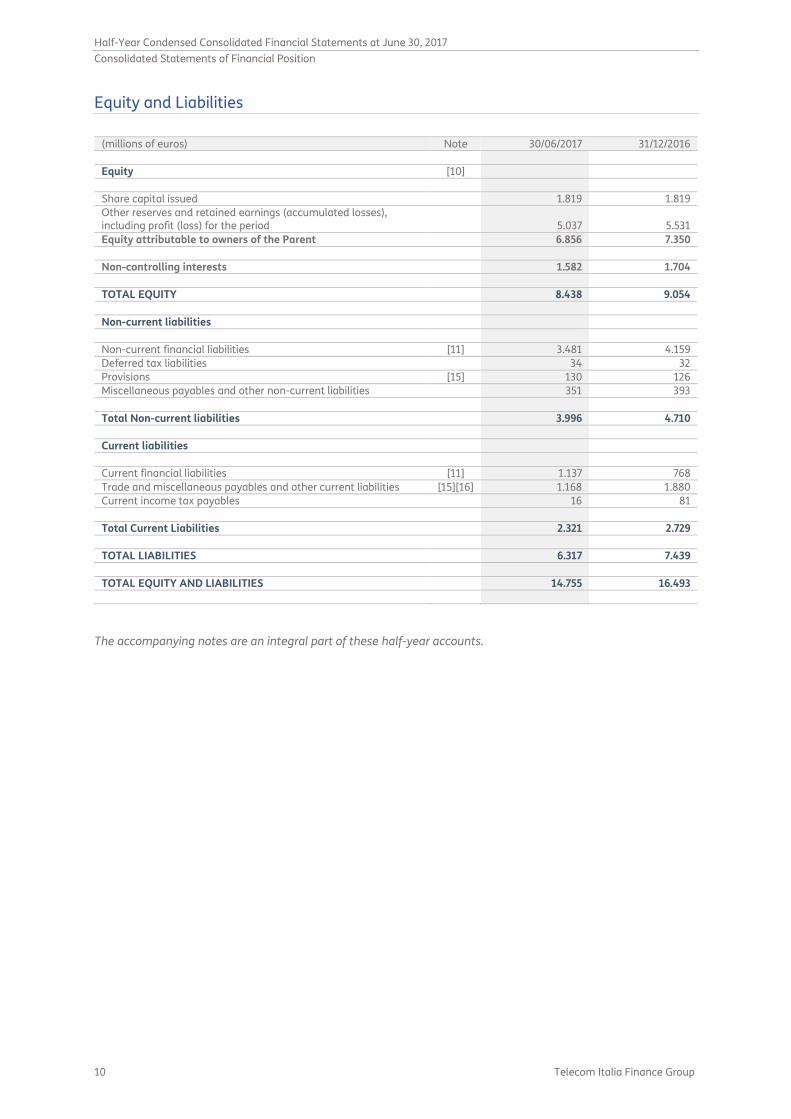
Equity and Liabilities
(millions of euros) Note 30/06/2017 31/12/2016
Equity [10]
Share capital issued 1.819 1.819
Other reserves and retained earnings (accumulated losses), including profit (loss) for the period 5.037 5.531
Equity attributable to owners of the Parent 6.856 7.350
Non-controlling interests 1.582 1.704
TOTAL EQUITY 8.438 9.054
Non-current liabilities
Non-current financial liabilities [11] 3.481 4.159
Deferred tax liabilities 34 32
Provisions [15] 130 126
Miscellaneous payables and other non-current liabilities 351 393
Total Non-current liabilities 3.996 4.710
Current liabilities
Current financial liabilities [11] 1.137 768
Trade and miscellaneous payables and other current liabilities [15][16] 1.168 1.880
Current income tax payables 16 81
Total Current Liabilities 2.321 2.729
TOTAL LIABILITIES 6.317 7.439
TOTAL EQUITY AND LIABILITIES 14.755 16.493
The accompanying notes are an integral part of these half-year accounts.
Half-Year Condensed Consolidated Financial Statements at June 30, 2017
Separate Consolidated Income Statements
Telecom Italia Finance Group 11
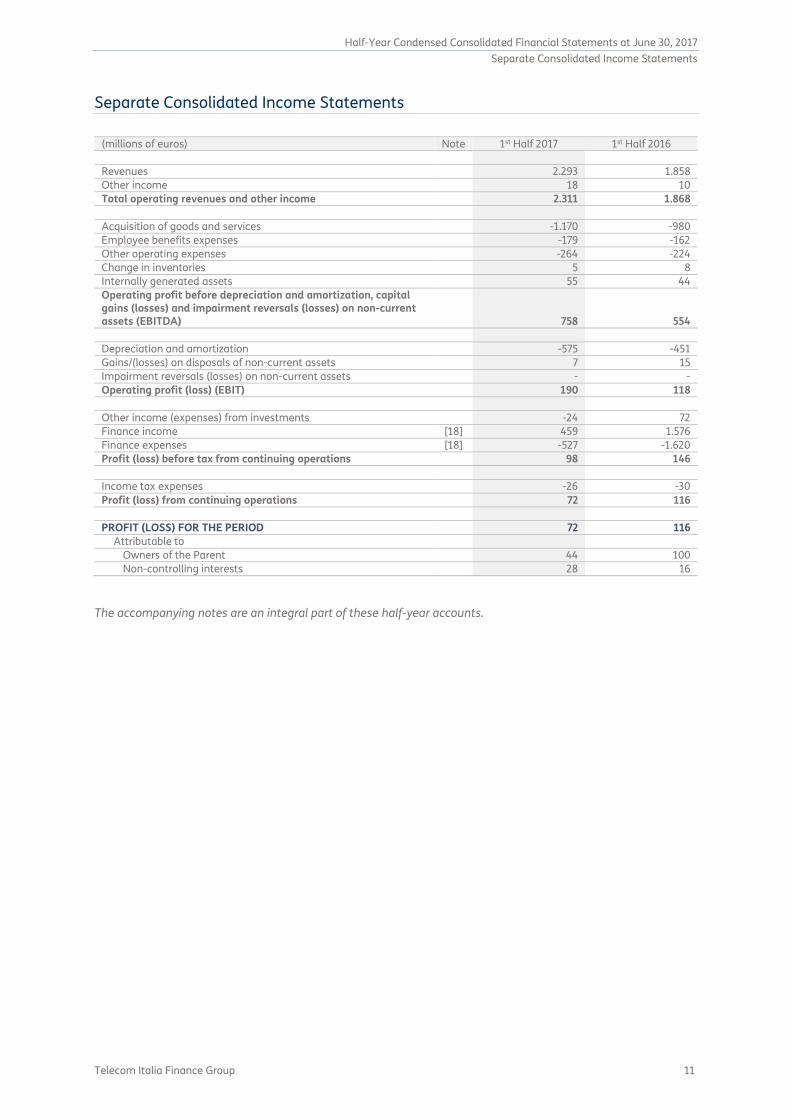
Separate Consolidated Income Statements
(millions of euros) Note 1st Half 2017 1st Half 2016
Revenues 2.293 1.858
Other income 18 10
Total operating revenues and other income 2.311 1.868
Acquisition of goods and services -1.170 -980
Employee benefits expenses -179 -162
Other operating expenses -264 -224
Change in inventories 5 8
Internally generated assets 55 44
Operating profit before depreciation and amortization, capital gains (losses) and impairment reversals (losses) on non-current assets (EBITDA) 758 554
Depreciation and amortization -575 -451
Gains/(losses) on disposals of non-current assets 7 15
Impairment reversals (losses) on non-current assets - -
Operating profit (loss) (EBIT) 190 118
Other income (expenses) from investments -24 72
Finance income [18] 459 1.576
Finance expenses [18] -527 -1.620
Profit (loss) before tax from continuing operations 98 146
Income tax expenses -26 -30
Profit (loss) from continuing operations 72 116
PROFIT (LOSS) FOR THE PERIOD 72 116
Attributable to
Owners of the Parent 44 100
Non-controlling interests 28 16
The accompanying notes are an integral part of these half-year accounts.
Half-Year Condensed Consolidated Financial Statements at June 30, 2017
Consolidated Statements of Comprehensive Income
12 Telecom Italia Finance Group
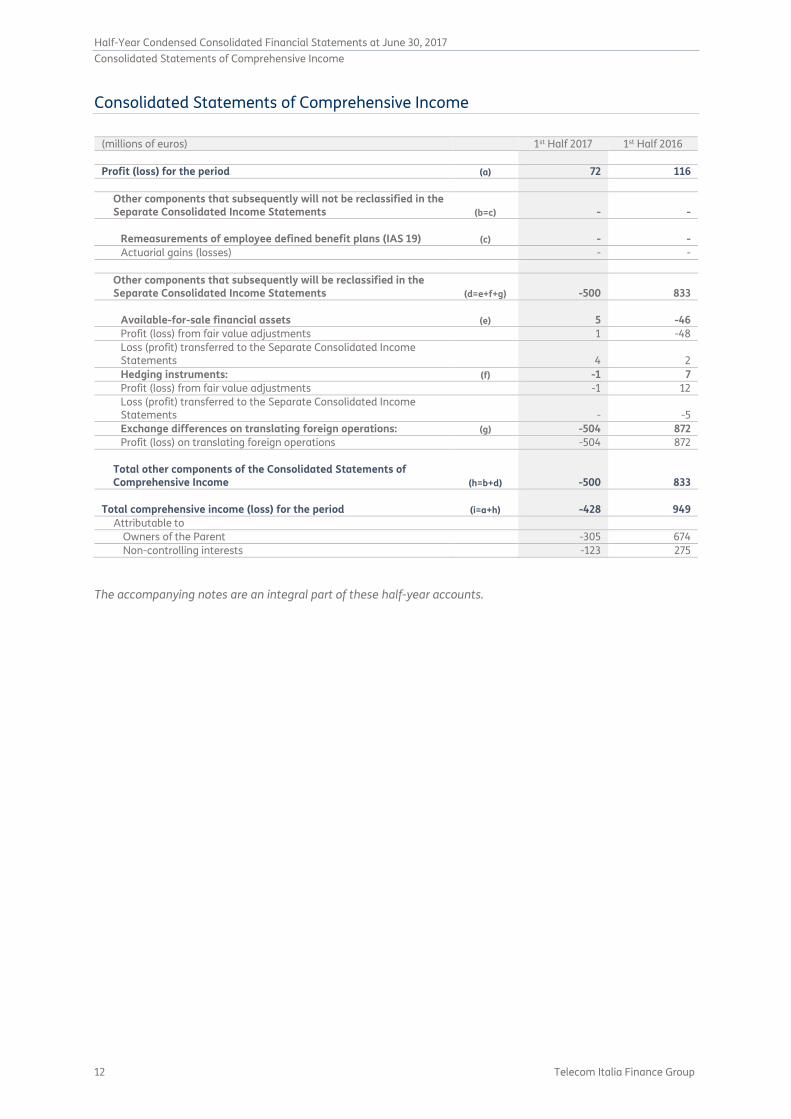
Consolidated Statements of Comprehensive Income
(millions of euros) 1st Half 2017 1st Half 2016
Profit (loss) for the period (a) 72 116
Other components that subsequently will not be reclassified in the Separate Consolidated Income Statements (b=c) - -
Remeasurements of employee defined benefit plans (IAS 19) (c) - -
Actuarial gains (losses) - -
Other components that subsequently will be reclassified in the Separate Consolidated Income Statements (d=e+f+g) -500 833
Available-for-sale financial assets (e) 5 -46
Profit (loss) from fair value adjustments 1 -48
Loss (profit) transferred to the Separate Consolidated Income Statements 4 2
Hedging instruments: (f) -1 7
Profit (loss) from fair value adjustments -1 12
Loss (profit) transferred to the Separate Consolidated Income Statements - -5
Exchange differences on translating foreign operations: (g) -504 872
Profit (loss) on translating foreign operations -504 872
Total other components of the Consolidated Statements of Comprehensive Income (h=b+d) -500 833
Total comprehensive income (loss) for the period (i=a+h) -428 949
Attributable to
Owners of the Parent -305 674
Non-controlling interests -123 275
The accompanying notes are an integral part of these half-year accounts.
Half-Year Condensed Consolidated Financial Statements at June 30, 2017
Consolidated Statements of Changes in Equity
Telecom Italia Finance Group 13
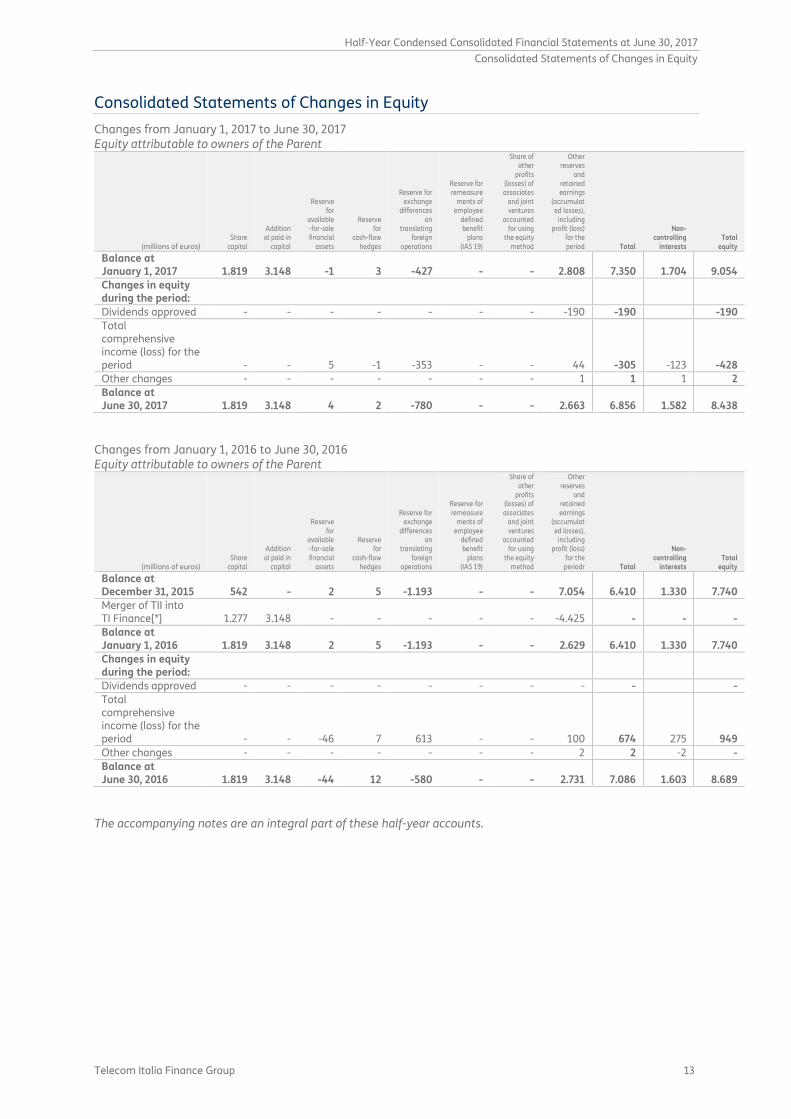
Consolidated Statements of Changes in Equity
Changes from January 1, 2017 to June 30, 2017 Equity attributable to owners of the Parent
(millions of euros) Share capital
Additional paid in
capital
Reserve for
available-for-sale financial
assets
Reserve for
cash-flow hedges
Reserve for exchange
differences on
translating foreign
operations
Reserve for remeasure
ments of employee
defined benefit
plans (IAS 19)
Share of other
profits (losses) of associates
and joint ventures
accounted for using
the equity method
Other reserves
and retained earnings
(accumulated losses),
including profit (loss)
for the period Total
Non-controlling
interests Total
equity
Balance at January 1, 2017 1.819 3.148 -1 3 -427 - - 2.808 7.350 1.704 9.054
Changes in equity during the period:
Dividends approved - - - - - - - -190 -190 -190
Total comprehensive income (loss) for the period - - 5 -1 -353 - - 44 -305 -123 -428
Other changes - - - - - - - 1 1 1 2
Balance at June 30, 2017 1.819 3.148 4 2 -780 - - 2.663 6.856 1.582 8.438
Changes from January 1, 2016 to June 30, 2016 Equity attributable to owners of the Parent
(millions of euros) Share capital
Additional paid in
capital
Reserve for
available-for-sale financial
assets
Reserve for
cash-flow hedges
Reserve for exchange
differences on
translating foreign
operations
Reserve for remeasure
ments of employee
defined benefit
plans (IAS 19)
Share of other
profits (losses) of associates
and joint ventures
accounted for using
the equity method
Other reserves
and retained earnings
(accumulated losses),
including profit (loss)
for the periodr Total
Non-controlling
interests Total
equity
Balance at December 31, 2015 542 - 2 5 -1.193 - - 7.054 6.410 1.330 7.740
Merger of TII into TI Finance[*] 1.277 3.148 - - - - - -4.425 - - -
Balance at January 1, 2016 1.819 3.148 2 5 -1.193 - - 2.629 6.410 1.330 7.740
Changes in equity during the period:
Dividends approved - - - - - - - - - -
Total comprehensive income (loss) for the period - - -46 7 613 - - 100 674 275 949
Other changes - - - - - - - 2 2 -2 -
Balance at June 30, 2016 1.819 3.148 -44 12 -580 - - 2.731 7.086 1.603 8.689
The accompanying notes are an integral part of these half-year accounts.

Half-Year Condensed Consolidated Financial Statements at June 30, 2017
Consolidated Statements of Cash Flows
14 Telecom Italia Finance Group
Consolidated Statements of Cash Flows
(millions of euros) Note 1st Half 2017 1st Half 2016
Cash flows from operating activities:
Profit (loss) from continuing operations 72 116
Adjustments for:
Depreciation and amortization 575 451
Impairment losses (reversals) on non-current assets (including investments) 6 10
Net change in deferred tax assets and liabilities 6 -30
Losses (gains) realized on disposals of non-current assets (including investments) -7 -98
Change in inventories -1 -15
Change in trade receivables and net amounts due from customers on construction contracts 147 -100
Change in trade payables -53 46
Net change in miscellaneous receivables/payables and other assets/liabilities and other changes -449 32
Cash flows from (used in) operating activities 296 412
Cash flows from investing activities:
Total purchase of intangible and tangible assets on a cash basis -942 -565
Change in financial receivables and other financial assets 523 891
Proceeds from sale/repayment of intangible, tangible and other non-current assets 4 232
Cash flows from (used in) investing activities -415 558
Cash flows from financing activities:
Change in current financial liabilities and other 162 -587
Proceeds from non-current financial liabilities (including current portion) 193 148
Repayments of non-current financial liabilities (including current portion) -386 -987
Dividends paid -205 -32
Cash flows from (used in) financing activities -236 -1.458
Aggregate cash flows -355 -488
Net foreign exchange differences on net cash and cash equivalents -91 170
Net cash and cash equivalents at beginning of the year [8] 2.876 2.691
Net cash and cash equivalents at end of the period [8] 2.521 2.203
Additional Cash Flow Information
(millions of euros) 1st Half 2017 1st Half 2016
Income taxes (paid) received -18 -32
Interest expense paid -277 -267
Interest income received 162 200
The accompanying notes are an integral part of these half-year accounts.
Half-Year Condensed Consolidated Financial Statements at June 30, 2017
Notes to the Half-Year Accounts
Telecom Italia Finance Group 15
Notes to the Half-Year Accounts
Form, content and other general information FORM AND CONTENT Telecom Italia Finance S.A. (the “Parent”) is established in Luxembourg as Société Anonyme under the laws of the Grand Duchy of Luxembourg. The registered office is located at 12, rue Eugéne Ruppert, Luxembourg. Parent and its subsidiaries are collectively referred to as the “Group”. The ultimate Parent of the Group is TIM S.p.A. The Group through its Brazilian’s subsidiaries is principally engaged in providing fixed-line and telephony services to the public. The Group is also involved in providing financial assistance and loans to the ultimate Parent of the Group and its subsidiaries. The Half-Year Condensed Consolidated Financial Statements at June 30, 2017 of the Group were authorized for issue with a resolution of the Board of Directors on July 26, 2017. The Half-Year Condensed Consolidated Financial Statements at June 30, 2017 have been prepared in accordance with the International Financial Reporting Standards issued by the International Accounting Standards Board as endorsed by EU ("IFRS"). In particular, they have been prepared in accordance with IAS 34 (Interim Financial Reporting) and, as permitted by that standard, do not include all the information that would be required in annual financial statements; accordingly, these financial statements should be read together with the 2016 Telecom Italia Finance Group consolidated financial statements. For purposes of comparison, the consolidated statement of financial position at December 31, 2015 and the separate consolidated income statements, the consolidated statements of comprehensive income, the consolidated statements of cash flows, as well as the consolidated statements of changes in equity for the first half of 2016. The Half-Year Condensed Consolidated Financial Statements at June 30, 2017 have been prepared on a going concern basis (for further details see Note "Accounting policies"). The Consolidated Financial Statements are expressed in euro (rounded to the nearest million, unless otherwise indicated). FINANCIAL STATEMENT FORMATS The financial statement formats adopted are consistent with those indicated in IAS 1. In particular:
• the Consolidated Statement of Financial Position has been prepared by classifying assets and liabilities according to "current and non-current" criterion;
• the Separate Consolidated Income Statement has been prepared by classifying operating expenses by nature of expense as this form of presentation is considered more appropriate and representative of the specific business of the Group, conforms to internal reporting and is in line with the Group's industrial sector.
• the Consolidated Statement of Comprehensive Income includes the profit or loss for the period as shown in the Separate Consolidated Income Statement and all other non-owner changes in equity;
• the Consolidated Statement of Cash Flows has been prepared by presenting cash flows from operating activities according to the "indirect method", as permitted by IAS 7 (Statement of Cash Flows).
Furthermore, according to IAS 1 (paragraphs 97 and 98), certain expense and income items that are material in terms of nature and amount are separately disclosed in the notes to the separate consolidated income statement. Specifically, such items include: income/expenses arising from the disposal of property, plant and equipment, business segments and investments; expenses resulting from corporate restructuring, reorganizations and other corporate transactions (mergers, spin-offs, etc.); expenses resulting from regulatory disputes and penalties and associated liabilities; other provisions for risks and charges and related reversals; and impairment losses on goodwill and/or other tangible and intangible assets.

Half-Year Condensed Consolidated Financial Statements at June 30, 2017
Notes to the Half-Year Accounts
16 Telecom Italia Finance Group
SEGMENT REPORTING An operating segment is a component of an entity:
• that engages in business activities from which it may earn revenues and incur expenses (including revenues and expenses relating to transactions with other components of the same entity);
• whose operating results are regularly reviewed by the entity's chief operating decision maker to make decisions about resources to be allocated to the segment and assess its performance; and
• for which discrete financial information is available.
In particular, the operating segments of the Group are organized according to the specific businesses. The term operating segment is considered synonymous with Business Unit. The operating segments of the Group are as follows:
• Telecommunications (or Brazil Business Unit): includes mobile (TIM Celular) and fixed (TIM Celular and Intelig) telecommunications operations in Brazil;
• Other Operations: includes finance companies and other minor companies not strictly related to the core business of the Group.
For these Business Units, the Group has identified Chief Operating Decision Makers (CODMs) within the directors for each segment.
Accounting policies GOING CONCERN The Half-Year Condensed Consolidated Financial Statements at June 30, 2017 have been prepared on a going concern basis as there is the reasonable expectation that the Group will continue its operational activities in the foreseeable future (and in any event with a time horizon of at least twelve months). In particular, consideration has been given to the following factors:
• the main risks and uncertainties (that are for the most part of an external nature) to which the Group and the various activities of the Group are exposed:
– macroeconomic changes in the European and the Brazilian market, as well as the volatility of financial markets in the Eurozone, also as a result of the “Brexit” referendum in the United Kingdom;
– variations in business conditions, and fluctuations in the competitive environment; – changes to laws and regulations (price and rate variations or decisions that may affect the
technological choices); – outcomes of legal disputes and proceedings with regulatory authorities, competitors and other
parties; – financial risks (interest rate and/or exchange rate trends, changes in the Group's credit rating
by rating agencies); • the optimal mix between risk capital and debt capital; • the policy for financial risk management (market risk, credit risk and liquidity risk) as described in the
Note "Financial risk management" in the annual consolidated financial statements at December 31, 2016.
Management believes that, at this time, such factors do not raise substantial doubts as to the Group’s ability to continue as a going concern. ACCOUNTING POLICIES AND PRINCIPLES OF CONSOLIDATION The accounting policies and principles of consolidation adopted in the preparation of the Half-Year Condensed Consolidated Financial Statements at June 30, 2017 have been applied on a basis consistent with those used for the annual consolidated financial statements at December 31, 2016, to which reference should be made, except for the changes required because of the nature of interim financial reporting. Furthermore, in the Half-Year Condensed Consolidated Financial Statements at June 30, 2017, income taxes for the period of the individual consolidated companies are calculated according to the best possible estimate based on available information and on a reasonable forecast of performance up to the end of the tax period. Conventionally, the income tax liabilities (current and deferred) on the profit for the interim period of the individual consolidated companies are recorded net of advances and tax receivables (excluding receivables for which refunds have been requested) as well as deferred tax assets, and classified as an adjustment to "Deferred
Half-Year Condensed Consolidated Financial Statements at June 30, 2017
Notes to the Half-Year Accounts
Telecom Italia Finance Group 17
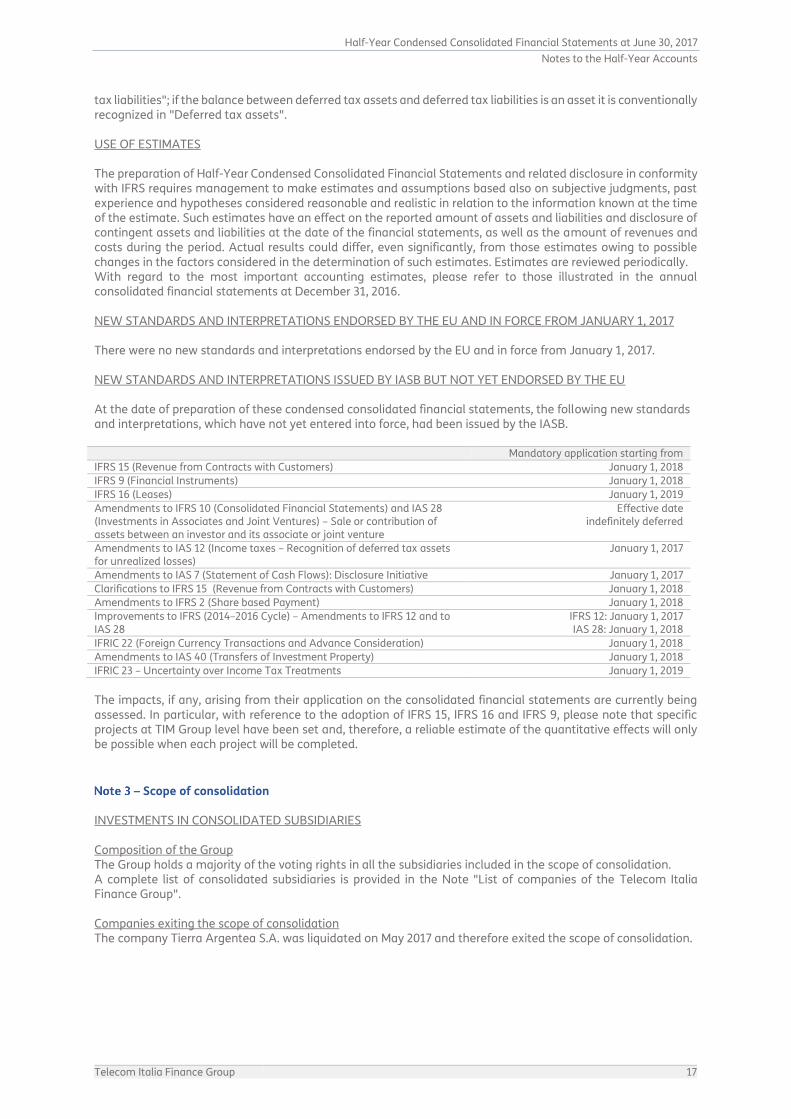
tax liabilities"; if the balance between deferred tax assets and deferred tax liabilities is an asset it is conventionally recognized in "Deferred tax assets". USE OF ESTIMATES The preparation of Half-Year Condensed Consolidated Financial Statements and related disclosure in conformity with IFRS requires management to make estimates and assumptions based also on subjective judgments, past experience and hypotheses considered reasonable and realistic in relation to the information known at the time of the estimate. Such estimates have an effect on the reported amount of assets and liabilities and disclosure of contingent assets and liabilities at the date of the financial statements, as well as the amount of revenues and costs during the period. Actual results could differ, even significantly, from those estimates owing to possible changes in the factors considered in the determination of such estimates. Estimates are reviewed periodically. With regard to the most important accounting estimates, please refer to those illustrated in the annual consolidated financial statements at December 31, 2016. NEW STANDARDS AND INTERPRETATIONS ENDORSED BY THE EU AND IN FORCE FROM JANUARY 1, 2017 There were no new standards and interpretations endorsed by the EU and in force from January 1, 2017. NEW STANDARDS AND INTERPRETATIONS ISSUED BY IASB BUT NOT YET ENDORSED BY THE EU At the date of preparation of these condensed consolidated financial statements, the following new standards and interpretations, which have not yet entered into force, had been issued by the IASB. Mandatory application starting from
IFRS 15 (Revenue from Contracts with Customers) January 1, 2018
IFRS 9 (Financial Instruments) January 1, 2018
IFRS 16 (Leases) January 1, 2019
Amendments to IFRS 10 (Consolidated Financial Statements) and IAS 28 (Investments in Associates and Joint Ventures) – Sale or contribution of assets between an investor and its associate or joint venture
Effective date indefinitely deferred
Amendments to IAS 12 (Income taxes – Recognition of deferred tax assets for unrealized losses)
January 1, 2017
Amendments to IAS 7 (Statement of Cash Flows): Disclosure Initiative January 1, 2017
Clarifications to IFRS 15 (Revenue from Contracts with Customers) January 1, 2018
Amendments to IFRS 2 (Share based Payment) January 1, 2018
Improvements to IFRS (2014–2016 Cycle) – Amendments to IFRS 12 and to IAS 28
IFRS 12: January 1, 2017 IAS 28: January 1, 2018
IFRIC 22 (Foreign Currency Transactions and Advance Consideration) January 1, 2018
Amendments to IAS 40 (Transfers of Investment Property) January 1, 2018
IFRIC 23 – Uncertainty over Income Tax Treatments January 1, 2019
The impacts, if any, arising from their application on the consolidated financial statements are currently being assessed. In particular, with reference to the adoption of IFRS 15, IFRS 16 and IFRS 9, please note that specific projects at TIM Group level have been set and, therefore, a reliable estimate of the quantitative effects will only be possible when each project will be completed.
Scope of consolidation INVESTMENTS IN CONSOLIDATED SUBSIDIARIES Composition of the Group The Group holds a majority of the voting rights in all the subsidiaries included in the scope of consolidation. A complete list of consolidated subsidiaries is provided in the Note "List of companies of the Telecom Italia Finance Group". Companies exiting the scope of consolidation The company Tierra Argentea S.A. was liquidated on May 2017 and therefore exited the scope of consolidation.
Half-Year Condensed Consolidated Financial Statements at June 30, 2017
Notes to the Half-Year Accounts
18 Telecom Italia Finance Group
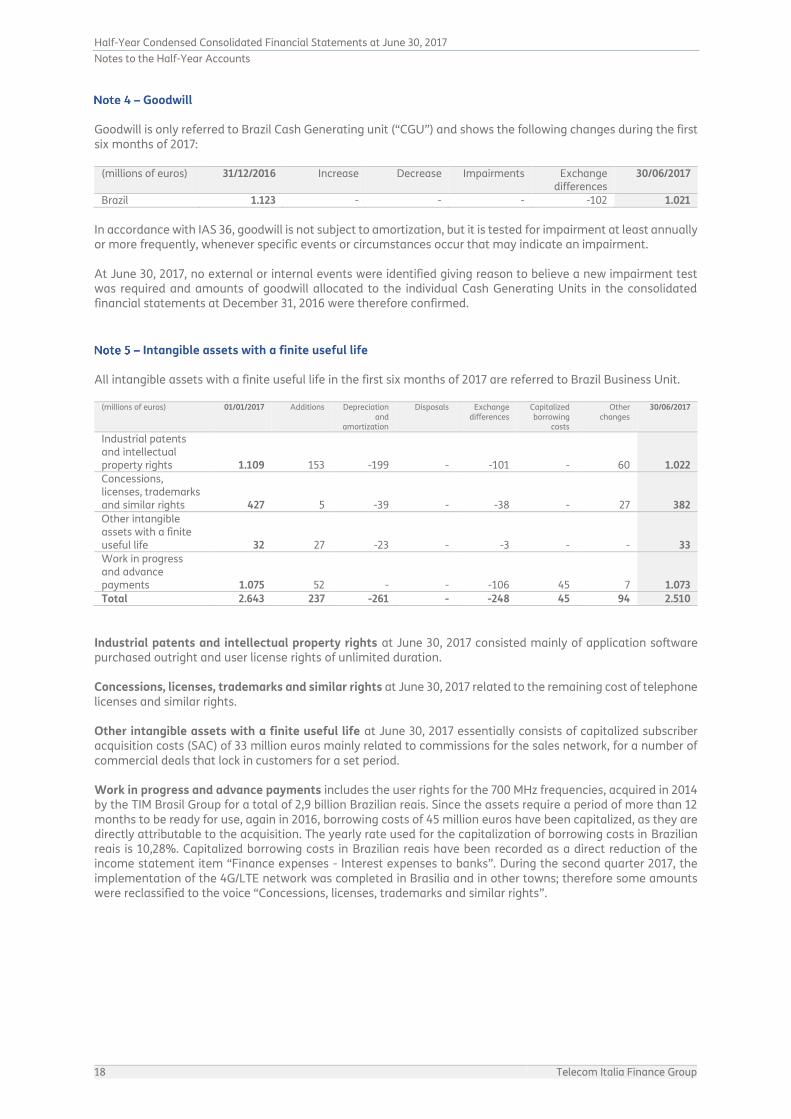
Goodwill Goodwill is only referred to Brazil Cash Generating unit (“CGU”) and shows the following changes during the first six months of 2017:
(millions of euros) 31/12/2016 Increase Decrease Impairments Exchange differences
30/06/2017
Brazil 1.123 - - - -102 1.021
In accordance with IAS 36, goodwill is not subject to amortization, but it is tested for impairment at least annually or more frequently, whenever specific events or circumstances occur that may indicate an impairment. At June 30, 2017, no external or internal events were identified giving reason to believe a new impairment test was required and amounts of goodwill allocated to the individual Cash Generating Units in the consolidated financial statements at December 31, 2016 were therefore confirmed.
Intangible assets with a finite useful life All intangible assets with a finite useful life in the first six months of 2017 are referred to Brazil Business Unit.
(millions of euros) 01/01/2017 Additions Depreciation and
amortization
Disposals Exchange differences
Capitalized borrowing
costs
Other changes
30/06/2017
Industrial patents and intellectual property rights 1.109 153 -199 - -101 - 60 1.022
Concessions, licenses, trademarks and similar rights 427 5 -39 - -38 - 27 382
Other intangible assets with a finite useful life 32 27 -23 - -3 - - 33
Work in progress and advance payments 1.075 52 - - -106 45 7 1.073
Total 2.643 237 -261 - -248 45 94 2.510
Industrial patents and intellectual property rights at June 30, 2017 consisted mainly of application software purchased outright and user license rights of unlimited duration. Concessions, licenses, trademarks and similar rights at June 30, 2017 related to the remaining cost of telephone licenses and similar rights. Other intangible assets with a finite useful life at June 30, 2017 essentially consists of capitalized subscriber acquisition costs (SAC) of 33 million euros mainly related to commissions for the sales network, for a number of commercial deals that lock in customers for a set period. Work in progress and advance payments includes the user rights for the 700 MHz frequencies, acquired in 2014 by the TIM Brasil Group for a total of 2,9 billion Brazilian reais. Since the assets require a period of more than 12 months to be ready for use, again in 2016, borrowing costs of 45 million euros have been capitalized, as they are directly attributable to the acquisition. The yearly rate used for the capitalization of borrowing costs in Brazilian reais is 10,28%. Capitalized borrowing costs in Brazilian reais have been recorded as a direct reduction of the income statement item “Finance expenses - Interest expenses to banks”. During the second quarter 2017, the implementation of the 4G/LTE network was completed in Brasilia and in other towns; therefore some amounts were reclassified to the voice “Concessions, licenses, trademarks and similar rights”.
Half-Year Condensed Consolidated Financial Statements at June 30, 2017
Notes to the Half-Year Accounts
Telecom Italia Finance Group 19
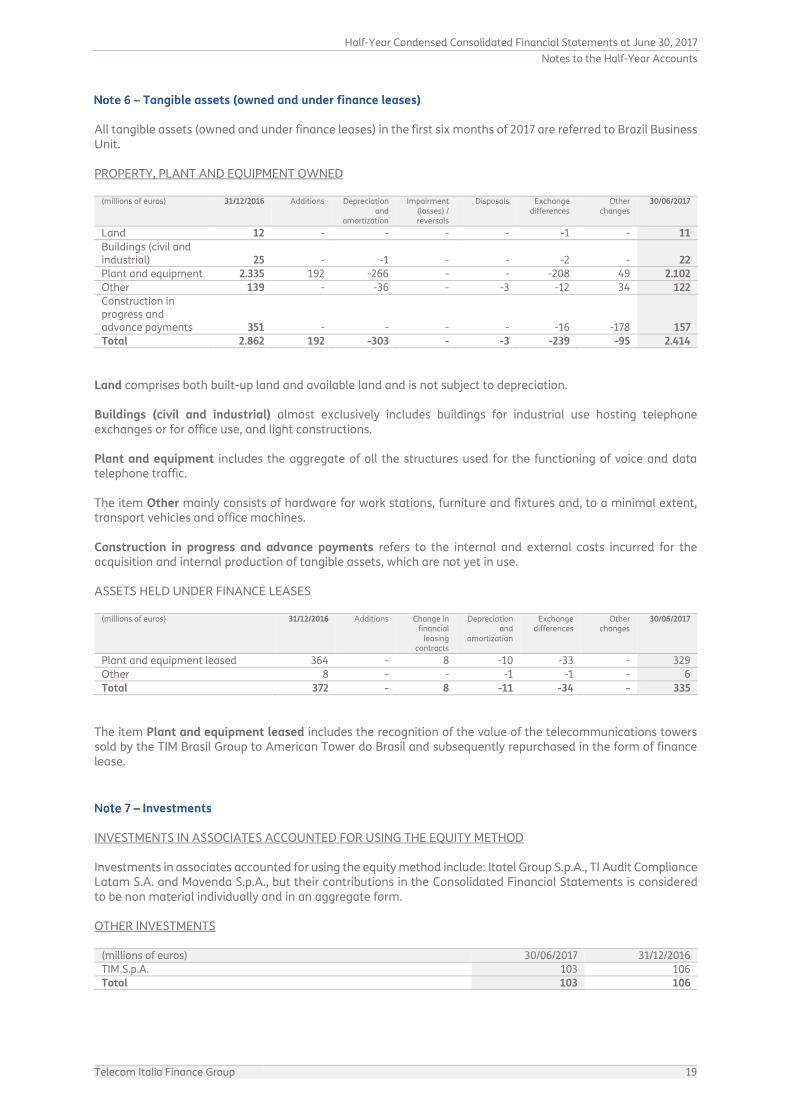
Tangible assets (owned and under finance leases) All tangible assets (owned and under finance leases) in the first six months of 2017 are referred to Brazil Business Unit. PROPERTY, PLANT AND EQUIPMENT OWNED
(millions of euros) 31/12/2016 Additions Depreciation and
amortization
Impairment (losses) / reversals
Disposals Exchange differences
Other changes
30/06/2017
Land 12 - - - - -1 - 11
Buildings (civil and industrial) 25 - -1 - - -2 - 22
Plant and equipment 2.335 192 -266 - - -208 49 2.102
Other 139 - -36 - -3 -12 34 122
Construction in progress and advance payments 351 - - - - -16 -178 157
Total 2.862 192 -303 - -3 -239 -95 2.414
Land comprises both built-up land and available land and is not subject to depreciation. Buildings (civil and industrial) almost exclusively includes buildings for industrial use hosting telephone exchanges or for office use, and light constructions. Plant and equipment includes the aggregate of all the structures used for the functioning of voice and data telephone traffic. The item Other mainly consists of hardware for work stations, furniture and fixtures and, to a minimal extent, transport vehicles and office machines. Construction in progress and advance payments refers to the internal and external costs incurred for the acquisition and internal production of tangible assets, which are not yet in use. ASSETS HELD UNDER FINANCE LEASES
(millions of euros) 31/12/2016 Additions Change in financial
leasing contracts
Depreciation and
amortization
Exchange differences
Other changes
30/06/2017
Plant and equipment leased 364 - 8 -10 -33 - 329
Other 8 - - -1 -1 - 6
Total 372 - 8 -11 -34 - 335
The item Plant and equipment leased includes the recognition of the value of the telecommunications towers sold by the TIM Brasil Group to American Tower do Brasil and subsequently repurchased in the form of finance lease.
Investments INVESTMENTS IN ASSOCIATES ACCOUNTED FOR USING THE EQUITY METHOD Investments in associates accounted for using the equity method include: Itatel Group S.p.A., TI Audit Compliance Latam S.A. and Movenda S.p.A., but their contributions in the Consolidated Financial Statements is considered to be non material individually and in an aggregate form. OTHER INVESTMENTS
(millions of euros) 30/06/2017 31/12/2016
TIM S.p.A. 103 106
Total 103 106
Half-Year Condensed Consolidated Financial Statements at June 30, 2017
Notes to the Half-Year Accounts
20 Telecom Italia Finance Group
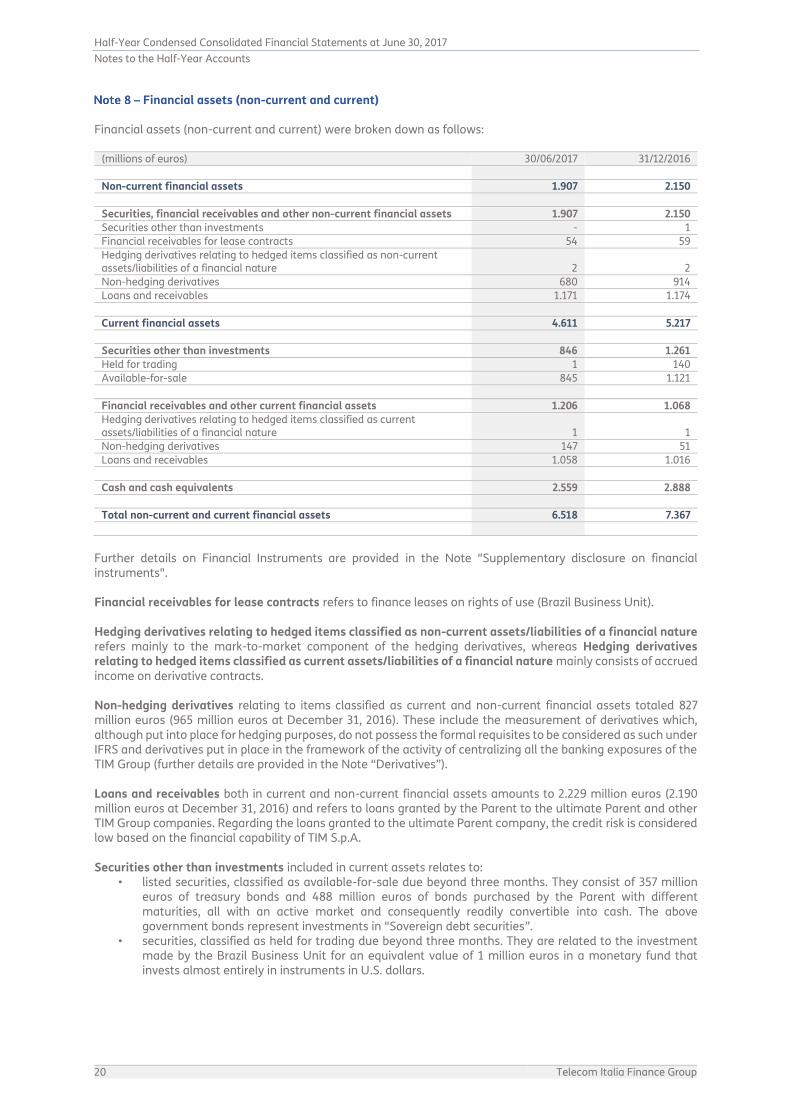
Financial assets (non-current and current) Financial assets (non-current and current) were broken down as follows:
(millions of euros) 30/06/2017 31/12/2016
Non-current financial assets 1.907 2.150
Securities, financial receivables and other non-current financial assets 1.907 2.150
Securities other than investments - 1
Financial receivables for lease contracts 54 59
Hedging derivatives relating to hedged items classified as non-current assets/liabilities of a financial nature 2 2
Non-hedging derivatives 680 914
Loans and receivables 1.171 1.174
Current financial assets 4.611 5.217
Securities other than investments 846 1.261
Held for trading 1 140
Available-for-sale 845 1.121
Financial receivables and other current financial assets 1.206 1.068
Hedging derivatives relating to hedged items classified as current assets/liabilities of a financial nature 1 1
Non-hedging derivatives 147 51
Loans and receivables 1.058 1.016
Cash and cash equivalents 2.559 2.888
Total non-current and current financial assets 6.518 7.367
Further details on Financial Instruments are provided in the Note "Supplementary disclosure on financial instruments". Financial receivables for lease contracts refers to finance leases on rights of use (Brazil Business Unit). Hedging derivatives relating to hedged items classified as non-current assets/liabilities of a financial nature refers mainly to the mark-to-market component of the hedging derivatives, whereas Hedging derivatives relating to hedged items classified as current assets/liabilities of a financial nature mainly consists of accrued income on derivative contracts. Non-hedging derivatives relating to items classified as current and non-current financial assets totaled 827 million euros (965 million euros at December 31, 2016). These include the measurement of derivatives which, although put into place for hedging purposes, do not possess the formal requisites to be considered as such under IFRS and derivatives put in place in the framework of the activity of centralizing all the banking exposures of the TIM Group (further details are provided in the Note “Derivatives”). Loans and receivables both in current and non-current financial assets amounts to 2.229 million euros (2.190 million euros at December 31, 2016) and refers to loans granted by the Parent to the ultimate Parent and other TIM Group companies. Regarding the loans granted to the ultimate Parent company, the credit risk is considered low based on the financial capability of TIM S.p.A. Securities other than investments included in current assets relates to:
• listed securities, classified as available-for-sale due beyond three months. They consist of 357 million euros of treasury bonds and 488 million euros of bonds purchased by the Parent with different maturities, all with an active market and consequently readily convertible into cash. The above government bonds represent investments in "Sovereign debt securities”.
• securities, classified as held for trading due beyond three months. They are related to the investment made by the Brazil Business Unit for an equivalent value of 1 million euros in a monetary fund that invests almost entirely in instruments in U.S. dollars.
Half-Year Condensed Consolidated Financial Statements at June 30, 2017
Notes to the Half-Year Accounts
Telecom Italia Finance Group 21
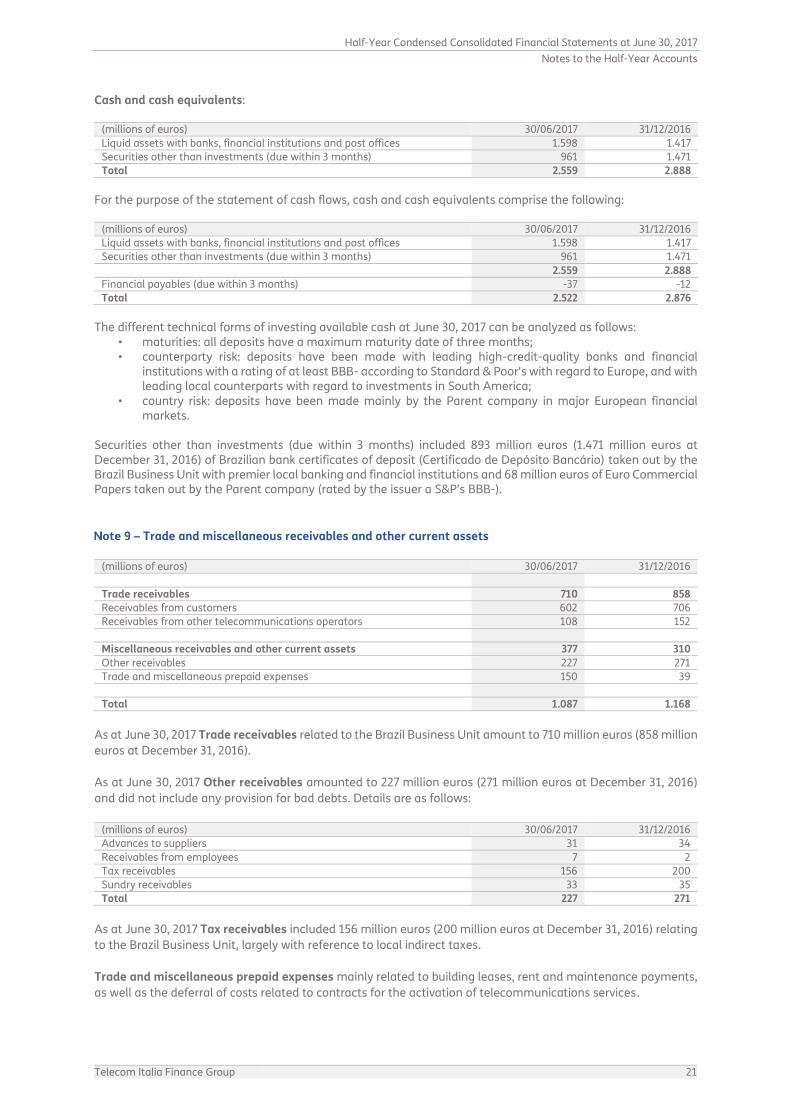
Cash and cash equivalents:
(millions of euros) 30/06/2017 31/12/2016
Liquid assets with banks, financial institutions and post offices 1.598 1.417
Securities other than investments (due within 3 months) 961 1.471
Total 2.559 2.888
For the purpose of the statement of cash flows, cash and cash equivalents comprise the following:
(millions of euros) 30/06/2017 31/12/2016
Liquid assets with banks, financial institutions and post offices 1.598 1.417
Securities other than investments (due within 3 months) 961 1.471
2.559 2.888
Financial payables (due within 3 months) -37 -12
Total 2.522 2.876
The different technical forms of investing available cash at June 30, 2017 can be analyzed as follows:
• maturities: all deposits have a maximum maturity date of three months; • counterparty risk: deposits have been made with leading high-credit-quality banks and financial
institutions with a rating of at least BBB- according to Standard & Poor's with regard to Europe, and with leading local counterparts with regard to investments in South America;
• country risk: deposits have been made mainly by the Parent company in major European financial markets.
Securities other than investments (due within 3 months) included 893 million euros (1.471 million euros at December 31, 2016) of Brazilian bank certificates of deposit (Certificado de Depósito Bancário) taken out by the Brazil Business Unit with premier local banking and financial institutions and 68 million euros of Euro Commercial Papers taken out by the Parent company (rated by the issuer a S&P’s BBB-).
Trade and miscellaneous receivables and other current assets
(millions of euros) 30/06/2017 31/12/2016
Trade receivables 710 858
Receivables from customers 602 706
Receivables from other telecommunications operators 108 152
Miscellaneous receivables and other current assets 377 310
Other receivables 227 271
Trade and miscellaneous prepaid expenses 150 39
Total 1.087 1.168
As at June 30, 2017 Trade receivables related to the Brazil Business Unit amount to 710 million euros (858 million
euros at December 31, 2016).
As at June 30, 2017 Other receivables amounted to 227 million euros (271 million euros at December 31, 2016)
and did not include any provision for bad debts. Details are as follows:
(millions of euros) 30/06/2017 31/12/2016
Advances to suppliers 31 34
Receivables from employees 7 2
Tax receivables 156 200
Sundry receivables 33 35
Total 227 271
As at June 30, 2017 Tax receivables included 156 million euros (200 million euros at December 31, 2016) relating
to the Brazil Business Unit, largely with reference to local indirect taxes.
Trade and miscellaneous prepaid expenses mainly related to building leases, rent and maintenance payments,
as well as the deferral of costs related to contracts for the activation of telecommunications services.
Half-Year Condensed Consolidated Financial Statements at June 30, 2017
Notes to the Half-Year Accounts
22 Telecom Italia Finance Group
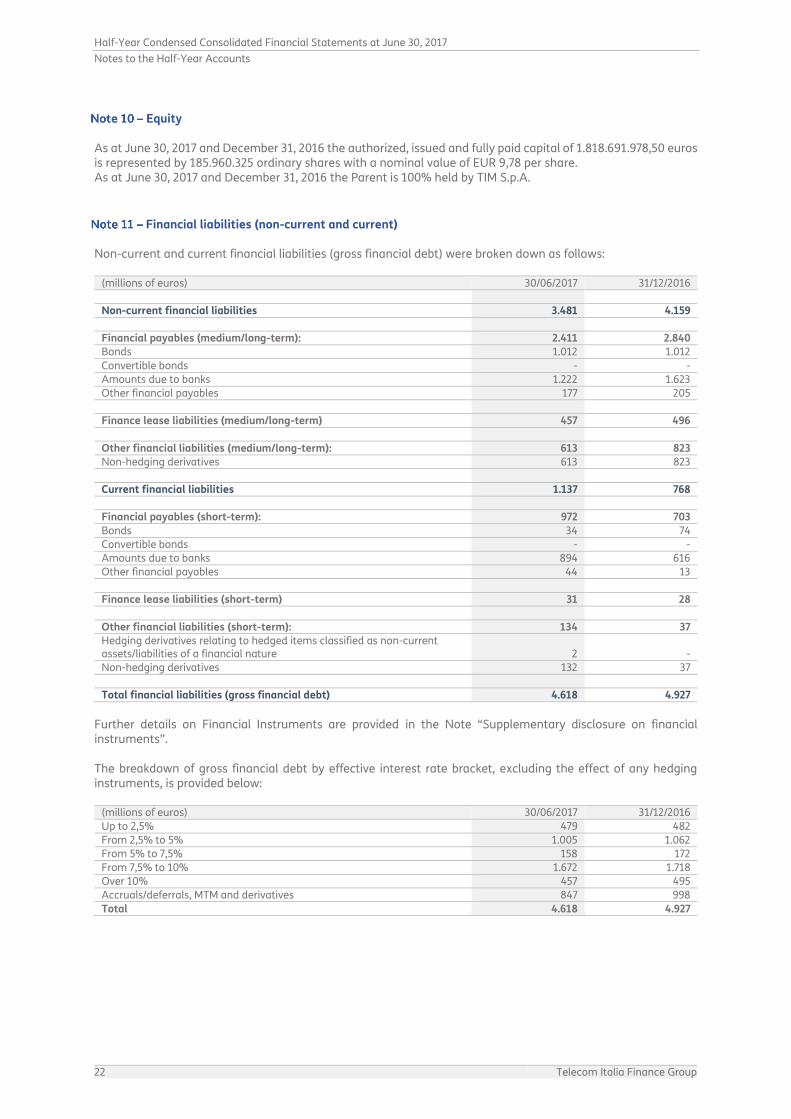
Equity As at June 30, 2017 and December 31, 2016 the authorized, issued and fully paid capital of 1.818.691.978,50 euros is represented by 185.960.325 ordinary shares with a nominal value of EUR 9,78 per share. As at June 30, 2017 and December 31, 2016 the Parent is 100% held by TIM S.p.A.
Financial liabilities (non-current and current) Non-current and current financial liabilities (gross financial debt) were broken down as follows:
(millions of euros) 30/06/2017 31/12/2016
Non-current financial liabilities 3.481 4.159
Financial payables (medium/long-term): 2.411 2.840
Bonds 1.012 1.012
Convertible bonds - -
Amounts due to banks 1.222 1.623
Other financial payables 177 205
Finance lease liabilities (medium/long-term) 457 496
Other financial liabilities (medium/long-term): 613 823
Non-hedging derivatives 613 823
Current financial liabilities 1.137 768
Financial payables (short-term): 972 703
Bonds 34 74
Convertible bonds - -
Amounts due to banks 894 616
Other financial payables 44 13
Finance lease liabilities (short-term) 31 28
Other financial liabilities (short-term): 134 37
Hedging derivatives relating to hedged items classified as non-current assets/liabilities of a financial nature 2 -
Non-hedging derivatives 132 37
Total financial liabilities (gross financial debt) 4.618 4.927
Further details on Financial Instruments are provided in the Note “Supplementary disclosure on financial instruments”. The breakdown of gross financial debt by effective interest rate bracket, excluding the effect of any hedging instruments, is provided below:
(millions of euros) 30/06/2017 31/12/2016
Up to 2,5% 479 482
From 2,5% to 5% 1.005 1.062
From 5% to 7,5% 158 172
From 7,5% to 10% 1.672 1.718
Over 10% 457 495
Accruals/deferrals, MTM and derivatives 847 998
Total 4.618 4.927
Half-Year Condensed Consolidated Financial Statements at June 30, 2017
Notes to the Half-Year Accounts
Telecom Italia Finance Group 23
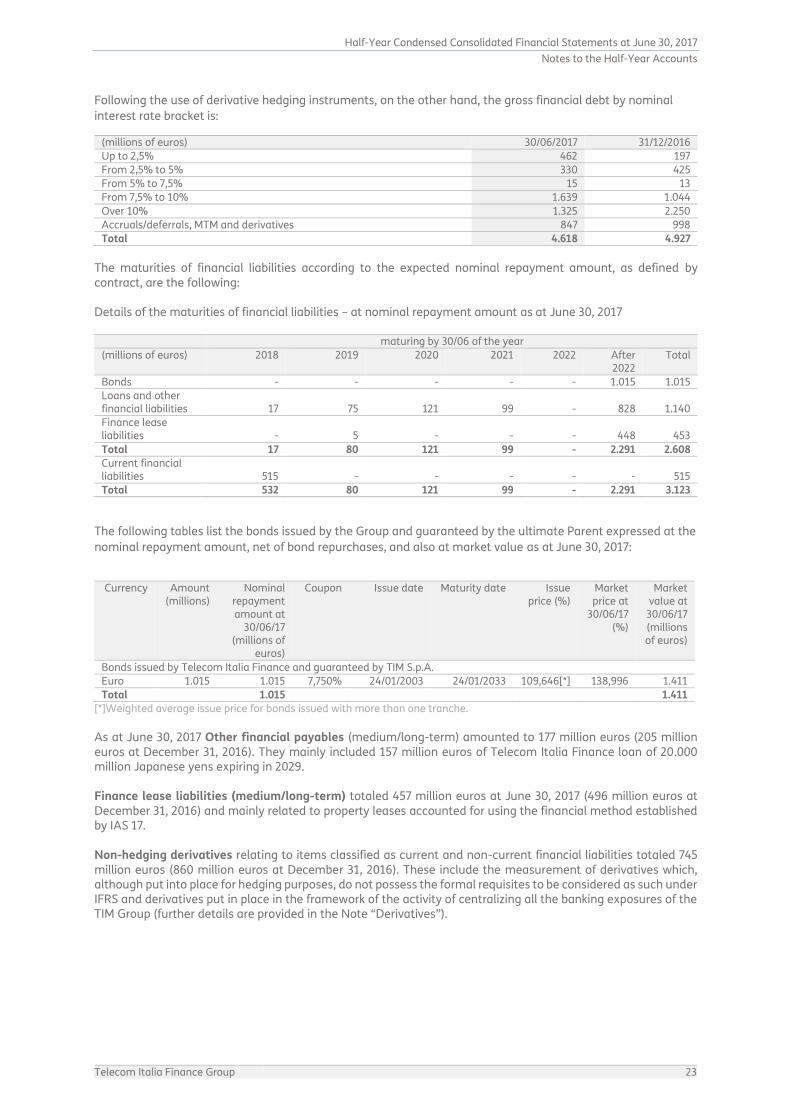
Following the use of derivative hedging instruments, on the other hand, the gross financial debt by nominal
interest rate bracket is:
(millions of euros) 30/06/2017 31/12/2016
Up to 2,5% 462 197
From 2,5% to 5% 330 425
From 5% to 7,5% 15 13
From 7,5% to 10% 1.639 1.044
Over 10% 1.325 2.250
Accruals/deferrals, MTM and derivatives 847 998
Total 4.618 4.927
The maturities of financial liabilities according to the expected nominal repayment amount, as defined by contract, are the following: Details of the maturities of financial liabilities – at nominal repayment amount as at June 30, 2017
maturing by 30/06 of the year
(millions of euros) 2018 2019 2020 2021 2022 After 2022
Total
Bonds - - - - - 1.015 1.015
Loans and other financial liabilities 17 75 121 99 - 828 1.140
Finance lease liabilities - 5 - - - 448 453
Total 17 80 121 99 - 2.291 2.608
Current financial liabilities 515 - - - - - 515
Total 532 80 121 99 - 2.291 3.123
The following tables list the bonds issued by the Group and guaranteed by the ultimate Parent expressed at the
nominal repayment amount, net of bond repurchases, and also at market value as at June 30, 2017:
Currency Amount
(millions) Nominal
repayment amount at
30/06/17 (millions of
euros)
Coupon Issue date Maturity date Issue price (%)
Market price at
30/06/17 (%)
Market value at 30/06/17 (millions of euros)
Bonds issued by Telecom Italia Finance and guaranteed by TIM S.p.A.
Euro 1.015 1.015 7,750% 24/01/2003 24/01/2033 109,646[*] 138,996 1.411
Total 1.015 1.411
[*]Weighted average issue price for bonds issued with more than one tranche.
As at June 30, 2017 Other financial payables (medium/long-term) amounted to 177 million euros (205 million euros at December 31, 2016). They mainly included 157 million euros of Telecom Italia Finance loan of 20.000 million Japanese yens expiring in 2029. Finance lease liabilities (medium/long-term) totaled 457 million euros at June 30, 2017 (496 million euros at December 31, 2016) and mainly related to property leases accounted for using the financial method established by IAS 17. Non-hedging derivatives relating to items classified as current and non-current financial liabilities totaled 745 million euros (860 million euros at December 31, 2016). These include the measurement of derivatives which, although put into place for hedging purposes, do not possess the formal requisites to be considered as such under IFRS and derivatives put in place in the framework of the activity of centralizing all the banking exposures of the TIM Group (further details are provided in the Note “Derivatives”).

Half-Year Condensed Consolidated Financial Statements at June 30, 2017
Notes to the Half-Year Accounts
24 Telecom Italia Finance Group
Net financial debt The following table shows the net financial debt at June 30, 2017 and December 31, 2016.
(millions of euros) 30/06/2017 31/12/2016
Non-current financial liabilities 3.481 4.159
Current financial liabilities 1.137 768
Total gross financial debt 4.618 4.927
Non-current financial assets -56 -61
Non-current financial receivables for lease contract -54 -59
Non-current hedging derivatives -2 -2
Current financial assets -4.611 -5.217
Securities other than investments -846 -1.261
Financial receivables and other current financial assets -1.206 -1.068
Cash and cash equivalents -2.559 -2.888
Net financial debt as per ESMA -49 -351
Non-current financial assets -1.851 -2.089
Other Securities other than investments - -1
Other financial receivables and other non-current financial assets -1.851 -2.088
Net financial debt [*] -1.900 -2.440
[*] For details of the effects of related party transactions on net financial debt, see the specific table in the Note "Related party transactions".
Derivatives Derivative financial instruments are used by the Group to hedge its exposure to foreign exchange rate risk, to manage interest rate risk and to diversify the parameters of debt so that costs and volatility can be reduced to within predetermined operational limits. Derivative financial instruments in place at June 30, 2017 are principally used to manage debt positions. They include interest rate swaps (IRSs) to reduce interest rate exposure on fixed-rate and variable-rate bank loans and bonds, as well as cross currency and interest rate swaps (CCIRSs), and currency forwards to convert the loans/receivables secured in currencies different from the functional currencies of the various Group companies. IRS transactions, provide for or may entail, at specified maturity dates, the exchange of flows of interest, calculated on the notional amount, at the agreed fixed or variable rates. The same also applies to CCIRS transactions which, in addition to the settlement of periodic interest flows, may provide for the exchange of principal, in the respective currencies of denomination, at maturity and possibly spot. In carrying out its role of providing financial assistance to TIM Group companies, Telecom Italia Finance aggregates all the exposure with some banking counterparties in just one entity. As a consequence, the Group has derivative contracts signed with banks and analogous intercompany derivative contracts with other TIM Group companies for a notional amount of 3.817 million euros (3.885 at December 31, 2016). The balance of asset and liability measurements of these contracts is equal to zero.
Half-Year Condensed Consolidated Financial Statements at June 30, 2017
Notes to the Half-Year Accounts
Telecom Italia Finance Group 25
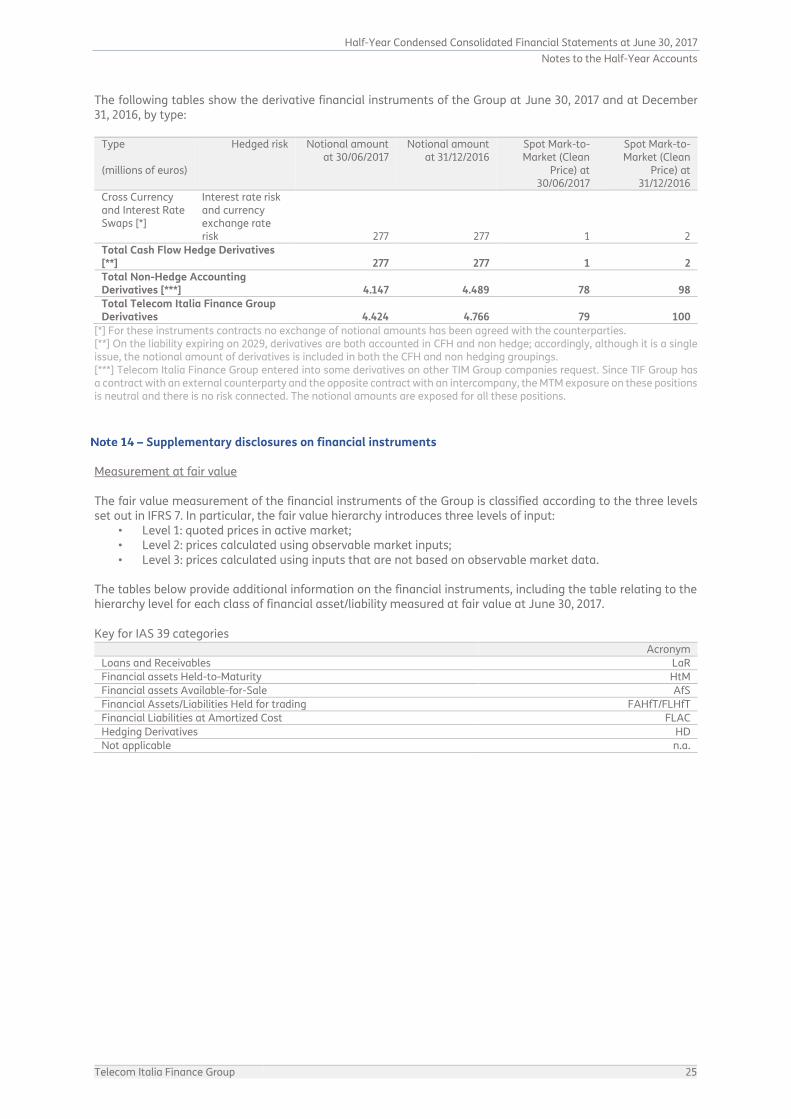
The following tables show the derivative financial instruments of the Group at June 30, 2017 and at December 31, 2016, by type:
Type (millions of euros)
Hedged risk Notional amount at 30/06/2017
Notional amount at 31/12/2016
Spot Mark-to-Market (Clean
Price) at 30/06/2017
Spot Mark-to-Market (Clean
Price) at 31/12/2016
Cross Currency and Interest Rate Swaps [*]
Interest rate risk and currency exchange rate risk 277 277 1 2
Total Cash Flow Hedge Derivatives [**] 277 277 1 2
Total Non-Hedge Accounting Derivatives [***] 4.147 4.489 78 98
Total Telecom Italia Finance Group Derivatives 4.424 4.766 79 100
[*] For these instruments contracts no exchange of notional amounts has been agreed with the counterparties. [**] On the liability expiring on 2029, derivatives are both accounted in CFH and non hedge; accordingly, although it is a single issue, the notional amount of derivatives is included in both the CFH and non hedging groupings. [***] Telecom Italia Finance Group entered into some derivatives on other TIM Group companies request. Since TIF Group has a contract with an external counterparty and the opposite contract with an intercompany, the MTM exposure on these positions is neutral and there is no risk connected. The notional amounts are exposed for all these positions.
Supplementary disclosures on financial instruments Measurement at fair value The fair value measurement of the financial instruments of the Group is classified according to the three levels set out in IFRS 7. In particular, the fair value hierarchy introduces three levels of input:
• Level 1: quoted prices in active market; • Level 2: prices calculated using observable market inputs; • Level 3: prices calculated using inputs that are not based on observable market data.
The tables below provide additional information on the financial instruments, including the table relating to the hierarchy level for each class of financial asset/liability measured at fair value at June 30, 2017. Key for IAS 39 categories
Acronym
Loans and Receivables LaR
Financial assets Held-to-Maturity HtM
Financial assets Available-for-Sale AfS
Financial Assets/Liabilities Held for trading FAHfT/FLHfT
Financial Liabilities at Amortized Cost FLAC
Hedging Derivatives HD
Not applicable n.a.
Half-Year Condensed Consolidated Financial Statements at June 30, 2017
Notes to the Half-Year Accounts
26 Telecom Italia Finance Group
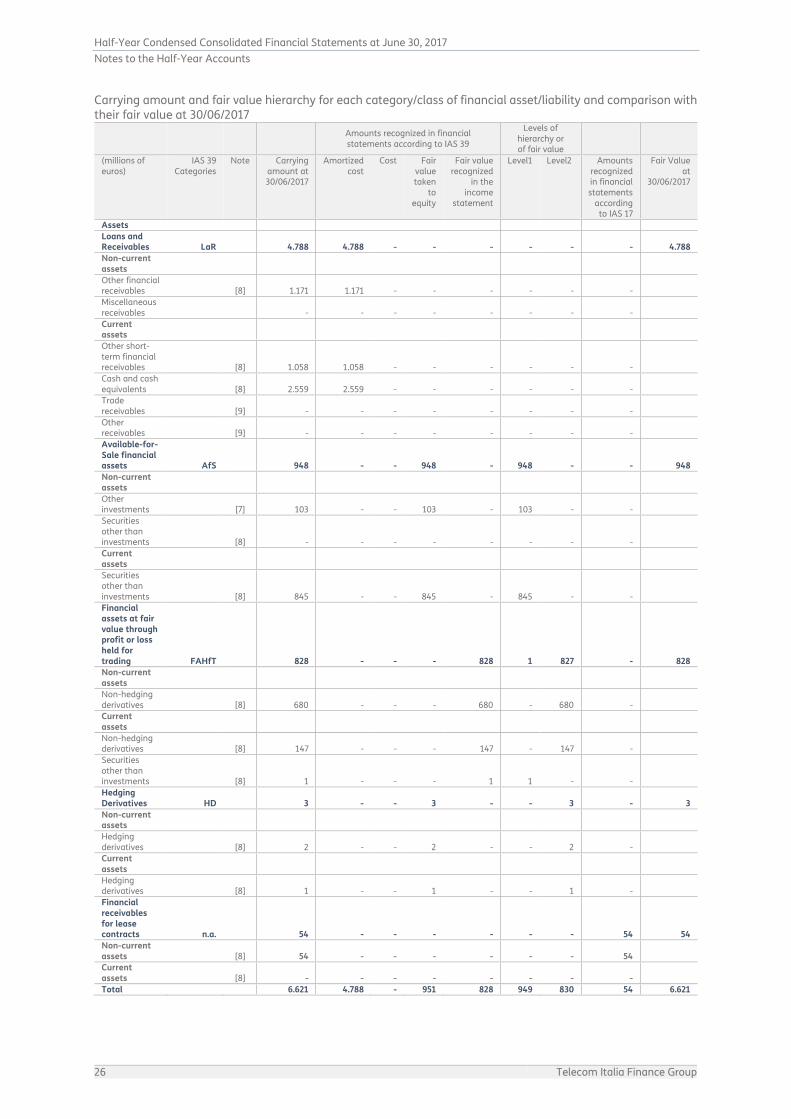
Carrying amount and fair value hierarchy for each category/class of financial asset/liability and comparison with their fair value at 30/06/2017
Amounts recognized in financial statements according to IAS 39
Levels of hierarchy or of fair value
(millions of euros)
IAS 39 Categories
Note Carrying amount at 30/06/2017
Amortized cost
Cost Fair value taken
to equity
Fair value recognized
in the income
statement
Level1 Level2 Amounts recognized in financial statements
according to IAS 17
Fair Value at
30/06/2017
Assets
Loans and Receivables LaR 4.788 4.788 - - - - - - 4.788
Non-current assets
Other financial receivables [8] 1.171 1.171 - - - - - -
Miscellaneous receivables - - - - - - - -
Current assets
Other short-term financial receivables [8] 1.058 1.058 - - - - - -
Cash and cash equivalents [8] 2.559 2.559 - - - - - -
Trade receivables [9] - - - - - - - -
Other receivables [9] - - - - - - - -
Available-for-Sale financial assets AfS 948 - - 948 - 948 - - 948
Non-current assets
Other investments [7] 103 - - 103 - 103 - -
Securities other than investments [8] - - - - - - - -
Current assets
Securities other than investments [8] 845 - - 845 - 845 - -
Financial assets at fair value through profit or loss held for trading FAHfT 828 - - - 828 1 827 - 828
Non-current assets
Non-hedging derivatives [8] 680 - - - 680 - 680 -
Current assets
Non-hedging derivatives [8] 147 - - - 147 - 147 -
Securities other than investments [8] 1 - - - 1 1 - -
Hedging Derivatives HD 3 - - 3 - - 3 - 3
Non-current assets
Hedging derivatives [8] 2 - - 2 - - 2 -
Current assets
Hedging derivatives [8] 1 - - 1 - - 1 -
Financial receivables for lease contracts n.a. 54 - - - - - - 54 54
Non-current assets [8] 54 - - - - - - 54
Current assets [8] - - - - - - - -
Total 6.621 4.788 - 951 828 949 830 54 6.621

Half-Year Condensed Consolidated Financial Statements at June 30, 2017
Notes to the Half-Year Accounts
Telecom Italia Finance Group 27
Amounts recognized in financial statements according to IAS 39
Levels of hierarchy or of fair value
(millions of euros)
IAS 39 Categories
Note Carrying amount
30/06/2017
Amortized cost
Cost Fair value taken
to equity
Fair value recognized
in the income
statement
Level1 Level2 Amounts recognized in financial statements
according to IAS 17
Fair Value at
30/06/2017
Liabilities
Financial Liabilities at Amortized Cost FLAC/HD 4.317 4.317 - - - - - - 4.716
Non-current liabilities
Financial payables [11] 2.411 2.411 - - - - - -
Current liabilities
Financial payables [11] 972 972 - - - - - -
Trade and miscellaneous payables and other current liabilities [16] 934 934 - - - - - -
Financial liabilities at fair value through profit or loss held for trading FLHfT 745 - - - 745 - 745 - 745
Non-current liabilities
Non-hedging derivatives [11] 613 - - - 613 - 613 -
Current liabilities
Non-hedging derivatives [11] 132 - - - 132 - 132 -
Hedging Derivatives HD 2 - - 2 - - 2 - 2
Current liabilities
Hedging derivatives [11] 2 - - 2 - - 2 -
Finance lease liabilities n.a. 488 - - - - - - 488 488
Non-current liabilities [11] 457 - - - - - - 457
Current liabilities [11] 31 - - - - - - 31
Total 5.552 4.317 - 2 745 - 747 488 5.951
Half-Year Condensed Consolidated Financial Statements at June 30, 2017
Notes to the Half-Year Accounts
28 Telecom Italia Finance Group
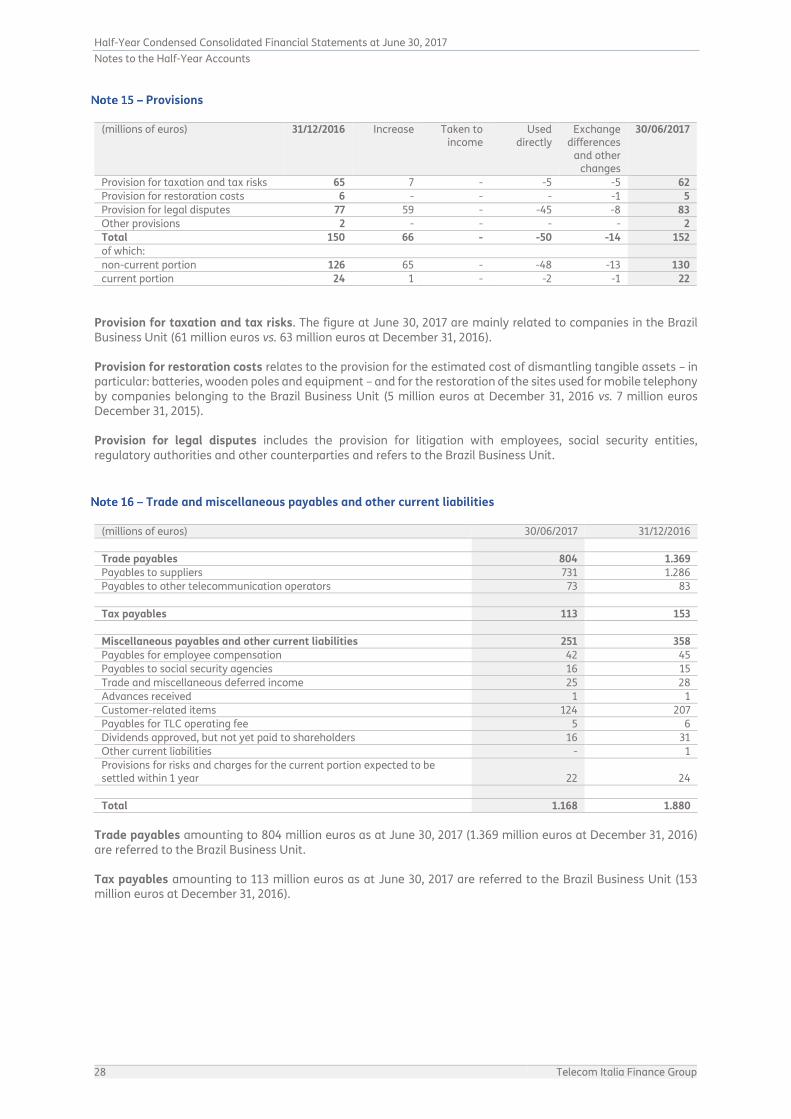
Provisions
(millions of euros) 31/12/2016 Increase Taken to income
Used directly
Exchange differences
and other changes
30/06/2017
Provision for taxation and tax risks 65 7 - -5 -5 62
Provision for restoration costs 6 - - - -1 5
Provision for legal disputes 77 59 - -45 -8 83
Other provisions 2 - - - - 2
Total 150 66 - -50 -14 152
of which:
non-current portion 126 65 - -48 -13 130
current portion 24 1 - -2 -1 22
Provision for taxation and tax risks. The figure at June 30, 2017 are mainly related to companies in the Brazil Business Unit (61 million euros vs. 63 million euros at December 31, 2016). Provision for restoration costs relates to the provision for the estimated cost of dismantling tangible assets – in particular: batteries, wooden poles and equipment – and for the restoration of the sites used for mobile telephony by companies belonging to the Brazil Business Unit (5 million euros at December 31, 2016 vs. 7 million euros December 31, 2015). Provision for legal disputes includes the provision for litigation with employees, social security entities, regulatory authorities and other counterparties and refers to the Brazil Business Unit.
Trade and miscellaneous payables and other current liabilities
(millions of euros) 30/06/2017 31/12/2016
Trade payables 804 1.369
Payables to suppliers 731 1.286
Payables to other telecommunication operators 73 83
Tax payables 113 153
Miscellaneous payables and other current liabilities 251 358
Payables for employee compensation 42 45
Payables to social security agencies 16 15
Trade and miscellaneous deferred income 25 28
Advances received 1 1
Customer-related items 124 207
Payables for TLC operating fee 5 6
Dividends approved, but not yet paid to shareholders 16 31
Other current liabilities - 1
Provisions for risks and charges for the current portion expected to be settled within 1 year 22 24
Total 1.168 1.880
Trade payables amounting to 804 million euros as at June 30, 2017 (1.369 million euros at December 31, 2016) are referred to the Brazil Business Unit. Tax payables amounting to 113 million euros as at June 30, 2017 are referred to the Brazil Business Unit (153 million euros at December 31, 2016).
Half-Year Condensed Consolidated Financial Statements at June 30, 2017
Notes to the Half-Year Accounts
Telecom Italia Finance Group 29
Contingent liabilities, other information, commitments and guarantees A description is provided below of the most significant judicial, arbitration and tax disputes in which the Group companies are involved as at June 30, 2017, as well as those that came to an end during the financial period. SIGNIFICANT DISPUTES AND PENDING LEGAL ACTIONS Brazil - Opportunity Arbitration In May 2012, Telecom Italia S.p.A. and Telecom Italia International N.V. were served with an arbitration brought by the Opportunity Group, claiming restoration of damages allegedly suffered as a consequence of the presumed breach of a certain settlement agreement signed in 2005. Based on claimant’s allegations, such damages would be related to matters emerging in the context of the criminal proceedings pending before the Court of Milan regarding, among others, unlawful activities of former employees of Telecom Italia. The investigatory phase has been completed and the hearing took place in November 2014, after which the parties filed their concluding arguments in preparation for the decision on the case. In September 2015, the Board of Arbitration declared the proceedings closed as the award was going to be filed. Subsequently, the Board of Arbitration allowed the parties to exchange short arguments and the ICC Court extended the term for the filing of the award. In September 2016, the ICC Court notified the parties of its judgment, based on which the Board of Arbitration rejected all the claims made by the Opportunity group and decided that the legal costs, administrative costs and costs for expert witnesses should be split between the parties. In April 2017, the Opportunity group filed an appeal against the arbitration award before the Court of Appeal of Paris and in May 2017, Opportunity Group filed its brief on the merit with the alleged grounds of the appeal. Brazil – CAM JVCO Arbitration In September 2015, JVCO Participações Ltda. filed an application for arbitration before the Camara de Arbitragem do Mercado (CAM), based in Rio de Janeiro, against Telecom Italia S.p.A., Telecom Italia International N.V., Brasil Serviços e Participações S.A. and Tim Participações S.A., claiming compensation for damages due to an alleged abuse of controlling power over Tim Participações. In October, all the companies entered appearances and filed statements of defence and TIM Participações filed a counterclaim asking for JVCO condemnation for abuse of minority rights. Subsequently, the Arbitral Tribunal was formed and in the month of May 2016 the preliminary hearing was held, wherein the Terms of Reference were signed. After the hearing, the Arbitral Tribunal issued a procedural order, accepting the request of the TIM Group about the preliminary examination of the question of standing to sue of JVCO and setting the provisional calendar of arbitration. In June 2016, the parties exchanged their submissions and in their defenses Telecom Italia S.p.A., Telecom Italia International N.V., Tim Brasil Serviços e Participações S.A. and Tim Participações S.A. contested the standing to sue of the counterparty, to be sued of Tim Participações and disputed the existence of the abuse of power. In July, the parties filed their statements of defence. On October 19, 2016 the Arbitral Tribunal issued a procedural order on the preliminary issues regarding the lack of standing to sue of the parties, founding the standing to sue of JVCO and to be sued of TIM Participações and fixing the calendar for the subsequent filings of the parties. On November 21, 2016 and on December 19, 2016 the parties filed their further replies. On January 31, 2017, the Arbitral Tribunal issued a procedural order on procedural matter, summarizing the main controversial issues of the proceedings and setting forth the step of the evidentiary phase. The parties have then indicated the means of proof they intend to produce in the proceedings; subsequently, the Arbitral Tribunal fixed the dates for the hearings. In April 2017, the parties indicated the witnesses and experts they intended to hear at the hearings and filed additional documentation. In the month of June 2017, the hearings were held in Rio de Janeiro and in July 2017, the parties filed further documentation and asked for documentation to be produced by the counterparty. COMMITMENTS AND GUARANTEES TIM S.p.A. has provided to the Group the following guarantees:
(millions of euros) 30/06/2017 31/12/2016
Guarantee on bonds issued by the Group 1.172 1.177
Guarantee on derivatives financial instruments 205 210
Total 1.377 1.387
There are also surety bonds on the telecommunication services in Brazil for 571 million euros.
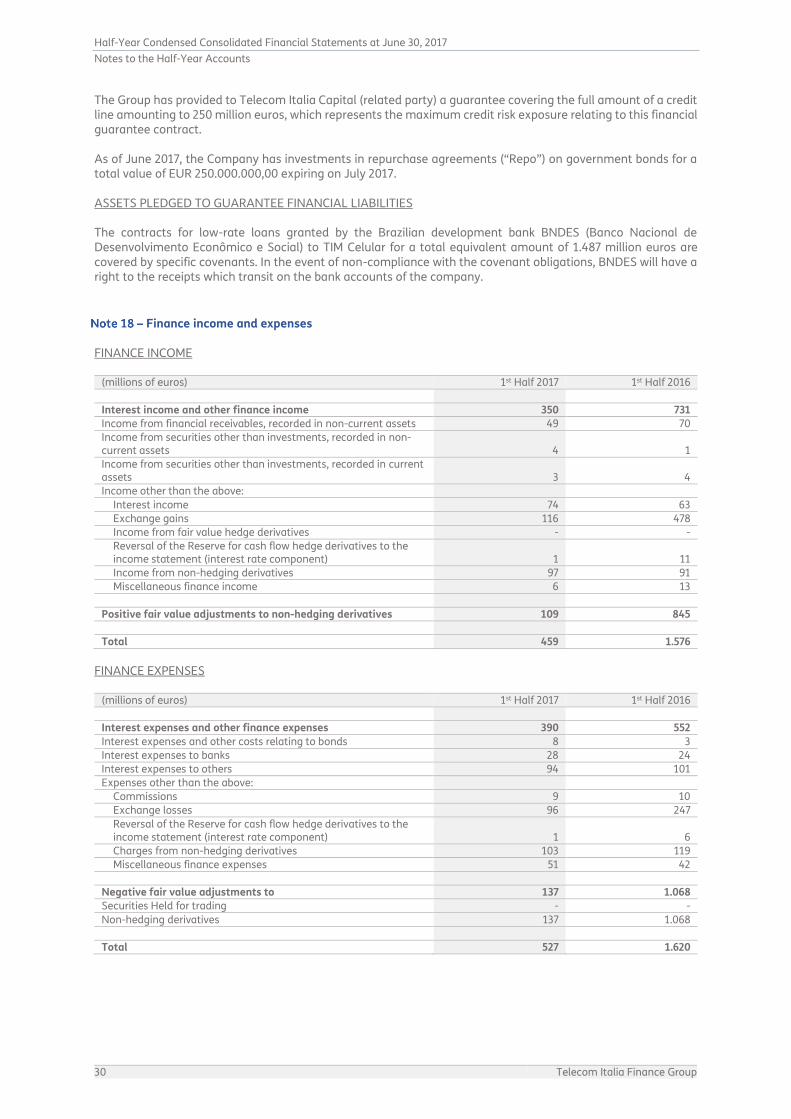
Half-Year Condensed Consolidated Financial Statements at June 30, 2017
Notes to the Half-Year Accounts
30 Telecom Italia Finance Group
The Group has provided to Telecom Italia Capital (related party) a guarantee covering the full amount of a credit line amounting to 250 million euros, which represents the maximum credit risk exposure relating to this financial guarantee contract. As of June 2017, the Company has investments in repurchase agreements (“Repo”) on government bonds for a total value of EUR 250.000.000,00 expiring on July 2017. ASSETS PLEDGED TO GUARANTEE FINANCIAL LIABILITIES The contracts for low-rate loans granted by the Brazilian development bank BNDES (Banco Nacional de Desenvolvimento Econômico e Social) to TIM Celular for a total equivalent amount of 1.487 million euros are covered by specific covenants. In the event of non-compliance with the covenant obligations, BNDES will have a right to the receipts which transit on the bank accounts of the company.
Finance income and expenses FINANCE INCOME
(millions of euros) 1st Half 2017 1st Half 2016
Interest income and other finance income 350 731
Income from financial receivables, recorded in non-current assets 49 70
Income from securities other than investments, recorded in non-current assets 4 1
Income from securities other than investments, recorded in current assets 3 4
Income other than the above:
Interest income 74 63
Exchange gains 116 478
Income from fair value hedge derivatives - -
Reversal of the Reserve for cash flow hedge derivatives to the income statement (interest rate component) 1 11
Income from non-hedging derivatives 97 91
Miscellaneous finance income 6 13
Positive fair value adjustments to non-hedging derivatives 109 845
Total 459 1.576
FINANCE EXPENSES
(millions of euros) 1st Half 2017 1st Half 2016
Interest expenses and other finance expenses 390 552
Interest expenses and other costs relating to bonds 8 3
Interest expenses to banks 28 24
Interest expenses to others 94 101
Expenses other than the above:
Commissions 9 10
Exchange losses 96 247
Reversal of the Reserve for cash flow hedge derivatives to the income statement (interest rate component) 1 6
Charges from non-hedging derivatives 103 119
Miscellaneous finance expenses 51 42
Negative fair value adjustments to 137 1.068
Securities Held for trading - -
Non-hedging derivatives 137 1.068
Total 527 1.620
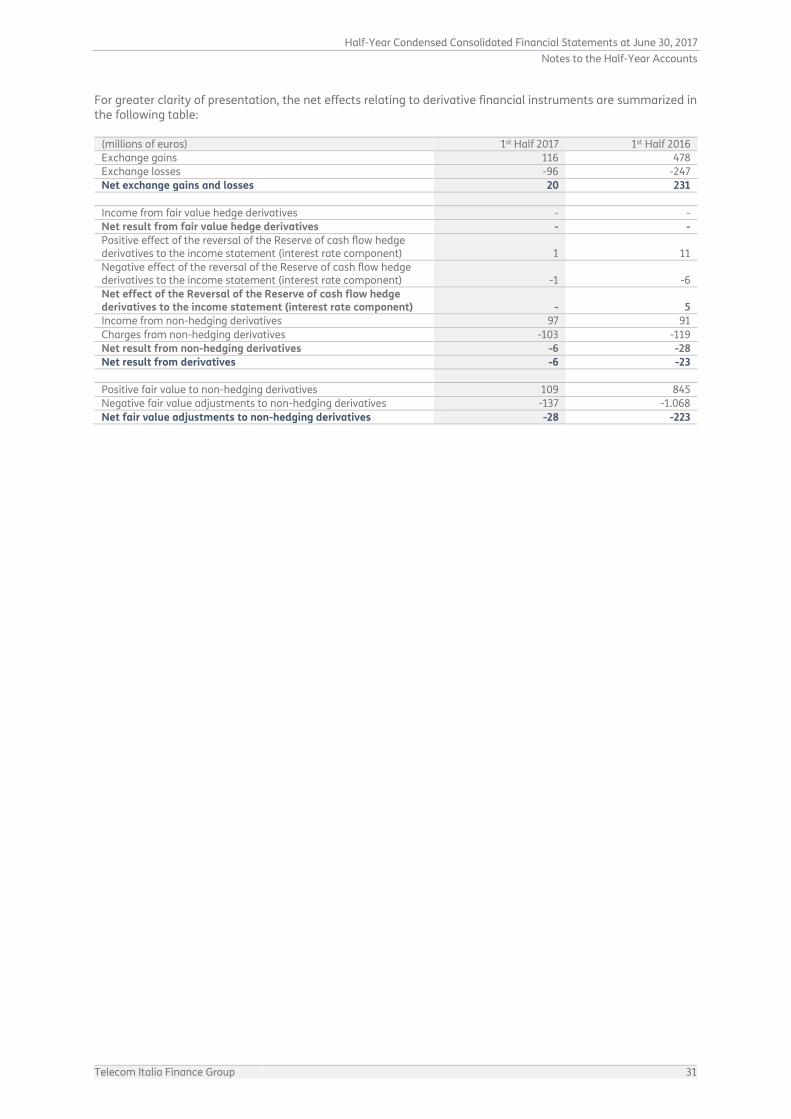
Half-Year Condensed Consolidated Financial Statements at June 30, 2017
Notes to the Half-Year Accounts
Telecom Italia Finance Group 31
For greater clarity of presentation, the net effects relating to derivative financial instruments are summarized in the following table:
(millions of euros) 1st Half 2017 1st Half 2016
Exchange gains 116 478
Exchange losses -96 -247
Net exchange gains and losses 20 231
Income from fair value hedge derivatives - -
Net result from fair value hedge derivatives - -
Positive effect of the reversal of the Reserve of cash flow hedge derivatives to the income statement (interest rate component) 1 11
Negative effect of the reversal of the Reserve of cash flow hedge derivatives to the income statement (interest rate component) -1 -6
Net effect of the Reversal of the Reserve of cash flow hedge derivatives to the income statement (interest rate component) - 5
Income from non-hedging derivatives 97 91
Charges from non-hedging derivatives -103 -119
Net result from non-hedging derivatives -6 -28
Net result from derivatives -6 -23
Positive fair value to non-hedging derivatives 109 845
Negative fair value adjustments to non-hedging derivatives -137 -1.068
Net fair value adjustments to non-hedging derivatives -28 -223
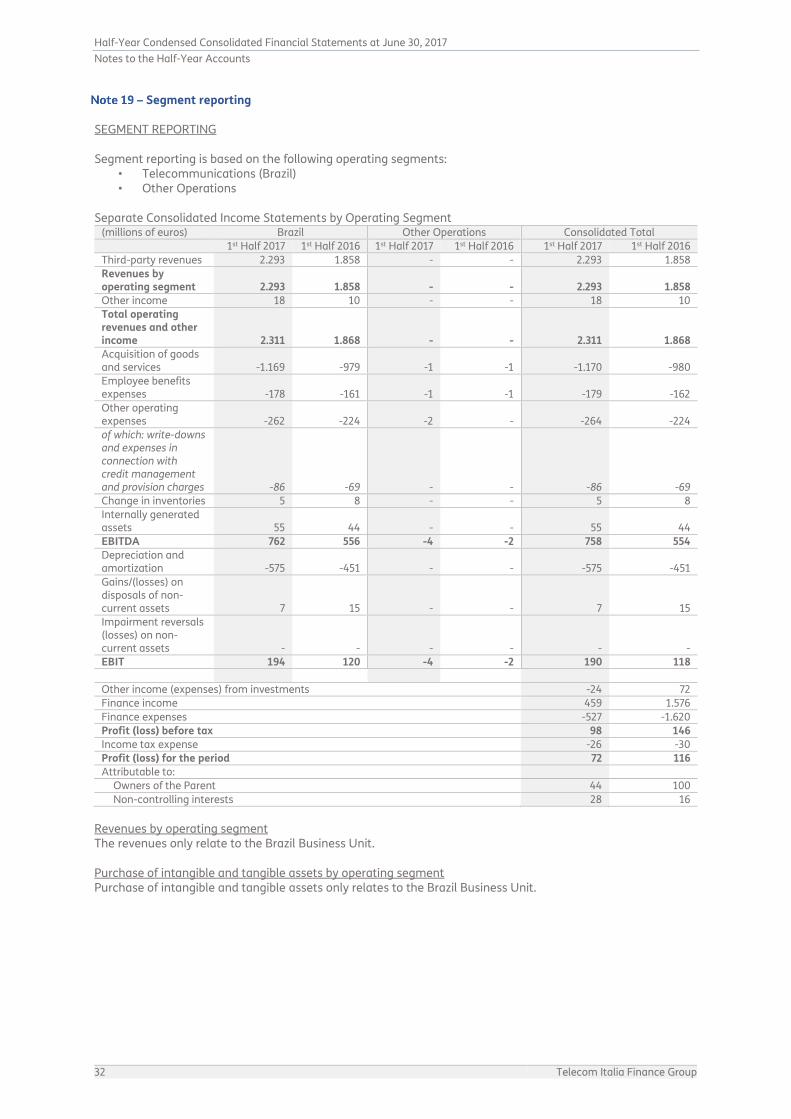
Half-Year Condensed Consolidated Financial Statements at June 30, 2017
Notes to the Half-Year Accounts
32 Telecom Italia Finance Group
Segment reporting SEGMENT REPORTING Segment reporting is based on the following operating segments:
• Telecommunications (Brazil) • Other Operations
Separate Consolidated Income Statements by Operating Segment
(millions of euros) Brazil Other Operations Consolidated Total
1st Half 2017 1st Half 2016 1st Half 2017 1st Half 2016 1st Half 2017 1st Half 2016
Third-party revenues 2.293 1.858 - - 2.293 1.858
Revenues by operating segment 2.293 1.858 - - 2.293 1.858
Other income 18 10 - - 18 10
Total operating revenues and other income 2.311 1.868 - - 2.311 1.868
Acquisition of goods and services -1.169 -979 -1 -1 -1.170 -980
Employee benefits expenses -178 -161 -1 -1 -179 -162
Other operating expenses -262 -224 -2 - -264 -224
of which: write-downs and expenses in connection with credit management and provision charges -86 -69 - - -86 -69
Change in inventories 5 8 - - 5 8
Internally generated assets 55 44 - - 55 44
EBITDA 762 556 -4 -2 758 554
Depreciation and amortization -575 -451 - - -575 -451
Gains/(losses) on disposals of non-current assets 7 15 - - 7 15
Impairment reversals (losses) on non-current assets - - - - - -
EBIT 194 120 -4 -2 190 118
Other income (expenses) from investments -24 72
Finance income 459 1.576
Finance expenses -527 -1.620
Profit (loss) before tax 98 146
Income tax expense -26 -30
Profit (loss) for the period 72 116
Attributable to:
Owners of the Parent 44 100
Non-controlling interests 28 16
Revenues by operating segment The revenues only relate to the Brazil Business Unit. Purchase of intangible and tangible assets by operating segment Purchase of intangible and tangible assets only relates to the Brazil Business Unit.
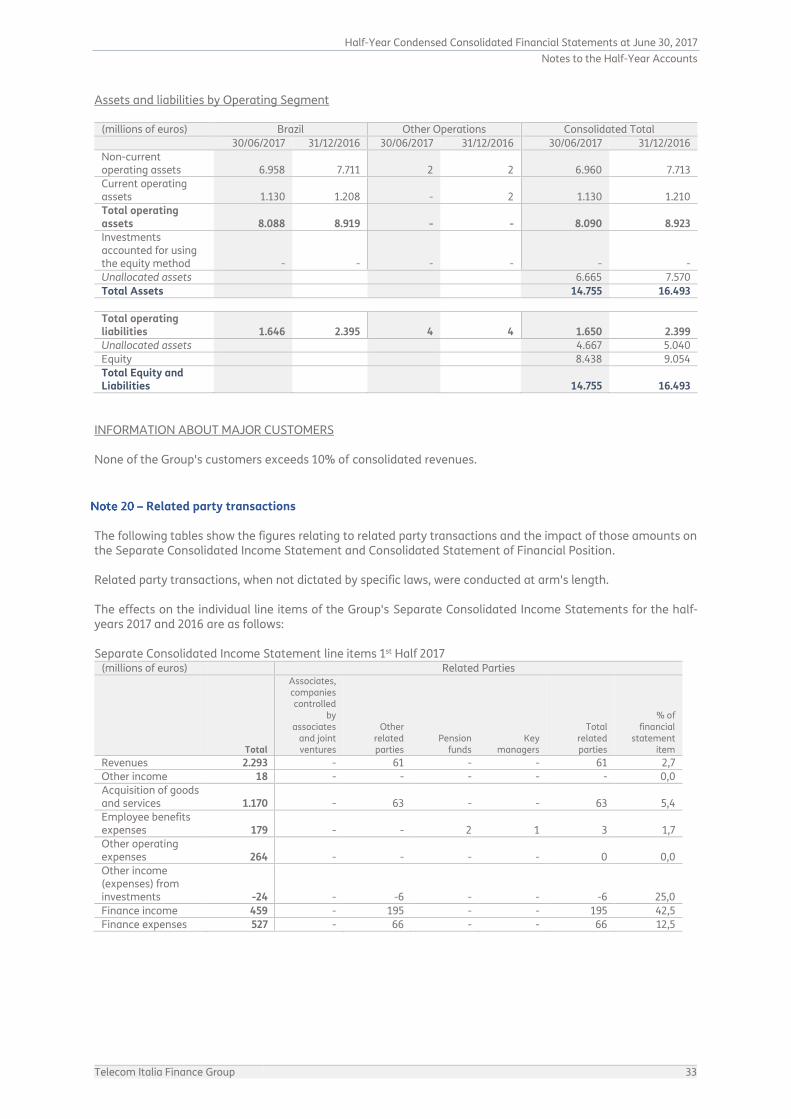
Half-Year Condensed Consolidated Financial Statements at June 30, 2017
Notes to the Half-Year Accounts
Telecom Italia Finance Group 33
Assets and liabilities by Operating Segment
(millions of euros) Brazil Other Operations Consolidated Total
30/06/2017 31/12/2016 30/06/2017 31/12/2016 30/06/2017 31/12/2016
Non-current operating assets 6.958 7.711 2 2 6.960 7.713
Current operating assets 1.130 1.208 - 2 1.130 1.210
Total operating assets 8.088 8.919 - - 8.090 8.923
Investments accounted for using the equity method - - - - - -
Unallocated assets 6.665 7.570
Total Assets 14.755 16.493
Total operating liabilities 1.646 2.395 4 4 1.650 2.399
Unallocated assets 4.667 5.040
Equity 8.438 9.054
Total Equity and Liabilities 14.755 16.493
INFORMATION ABOUT MAJOR CUSTOMERS None of the Group's customers exceeds 10% of consolidated revenues.
Related party transactions The following tables show the figures relating to related party transactions and the impact of those amounts on the Separate Consolidated Income Statement and Consolidated Statement of Financial Position. Related party transactions, when not dictated by specific laws, were conducted at arm's length. The effects on the individual line items of the Group's Separate Consolidated Income Statements for the half-years 2017 and 2016 are as follows: Separate Consolidated Income Statement line items 1st Half 2017
(millions of euros) Related Parties
Total
Associates, companies controlled
by associates
and joint ventures
Other related parties
Pension funds
Key managers
Total related parties
% of financial
statement item
Revenues 2.293 - 61 - - 61 2,7
Other income 18 - - - - - 0,0 Acquisition of goods and services 1.170 - 63 - - 63 5,4 Employee benefits expenses 179 - - 2 1 3 1,7 Other operating expenses 264 - - - - 0 0,0 Other income (expenses) from investments -24 - -6 - - -6 25,0 Finance income 459 - 195 - - 195 42,5 Finance expenses 527 - 66 - - 66 12,5
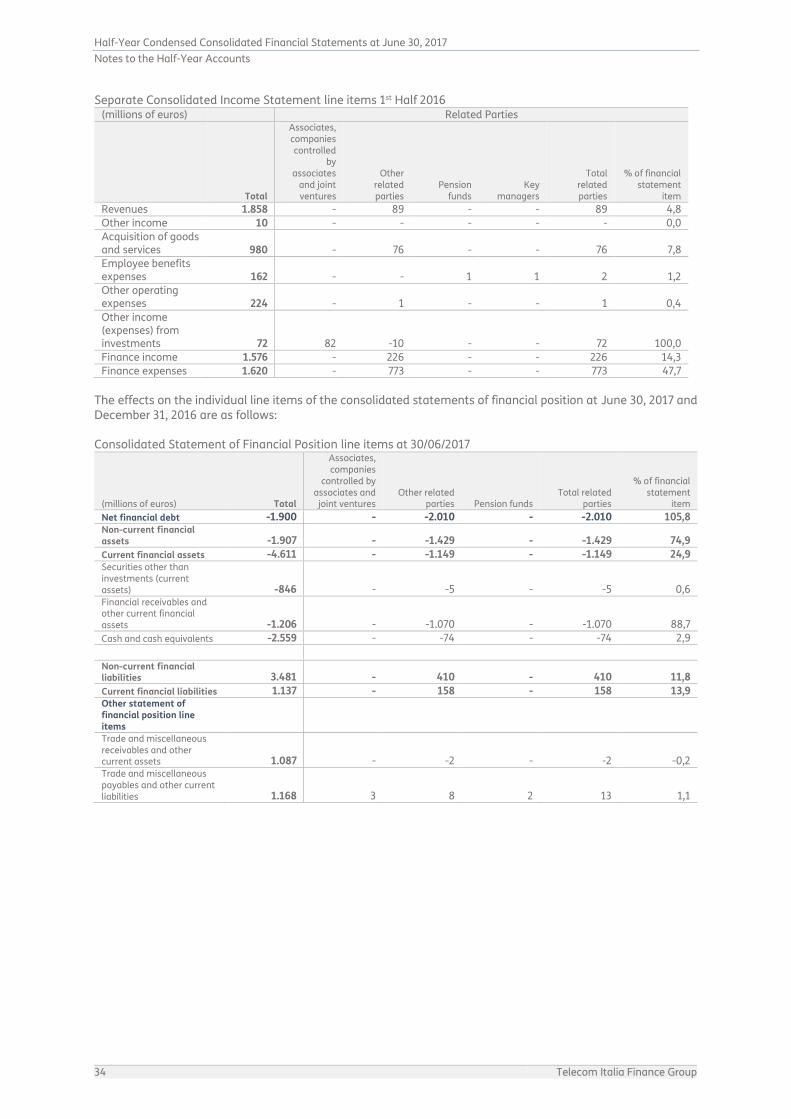
Half-Year Condensed Consolidated Financial Statements at June 30, 2017
Notes to the Half-Year Accounts
34 Telecom Italia Finance Group
Separate Consolidated Income Statement line items 1st Half 2016 (millions of euros) Related Parties
Total
Associates, companies controlled
by associates
and joint ventures
Other related parties
Pension funds
Key managers
Total related parties
% of financial statement
item
Revenues 1.858 - 89 - - 89 4,8
Other income 10 - - - - - 0,0 Acquisition of goods and services 980 - 76 - - 76 7,8 Employee benefits expenses 162 - - 1 1 2 1,2 Other operating expenses 224 - 1 - - 1 0,4 Other income (expenses) from investments 72 82 -10 - - 72 100,0 Finance income 1.576 - 226 - - 226 14,3 Finance expenses 1.620 - 773 - - 773 47,7
The effects on the individual line items of the consolidated statements of financial position at June 30, 2017 and December 31, 2016 are as follows: Consolidated Statement of Financial Position line items at 30/06/2017
(millions of euros) Total
Associates, companies
controlled by associates and joint ventures
Other related parties Pension funds
Total related parties
% of financial statement
item
Net financial debt -1.900 - -2.010 - -2.010 105,8 Non-current financial assets -1.907 - -1.429 - -1.429 74,9
Current financial assets -4.611 - -1.149 - -1.149 24,9 Securities other than investments (current assets) -846 - -5 - -5 0,6 Financial receivables and other current financial assets -1.206 - -1.070 - -1.070 88,7 Cash and cash equivalents -2.559 - -74 - -74 2,9
Non-current financial liabilities 3.481 - 410 - 410 11,8 Current financial liabilities 1.137 - 158 - 158 13,9 Other statement of financial position line items Trade and miscellaneous receivables and other current assets 1.087 - -2 - -2 -0,2 Trade and miscellaneous payables and other current liabilities 1.168 3 8 2 13 1,1
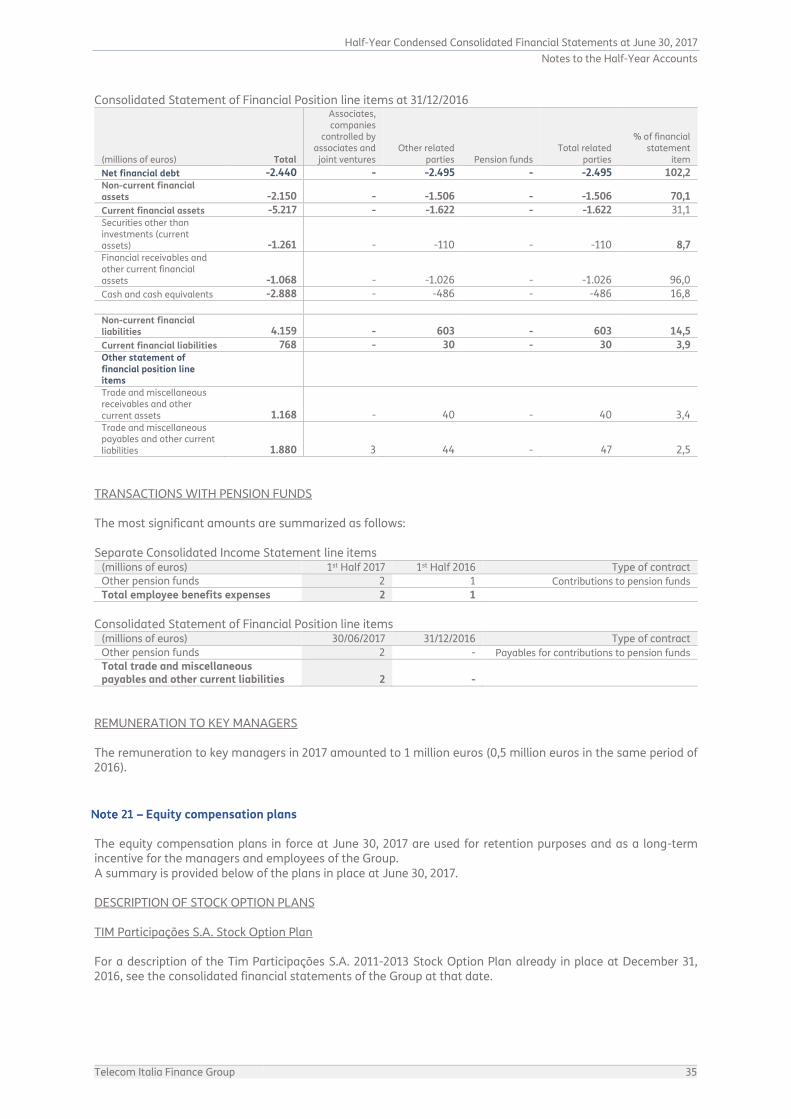
Half-Year Condensed Consolidated Financial Statements at June 30, 2017
Notes to the Half-Year Accounts
Telecom Italia Finance Group 35
Consolidated Statement of Financial Position line items at 31/12/2016
(millions of euros) Total
Associates, companies
controlled by associates and joint ventures
Other related parties Pension funds
Total related parties
% of financial statement
item
Net financial debt -2.440 - -2.495 - -2.495 102,2 Non-current financial assets -2.150 - -1.506 - -1.506 70,1
Current financial assets -5.217 - -1.622 - -1.622 31,1 Securities other than investments (current assets) -1.261 - -110 - -110 8,7 Financial receivables and other current financial assets -1.068 - -1.026 - -1.026 96,0
Cash and cash equivalents -2.888 - -486 - -486 16,8
Non-current financial liabilities 4.159 - 603 - 603 14,5
Current financial liabilities 768 - 30 - 30 3,9 Other statement of financial position line items Trade and miscellaneous receivables and other current assets 1.168 - 40 - 40 3,4 Trade and miscellaneous payables and other current liabilities 1.880 3 44 - 47 2,5
TRANSACTIONS WITH PENSION FUNDS The most significant amounts are summarized as follows: Separate Consolidated Income Statement line items
(millions of euros) 1st Half 2017 1st Half 2016 Type of contract
Other pension funds 2 1 Contributions to pension funds
Total employee benefits expenses 2 1
Consolidated Statement of Financial Position line items
(millions of euros) 30/06/2017 31/12/2016 Type of contract
Other pension funds 2 - Payables for contributions to pension funds
Total trade and miscellaneous payables and other current liabilities 2 -
REMUNERATION TO KEY MANAGERS The remuneration to key managers in 2017 amounted to 1 million euros (0,5 million euros in the same period of 2016).
Equity compensation plans The equity compensation plans in force at June 30, 2017 are used for retention purposes and as a long-term incentive for the managers and employees of the Group. A summary is provided below of the plans in place at June 30, 2017. DESCRIPTION OF STOCK OPTION PLANS TIM Participações S.A. Stock Option Plan For a description of the Tim Participações S.A. 2011-2013 Stock Option Plan already in place at December 31, 2016, see the consolidated financial statements of the Group at that date.

Half-Year Condensed Consolidated Financial Statements at June 30, 2017
Notes to the Half-Year Accounts
36 Telecom Italia Finance Group
• 2014-2016 Plan On April 10, 2014, the General Meeting of Shareholders of TIM Participações S.A. approved the long-term incentive plan for managers in key positions in the company and its subsidiaries. Exercise of the options is not subject to the achievement of specific performance targets, but the exercise price is adjusted upwards or downwards according to the performance of the TIM Participações S.A. shares in a ranking of Total Shareholder Return, in which companies in the Telecommunications, Information Technology and Media industry are compared during each year of validity of the plan. If the performance of the TIM Participações S.A. shares, in the 30 days prior to September 29 of each year, is in last place in that ranking, the participant loses the right to 25% of the options vesting at that time. The vesting period is 3 years (a third per year), the options are valid for 6 years, and the company does not have the legal obligation to repurchase or liquidate the options in cash, or in any other form.
• Year 2014 On September 29, 2014, the grantees of the options were granted the right to purchase a total of 1.687.686 shares. At December 31, 2016, 623.027 could be considered lapsed due to failure to achieve the minimum exercise conditions set in the Plan, whereas 502.097 were considered vested. No option has been exercised. At June 30, 2017, 285.487 additional options have lapsed.
• Year 2015
On October 16, 2015, the grantees of the options were granted the right to purchase a total of 3.355.229 shares. At December 31, 2016, 780.144 could be considered as lapsed, whereas 338.266 could be considered as vested. At June 30, 2017, 157.663 options have been exercised at the price of 8,7341 Brazilian reais (initial price of 8,4526 Brazilian reais adjusted of 3,33% accordingly to the benchmark position) and other 387.197 options could be considered lapsed
• Year 2016
On November 8, 2016, the grantees of the options were granted the right to purchase a total of 3.922.204 shares. At June 30, 2017, no option could be considered as vested and 381.444 options have lapsed.
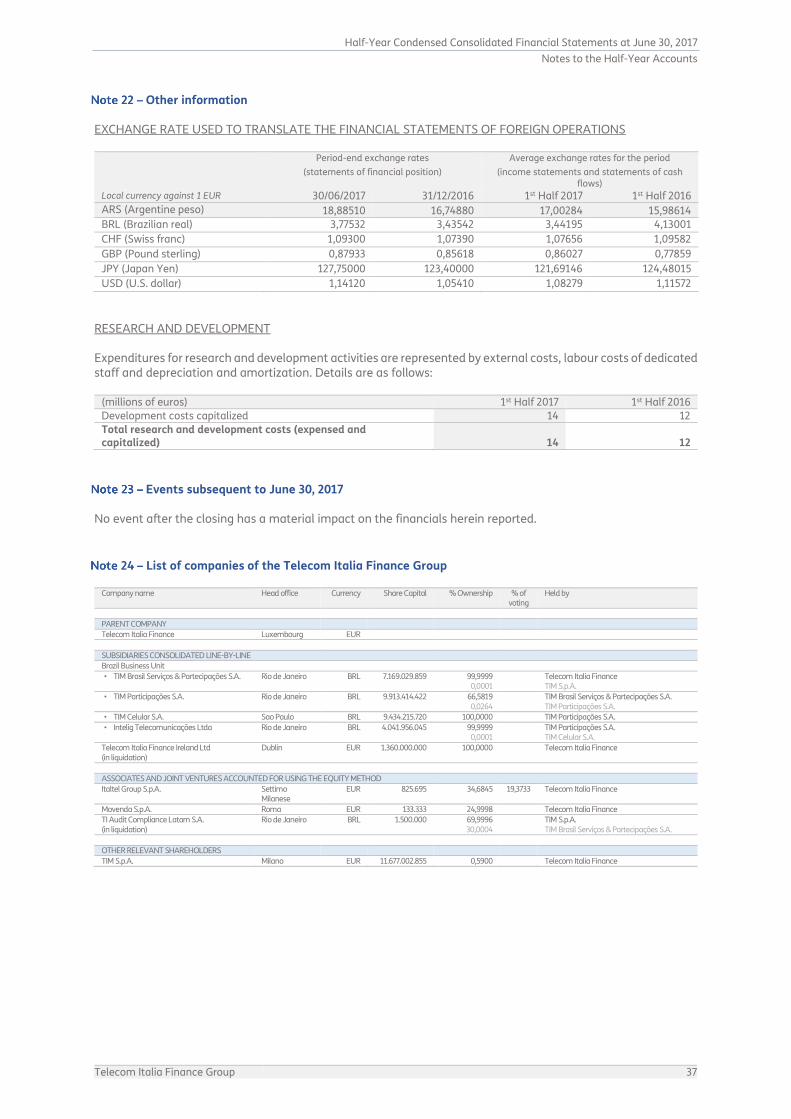
Half-Year Condensed Consolidated Financial Statements at June 30, 2017
Notes to the Half-Year Accounts
Telecom Italia Finance Group 37
Other information EXCHANGE RATE USED TO TRANSLATE THE FINANCIAL STATEMENTS OF FOREIGN OPERATIONS
Period-end exchange rates Average exchange rates for the period
(statements of financial position) (income statements and statements of cash
flows)
Local currency against 1 EUR 30/06/2017 31/12/2016 1st Half 2017 1st Half 2016
ARS (Argentine peso) 18,88510 16,74880 17,00284 15,98614
BRL (Brazilian real) 3,77532 3,43542 3,44195 4,13001
CHF (Swiss franc) 1,09300 1,07390 1,07656 1,09582
GBP (Pound sterling) 0,87933 0,85618 0,86027 0,77859
JPY (Japan Yen) 127,75000 123,40000 121,69146 124,48015
USD (U.S. dollar) 1,14120 1,05410 1,08279 1,11572
RESEARCH AND DEVELOPMENT Expenditures for research and development activities are represented by external costs, labour costs of dedicated staff and depreciation and amortization. Details are as follows:
(millions of euros) 1st Half 2017 1st Half 2016
Development costs capitalized 14 12
Total research and development costs (expensed and capitalized) 14 12
Events subsequent to June 30, 2017 No event after the closing has a material impact on the financials herein reported.
List of companies of the Telecom Italia Finance Group
Company name Head office Currency Share Capital % Ownership % of voting
Held by
PARENT COMPANY
Telecom Italia Finance Luxembourg EUR
SUBSIDIARIES CONSOLIDATED LINE-BY-LINE
Brazil Business Unit
• TIM Brasil Serviços & Partecipações S.A. Rio de Janeiro BRL 7.169.029.859 99,9999 0,0001
Telecom Italia Finance TIM S.p.A.
• TIM Participações S.A. Rio de Janeiro BRL 9.913.414.422 66,5819 0,0264
TIM Brasil Serviços & Partecipações S.A. TIM Participações S.A.
• TIM Celular S.A. Sao Paulo BRL 9.434.215.720 100,0000 TIM Participações S.A.
• Intelig Telecomunicações Ltda Rio de Janeiro BRL 4.041.956.045 99,9999 0,0001
TIM Participações S.A. TIM Celular S.A.
Telecom Italia Finance Ireland Ltd (in liquidation)
Dublin EUR 1.360.000.000 100,0000 Telecom Italia Finance
ASSOCIATES AND JOINT VENTURES ACCOUNTED FOR USING THE EQUITY METHOD
Italtel Group S.p.A. Settimo Milanese
EUR 825.695 34,6845 19,3733 Telecom Italia Finance
Movenda S.p.A. Roma EUR 133.333 24,9998 Telecom Italia Finance
TI Audit Compliance Latam S.A. (in liquidation)
Rio de Janeiro BRL 1.500.000 69,9996 30,0004
TIM S.p.A. TIM Brasil Serviços & Partecipações S.A.
OTHER RELEVANT SHAREHOLDERS
TIM S.p.A. Milano EUR 11.677.002.855 0,5900 Telecom Italia Finance

Half-Year Condensed Consolidated Financial Statements at June 30, 2017
Certification of the Consolidated Financial Statements pursuant to Luxembourg Transparency Law
38 Telecom Italia Finance Group
Certification of the Consolidated Financial Statements pursuant to Luxembourg Transparency Law
Pursuant to paragraph 4 of Luxembourg’s Transparency Law, the undersigned Adriano Trapletti, Managing Director of the Company, to the best of his knowledge, hereby declares that the above interim financial statements prepared in accordance with the applicable set of accounting standards give a true and fair view of the assets, liabilities, financial position and profit or loss of the issuer and that the management report includes an indication of important events that have occurred during the first six months of the financial year, and their impact on the financial statements, together with a description of the principal risks and uncertainties for the remaining six months of the financial year.
Adriano Trapletti Managing Director