Embed Size (px)
Citation preview
Equity Research
9 September 2019
FOCUS
Barclays Capital Inc. and/or one of its affiliates does and seeks to do business with
companies covered in its research reports. As a result, investors should be aware that the
firm may have a conflict of interest that could affect the objectivity of this report. Investors
should consider this report as only a single factor in making their investment decision.
This research report has been prepared in whole or in part by equity research analysts
based outside the US who are not registered/qualified as research analysts with FINRA.
PLEASE SEE ANALYST CERTIFICATION(S) AND IMPORTANT DISCLOSURES BEGINNING ON PAGE 41.
Re
stri
cte
d -
In
tern
al
Telecom Services and Tech Hardware
5G – The Return of Fixed Substitution
Fixed Wireless Access (FWA) has until now been a relatively niche service offering.
This is about to change. The advent of 5G brings significant capacity increases to
wireless networks, and we see mobile challengers set to seize on this to attack fixed
broadband, especially in markets that lack meaningful FTTH (UK/Germany/Italy).
Our extensive research and conversations with key market participants lead us to
conclude that mobile challengers will be incentivised to capitalize on this
opportunity, as near-term risks are very low, and business case appears compelling.
FWA business case appear compelling with 5G – Most challengers will likely try. We
estimate a >10x increase in wireless capacity over the next 5 years, as 5G brings greater
spectrum efficiency, with more spectrum also becoming available. For mobile operators
this will allow them to manage ever-increasing wireless demand. Crucially, they will also
be able to consider offering high-speed broadband over wireless as an alternative to
fixed. The near-term FWA investment risks for mobile operators are low, as any capex
needs are both incremental and success-based, and initially very modest.
FWA as a ‘copper killer’ – We see 5-10% of broadband market at risk from FWA. Our
detailed analysis uses unique and proprietary data to look at the market opportunity for
mobile operators to target urban, suburban and rural areas with FWA. Our research
indicates a network cost of just c€5-10/sub/month, assuming c50-100mbps speeds.
We identify 5-10% of the fixed broadband market at risk (with greatest risk in copper-
heavy markets such as the UK/Germany/Italy, lower in FTTH-heavy markets).
Stock implications – EU and US Telcos. We see increased broadband price competition
from FWA solutions into the Consumer segments in markets like the UK, Germany, Italy
and US, which is unhelpful for sentiment, with BT/TI/DT most exposed (on the other
hand, DT has positive exposure through TMUS). In terms of EU-based beneficiaries, we
see TEF De (OW), Drillisch (OW) and Sunrise (EW) as positively exposed, and separately
initiate coverage on Big Blu Broadband (BBB LN with an OW rating).
Stock implications – EU Tech HW. Telecom equipment vendors Nokia (OW) and
Ericsson (EW) both actively encourage operators to consider FWA strategies. While
initial incremental capex is modest, as mobile challengers can leverage existing assets, if
the provider is successful, then we would expect to see additional success-based
investment. We view FWA as an additional, if modest, tailwind to the broader 5G
adoption growth we model for mobile equipment vendors.
INDUSTRY UPDATE
European Technology Hardware
NEUTRAL
Unchanged
European Telecom Services
POSITIVE
Unchanged
U.S. Cable, Satellite & Telecom Services
NEUTRAL
Unchanged
European Telecom Services
Maurice Patrick
+44 (0)20 3134 3622
Barclays, UK
Mathieu Robilliard
+44 (0)20 3134 3288
BBI, Paris
Simon Coles
+44 (0)20 3555 4519
Barclays, UK
European Technology Hardware
Andrew M. Gardiner, CFA
+44 (0)20 3134 7217
Barclays, UK
U.S. Cable, Satellite & Telecom Services
Kannan Venkateshwar
+1 212 528 7054
BCI, US
IT Hardware and Communications
Equipment
Tim Long
+1 212 526 4043
BCI, US
Barclays | Telecom Services and Tech Hardware
9 September 2019 2
Fixed Wireless Access (FWA) – Why the debate?
The ambition and desire of the wireless Telecom industry to cannibalise fixed line is not new,
with wireless taking significant share of voice traffic. However, fixed line has shown itself
remarkably resilient to wireless cannibalisation despite mobile traffic growth, due largely to
the growth in fixed broadband adoption, speed and reliability. There are, however,
significant exceptions (such as Finland), and we note that with upcoming technology/5G
capacity increases, the desire of the wireless industry to increase its share of broadband is
clearly evident. There is very mixed feedback from industry participants, who tend to divide
into FWA believers (mobile challengers, vendors) and sceptics (integrated operators).
Fixed mobile substitution – Lessons from voice, and broadband
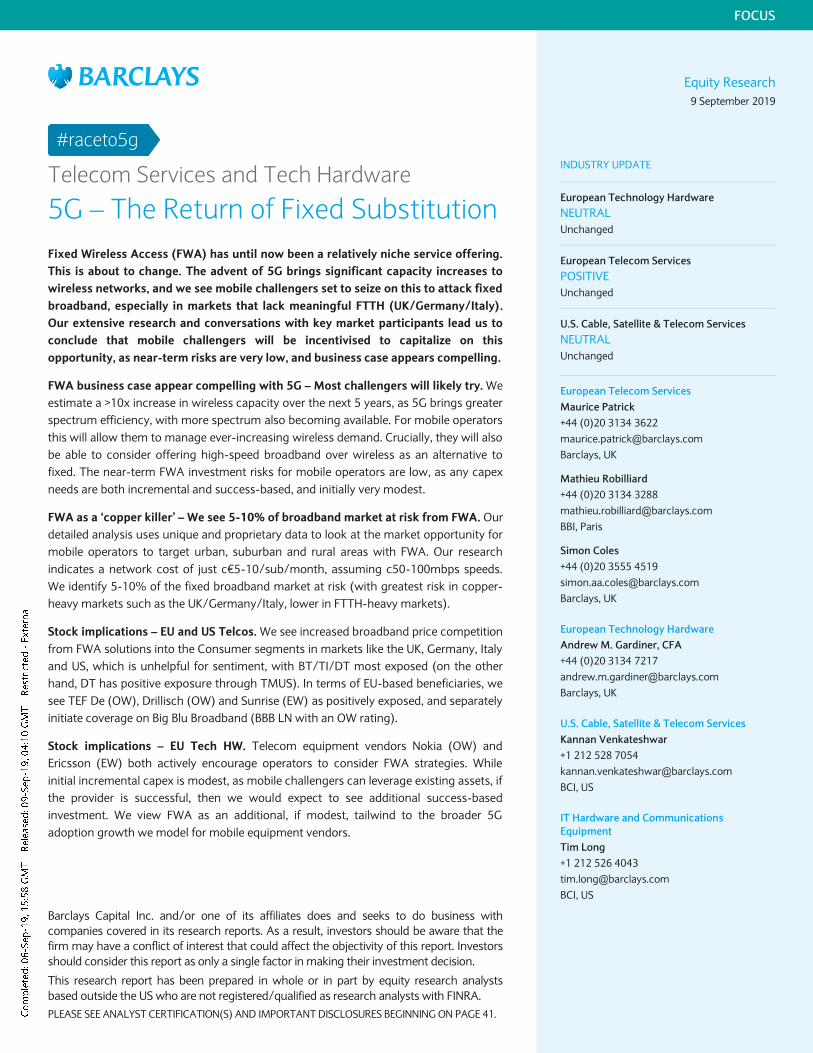
One of the first examples of fixed mobile substitution was simple voice calls – as wireless
operators steadily increased the bundling of voice calls, fixed voice volumes have steadily
been replaced by mobile over the past 10 years (using the UK as an example, 78% of voice
calls were on mobile in 2018 vs 49% in 2009). However, despite the increase in mobile data
usage, the number of fixed lines has actually proved remarkably resilient (<1% line loss per
year), helped by the adoption (and utility) of fixed broadband, taking the penetration of lines
to c85%. We attribute the relative resilience of fixed line to the rise of streaming video and
connected TVs. The trend is similar in most EU markets.
FIGURE 1
UK: Call Volumes (m) – Fixed and Mobile
FIGURE 2
UK Telcos: Fixed Lines (k)
Source: Ofcom, Barclays Research estimates Source: Ofcom, Barclays Research estimates
Note: Loss in ISDN/Other lines is typically loss to VoIP, not mobile
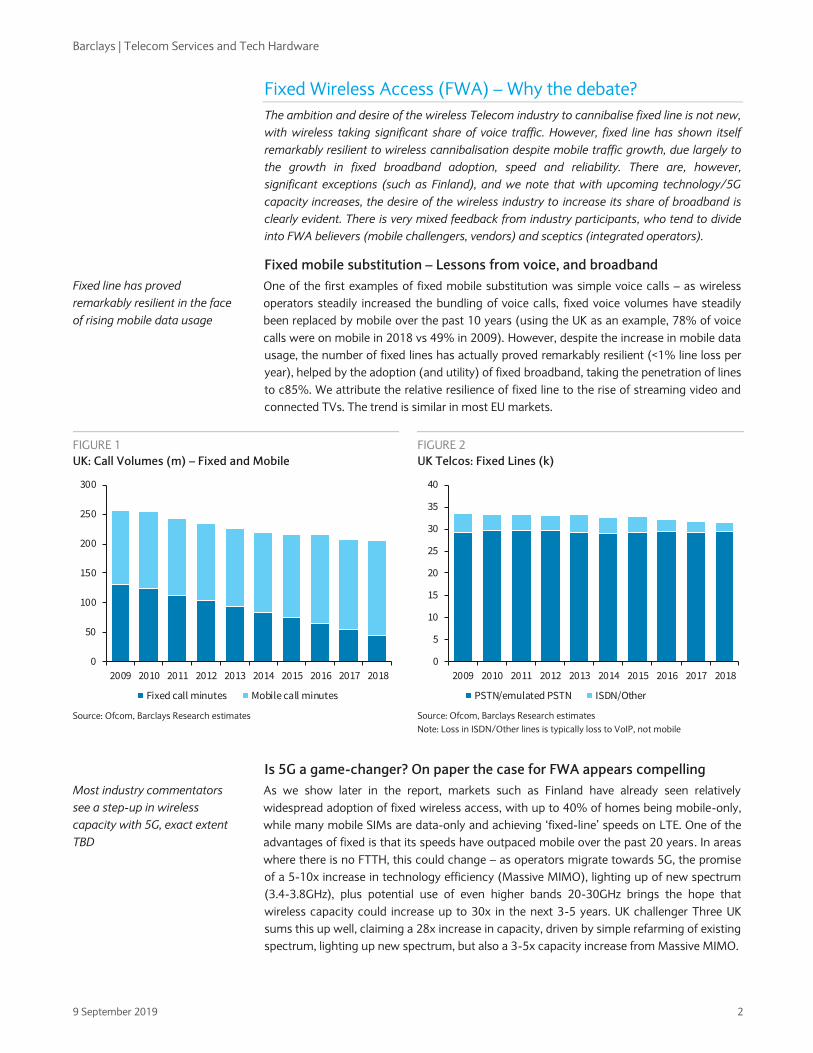
Is 5G a game-changer? On paper the case for FWA appears compelling
As we show later in the report, markets such as Finland have already seen relatively
widespread adoption of fixed wireless access, with up to 40% of homes being mobile-only,
while many mobile SIMs are data-only and achieving ‘fixed-line’ speeds on LTE. One of the
advantages of fixed is that its speeds have outpaced mobile over the past 20 years. In areas
where there is no FTTH, this could change – as operators migrate towards 5G, the promise
of a 5-10x increase in technology efficiency (Massive MIMO), lighting up of new spectrum
(3.4-3.8GHz), plus potential use of even higher bands 20-30GHz brings the hope that
wireless capacity could increase up to 30x in the next 3-5 years. UK challenger Three UK
sums this up well, claiming a 28x increase in capacity, driven by simple refarming of existing
spectrum, lighting up new spectrum, but also a 3-5x capacity increase from Massive MIMO.
0
50
100
150
200
250
300
2009 2010 2011 2012 2013 2014 2015 2016 2017 2018
Fixed call minutes Mobile call minutes
0
5
10
15
20
25
30
35
40
2009 2010 2011 2012 2013 2014 2015 2016 2017 2018
PSTN/emulated PSTN ISDN/Other
Fixed line has proved
remarkably resilient in the face
of rising mobile data usage
Most industry commentators
see a step-up in wireless
capacity with 5G, exact extent
TBD
Barclays | Telecom Services and Tech Hardware
9 September 2019 3
FIGURE 3
Mobile v Fixed Speeds (mbps)
FIGURE 4
3UK: 5G Potential Capacity Increase
Source: Barclays Research estimates Source: Company
But what even is FWA? US and Europe have different visions
Later in the report we cover the technologies behind current FWA solutions, and different
implementations, but we see two different emerging – ‘mid-band solutions’, which largely
use existing wireless infrastructure, and ‘high-band solutions’, which require material
investment/densification. Most of the European Telcos pursuing FWA advocate the first
option, citing significant spectrum available at c3.5GHz, and an existing wireless network
that would support a broadband service with good quality and limited (if any) capex
implications. In the US, Verizon is one of the frontrunners in FWA, but this is using the high-
band mmWave spectrum, which requires a much greater densification of radio sites.
Equipment vendors are seeing increased interest in the FWA concept
The mobile infrastructure vendors have been discussing FWA for some time. Solutions even
existed in the 2G and 3G era, but were relatively uncompelling compared with fixed
broadband. 4G capacity and throughput gains, driven by technologies like carrier
aggregation and MIMO antennas, have made such offerings more relevant. Such
technology enhancements are also helping to reduce the cost per bit, thereby making the
economic proposition clearer to operators and, most importantly, consumers.
With a view towards 5G migrations and new spectrum band availability, the likes of Ericsson
and Nokia have been increasingly pushing FWA to customers. Nokia’s CEO Rajeev Suri has
referred positively to FWA a number of times this year, at Mobile World Congress and
during results calls. At MWC in particular, Nokia demonstrated FWA on 5G and highlighted
contracts with Optus (Australia), Telia (Sweden) and Rain (South Africa). Ericsson has done
similarly with wins at Entel (Chile), TELE-POST (Greenland) and NBN (Australia), to name
but a few.
Challenger mobile operators appear set to try
3UK – Clear strategic intent to target FWA. Following recent auctions and acquisitions,
3UK now has more wireless spectrum than the other UK MNOs (albeit mid- to high-
band), with a substantial (and superior) spectrum portfolio at 3.6GHz. 3UK acquired an
FWA business (Relish), with 20k subscribers using 80GB/month, and the company sees
its 5G network supporting significant growth in traffic potential. Massive MIMO is set to
yield a 3-5x capacity increase, and 3UK believes it will be able to deliver this at the same
network grid (1.8GHz), using the same 5G equipment. The key ‘hook’ is that current
sector capacity of 30Mbps will increase to 840Mbps in the next couple of years.
0
1
10
100
1,000
2000
2002
2004
2006
2008
2010
2012
2014
2016
2018
2020
2022
2024
Mobile Fixed (VDSL) Fixed (FTTH)
There are several
implementations of FWA – We
see mid-band 5G as the most
potentially disruptive mid term
Vendors have offered FWA
solutions for years
But efforts have stepped up
with 5G – and there are clear
contract wins already
Barclays | Telecom Services and Tech Hardware
9 September 2019 4
TEF De – Successful FWA trial (link here). At its 2018 Capital Markets Day, TEF De
articulated how it was successfully creating a high-speed wireless network capable of
handling significant traffic growth, and indicated a strategic move to push into FWA.
Indeed, TEF De piloted a 5G FWA trial in Hamburg. The trial was supported by Samsung,
and operated at 26GHz, and TEF De sees itself being able to offer a faster broadband
connection for homes and small businesses than conventional DSL.
Sunrise – will use FWA to replace wholesaling copper and targets rural market share.
Sunrise has invested heavily in its network in recent years to catch up with Swisscom in
the Swiss market. Following the acquisition of 100MHz of 3.5GHz spectrum Sunrise now
sees an opportunity utilising 5G FWA to take broadband market share in rural areas. As
rural areas won’t have FTTH, FWA will offer a more attractive option for customers and
simultaneously generates better margins for Sunrise than wholesaling Swisscom’s
copper network. Sunrise sees FWA generating low-single-digit million EBITDA in 2020
which should double in 2021.
Verizon – using FWA to expand into new markets. Verizon began piloting 5G Home, its
FWA product, in four markets in late 2018. It will be launching its NR-based service this
year on the 28 and 39GHz mmWave bands. Notably, it intends to pass 30mm homes
with FWA and expand into new geographies beyond the ~14-15mm home Fios FTTH
footprint concentrated on the East Coast currently. Given fibre density and mmWave
deployment, this is likely to put incremental pressure on incumbent cable broadband
providers largely in urban areas.
T-Mobile/Sprint – a new entrant with a different flavour. TMUS/S have stated publicly
that they intend to provide FWA broadband on the combined network, with the goal of
reaching 90% population coverage and 9.5mm subs by 2024 (nearly as large as
ATUS+VZ combined today). Unlike VZ, new T-Mobile will likely leverage its mid-band
holdings particularly using the acquired Sprint 2.5GHz spectrum. This should enable
TMUS/S to be a more apt competitor in rural areas.
Even new entrants see an opportunity. Drillisch has successfully acquired 70Mhz
spectrum in the German 5G auction (2.1GHz and 3.4GHz), and plans to roll out a 5G
network in key urban areas, using national roaming across the rest of the network.
Much of the industrial logic and business case surrounds offering high-speed services
(both mobile-only and fixed-replacement), given that the combined wholesale
payments currently (fixed and mobile) are c€1.2bn/year, and United Internet currently
has significant Fibre backhaul capability. Rakuten in Japan has a similarly disruptive
approach – For more detail please refer to U.S. Cable, Media & Telecom: An Internet
company tests a new wireless architecture, March 2019.
Conference feedback – Many CTOs appear sceptical on ability to materially
disrupt
We hosted a CTO Conference in March 2019, which covered a number of key themes,
including the move to digital and cloud, how and when 5G will impact the Telecom
ecosystem, but also the potential impact of FWA on the industry. Key participants were the
CTOs or heads of networks of BT, Vodafone, Telenor, but also Samsung and Cellnex.
Vodafone – Believes FWA makes sense more in rural areas. Vodafone CTO Johan
Wibergh sees the key FWA issue being that the volume of fixed broadband data usage is
130GB/mth and growing 30/50pc per year vs current smartphones at 3GB. Although he
does see how FWA can be a way to use unused capacity in suburban areas, the key
question is how long this can continue because traffic increases a lot every year and
FWA uses a lot of capacity relative to ‘traditional’ wireless. For mmWave, Vodafone
believes FWA can add more capacity but the issue is densification of network. As such,
Other operators are more
sceptical (or realistic?)
Barclays | Telecom Services and Tech Hardware
9 September 2019 5
overall FWA could add a few percentage points of market share but not be
transformational. On backhaul, Vodafone has high penetration of FTTH links and also
microwave (works well and no issue with latency), and will continue to develop more
fibre in Spain/Germany so that it can fully integrate fixed/mobile networks.
BT – Doesn’t see FWA as likely to have major impact. BT CTO Howard Watson sees the
economics of wireless and fixed networks as very different, with traffic dynamics also
different (similar view to that of Vodafone). Mr Watson also stressed the relatively high
levels of mobile core network complexity vs fixed, which should be considered in any
planning. BT also sees FWA in mmWave as being quite niche – sub 5GHz is a different
prospect. Rather than focusing on one technology being better than the other for last
mile access, BT focuses on having ‘one smart network’. Indeed, BT sees a need and
significant opportunity to manage Fixed, mobile and WiFi together, with a focus on the
intelligence layer to manage a seamless customer journey in terms of connectivity. It
now has one IMS (had one for fixed, one for mobile).
Conclusion – Clearly a contentious subject
In this report we look at (a) whether 5G can deliver the kind of speed upgrades to facilitate
FWA, (b) how attractive the economics for wireless operators are, (c) which markets are
mostly likely to see FWA impact, and (d) examples of FWA deployments globally.
Barclays | Telecom Services and Tech Hardware
9 September 2019 6
FWA – Can the technology deliver?
The wireless industry has consistently promised (and delivered) significant technology
improvements, which have boosted coverage, speed, and quality over the past 20-30 years.
However, the industry also has a tendency to overpromise, especially when it comes to new
technologies. With 5G, the high level vision of Gigabit speeds and 1ms latency grabs
headlines, and raises hopes of services varying from driverless cars to remote telemedicine.
In promoting FWA, mobile operators are typically looking to displace existing fixed
broadband connections and, in some instances, connecting the unconnected; even ‘old’
copper broadband solutions typically offer very predictable connections. Most wireless
networks are less predictable, and tend to offer patchier coverage, due to the dynamic
nature of their operating environments.
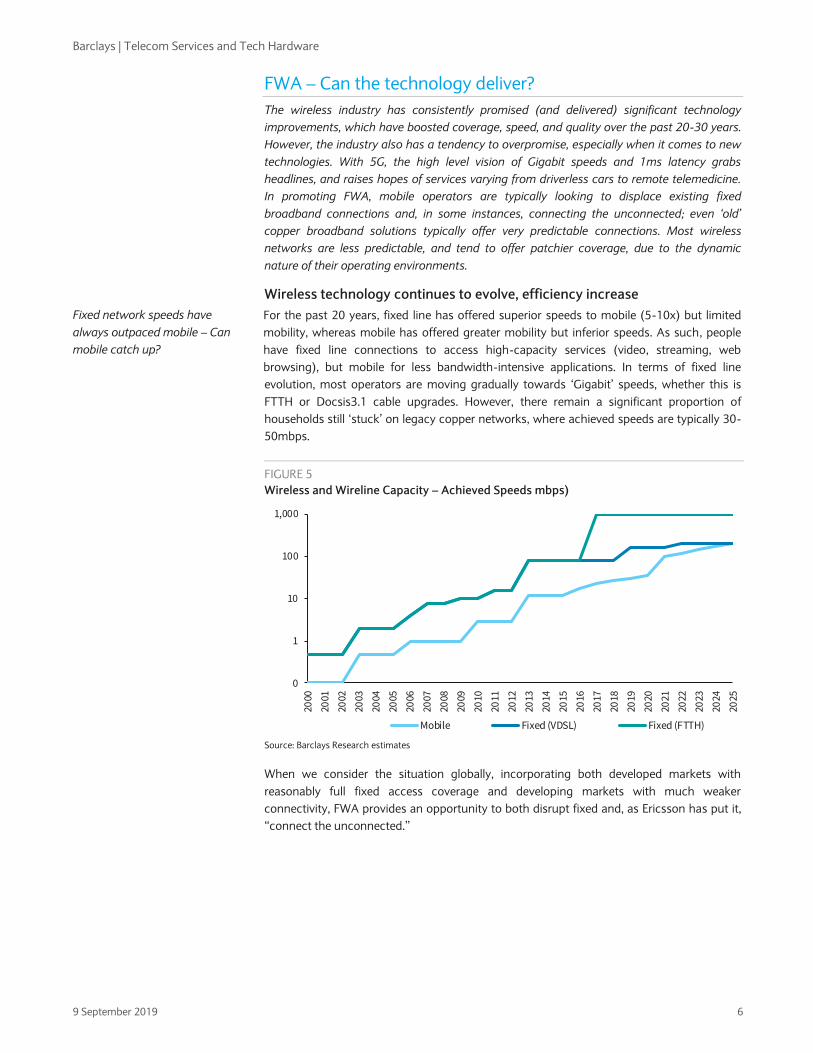
Wireless technology continues to evolve, efficiency increase
For the past 20 years, fixed line has offered superior speeds to mobile (5-10x) but limited
mobility, whereas mobile has offered greater mobility but inferior speeds. As such, people
have fixed line connections to access high-capacity services (video, streaming, web
browsing), but mobile for less bandwidth-intensive applications. In terms of fixed line
evolution, most operators are moving gradually towards ‘Gigabit’ speeds, whether this is
FTTH or Docsis3.1 cable upgrades. However, there remain a significant proportion of
households still ‘stuck’ on legacy copper networks, where achieved speeds are typically 30-
50mbps.
FIGURE 5
Wireless and Wireline Capacity – Achieved Speeds mbps)
Source: Barclays Research estimates
When we consider the situation globally, incorporating both developed markets with
reasonably full fixed access coverage and developing markets with much weaker
connectivity, FWA provides an opportunity to both disrupt fixed and, as Ericsson has put it,
“connect the unconnected.”
0
1
10
100
1,000
2000
2001
2002
2003
2004
2005
2006
2007
2008
2009
2010
2011
2012
2013
2014
2015
2016
2017
2018
2019
2020
2021
2022
2023
2024
2025
Mobile Fixed (VDSL) Fixed (FTTH)
Fixed network speeds have
always outpaced mobile – Can
mobile catch up?
Barclays | Telecom Services and Tech Hardware
9 September 2019 7
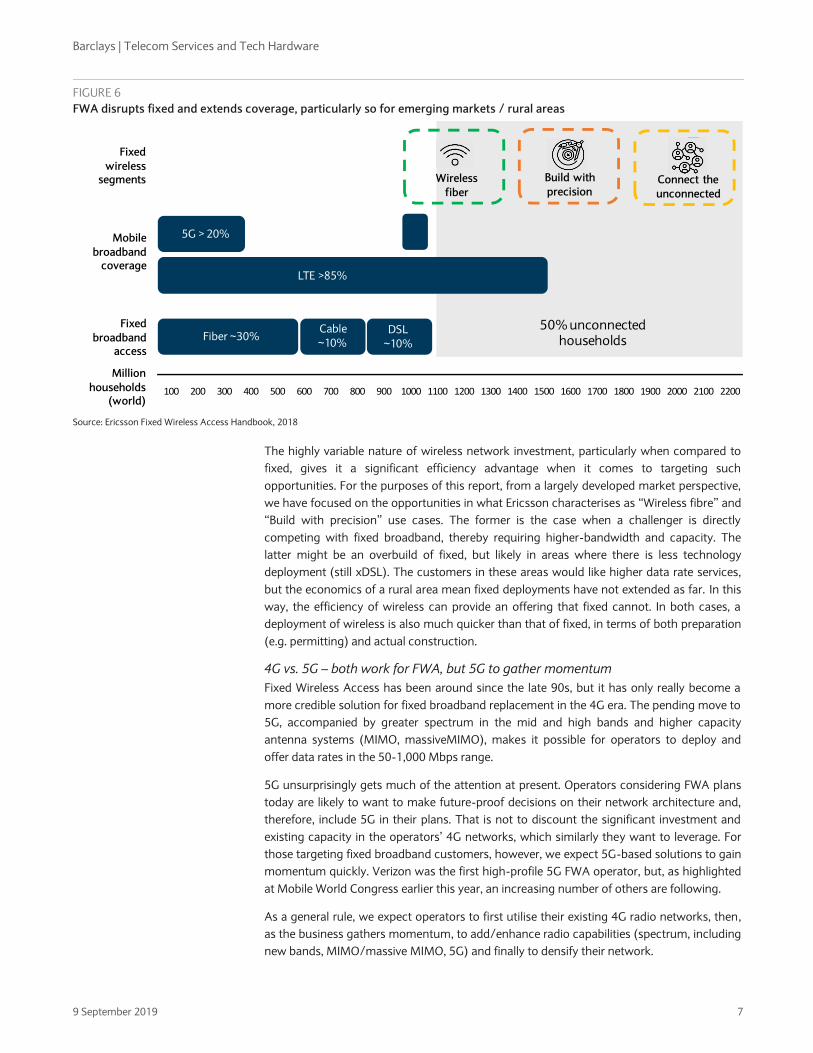
FIGURE 6
FWA disrupts fixed and extends coverage, particularly so for emerging markets / rural areas
Source: Ericsson Fixed Wireless Access Handbook, 2018
The highly variable nature of wireless network investment, particularly when compared to
fixed, gives it a significant efficiency advantage when it comes to targeting such
opportunities. For the purposes of this report, from a largely developed market perspective,
we have focused on the opportunities in what Ericsson characterises as “Wireless fibre” and
“Build with precision” use cases. The former is the case when a challenger is directly
competing with fixed broadband, thereby requiring higher-bandwidth and capacity. The
latter might be an overbuild of fixed, but likely in areas where there is less technology
deployment (still xDSL). The customers in these areas would like higher data rate services,
but the economics of a rural area mean fixed deployments have not extended as far. In this
way, the efficiency of wireless can provide an offering that fixed cannot. In both cases, a
deployment of wireless is also much quicker than that of fixed, in terms of both preparation
(e.g. permitting) and actual construction.
4G vs. 5G – both work for FWA, but 5G to gather momentum
Fixed Wireless Access has been around since the late 90s, but it has only really become a
more credible solution for fixed broadband replacement in the 4G era. The pending move to
5G, accompanied by greater spectrum in the mid and high bands and higher capacity
antenna systems (MIMO, massiveMIMO), makes it possible for operators to deploy and
offer data rates in the 50-1,000 Mbps range.
5G unsurprisingly gets much of the attention at present. Operators considering FWA plans
today are likely to want to make future-proof decisions on their network architecture and,
therefore, include 5G in their plans. That is not to discount the significant investment and
existing capacity in the operators’ 4G networks, which similarly they want to leverage. For
those targeting fixed broadband customers, however, we expect 5G-based solutions to gain
momentum quickly. Verizon was the first high-profile 5G FWA operator, but, as highlighted
at Mobile World Congress earlier this year, an increasing number of others are following.
As a general rule, we expect operators to first utilise their existing 4G radio networks, then,
as the business gathers momentum, to add/enhance radio capabilities (spectrum, including
new bands, MIMO/massive MIMO, 5G) and finally to densify their network.
Mobile
broadband coverage
Fixed
broadband access
LTE >85%
Fiber ~30%Cable
~10%DSL
~10%
5G > 20%
50% unconnected households
Fixed
wireless segments
Million
households (world)
Wireless
fiber
Build with
precisionConnect the
unconnected
100 200 300 400 500 600 700 800 900 1000 1100 1200 1300 1400 1500 1600 1700 1800 1900 2000 2100 2200
Barclays | Telecom Services and Tech Hardware
9 September 2019 8
FWA but one of the 5G use cases
While 4G network deployments have focused on mobile broadband deployments, in time,
5G is designed to take on a broader range of use cases, including Fixed Wireless Access as
well as enhanced Mobile Broadband (eMBB), Ultra Reliable Low Latency Communication
(URLLC) and massive Machine to Machine Communication (mMTC). These different use
cases each require a different type of deployment.
5G is also to be deployed in low-band (600MHz – 2GHz), mid-band (2-6GHz) and high-
band / mmWave (26GHz+) frequencies. Spectrum bands have long been a key determinant
of the network topology adopted by the service provider, given the lower signal propagation
at higher spectrum bands. With 5G, in particular, this is an even more acute issue given the
addition of mid-band and mmWave spectrum at much higher bands than previously
addressed. The higher bands naturally require a denser network grid.
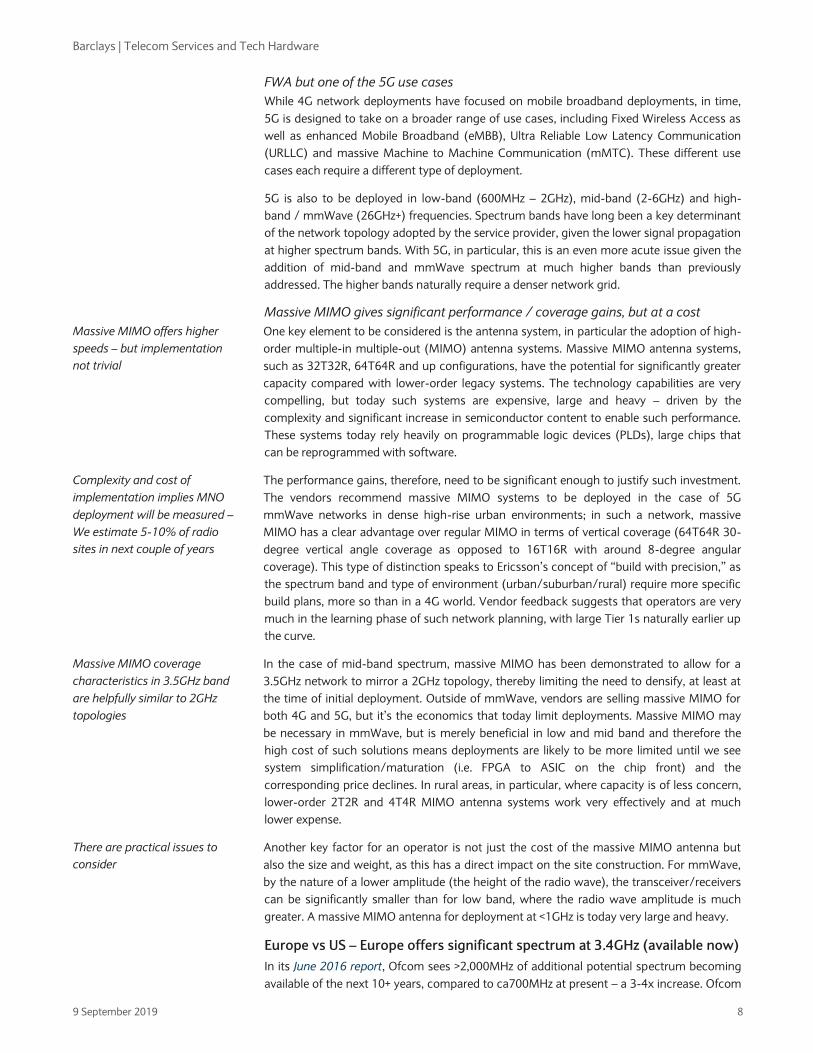
Massive MIMO gives significant performance / coverage gains, but at a cost
One key element to be considered is the antenna system, in particular the adoption of high-
order multiple-in multiple-out (MIMO) antenna systems. Massive MIMO antenna systems,
such as 32T32R, 64T64R and up configurations, have the potential for significantly greater
capacity compared with lower-order legacy systems. The technology capabilities are very
compelling, but today such systems are expensive, large and heavy – driven by the
complexity and significant increase in semiconductor content to enable such performance.
These systems today rely heavily on programmable logic devices (PLDs), large chips that
can be reprogrammed with software.
The performance gains, therefore, need to be significant enough to justify such investment.
The vendors recommend massive MIMO systems to be deployed in the case of 5G
mmWave networks in dense high-rise urban environments; in such a network, massive
MIMO has a clear advantage over regular MIMO in terms of vertical coverage (64T64R 30-
degree vertical angle coverage as opposed to 16T16R with around 8-degree angular
coverage). This type of distinction speaks to Ericsson’s concept of “build with precision,” as
the spectrum band and type of environment (urban/suburban/rural) require more specific
build plans, more so than in a 4G world. Vendor feedback suggests that operators are very
much in the learning phase of such network planning, with large Tier 1s naturally earlier up
the curve.
In the case of mid-band spectrum, massive MIMO has been demonstrated to allow for a
3.5GHz network to mirror a 2GHz topology, thereby limiting the need to densify, at least at
the time of initial deployment. Outside of mmWave, vendors are selling massive MIMO for
both 4G and 5G, but it’s the economics that today limit deployments. Massive MIMO may
be necessary in mmWave, but is merely beneficial in low and mid band and therefore the
high cost of such solutions means deployments are likely to be more limited until we see
system simplification/maturation (i.e. FPGA to ASIC on the chip front) and the
corresponding price declines. In rural areas, in particular, where capacity is of less concern,
lower-order 2T2R and 4T4R MIMO antenna systems work very effectively and at much
lower expense.
Another key factor for an operator is not just the cost of the massive MIMO antenna but
also the size and weight, as this has a direct impact on the site construction. For mmWave,
by the nature of a lower amplitude (the height of the radio wave), the transceiver/receivers
can be significantly smaller than for low band, where the radio wave amplitude is much
greater. A massive MIMO antenna for deployment at <1GHz is today very large and heavy.
Europe vs US – Europe offers significant spectrum at 3.4GHz (available now)
In its June 2016 report, Ofcom sees >2,000MHz of additional potential spectrum becoming
available of the next 10+ years, compared to ca700MHz at present – a 3-4x increase. Ofcom
Massive MIMO offers higher
speeds – but implementation
not trivial
Complexity and cost of
implementation implies MNO
deployment will be measured –
We estimate 5-10% of radio
sites in next couple of years
Massive MIMO coverage
characteristics in 3.5GHz band
are helpfully similar to 2GHz
topologies
There are practical issues to
consider
Barclays | Telecom Services and Tech Hardware
9 September 2019 9
sees 700MHz as a priority, along with 1.4GHz, 2.3GHz, 3.4GHz, 3.6-3.8GHz, and 5.7-
5.85GHz as a key priority at the low to mid range of frequencies, but also potential
significant amounts at 24.5-27.5GHz or 31.8-33.4GHz. The increase in lower-frequency
band spectrum (124MHz at <3GHz) will not in itself facilitate large capacity increases – it is
to an extent the 3-6GHz, but most likely 26GHz+ (termed mmWave) that will help facilitate
much higher speeds, with the higher-frequency ranges used primarily for front and
backhaul initially.
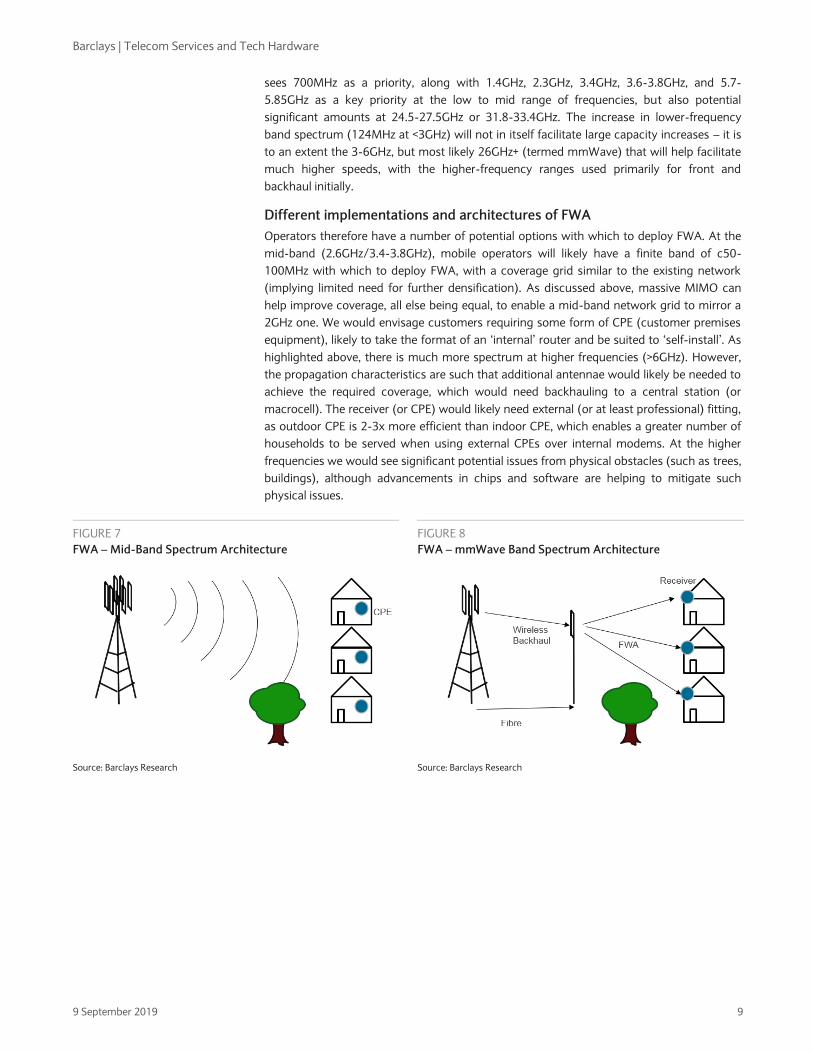
Different implementations and architectures of FWA
Operators therefore have a number of potential options with which to deploy FWA. At the
mid-band (2.6GHz/3.4-3.8GHz), mobile operators will likely have a finite band of c50-
100MHz with which to deploy FWA, with a coverage grid similar to the existing network
(implying limited need for further densification). As discussed above, massive MIMO can
help improve coverage, all else being equal, to enable a mid-band network grid to mirror a
2GHz one. We would envisage customers requiring some form of CPE (customer premises
equipment), likely to take the format of an ‘internal’ router and be suited to ‘self-install’. As
highlighted above, there is much more spectrum at higher frequencies (>6GHz). However,
the propagation characteristics are such that additional antennae would likely be needed to
achieve the required coverage, which would need backhauling to a central station (or
macrocell). The receiver (or CPE) would likely need external (or at least professional) fitting,
as outdoor CPE is 2-3x more efficient than indoor CPE, which enables a greater number of
households to be served when using external CPEs over internal modems. At the higher
frequencies we would see significant potential issues from physical obstacles (such as trees,
buildings), although advancements in chips and software are helping to mitigate such
physical issues.
FIGURE 7
FWA – Mid-Band Spectrum Architecture
FIGURE 8
FWA – mmWave Band Spectrum Architecture
Source: Barclays Research Source: Barclays Research
Barclays | Telecom Services and Tech Hardware
9 September 2019 10
FWA – Does the business case work?
Fixed and mobile networks traditionally have very different economics. Wireline networks
tend to have very high fixed costs of rollout due to the cost of digging (€300-1500 per home
passed), but can offer Gigabit speeds to every customer, due to the low incremental cost of
the physical (glass) fibre. In stark contrast, a wireless operator can easily cover a wide area
(and large population) with a single radio site (c€100-200k upfront cost). However, the
mobile operator’s costs increase with capacity – be it more required spectrum, more
antennae, greater cost of backhaul, and also then site densification. Assessing the FWA
business case requires an understanding of the future capacity of future wireless networks,
and also the cost to deliver it. We believe that FWA could conceivably capture 5-10% of
current wireline broadband share.
Economics of wireless structurally different to those of wireline
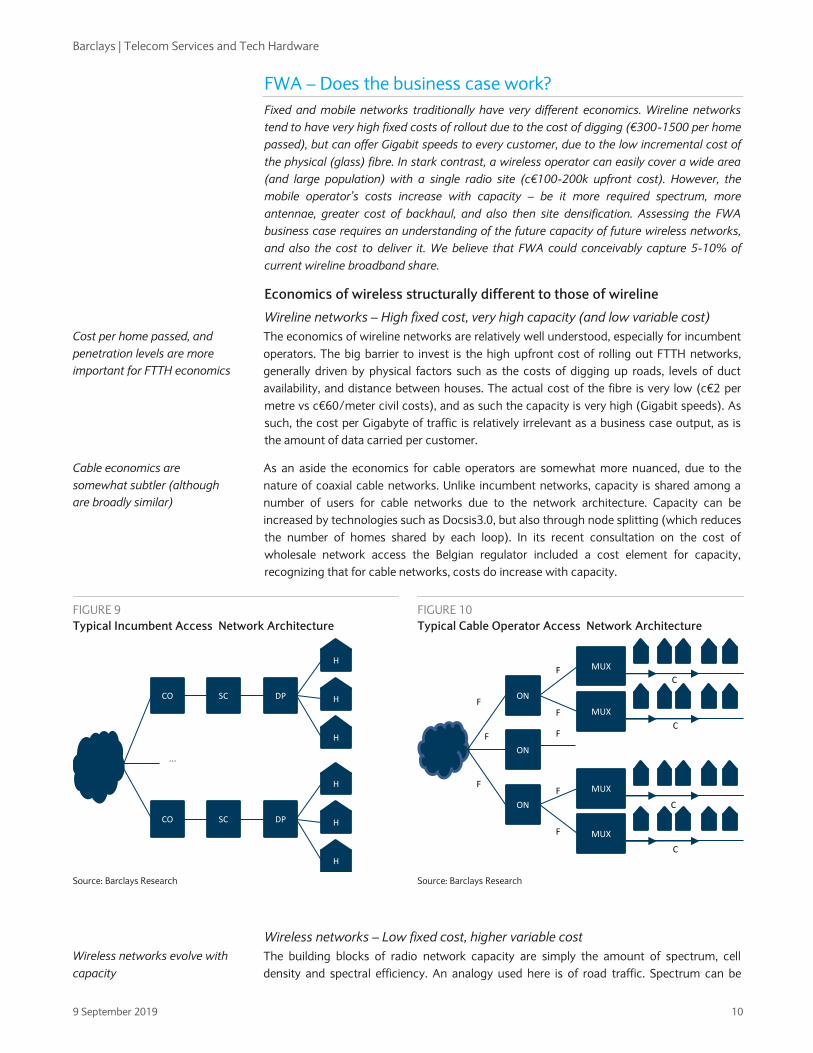
Wireline networks – High fixed cost, very high capacity (and low variable cost)
The economics of wireline networks are relatively well understood, especially for incumbent
operators. The big barrier to invest is the high upfront cost of rolling out FTTH networks,
generally driven by physical factors such as the costs of digging up roads, levels of duct
availability, and distance between houses. The actual cost of the fibre is very low (c€2 per
metre vs c€60/meter civil costs), and as such the capacity is very high (Gigabit speeds). As
such, the cost per Gigabyte of traffic is relatively irrelevant as a business case output, as is
the amount of data carried per customer.
As an aside the economics for cable operators are somewhat more nuanced, due to the
nature of coaxial cable networks. Unlike incumbent networks, capacity is shared among a
number of users for cable networks due to the network architecture. Capacity can be
increased by technologies such as Docsis3.0, but also through node splitting (which reduces
the number of homes shared by each loop). In its recent consultation on the cost of
wholesale network access the Belgian regulator included a cost element for capacity,
recognizing that for cable networks, costs do increase with capacity.
FIGURE 9
Typical Incumbent Access Network Architecture
FIGURE 10
Typical Cable Operator Access Network Architecture
Source: Barclays Research Source: Barclays Research
Wireless networks – Low fixed cost, higher variable cost
The building blocks of radio network capacity are simply the amount of spectrum, cell
density and spectral efficiency. An analogy used here is of road traffic. Spectrum can be
DPSC H
H
H
CO
DPSC H
H
H
CO
...
MUX
MUX
ON
MUX
MUX
ON
ON
F
F
FF
F
F
F
F
C
C
C
C
Cost per home passed, and
penetration levels are more
important for FTTH economics
Cable economics are
somewhat subtler (although
are broadly similar)
Wireless networks evolve with
capacity
Barclays | Telecom Services and Tech Hardware
9 September 2019 11
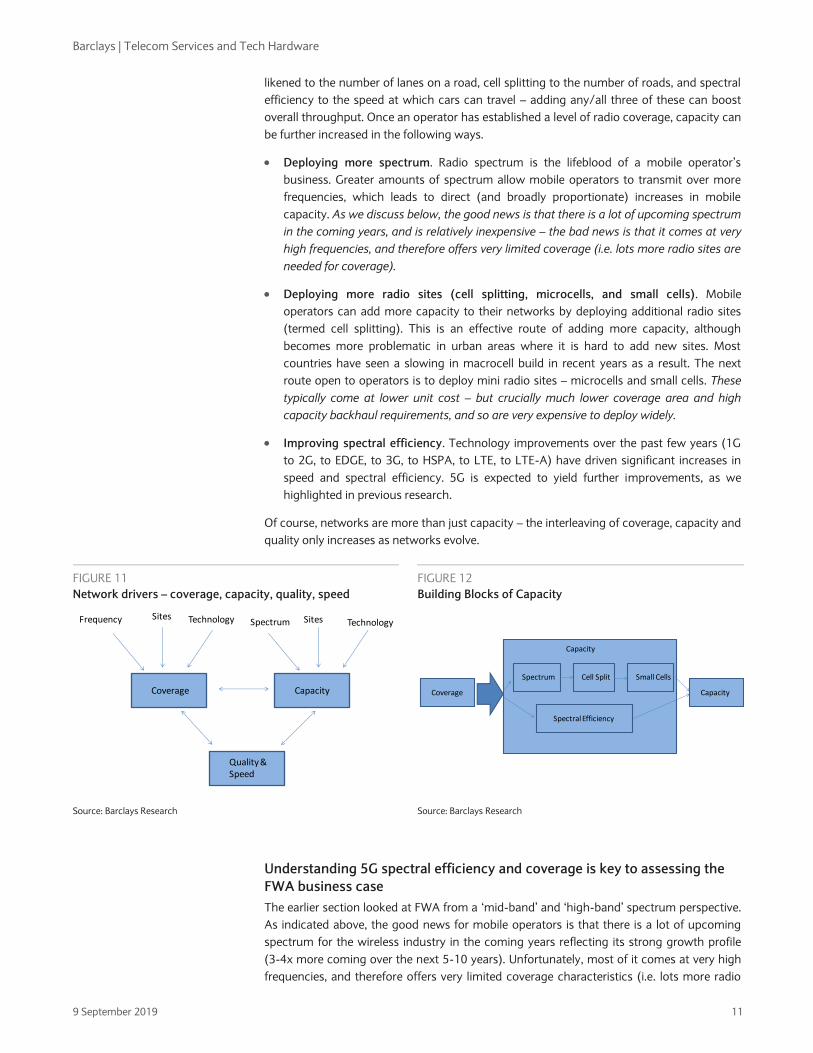
likened to the number of lanes on a road, cell splitting to the number of roads, and spectral
efficiency to the speed at which cars can travel – adding any/all three of these can boost
overall throughput. Once an operator has established a level of radio coverage, capacity can
be further increased in the following ways.
Deploying more spectrum. Radio spectrum is the lifeblood of a mobile operator’s
business. Greater amounts of spectrum allow mobile operators to transmit over more
frequencies, which leads to direct (and broadly proportionate) increases in mobile
capacity. As we discuss below, the good news is that there is a lot of upcoming spectrum
in the coming years, and is relatively inexpensive – the bad news is that it comes at very
high frequencies, and therefore offers very limited coverage (i.e. lots more radio sites are
needed for coverage).
Deploying more radio sites (cell splitting, microcells, and small cells). Mobile
operators can add more capacity to their networks by deploying additional radio sites
(termed cell splitting). This is an effective route of adding more capacity, although
becomes more problematic in urban areas where it is hard to add new sites. Most
countries have seen a slowing in macrocell build in recent years as a result. The next
route open to operators is to deploy mini radio sites – microcells and small cells. These
typically come at lower unit cost – but crucially much lower coverage area and high
capacity backhaul requirements, and so are very expensive to deploy widely.
Improving spectral efficiency. Technology improvements over the past few years (1G
to 2G, to EDGE, to 3G, to HSPA, to LTE, to LTE-A) have driven significant increases in
speed and spectral efficiency. 5G is expected to yield further improvements, as we
highlighted in previous research.
Of course, networks are more than just capacity – the interleaving of coverage, capacity and
quality only increases as networks evolve.
FIGURE 11
Network drivers – coverage, capacity, quality, speed
FIGURE 12
Building Blocks of Capacity
Source: Barclays Research Source: Barclays Research
Understanding 5G spectral efficiency and coverage is key to assessing the
FWA business case
The earlier section looked at FWA from a ‘mid-band’ and ‘high-band’ spectrum perspective.
As indicated above, the good news for mobile operators is that there is a lot of upcoming
spectrum for the wireless industry in the coming years reflecting its strong growth profile
(3-4x more coming over the next 5-10 years). Unfortunately, most of it comes at very high
frequencies, and therefore offers very limited coverage characteristics (i.e. lots more radio
Coverage Capacity
Quality & Speed
Frequency Sites Technology Spectrum Sites Technology
Coverage
Spectrum Cell Split
Spectral Efficiency
Capacity
Small Cells
Capacity
Barclays | Telecom Services and Tech Hardware
9 September 2019 12
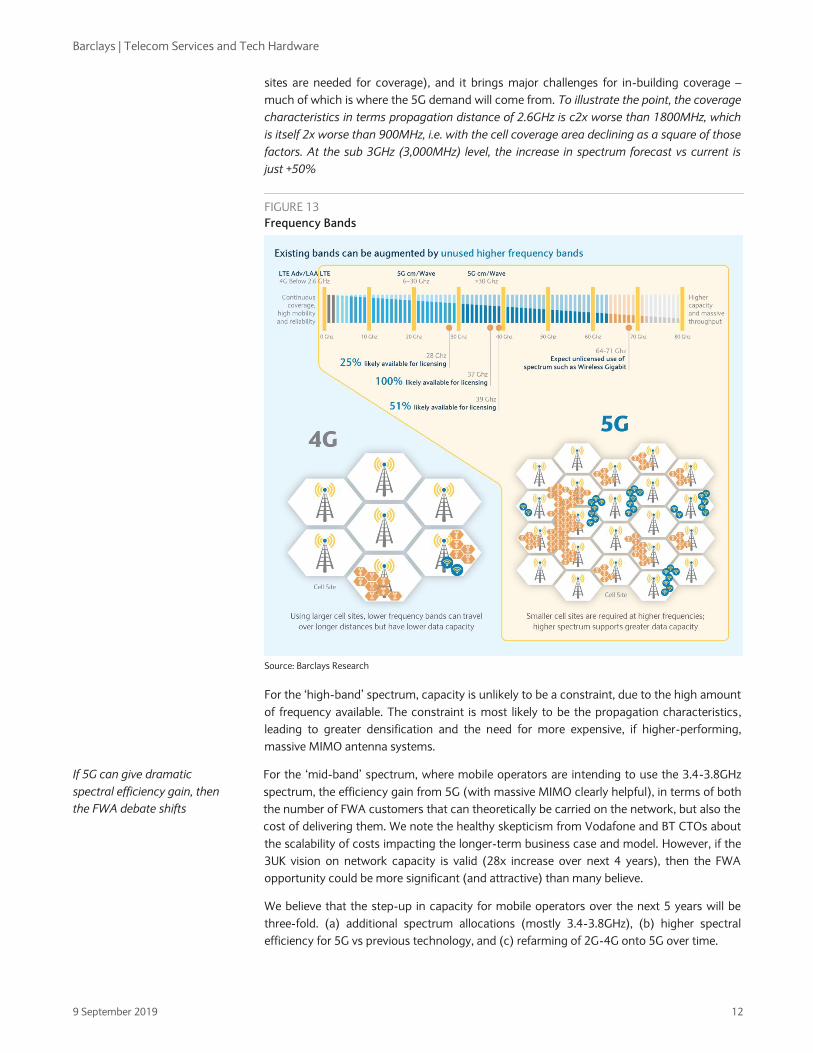
sites are needed for coverage), and it brings major challenges for in-building coverage –
much of which is where the 5G demand will come from. To illustrate the point, the coverage
characteristics in terms propagation distance of 2.6GHz is c2x worse than 1800MHz, which
is itself 2x worse than 900MHz, i.e. with the cell coverage area declining as a square of those
factors. At the sub 3GHz (3,000MHz) level, the increase in spectrum forecast vs current is
just +50%
FIGURE 13
Frequency Bands
Source: Barclays Research
For the ‘high-band’ spectrum, capacity is unlikely to be a constraint, due to the high amount
of frequency available. The constraint is most likely to be the propagation characteristics,
leading to greater densification and the need for more expensive, if higher-performing,
massive MIMO antenna systems.
For the ‘mid-band’ spectrum, where mobile operators are intending to use the 3.4-3.8GHz
spectrum, the efficiency gain from 5G (with massive MIMO clearly helpful), in terms of both
the number of FWA customers that can theoretically be carried on the network, but also the
cost of delivering them. We note the healthy skepticism from Vodafone and BT CTOs about
the scalability of costs impacting the longer-term business case and model. However, if the
3UK vision on network capacity is valid (28x increase over next 4 years), then the FWA
opportunity could be more significant (and attractive) than many believe.
We believe that the step-up in capacity for mobile operators over the next 5 years will be
three-fold. (a) additional spectrum allocations (mostly 3.4-3.8GHz), (b) higher spectral
efficiency for 5G vs previous technology, and (c) refarming of 2G-4G onto 5G over time.
If 5G can give dramatic
spectral efficiency gain, then
the FWA debate shifts
Barclays | Telecom Services and Tech Hardware
9 September 2019 13
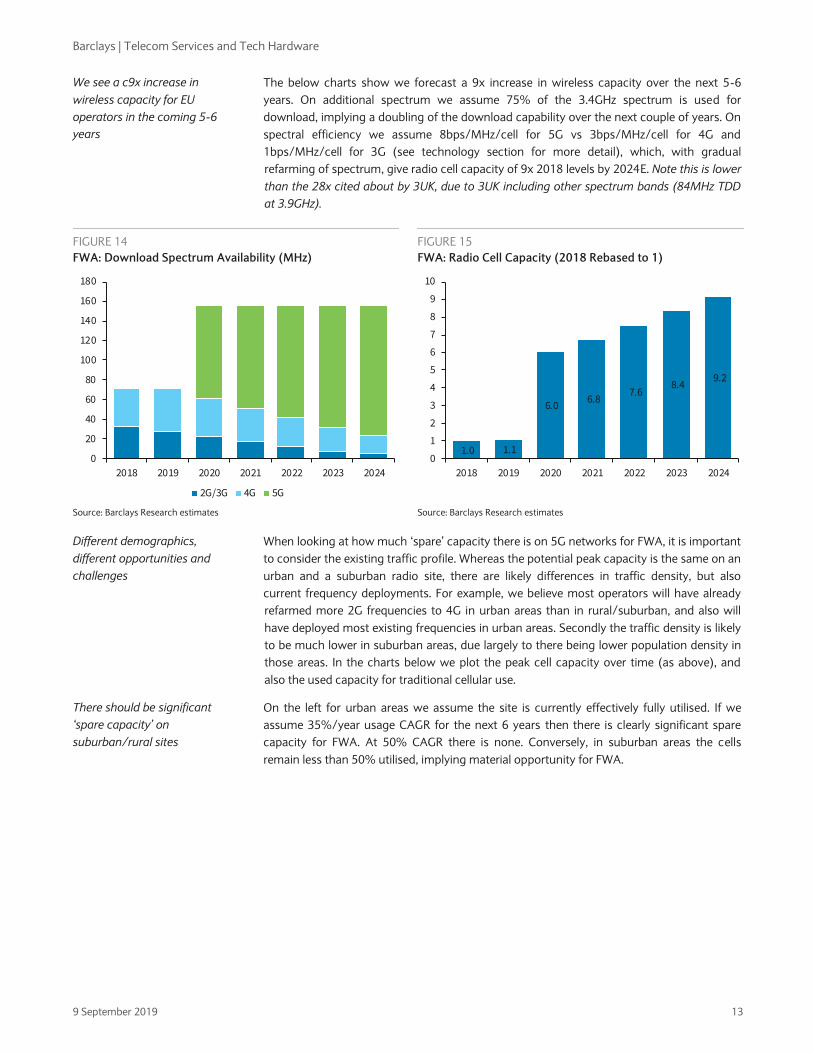
The below charts show we forecast a 9x increase in wireless capacity over the next 5-6
years. On additional spectrum we assume 75% of the 3.4GHz spectrum is used for
download, implying a doubling of the download capability over the next couple of years. On
spectral efficiency we assume 8bps/MHz/cell for 5G vs 3bps/MHz/cell for 4G and
1bps/MHz/cell for 3G (see technology section for more detail), which, with gradual
refarming of spectrum, give radio cell capacity of 9x 2018 levels by 2024E. Note this is lower
than the 28x cited about by 3UK, due to 3UK including other spectrum bands (84MHz TDD
at 3.9GHz).
FIGURE 14
FWA: Download Spectrum Availability (MHz)
FIGURE 15
FWA: Radio Cell Capacity (2018 Rebased to 1)
Source: Barclays Research estimates Source: Barclays Research estimates
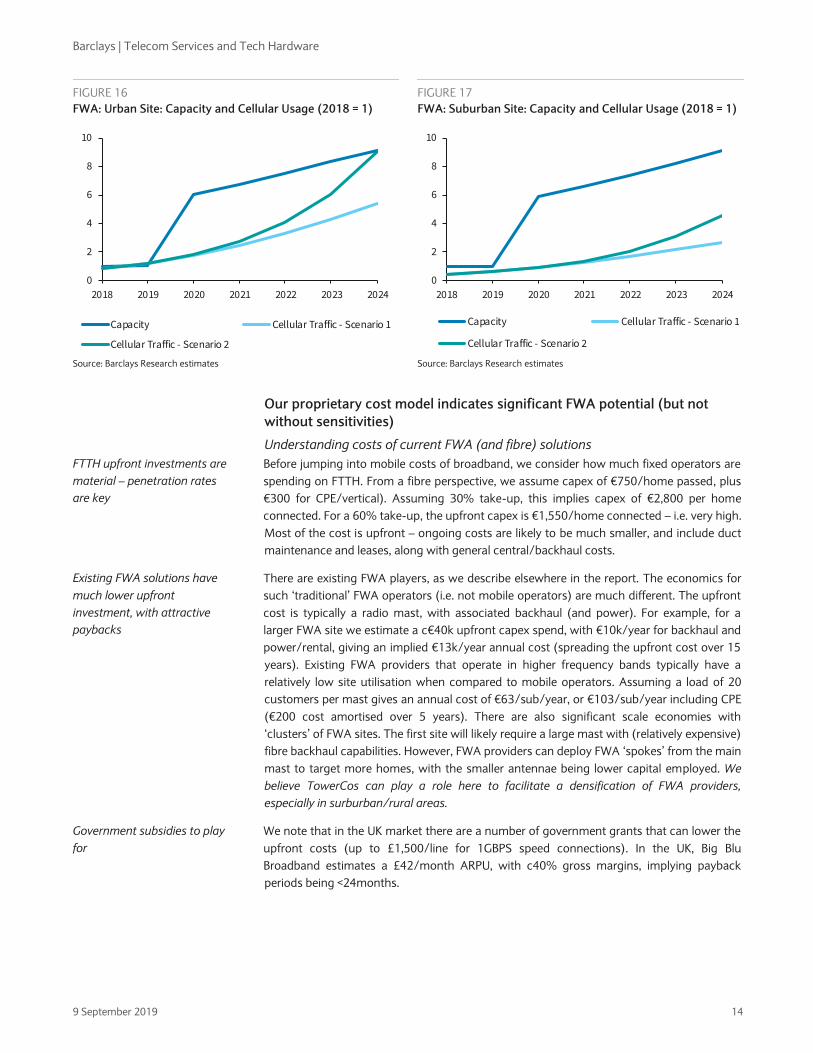
When looking at how much ‘spare’ capacity there is on 5G networks for FWA, it is important
to consider the existing traffic profile. Whereas the potential peak capacity is the same on an
urban and a suburban radio site, there are likely differences in traffic density, but also
current frequency deployments. For example, we believe most operators will have already
refarmed more 2G frequencies to 4G in urban areas than in rural/suburban, and also will
have deployed most existing frequencies in urban areas. Secondly the traffic density is likely
to be much lower in suburban areas, due largely to there being lower population density in
those areas. In the charts below we plot the peak cell capacity over time (as above), and
also the used capacity for traditional cellular use.
On the left for urban areas we assume the site is currently effectively fully utilised. If we
assume 35%/year usage CAGR for the next 6 years then there is clearly significant spare
capacity for FWA. At 50% CAGR there is none. Conversely, in suburban areas the cells
remain less than 50% utilised, implying material opportunity for FWA.
0
20
40
60
80
100
120
140
160
180
2018 2019 2020 2021 2022 2023 2024
2G/3G 4G 5G
1.0 1.1
6.0 6.8
7.6 8.4
9.2
0
1
2
3
4
5
6
7
8
9
10
2018 2019 2020 2021 2022 2023 2024
We see a c9x increase in
wireless capacity for EU
operators in the coming 5-6
years
Different demographics,
different opportunities and
challenges
There should be significant
‘spare capacity’ on
suburban/rural sites
Barclays | Telecom Services and Tech Hardware
9 September 2019 14
FIGURE 16
FWA: Urban Site: Capacity and Cellular Usage (2018 = 1)
FIGURE 17
FWA: Suburban Site: Capacity and Cellular Usage (2018 = 1)
Source: Barclays Research estimates Source: Barclays Research estimates
Our proprietary cost model indicates significant FWA potential (but not
without sensitivities)
Understanding costs of current FWA (and fibre) solutions
Before jumping into mobile costs of broadband, we consider how much fixed operators are
spending on FTTH. From a fibre perspective, we assume capex of €750/home passed, plus
€300 for CPE/vertical). Assuming 30% take-up, this implies capex of €2,800 per home
connected. For a 60% take-up, the upfront capex is €1,550/home connected – i.e. very high.
Most of the cost is upfront – ongoing costs are likely to be much smaller, and include duct
maintenance and leases, along with general central/backhaul costs.
There are existing FWA players, as we describe elsewhere in the report. The economics for
such ‘traditional’ FWA operators (i.e. not mobile operators) are much different. The upfront
cost is typically a radio mast, with associated backhaul (and power). For example, for a
larger FWA site we estimate a c€40k upfront capex spend, with €10k/year for backhaul and
power/rental, giving an implied €13k/year annual cost (spreading the upfront cost over 15
years). Existing FWA providers that operate in higher frequency bands typically have a
relatively low site utilisation when compared to mobile operators. Assuming a load of 20
customers per mast gives an annual cost of €63/sub/year, or €103/sub/year including CPE
(€200 cost amortised over 5 years). There are also significant scale economies with
‘clusters’ of FWA sites. The first site will likely require a large mast with (relatively expensive)
fibre backhaul capabilities. However, FWA providers can deploy FWA ‘spokes’ from the main
mast to target more homes, with the smaller antennae being lower capital employed. We
believe TowerCos can play a role here to facilitate a densification of FWA providers,
especially in surburban/rural areas.
We note that in the UK market there are a number of government grants that can lower the
upfront costs (up to £1,500/line for 1GBPS speed connections). In the UK, Big Blu
Broadband estimates a £42/month ARPU, with c40% gross margins, implying payback
periods being <24months.
0
2
4
6
8
10
2018 2019 2020 2021 2022 2023 2024
Capacity Cellular Traffic - Scenario 1
Cellular Traffic - Scenario 2
0
2
4
6
8
10
2018 2019 2020 2021 2022 2023 2024
Capacity Cellular Traffic - Scenario 1
Cellular Traffic - Scenario 2
FTTH upfront investments are
material – penetration rates
are key
Existing FWA solutions have
much lower upfront
investment, with attractive
paybacks
Government subsidies to play
for
Barclays | Telecom Services and Tech Hardware
9 September 2019 15
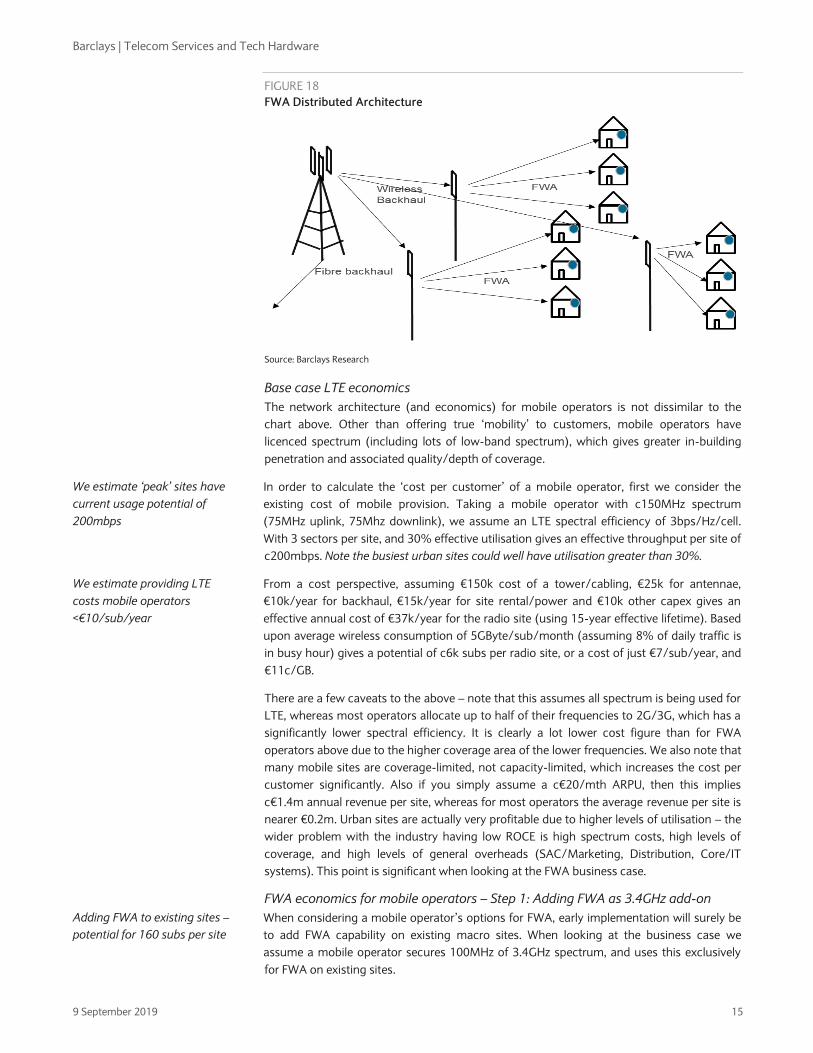
FIGURE 18
FWA Distributed Architecture
Source: Barclays Research
Base case LTE economics
The network architecture (and economics) for mobile operators is not dissimilar to the
chart above. Other than offering true ‘mobility’ to customers, mobile operators have
licenced spectrum (including lots of low-band spectrum), which gives greater in-building
penetration and associated quality/depth of coverage.
In order to calculate the ‘cost per customer’ of a mobile operator, first we consider the
existing cost of mobile provision. Taking a mobile operator with c150MHz spectrum
(75MHz uplink, 75Mhz downlink), we assume an LTE spectral efficiency of 3bps/Hz/cell.
With 3 sectors per site, and 30% effective utilisation gives an effective throughput per site of
c200mbps. Note the busiest urban sites could well have utilisation greater than 30%.
From a cost perspective, assuming €150k cost of a tower/cabling, €25k for antennae,
€10k/year for backhaul, €15k/year for site rental/power and €10k other capex gives an
effective annual cost of €37k/year for the radio site (using 15-year effective lifetime). Based
upon average wireless consumption of 5GByte/sub/month (assuming 8% of daily traffic is
in busy hour) gives a potential of c6k subs per radio site, or a cost of just €7/sub/year, and
€11c/GB.
There are a few caveats to the above – note that this assumes all spectrum is being used for
LTE, whereas most operators allocate up to half of their frequencies to 2G/3G, which has a
significantly lower spectral efficiency. It is clearly a lot lower cost figure than for FWA
operators above due to the higher coverage area of the lower frequencies. We also note that
many mobile sites are coverage-limited, not capacity-limited, which increases the cost per
customer significantly. Also if you simply assume a c€20/mth ARPU, then this implies
c€1.4m annual revenue per site, whereas for most operators the average revenue per site is
nearer €0.2m. Urban sites are actually very profitable due to higher levels of utilisation – the
wider problem with the industry having low ROCE is high spectrum costs, high levels of
coverage, and high levels of general overheads (SAC/Marketing, Distribution, Core/IT
systems). This point is significant when looking at the FWA business case.
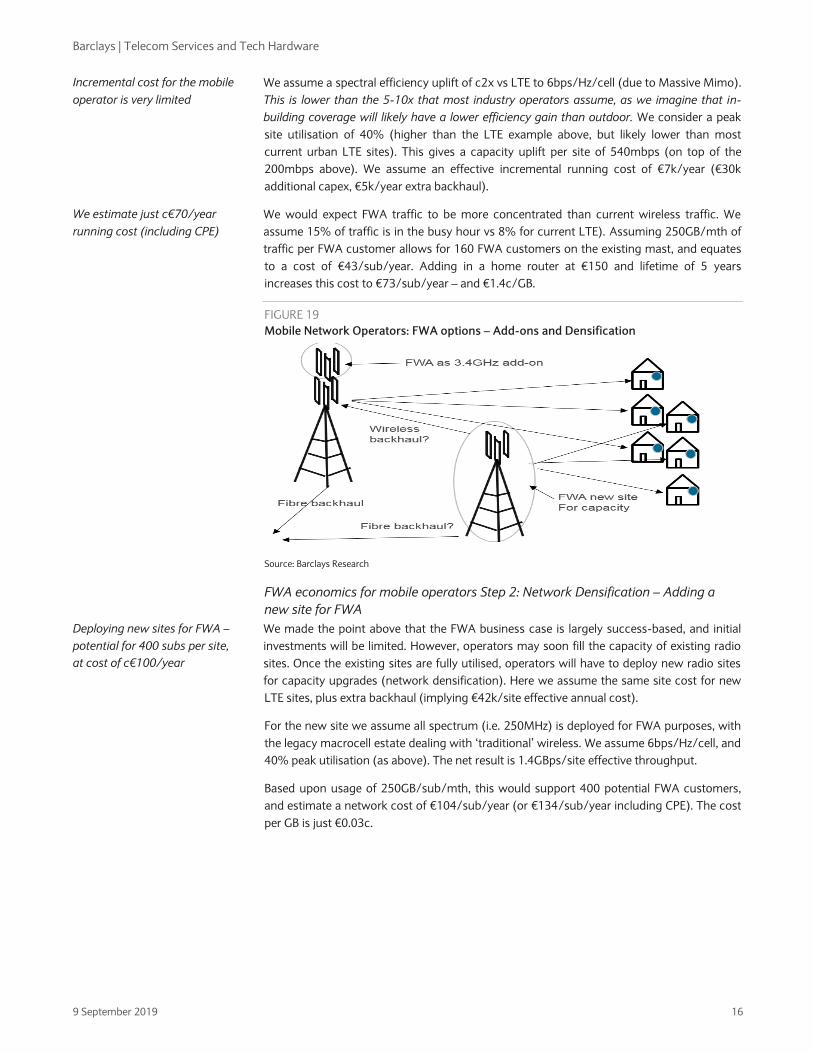
FWA economics for mobile operators – Step 1: Adding FWA as 3.4GHz add-on
When considering a mobile operator’s options for FWA, early implementation will surely be
to add FWA capability on existing macro sites. When looking at the business case we
assume a mobile operator secures 100MHz of 3.4GHz spectrum, and uses this exclusively
for FWA on existing sites.
We estimate ‘peak’ sites have
current usage potential of
200mbps
We estimate providing LTE
costs mobile operators
<€10/sub/year
Adding FWA to existing sites –
potential for 160 subs per site
Barclays | Telecom Services and Tech Hardware
9 September 2019 16
We assume a spectral efficiency uplift of c2x vs LTE to 6bps/Hz/cell (due to Massive Mimo).
This is lower than the 5-10x that most industry operators assume, as we imagine that in-
building coverage will likely have a lower efficiency gain than outdoor. We consider a peak
site utilisation of 40% (higher than the LTE example above, but likely lower than most
current urban LTE sites). This gives a capacity uplift per site of 540mbps (on top of the
200mbps above). We assume an effective incremental running cost of €7k/year (€30k
additional capex, €5k/year extra backhaul).
We would expect FWA traffic to be more concentrated than current wireless traffic. We
assume 15% of traffic is in the busy hour vs 8% for current LTE). Assuming 250GB/mth of
traffic per FWA customer allows for 160 FWA customers on the existing mast, and equates
to a cost of €43/sub/year. Adding in a home router at €150 and lifetime of 5 years
increases this cost to €73/sub/year – and €1.4c/GB.
FIGURE 19
Mobile Network Operators: FWA options – Add-ons and Densification
Source: Barclays Research
FWA economics for mobile operators Step 2: Network Densification – Adding a
new site for FWA
We made the point above that the FWA business case is largely success-based, and initial
investments will be limited. However, operators may soon fill the capacity of existing radio
sites. Once the existing sites are fully utilised, operators will have to deploy new radio sites
for capacity upgrades (network densification). Here we assume the same site cost for new
LTE sites, plus extra backhaul (implying €42k/site effective annual cost).
For the new site we assume all spectrum (i.e. 250MHz) is deployed for FWA purposes, with
the legacy macrocell estate dealing with ‘traditional’ wireless. We assume 6bps/Hz/cell, and
40% peak utilisation (as above). The net result is 1.4GBps/site effective throughput.
Based upon usage of 250GB/sub/mth, this would support 400 potential FWA customers,
and estimate a network cost of €104/sub/year (or €134/sub/year including CPE). The cost
per GB is just €0.03c.
Incremental cost for the mobile
operator is very limited
We estimate just c€70/year
running cost (including CPE)
Deploying new sites for FWA –
potential for 400 subs per site,
at cost of c€100/year
Barclays | Telecom Services and Tech Hardware
9 September 2019 17
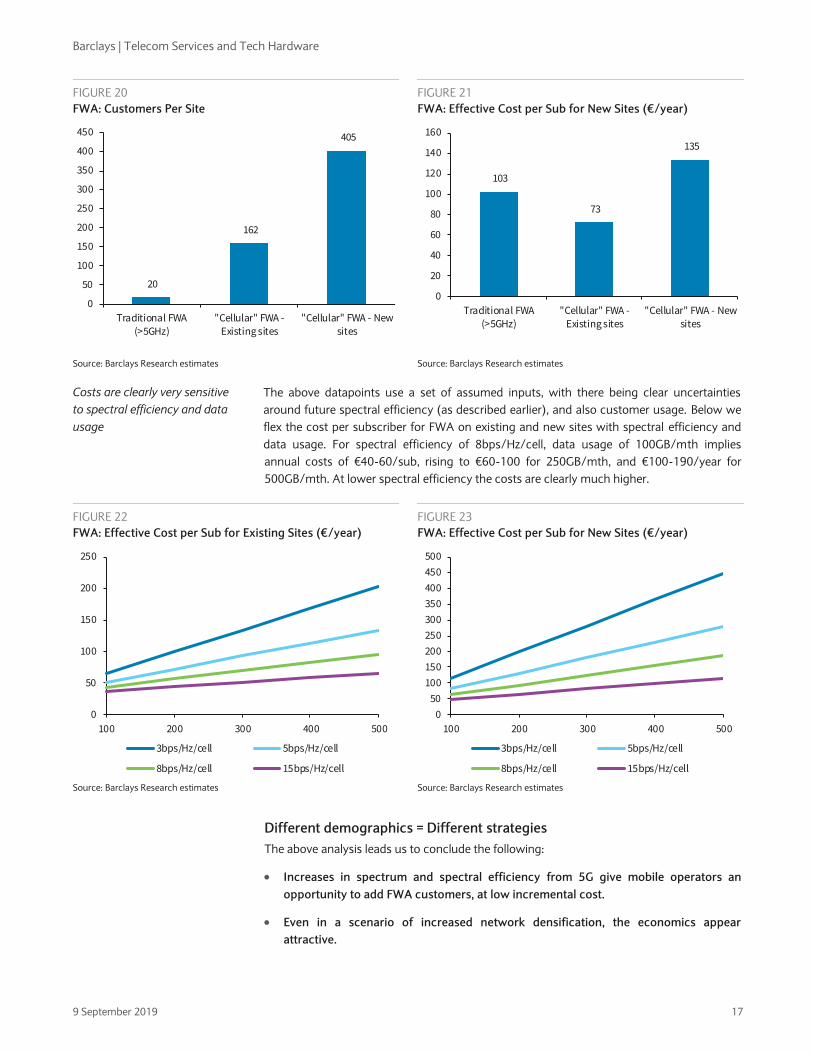
FIGURE 20
FWA: Customers Per Site
FIGURE 21
FWA: Effective Cost per Sub for New Sites (€/year)
Source: Barclays Research estimates Source: Barclays Research estimates
The above datapoints use a set of assumed inputs, with there being clear uncertainties
around future spectral efficiency (as described earlier), and also customer usage. Below we
flex the cost per subscriber for FWA on existing and new sites with spectral efficiency and
data usage. For spectral efficiency of 8bps/Hz/cell, data usage of 100GB/mth implies
annual costs of €40-60/sub, rising to €60-100 for 250GB/mth, and €100-190/year for
500GB/mth. At lower spectral efficiency the costs are clearly much higher.
FIGURE 22
FWA: Effective Cost per Sub for Existing Sites (€/year)
FIGURE 23
FWA: Effective Cost per Sub for New Sites (€/year)
Source: Barclays Research estimates Source: Barclays Research estimates
Different demographics = Different strategies
The above analysis leads us to conclude the following:
Increases in spectrum and spectral efficiency from 5G give mobile operators an
opportunity to add FWA customers, at low incremental cost.
Even in a scenario of increased network densification, the economics appear
attractive.
20
162
405
0
50
100
150
200
250
300
350
400
450
Traditional FWA(>5GHz)
"Cellular" FWA -Existing sites
"Cellular" FWA - Newsites
103
73
135
0
20
40
60
80
100
120
140
160
Traditional FWA(>5GHz)
"Cellular" FWA -Existing sites
"Cellular" FWA - Newsites
0
50
100
150
200
250
100 200 300 400 500
3bps/Hz/cell 5bps/Hz/cell
8bps/Hz/cell 15bps/Hz/cell
0
50
100
150
200
250
300
350
400
450
500
100 200 300 400 500
3bps/Hz/cell 5bps/Hz/cell
8bps/Hz/cell 15bps/Hz/cell
Costs are clearly very sensitive
to spectral efficiency and data
usage
Barclays | Telecom Services and Tech Hardware
9 September 2019 18
There are significant sensitivities surrounding the FWA business case – incorrect
assumptions on usage and technology efficiency could result in much higher cost per
customer, and also potentially negatively impact the network quality for all users.
We would therefore expect mobile operators to deploy different strategies in different
segments.
Urban – Offer niche ‘capped’ offerings. Mobile operators typically have very good levels
of radio coverage in urban areas (even if in-building coverage can sometimes be a
challenge in some areas), but the key issue facing mobile operators tends to be capacity.
Indeed, most congestion points in mobile operator networks are in urban areas due to
high levels of population density. We do see an opportunity for mobile operators using
FWA for targeting more ‘nomadic’ customer groups (visitors, renters, young
professionals), but given overall network capacity constraints (and risks highlighted
above), we would anticipate mobile operators taking a somewhat conservative view
here.
Suburban – Utilise significant spare capacity. Our analysis (see later in report) points to
operators having significant amounts of spectrum not currently being used on
suburban/rural sites, implying low levels of congestion, and significant spare capacity.
As much as 50% of frequencies in such areas are not being used for LTE/4G currently,
and so we believe the entire 3.4-3.8GHz frequency range (and maybe also some of the
2.1/2.6GHz spectrum) could be used for FWA. Furthermore, the rise of independent
tower companies (such as Cellnex), and the desire of the industry to increase network
sharing is leading to significant numbers of new sites being available to improve
network densification and promote greater FWA penetration.
Rural – Deploy in areas where existing infrastructure supportive and/or investment
requirements are low. Fixed broadband speeds are typically much lower in rural areas
(see later in report), and we anticipate incumbents will only build FTTH in rural once
they have built urban and suburban (if at all). As such, we see mobile operators as well
placed to target the rural segment with FWA, but only where they have good coverage.
We note that wireless coverage is also quite patchy in rural areas – Ofcom estimates
23% of homes do not have good indoor 4G coverage.
Given all the above, we see it as highly likely that mobile-centric operators with little to lose
will target the fixed broadband market. After all, the upfront costs are very low, and any
additional capex is clearly success-based. It is also a highly defensive move for mobile-
centric operators to insulate themselves against convergence. As the analysis also above
indicates, FWA can be a precursor to actually rolling our fibre in more suburban/rural areas,
which in our view creates strategic optionality. In terms of its relevance as a product, we see
the more copper-rich markets offering greater penetration potential.
We expect incumbents to use FWA as an alternative to last-mile access in more rural
communities. As an example, Telenor is promoting an FWA solution (based upon 4G/LTE)
in rural areas to replace copper lines as part of its strategy for copper switch-off, and has 2k
customers already on its service (which is geo-locked to prevent mobility).
Strategy for mobile-centric
operators? It’s worth giving it a
try
Incumbents will likely target
FWA as rural niche offering
Barclays | Telecom Services and Tech Hardware
9 September 2019 19
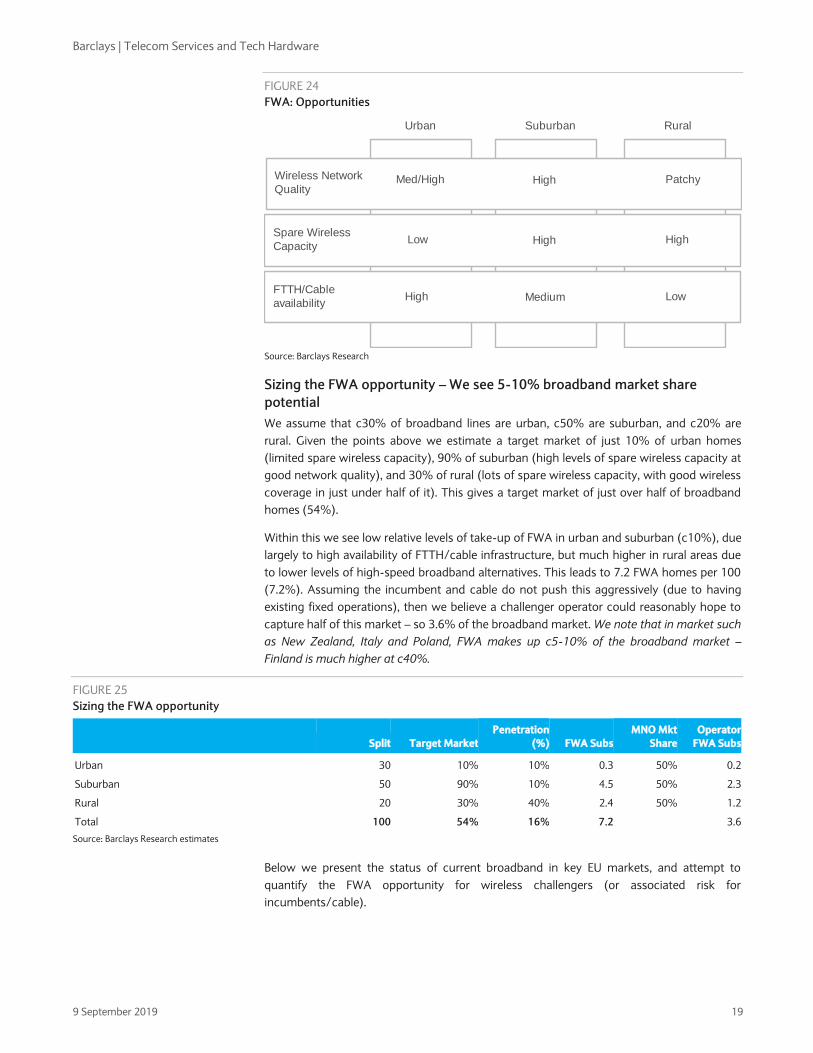
FIGURE 24
FWA: Opportunities
Source: Barclays Research
Sizing the FWA opportunity – We see 5-10% broadband market share
potential
We assume that c30% of broadband lines are urban, c50% are suburban, and c20% are
rural. Given the points above we estimate a target market of just 10% of urban homes
(limited spare wireless capacity), 90% of suburban (high levels of spare wireless capacity at
good network quality), and 30% of rural (lots of spare wireless capacity, with good wireless
coverage in just under half of it). This gives a target market of just over half of broadband
homes (54%).
Within this we see low relative levels of take-up of FWA in urban and suburban (c10%), due
largely to high availability of FTTH/cable infrastructure, but much higher in rural areas due
to lower levels of high-speed broadband alternatives. This leads to 7.2 FWA homes per 100
(7.2%). Assuming the incumbent and cable do not push this aggressively (due to having
existing fixed operations), then we believe a challenger operator could reasonably hope to
capture half of this market – so 3.6% of the broadband market. We note that in market such
as New Zealand, Italy and Poland, FWA makes up c5-10% of the broadband market –
Finland is much higher at c40%.
FIGURE 25
Sizing the FWA opportunity
Split Target Market
Penetration
(%) FWA Subs
MNO Mkt
Share
Operator
FWA Subs
Urban 30 10% 10% 0.3 50% 0.2
Suburban 50 90% 10% 4.5 50% 2.3
Rural 20 30% 40% 2.4 50% 1.2
Total 100 54% 16% 7.2 3.6
Source: Barclays Research estimates
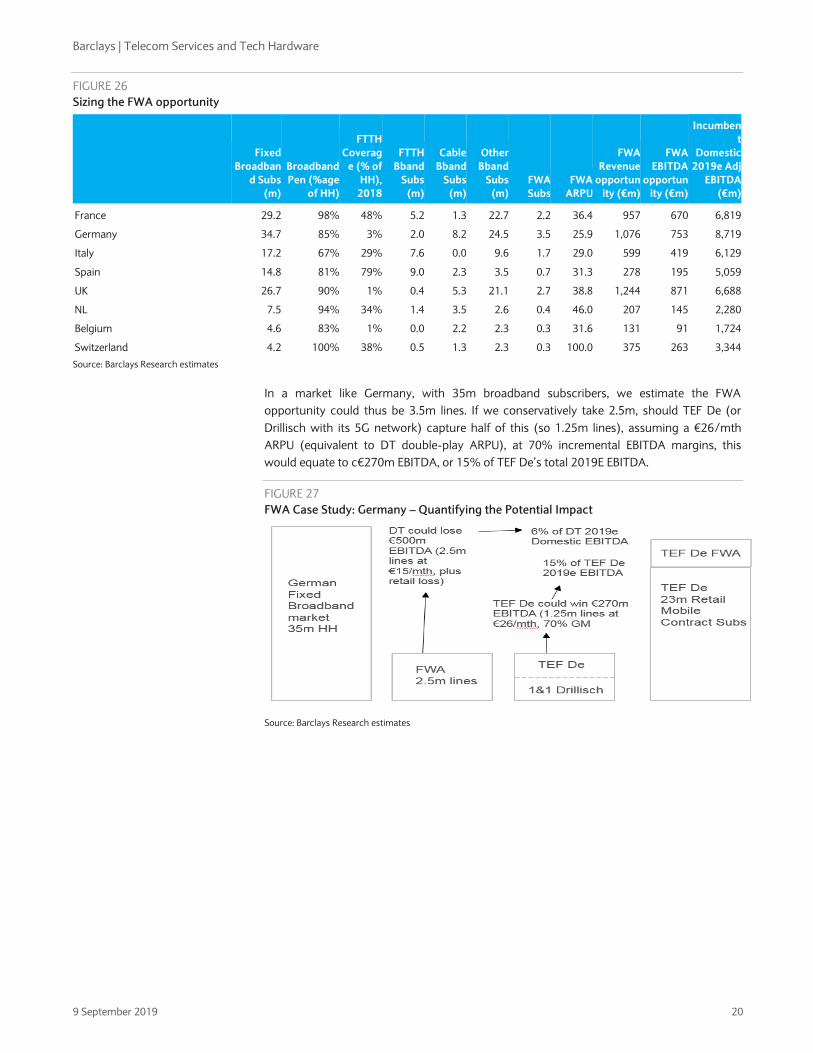
Below we present the status of current broadband in key EU markets, and attempt to
quantify the FWA opportunity for wireless challengers (or associated risk for
incumbents/cable).
Urban Suburban Rural
Wireless Network
Quality
Spare Wireless
Capacity
FTTH/Cable
availability
Med/High High Patchy
Low High High
High Medium Low
Barclays | Telecom Services and Tech Hardware
9 September 2019 20
FIGURE 26
Sizing the FWA opportunity
Fixed
Broadban
d Subs
(m)
Broadband
Pen (%age
of HH)
FTTH
Coverag
e (% of
HH),
2018
FTTH
Bband
Subs
(m)
Cable
Bband
Subs
(m)
Other
Bband
Subs
(m)
FWA
Subs
FWA
ARPU
FWA
Revenue
opportun
ity (€m)
FWA
EBITDA
opportun
ity (€m)
Incumben
t
Domestic
2019e Adj
EBITDA
(€m)
France 29.2 98% 48% 5.2 1.3 22.7 2.2 36.4 957 670 6,819
Germany 34.7 85% 3% 2.0 8.2 24.5 3.5 25.9 1,076 753 8,719
Italy 17.2 67% 29% 7.6 0.0 9.6 1.7 29.0 599 419 6,129
Spain 14.8 81% 79% 9.0 2.3 3.5 0.7 31.3 278 195 5,059
UK 26.7 90% 1% 0.4 5.3 21.1 2.7 38.8 1,244 871 6,688
NL 7.5 94% 34% 1.4 3.5 2.6 0.4 46.0 207 145 2,280
Belgium 4.6 83% 1% 0.0 2.2 2.3 0.3 31.6 131 91 1,724
Switzerland 4.2 100% 38% 0.5 1.3 2.3 0.3 100.0 375 263 3,344
Source: Barclays Research estimates
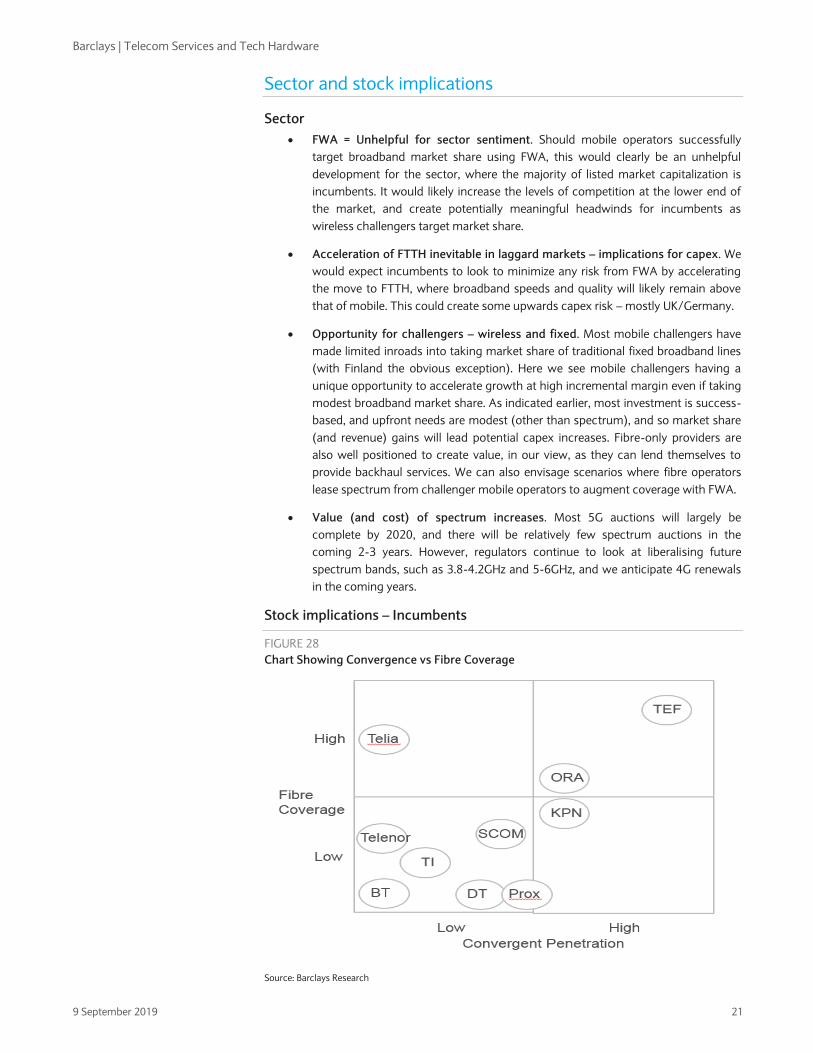
In a market like Germany, with 35m broadband subscribers, we estimate the FWA
opportunity could thus be 3.5m lines. If we conservatively take 2.5m, should TEF De (or
Drillisch with its 5G network) capture half of this (so 1.25m lines), assuming a €26/mth
ARPU (equivalent to DT double-play ARPU), at 70% incremental EBITDA margins, this
would equate to c€270m EBITDA, or 15% of TEF De’s total 2019E EBITDA.
FIGURE 27
FWA Case Study: Germany – Quantifying the Potential Impact
Source: Barclays Research estimates
Barclays | Telecom Services and Tech Hardware
9 September 2019 21
Sector and stock implications
Sector
FWA = Unhelpful for sector sentiment. Should mobile operators successfully
target broadband market share using FWA, this would clearly be an unhelpful
development for the sector, where the majority of listed market capitalization is
incumbents. It would likely increase the levels of competition at the lower end of
the market, and create potentially meaningful headwinds for incumbents as
wireless challengers target market share.
Acceleration of FTTH inevitable in laggard markets – implications for capex. We
would expect incumbents to look to minimize any risk from FWA by accelerating
the move to FTTH, where broadband speeds and quality will likely remain above
that of mobile. This could create some upwards capex risk – mostly UK/Germany.
Opportunity for challengers – wireless and fixed. Most mobile challengers have
made limited inroads into taking market share of traditional fixed broadband lines
(with Finland the obvious exception). Here we see mobile challengers having a
unique opportunity to accelerate growth at high incremental margin even if taking
modest broadband market share. As indicated earlier, most investment is success-
based, and upfront needs are modest (other than spectrum), and so market share
(and revenue) gains will lead potential capex increases. Fibre-only providers are
also well positioned to create value, in our view, as they can lend themselves to
provide backhaul services. We can also envisage scenarios where fibre operators
lease spectrum from challenger mobile operators to augment coverage with FWA.
Value (and cost) of spectrum increases. Most 5G auctions will largely be
complete by 2020, and there will be relatively few spectrum auctions in the
coming 2-3 years. However, regulators continue to look at liberalising future
spectrum bands, such as 3.8-4.2GHz and 5-6GHz, and we anticipate 4G renewals
in the coming years.
Stock implications – Incumbents
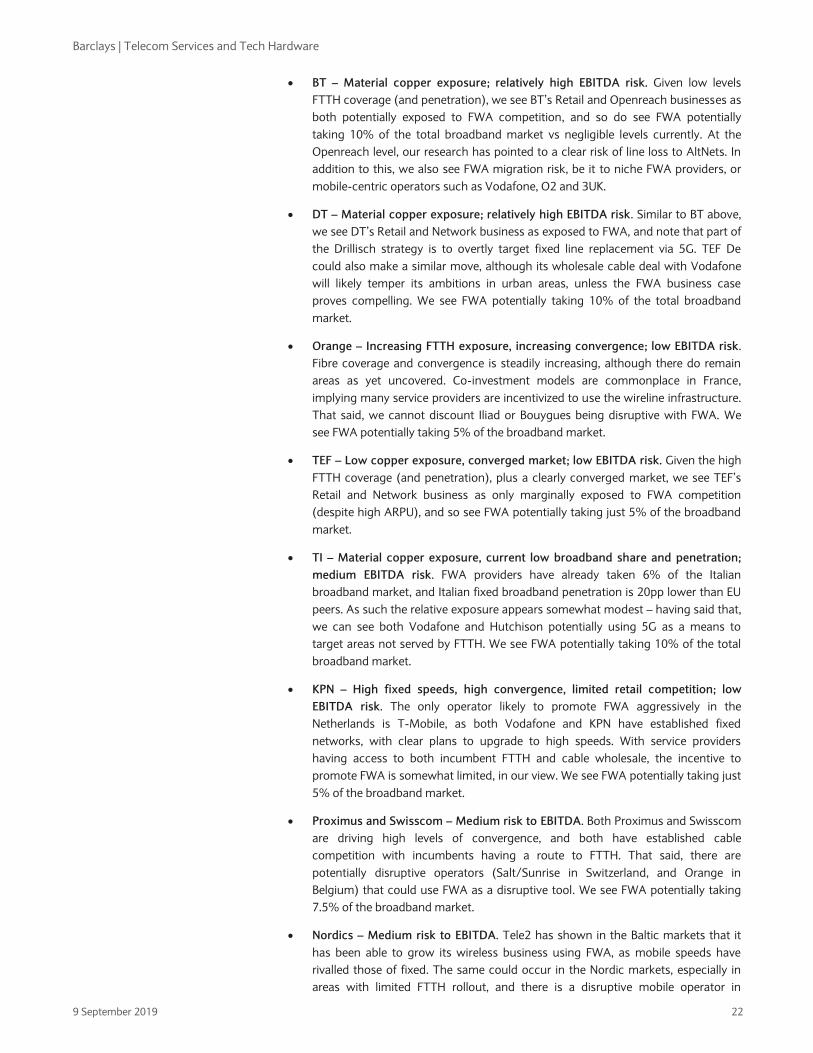
FIGURE 28
Chart Showing Convergence vs Fibre Coverage
Source: Barclays Research
Barclays | Telecom Services and Tech Hardware
9 September 2019 22
BT – Material copper exposure; relatively high EBITDA risk. Given low levels
FTTH coverage (and penetration), we see BT’s Retail and Openreach businesses as
both potentially exposed to FWA competition, and so do see FWA potentially
taking 10% of the total broadband market vs negligible levels currently. At the
Openreach level, our research has pointed to a clear risk of line loss to AltNets. In
addition to this, we also see FWA migration risk, be it to niche FWA providers, or
mobile-centric operators such as Vodafone, O2 and 3UK.
DT – Material copper exposure; relatively high EBITDA risk. Similar to BT above,
we see DT’s Retail and Network business as exposed to FWA, and note that part of
the Drillisch strategy is to overtly target fixed line replacement via 5G. TEF De
could also make a similar move, although its wholesale cable deal with Vodafone
will likely temper its ambitions in urban areas, unless the FWA business case
proves compelling. We see FWA potentially taking 10% of the total broadband
market.
Orange – Increasing FTTH exposure, increasing convergence; low EBITDA risk.
Fibre coverage and convergence is steadily increasing, although there do remain
areas as yet uncovered. Co-investment models are commonplace in France,
implying many service providers are incentivized to use the wireline infrastructure.
That said, we cannot discount Iliad or Bouygues being disruptive with FWA. We
see FWA potentially taking 5% of the broadband market.
TEF – Low copper exposure, converged market; low EBITDA risk. Given the high
FTTH coverage (and penetration), plus a clearly converged market, we see TEF’s
Retail and Network business as only marginally exposed to FWA competition
(despite high ARPU), and so see FWA potentially taking just 5% of the broadband
market.
TI – Material copper exposure, current low broadband share and penetration;
medium EBITDA risk. FWA providers have already taken 6% of the Italian
broadband market, and Italian fixed broadband penetration is 20pp lower than EU
peers. As such the relative exposure appears somewhat modest – having said that,
we can see both Vodafone and Hutchison potentially using 5G as a means to
target areas not served by FTTH. We see FWA potentially taking 10% of the total
broadband market.
KPN – High fixed speeds, high convergence, limited retail competition; low
EBITDA risk. The only operator likely to promote FWA aggressively in the
Netherlands is T-Mobile, as both Vodafone and KPN have established fixed
networks, with clear plans to upgrade to high speeds. With service providers
having access to both incumbent FTTH and cable wholesale, the incentive to
promote FWA is somewhat limited, in our view. We see FWA potentially taking just
5% of the broadband market.
Proximus and Swisscom – Medium risk to EBITDA. Both Proximus and Swisscom
are driving high levels of convergence, and both have established cable
competition with incumbents having a route to FTTH. That said, there are
potentially disruptive operators (Salt/Sunrise in Switzerland, and Orange in
Belgium) that could use FWA as a disruptive tool. We see FWA potentially taking
7.5% of the broadband market.
Nordics – Medium risk to EBITDA. Tele2 has shown in the Baltic markets that it
has been able to grow its wireless business using FWA, as mobile speeds have
rivalled those of fixed. The same could occur in the Nordic markets, especially in
areas with limited FTTH rollout, and there is a disruptive mobile operator in
Barclays | Telecom Services and Tech Hardware
9 September 2019 23
Norway, Denmark and Sweden (Ice, Hutchison and Hutchison respectively).
Sweden would appear to have a lower risk due to widespread FTTH deployment,
and in Finland the FWA migration has already occurred.
Vodafone – FWA should present more of an opportunity than a threat. Vodafone
now owns extensive fixed and mobile infrastructure in Spain, Germany and the
Netherlands, but this is high-speed cable, and so should not be materially
impacted by FWA. In the UK, Italy and Vodacom we see an opportunity for
Vodafone to take market share of fixed broadband using FWA. That said,
Vodafone is likely to be more reticent to risk impacting its mobile quality of service,
and as such we do not anticipate the company being overly aggressive near term.
Stock implications – Challengers/Cable
TEF De – Material market share opportunity. We see the low fibre coverage in
Germany presenting a clear opportunity for FWA as a replacement product. We
also believe recently improved network quality with ample spare 5G spectrum in
rural areas creates an opportunity for TEF De. TEF De has a low share of the
broadband market, and so has scope to grow its share materially on FWA (and on
Vodafone’s cable infrastructure), especially as the market converges. Assuming
TEF De adds 1.75m FWA subscribers (50% of total FWA), this could add 15% to
our 2019 EBITDA estimate.
Sunrise – actively capitalizing on FWA opportunity – sees at least 3% EBITDA by
2021E. Sunrise has actively talked up the FWA opportunity in Switzerland, seeing it
as a viable alternative to copper broadband, particularly in rural areas where the
speeds provided by Swisscom infrastructure are low. Having invested in its mobile
network to improve quality and catch up with Swisscom, Sunrise sees mobile
broadband, particularly on 5G, as a way to take market share in rural areas due to
the faster speeds offered. Long term it expects to have a mixture of fibre in urban
areas, copper (or potentially cable) in suburban areas and mobile broadband in
suburban/rural areas. Sunrise has already begun its 5G rollout and expects a low-
single-digit EBITDA contribution from mobile broadband in 2020, which it sees
doubling in 2021 (c.3% of EBITDA), offsetting the short-term investment required.
Drillisch & United Internet – A clear opportunity, but execution will take time.
Drillisch has c10m mobile and c4.3m fixed broadband customers, using all of
Telefonica De, Vodafone and DT for mobile and fixed wholesale access. The
company spends >€1bn/year on wholesale fixed and mobile payments (xDSL, 3G
and 4G), and could use its 5G network to migrate its mobile customer base off the
Telefonica De and Vodafone networks (this is well documented), but also
potentially provision fixed-line services. Given our estimate of c€3.5bn upfront
investment for c40% population coverage, the economics (on paper at least) of
this investment look potentially very attractive. Clearly execution is key (and not
without risk).
Orange Belgium – material upside potential. We believe Orange Belgium’s
network can be leveraged for FWA. Orange Belgium is currently pursuing a cable
wholesale strategy to take broadband market share in Belgium (it has currently
just c5% compared with its mobile market share of c23%). Whilst national cable
coverage could somewhat limit the FWA opportunity, Proximus’ slow FTTH rollout
does suggest that, were OBEL to pivot to an FWA strategy, it could take a
significant amount of market share. Modest share won through cable has provided
material upside for OBEL, so even just modest success with FWA (better margins
than cable) could offer material upside.
Barclays | Telecom Services and Tech Hardware
9 September 2019 24
Bouygues and Iliad. In France, Bouygues and Iliad do have not a legacy fixed line
networks and could therefore use FWA to complement their FTTH network
strategy. Whilst both operators have deployed some fiber in dense areas and are
using the co-investment model in less dense areas (AMII) with Orange or Altice
and the wholesale model with other operators in RIP areas, using a FWA
technology could be a sensible way to leverage their mobile assets. This is more
notably the case for Bouygues that had 17k LTE sites at YE 2018 and plans to have
total sites of 28k in 2023. Iliad is rolling its network and reached 12k LTE at YE
2018 and plans to have more than 25k sites by 2024. With 3.4-3.6GHz spectrum
auctions planned for 320MHz of spectrum in Q4 19/Q1 20, both companies could
secure enough spectrum to deploy a FWA strategy. We note that none has so far
given any indication that they wanted to pursue such a route.
Airtel Africa. Fixed line penetration and coverage in Africa is very low, with mobile
being the dominant technology for connectivity. Airtel Africa has consistently
indicated its strategy to pursue the FWA opportunity, and points to having
significant excess LTE capacity due to recent technology upgrades, and access to
sufficient spectrum. The company has carried out successful pilots in the
Seychelles, and we believe is well placed to roll out across the rest of the footprint.
Stock implications – Towers
Towers – Cellnex and Inwit indirect beneficiaries. We have discussed above in
detail the way operators can add capacity to their networks to cope with FWA
demand. Towers can benefit from either: 1) the heavier and larger equipment used
as this will require higher fees to tower operators; and 2) any future network
densification that may be required in future years as this represents an opportunity
for TowerCos to increase tenancy ratios or add new sites. Cellnex, in fact, already
hosts equipment for pure FWA operators, and has signed an agreement with
Linkem in Italy. Both Cellnex and Inwit also host equipment for Fastweb, which is
pursuing FWA in Italy outside of its fixed network coverage.
Stock implications – Technology Hardware
Radio access equipment vendors Nokia (OW) and Ericsson (EW) both actively
encourage operators to consider FWA strategies. While initial incremental capex may be
modest, as mobile challengers can leverage existing assets, if the provider is successful,
then we would expect to see additional success-based investment. We view FWA as an
additional, if modest, tailwind to the broader 5G adoption growth we model for mobile
equipment vendors. We forecast the two leading radio access vendors to grow at low
single digits over the next few years, driven by broader 5G deployments. In absolute
terms, we forecast $1.0-1.5bn in incremental radio access revenue for the industry each
year through the early 2020s. We consider FWA strategies as part of this growth.
Ubiquiti (UW) is a FWA provider, mostly in emerging markets, using WiFi for the access
layer. This market has slowed dramatically as 4G has grown, and we expect this trend to
continue.
FWA will also require the strengthening of networks beyond just the radio layer,
potentially leading to greater core and edge spending. In many cases, operators have
bolstered their backhaul networks in preparation for 5G deployments, one of a number
of positive drivers for the optical networking vendors in recent years. If FWA strategies
prove successful, then we may see such a tailwind continue for optical investment as
well. Key vendors here are Huawei (not covered), Ciena (OW) and Nokia, while Corning
(OW) should also benefit on the cable and passive components side. Networking
vendors that sell to the Telco space could also see a boost, which would help companies
like Cisco (EW), Arista (OW), Juniper (EW) and F5 (OW).
Barclays | Telecom Services and Tech Hardware
9 September 2019 25
Finland – Wireless (LTE) already replacing/replicating fixed
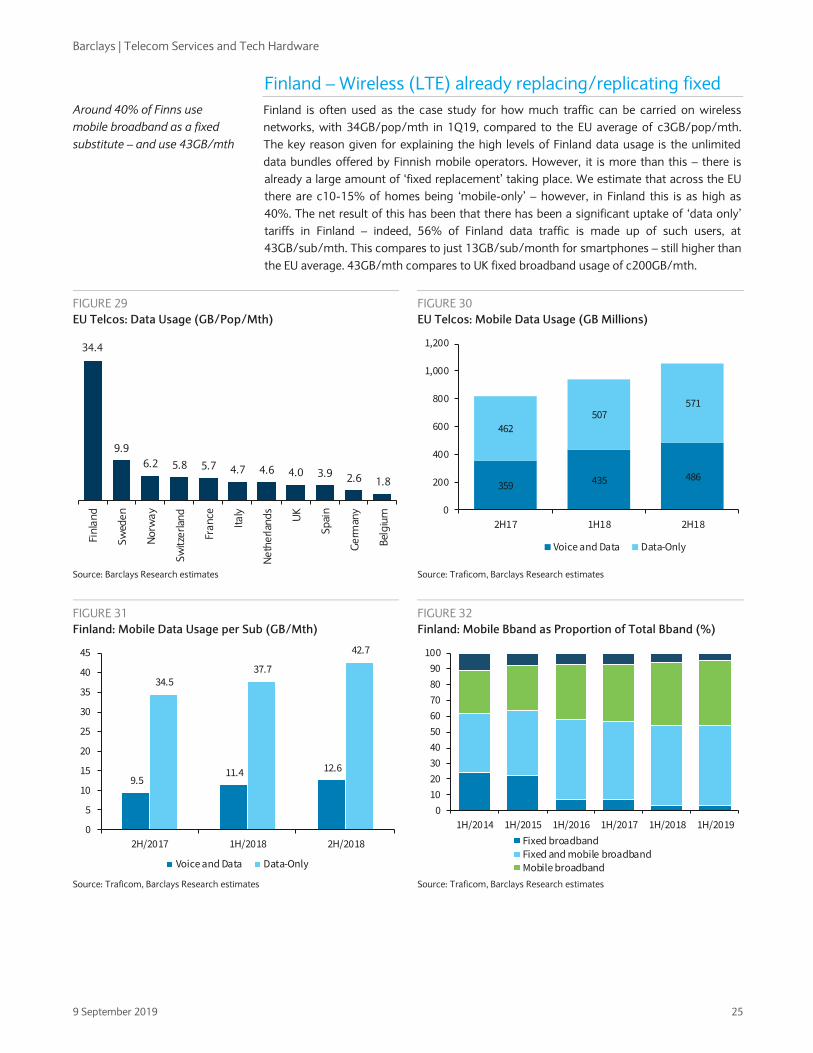
Finland is often used as the case study for how much traffic can be carried on wireless
networks, with 34GB/pop/mth in 1Q19, compared to the EU average of c3GB/pop/mth.
The key reason given for explaining the high levels of Finland data usage is the unlimited
data bundles offered by Finnish mobile operators. However, it is more than this – there is
already a large amount of ‘fixed replacement’ taking place. We estimate that across the EU
there are c10-15% of homes being ‘mobile-only’ – however, in Finland this is as high as
40%. The net result of this has been that there has been a significant uptake of ‘data only’
tariffs in Finland – indeed, 56% of Finland data traffic is made up of such users, at
43GB/sub/mth. This compares to just 13GB/sub/month for smartphones – still higher than
the EU average. 43GB/mth compares to UK fixed broadband usage of c200GB/mth.
FIGURE 29
EU Telcos: Data Usage (GB/Pop/Mth)
FIGURE 30
EU Telcos: Mobile Data Usage (GB Millions)
Source: Barclays Research estimates Source: Traficom, Barclays Research estimates
FIGURE 31
Finland: Mobile Data Usage per Sub (GB/Mth)
FIGURE 32
Finland: Mobile Bband as Proportion of Total Bband (%)
Source: Traficom, Barclays Research estimates Source: Traficom, Barclays Research estimates
34.4
9.9
6.2 5.8 5.7 4.7 4.6 4.0 3.9 2.6 1.8
Fin
lan
d
Sw
ede
n
No
rwa
y
Sw
itze
rlan
d
Fra
nce
Ita
ly
Ne
the
rlan
ds
UK
Sp
ain
Ge
rman
y
Bel
giu
m
359 435 486
462
507571
0
200
400
600
800
1,000
1,200
2H17 1H18 2H18
Voice and Data Data-Only
9.5 11.4 12.6
34.5 37.7
42.7
0
5
10
15
20
25
30
35
40
45
2H/2017 1H/2018 2H/2018
Voice and Data Data-Only
0
10
20
30
40
50
60
70
80
90
100
1H/2014 1H/2015 1H/2016 1H/2017 1H/2018 1H/2019
Fixed broadbandFixed and mobile broadbandMobile broadband
Around 40% of Finns use
mobile broadband as a fixed
substitute – and use 43GB/mth
Barclays | Telecom Services and Tech Hardware
9 September 2019 26
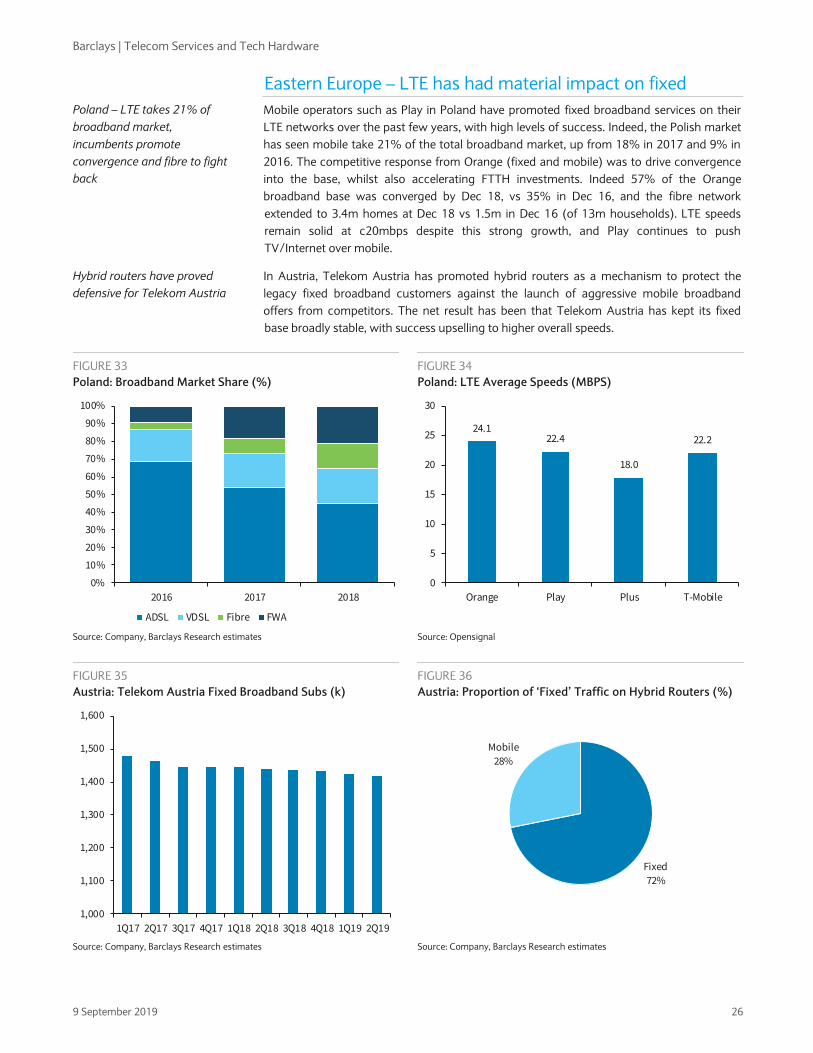
Eastern Europe – LTE has had material impact on fixed
Mobile operators such as Play in Poland have promoted fixed broadband services on their
LTE networks over the past few years, with high levels of success. Indeed, the Polish market
has seen mobile take 21% of the total broadband market, up from 18% in 2017 and 9% in
2016. The competitive response from Orange (fixed and mobile) was to drive convergence
into the base, whilst also accelerating FTTH investments. Indeed 57% of the Orange
broadband base was converged by Dec 18, vs 35% in Dec 16, and the fibre network
extended to 3.4m homes at Dec 18 vs 1.5m in Dec 16 (of 13m households). LTE speeds
remain solid at c20mbps despite this strong growth, and Play continues to push
TV/Internet over mobile.
In Austria, Telekom Austria has promoted hybrid routers as a mechanism to protect the
legacy fixed broadband customers against the launch of aggressive mobile broadband
offers from competitors. The net result has been that Telekom Austria has kept its fixed
base broadly stable, with success upselling to higher overall speeds.
FIGURE 33
Poland: Broadband Market Share (%)
FIGURE 34
Poland: LTE Average Speeds (MBPS)
Source: Company, Barclays Research estimates Source: Opensignal
FIGURE 35
Austria: Telekom Austria Fixed Broadband Subs (k)
FIGURE 36
Austria: Proportion of ‘Fixed’ Traffic on Hybrid Routers (%)
Source: Company, Barclays Research estimates Source: Company, Barclays Research estimates
0%
10%
20%
30%
40%
50%
60%
70%
80%
90%
100%
2016 2017 2018
ADSL VDSL Fibre FWA
24.122.4
18.0
22.2
0
5
10
15
20
25
30
Orange Play Plus T-Mobile
1,000
1,100
1,200
1,300
1,400
1,500
1,600
1Q17 2Q17 3Q17 4Q17 1Q18 2Q18 3Q18 4Q18 1Q19 2Q19
Fixed
72%
Mobile
28%
Poland – LTE takes 21% of
broadband market,
incumbents promote
convergence and fibre to fight
back
Hybrid routers have proved
defensive for Telekom Austria
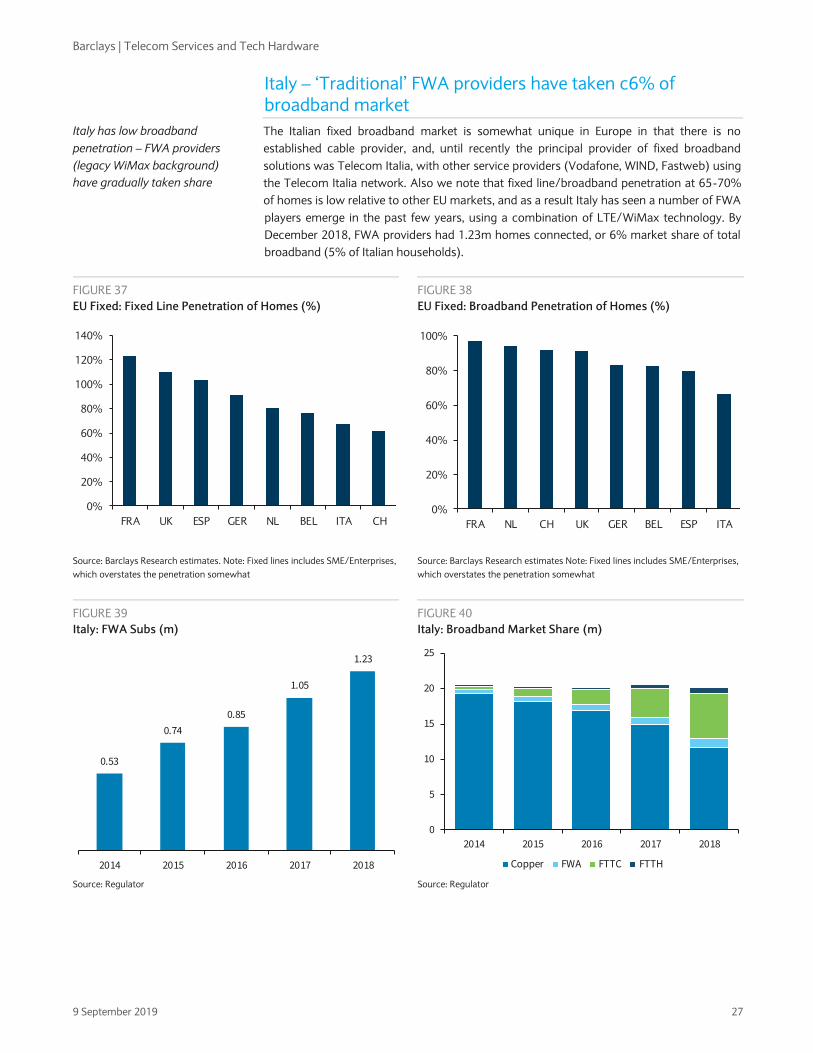
Barclays | Telecom Services and Tech Hardware
9 September 2019 27
Italy – ‘Traditional’ FWA providers have taken c6% of broadband market
The Italian fixed broadband market is somewhat unique in Europe in that there is no
established cable provider, and, until recently the principal provider of fixed broadband
solutions was Telecom Italia, with other service providers (Vodafone, WIND, Fastweb) using
the Telecom Italia network. Also we note that fixed line/broadband penetration at 65-70%
of homes is low relative to other EU markets, and as a result Italy has seen a number of FWA
players emerge in the past few years, using a combination of LTE/WiMax technology. By
December 2018, FWA providers had 1.23m homes connected, or 6% market share of total
broadband (5% of Italian households).
FIGURE 37
EU Fixed: Fixed Line Penetration of Homes (%)
FIGURE 38
EU Fixed: Broadband Penetration of Homes (%)
Source: Barclays Research estimates. Note: Fixed lines includes SME/Enterprises,
which overstates the penetration somewhat
Source: Barclays Research estimates Note: Fixed lines includes SME/Enterprises,
which overstates the penetration somewhat
FIGURE 39
Italy: FWA Subs (m)
FIGURE 40
Italy: Broadband Market Share (m)
Source: Regulator Source: Regulator
0%
20%
40%
60%
80%
100%
120%
140%
FRA UK ESP GER NL BEL ITA CH0%
20%
40%
60%
80%
100%
FRA NL CH UK GER BEL ESP ITA
0.53
0.74
0.85
1.05
1.23
2014 2015 2016 2017 2018
0
5
10
15
20
25
2014 2015 2016 2017 2018
Copper FWA FTTC FTTH
Italy has low broadband
penetration – FWA providers
(legacy WiMax background)
have gradually taken share
Barclays | Telecom Services and Tech Hardware
9 September 2019 28
Case Study – Linkem
Linkem is a privately owned FWA provider in Italy (Blackrock/Cowen/Jefferies), founded in
2001, with a legacy in public WiFi hotspots. The company has 84MHz spectrum in the 3.4-
3.6GHz band where it offers FWA services using LTE (historically had used WiMax). The
company had covered 45% of Italian households at the end of 2015, and 70% at the end of
2018. Linkem achieved revenues of €122m in 2018, and €26m EBITDA, with c600k
subscribers.
The company prices unlimited voice/data at €22-25/mth (depending on contract length),
with a maximum 30mbps download/3mbps upload connection speed. The company
estimates average speeds for private customers are 17.4mbps downlink and 2mbps uplink,
with business customers able to get up to 50mbps.
Separately, Linkem owns 21% of listed ‘Go Internet’ (c€30m market capitalisation), with
€7m Dec 18 revenues and €3m EBITDA, and 43k subs as at Feb 18. Go Internet covers
c12% of the population in the Emilia Romagna and Marche regions, and offers FWA
solutions using LTE (shares Linkem 3.5GHz spectrum) and WiMax. Go Internet offers
30mbps for €17/month (unlimited data, no voice), and 7mbps data for €10/month.
Case Study – Eolo
Eolo is another privately owned FWA operator in Italy (Searchlight/others). Eolo covers 14
Italian regions, and claims >95% population coverage in North Italy, >70% in Mid Italy, with
limited coverage in the South. The company strategy is to target residential/business users
in suburban/rural areas, using the unlicensed 5.4GHz band and licenced 28GHz band (Eolo
owns 112MHz of 28GHz spectrum). Eolo used WiMax technology with MIMO, although
now uses a proprietary TDMA/MIMO solution (EOLOwave), and requires an antenna to be
installed at the customer premises.
The company prices unlimited voice/data at €25-30/mth (depending on contract length,
router extra), with a maximum 30mbps download/3mbps upload connection speed. A
100/10Mbps service is available for €30-40/month (plus router). Eolo achieved revenues of
€125m for the year to March 2019, up from €100m in FY18 and €75m in FY17, with >300k
subscribers.
Case Study – Fastweb
Fastweb acquired the FWA business of Tiscali in November 2018 for €198m. This included
40MHz of 3.5GHz spectrum, and had c50k customers at Dec 17 and 836 radio sites.
Fastweb subsequently acquired 26MHz of 3.4GHz spectrum in the recent Italy 5G auction.
Fastweb covers 2m HH with FWA (and 8m FTTx), using LTE technology (base has
progressively been migrated from WiMax). Fastweb offers 100mbps data for €20/month.
Linkem – LTE-based FWA
solution
Eolo – High frequency WiMax-
style FWA solution
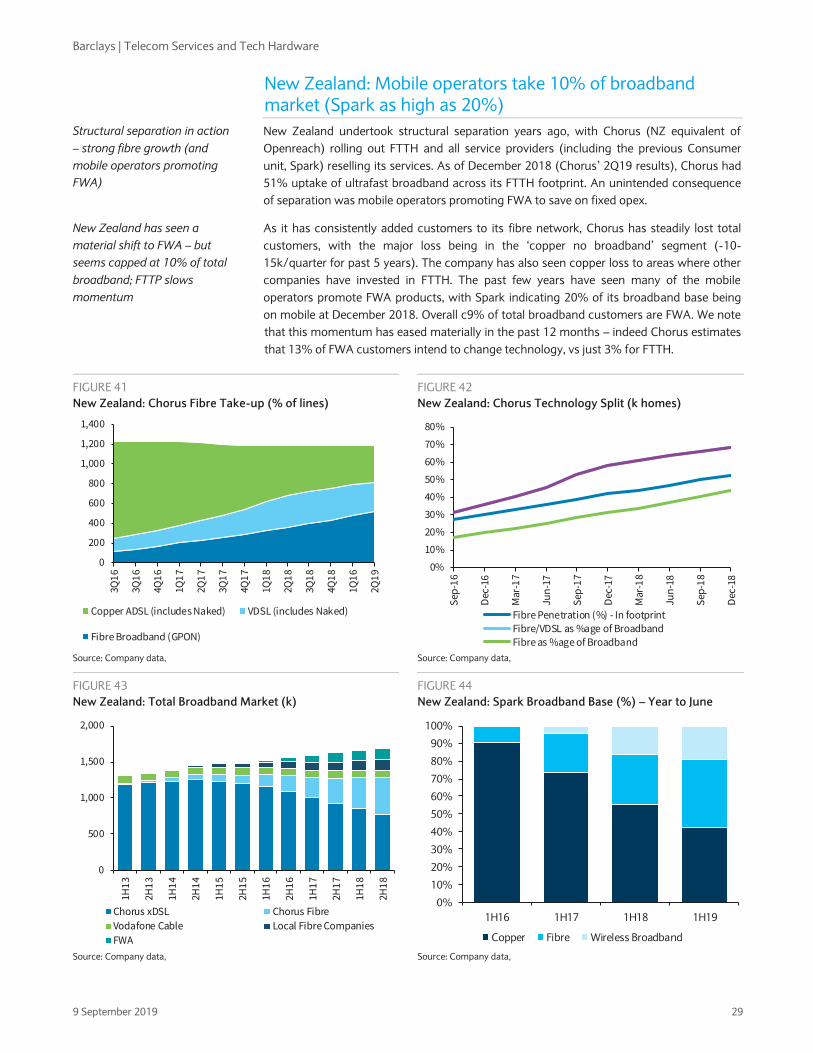
Barclays | Telecom Services and Tech Hardware
9 September 2019 29
New Zealand: Mobile operators take 10% of broadband market (Spark as high as 20%)
New Zealand undertook structural separation years ago, with Chorus (NZ equivalent of
Openreach) rolling out FTTH and all service providers (including the previous Consumer
unit, Spark) reselling its services. As of December 2018 (Chorus’ 2Q19 results), Chorus had
51% uptake of ultrafast broadband across its FTTH footprint. An unintended consequence
of separation was mobile operators promoting FWA to save on fixed opex.
As it has consistently added customers to its fibre network, Chorus has steadily lost total
customers, with the major loss being in the ‘copper no broadband’ segment (-10-
15k/quarter for past 5 years). The company has also seen copper loss to areas where other
companies have invested in FTTH. The past few years have seen many of the mobile
operators promote FWA products, with Spark indicating 20% of its broadband base being
on mobile at December 2018. Overall c9% of total broadband customers are FWA. We note
that this momentum has eased materially in the past 12 months – indeed Chorus estimates
that 13% of FWA customers intend to change technology, vs just 3% for FTTH.
FIGURE 41
New Zealand: Chorus Fibre Take-up (% of lines)
FIGURE 42
New Zealand: Chorus Technology Split (k homes)
Source: Company data, Source: Company data,
FIGURE 43
New Zealand: Total Broadband Market (k)
FIGURE 44
New Zealand: Spark Broadband Base (%) – Year to June
Source: Company data, Source: Company data,
0
200
400
600
800
1,000
1,200
1,400
3Q1
6
3Q1
6
4Q1
6
1Q1
7
2Q1
7
3Q1
7
4Q1
7
1Q1
8
2Q1
8
3Q1
8
4Q1
8
1Q1
6
2Q1
9
Copper ADSL (includes Naked) VDSL (includes Naked)
Fibre Broadband (GPON)
0%
10%
20%
30%
40%
50%
60%
70%
80%
Sep
-16
Dec
-16
Mar
-17
Jun
-17
Sep
-17
Dec
-17
Mar
-18
Jun
-18
Sep
-18
Dec
-18
Fibre Penetration (%) - In footprintFibre/VDSL as %age of BroadbandFibre as %age of Broadband
0
500
1,000
1,500
2,000
1H1
3
2H1
3
1H1
4
2H1
4
1H1
5
2H1
5
1H1
6
2H1
6
1H1
7
2H1
7
1H1
8
2H1
8
Chorus xDSL Chorus Fibre
Vodafone Cable Local Fibre Companies
FWA
0%
10%
20%
30%
40%
50%
60%
70%
80%
90%
100%
1H16 1H17 1H18 1H19
Copper Fibre Wireless Broadband
Structural separation in action
– strong fibre growth (and
mobile operators promoting
FWA)
New Zealand has seen a
material shift to FWA – but
seems capped at 10% of total
broadband; FTTP slows
momentum
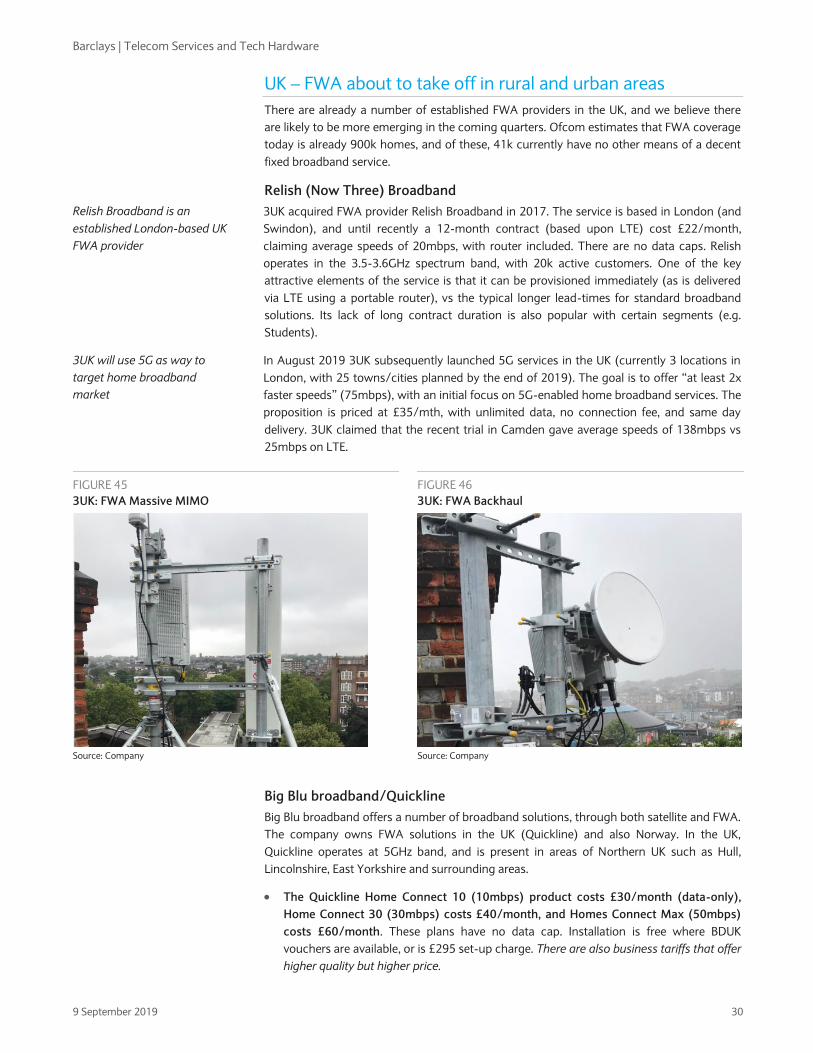
Barclays | Telecom Services and Tech Hardware
9 September 2019 30
UK – FWA about to take off in rural and urban areas
There are already a number of established FWA providers in the UK, and we believe there
are likely to be more emerging in the coming quarters. Ofcom estimates that FWA coverage
today is already 900k homes, and of these, 41k currently have no other means of a decent
fixed broadband service.
Relish (Now Three) Broadband
3UK acquired FWA provider Relish Broadband in 2017. The service is based in London (and
Swindon), and until recently a 12-month contract (based upon LTE) cost £22/month,
claiming average speeds of 20mbps, with router included. There are no data caps. Relish
operates in the 3.5-3.6GHz spectrum band, with 20k active customers. One of the key
attractive elements of the service is that it can be provisioned immediately (as is delivered
via LTE using a portable router), vs the typical longer lead-times for standard broadband
solutions. Its lack of long contract duration is also popular with certain segments (e.g.
Students).
In August 2019 3UK subsequently launched 5G services in the UK (currently 3 locations in
London, with 25 towns/cities planned by the end of 2019). The goal is to offer “at least 2x
faster speeds” (75mbps), with an initial focus on 5G-enabled home broadband services. The
proposition is priced at £35/mth, with unlimited data, no connection fee, and same day
delivery. 3UK claimed that the recent trial in Camden gave average speeds of 138mbps vs
25mbps on LTE.
FIGURE 45
3UK: FWA Massive MIMO
FIGURE 46
3UK: FWA Backhaul
Source: Company Source: Company
Big Blu broadband/Quickline
Big Blu broadband offers a number of broadband solutions, through both satellite and FWA.
The company owns FWA solutions in the UK (Quickline) and also Norway. In the UK,
Quickline operates at 5GHz band, and is present in areas of Northern UK such as Hull,
Lincolnshire, East Yorkshire and surrounding areas.
The Quickline Home Connect 10 (10mbps) product costs £30/month (data-only),
Home Connect 30 (30mbps) costs £40/month, and Homes Connect Max (50mbps)
costs £60/month. These plans have no data cap. Installation is free where BDUK
vouchers are available, or is £295 set-up charge. There are also business tariffs that offer
higher quality but higher price.
Relish Broadband is an
established London-based UK
FWA provider
3UK will use 5G as way to
target home broadband
market
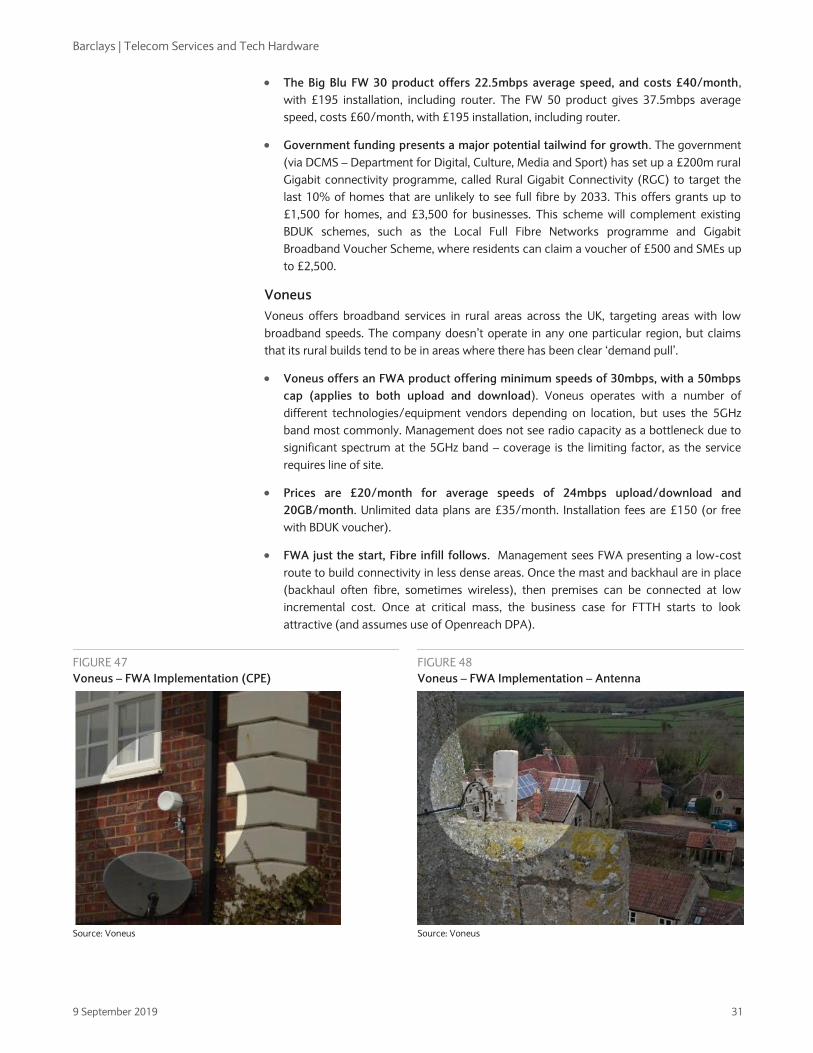
Barclays | Telecom Services and Tech Hardware
9 September 2019 31
The Big Blu FW 30 product offers 22.5mbps average speed, and costs £40/month,
with £195 installation, including router. The FW 50 product gives 37.5mbps average
speed, costs £60/month, with £195 installation, including router.
Government funding presents a major potential tailwind for growth. The government
(via DCMS – Department for Digital, Culture, Media and Sport) has set up a £200m rural
Gigabit connectivity programme, called Rural Gigabit Connectivity (RGC) to target the
last 10% of homes that are unlikely to see full fibre by 2033. This offers grants up to
£1,500 for homes, and £3,500 for businesses. This scheme will complement existing
BDUK schemes, such as the Local Full Fibre Networks programme and Gigabit
Broadband Voucher Scheme, where residents can claim a voucher of £500 and SMEs up
to £2,500.
Voneus
Voneus offers broadband services in rural areas across the UK, targeting areas with low
broadband speeds. The company doesn’t operate in any one particular region, but claims
that its rural builds tend to be in areas where there has been clear ‘demand pull’.
Voneus offers an FWA product offering minimum speeds of 30mbps, with a 50mbps
cap (applies to both upload and download). Voneus operates with a number of
different technologies/equipment vendors depending on location, but uses the 5GHz
band most commonly. Management does not see radio capacity as a bottleneck due to
significant spectrum at the 5GHz band – coverage is the limiting factor, as the service
requires line of site.
Prices are £20/month for average speeds of 24mbps upload/download and
20GB/month. Unlimited data plans are £35/month. Installation fees are £150 (or free
with BDUK voucher).
FWA just the start, Fibre infill follows. Management sees FWA presenting a low-cost
route to build connectivity in less dense areas. Once the mast and backhaul are in place
(backhaul often fibre, sometimes wireless), then premises can be connected at low
incremental cost. Once at critical mass, the business case for FTTH starts to look
attractive (and assumes use of Openreach DPA).
FIGURE 47
Voneus – FWA Implementation (CPE)
FIGURE 48
Voneus – FWA Implementation – Antenna
Source: Voneus Source: Voneus
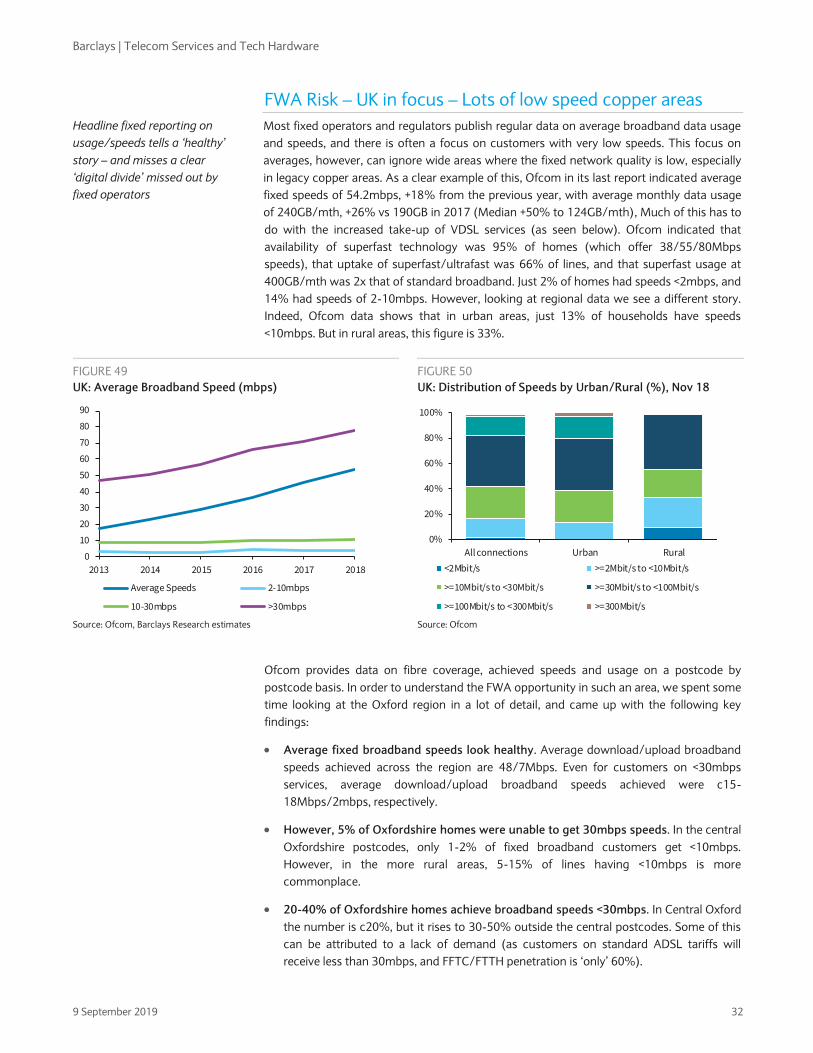
Barclays | Telecom Services and Tech Hardware
9 September 2019 32
FWA Risk – UK in focus – Lots of low speed copper areas
Most fixed operators and regulators publish regular data on average broadband data usage
and speeds, and there is often a focus on customers with very low speeds. This focus on
averages, however, can ignore wide areas where the fixed network quality is low, especially
in legacy copper areas. As a clear example of this, Ofcom in its last report indicated average
fixed speeds of 54.2mbps, +18% from the previous year, with average monthly data usage
of 240GB/mth, +26% vs 190GB in 2017 (Median +50% to 124GB/mth), Much of this has to
do with the increased take-up of VDSL services (as seen below). Ofcom indicated that
availability of superfast technology was 95% of homes (which offer 38/55/80Mbps
speeds), that uptake of superfast/ultrafast was 66% of lines, and that superfast usage at
400GB/mth was 2x that of standard broadband. Just 2% of homes had speeds <2mbps, and
14% had speeds of 2-10mbps. However, looking at regional data we see a different story.
Indeed, Ofcom data shows that in urban areas, just 13% of households have speeds
<10mbps. But in rural areas, this figure is 33%.
FIGURE 49
UK: Average Broadband Speed (mbps)
FIGURE 50
UK: Distribution of Speeds by Urban/Rural (%), Nov 18
Source: Ofcom, Barclays Research estimates Source: Ofcom
Ofcom provides data on fibre coverage, achieved speeds and usage on a postcode by
postcode basis. In order to understand the FWA opportunity in such an area, we spent some
time looking at the Oxford region in a lot of detail, and came up with the following key
findings:
Average fixed broadband speeds look healthy. Average download/upload broadband
speeds achieved across the region are 48/7Mbps. Even for customers on <30mbps
services, average download/upload broadband speeds achieved were c15-
18Mbps/2mbps, respectively.
However, 5% of Oxfordshire homes were unable to get 30mbps speeds. In the central
Oxfordshire postcodes, only 1-2% of fixed broadband customers get <10mbps.
However, in the more rural areas, 5-15% of lines having <10mbps is more
commonplace.
20-40% of Oxfordshire homes achieve broadband speeds <30mbps. In Central Oxford
the number is c20%, but it rises to 30-50% outside the central postcodes. Some of this
can be attributed to a lack of demand (as customers on standard ADSL tariffs will
receive less than 30mbps, and FFTC/FTTH penetration is ‘only’ 60%).
0
10
20
30
40
50
60
70
80
90
2013 2014 2015 2016 2017 2018
Average Speeds 2-10mbps
10-30mbps >30mbps
0%
20%
40%
60%
80%
100%
All connections Urban Rural
<2Mbit/s >=2Mbit/s to <10Mbit/s
>=10Mbit/s to <30Mbit/s >=30Mbit/s to <100Mbit/s
>=100Mbit/s to <300Mbit/s >=300Mbit/s
Headline fixed reporting on
usage/speeds tells a ‘healthy’
story – and misses a clear
‘digital divide’ missed out by
fixed operators
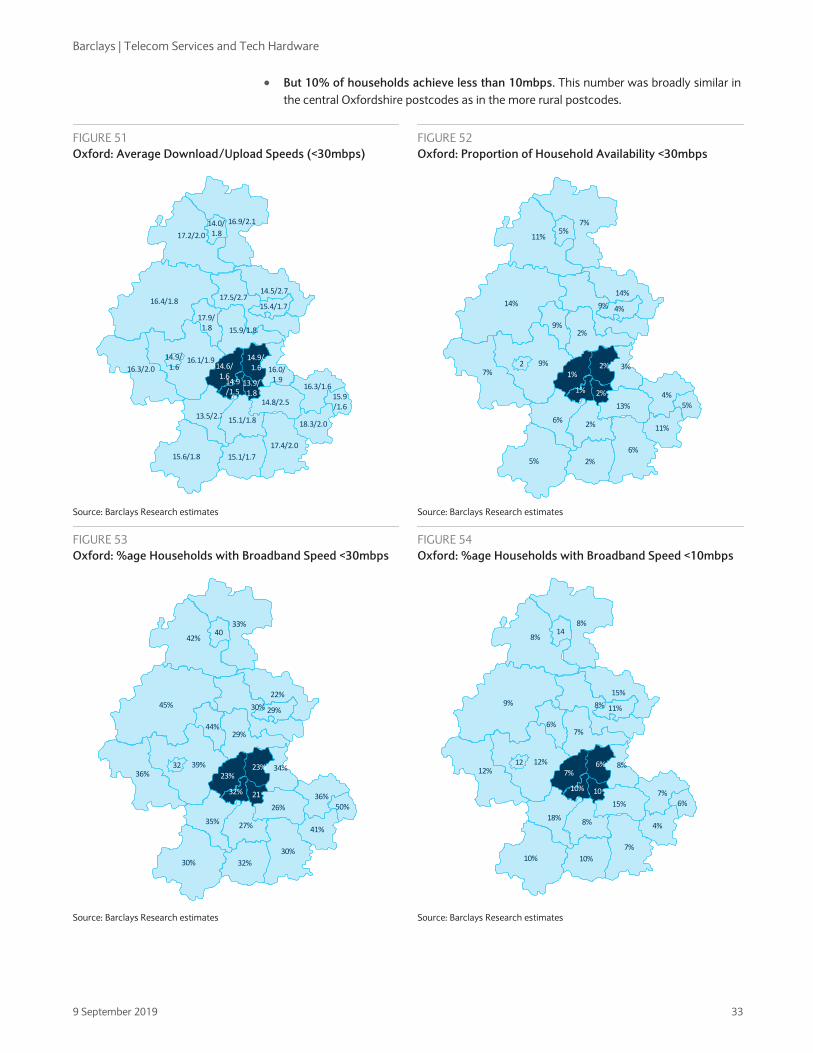
Barclays | Telecom Services and Tech Hardware
9 September 2019 33
But 10% of households achieve less than 10mbps. This number was broadly similar in
the central Oxfordshire postcodes as in the more rural postcodes.
FIGURE 51
Oxford: Average Download/Upload Speeds (<30mbps)
FIGURE 52
Oxford: Proportion of Household Availability <30mbps
Source: Barclays Research estimates Source: Barclays Research estimates
FIGURE 53
Oxford: %age Households with Broadband Speed <30mbps
FIGURE 54
Oxford: %age Households with Broadband Speed <10mbps
Source: Barclays Research estimates Source: Barclays Research estimates
16.9/2.1
17.2/2.0
15.4/1.7
14.5/2.717.5/2.7
17.9/1.8 15.9/1.8
16.4/1.8
16.1/1.916.3/2.0 16.0/
1.9
14.9/1.614.6/
1.614.9/1.5
14.8/2.5
16.3/1.615.9/1.6
18.3/2.013.5/2.2 15.1/1.8
17.4/2.0
15.1/1.715.6/1.8
14.9/1.6
14.0/1.8
13.9/1.8
7%5%
11%
4%
14%
9%
9%2%
14%
9%27%
3%2%1%
1% 2%
13%
4%5%
11%6%
2%
6%
2%5%
33%40
42%
29%
22%
30%
44%29%
45%
39%3236%
34%23%23%
32% 21
26%
36%50%
41%35% 27%
30%
32%30%
8%14
8%
11%
15%
8%
6%7%
9%
12%1212%
8%6%7%
10% 10
15%
7%6%
4%18% 8%
7%
10%10%
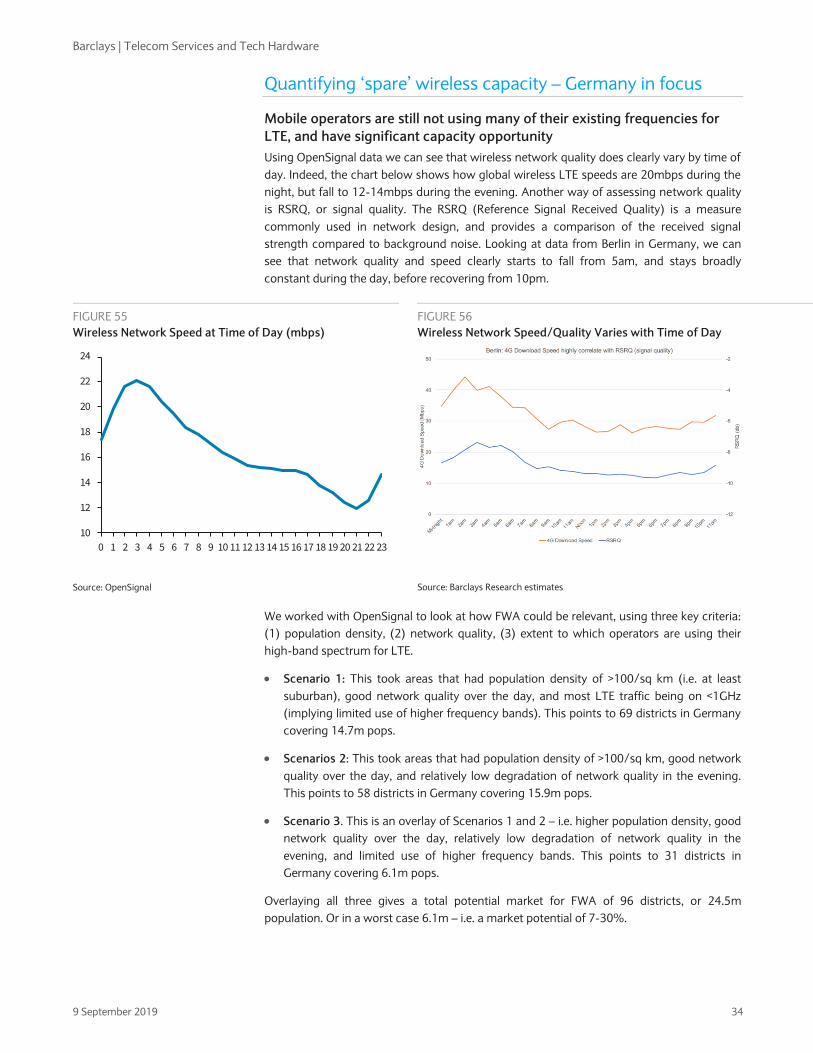
Barclays | Telecom Services and Tech Hardware
9 September 2019 34
Quantifying ‘spare’ wireless capacity – Germany in focus
Mobile operators are still not using many of their existing frequencies for
LTE, and have significant capacity opportunity
Using OpenSignal data we can see that wireless network quality does clearly vary by time of
day. Indeed, the chart below shows how global wireless LTE speeds are 20mbps during the
night, but fall to 12-14mbps during the evening. Another way of assessing network quality
is RSRQ, or signal quality. The RSRQ (Reference Signal Received Quality) is a measure
commonly used in network design, and provides a comparison of the received signal
strength compared to background noise. Looking at data from Berlin in Germany, we can
see that network quality and speed clearly starts to fall from 5am, and stays broadly
constant during the day, before recovering from 10pm.
FIGURE 55
Wireless Network Speed at Time of Day (mbps)
FIGURE 56
Wireless Network Speed/Quality Varies with Time of Day
Source: OpenSignal Source: Barclays Research estimates
We worked with OpenSignal to look at how FWA could be relevant, using three key criteria:
(1) population density, (2) network quality, (3) extent to which operators are using their
high-band spectrum for LTE.
Scenario 1: This took areas that had population density of >100/sq km (i.e. at least
suburban), good network quality over the day, and most LTE traffic being on <1GHz
(implying limited use of higher frequency bands). This points to 69 districts in Germany
covering 14.7m pops.
Scenarios 2: This took areas that had population density of >100/sq km, good network
quality over the day, and relatively low degradation of network quality in the evening.
This points to 58 districts in Germany covering 15.9m pops.
Scenario 3. This is an overlay of Scenarios 1 and 2 – i.e. higher population density, good
network quality over the day, relatively low degradation of network quality in the
evening, and limited use of higher frequency bands. This points to 31 districts in
Germany covering 6.1m pops.
Overlaying all three gives a total potential market for FWA of 96 districts, or 24.5m
population. Or in a worst case 6.1m – i.e. a market potential of 7-30%.
10
12
14
16
18
20
22
24
0 1 2 3 4 5 6 7 8 9 10 11 12 13 14 15 16 17 18 19 20 21 22 23
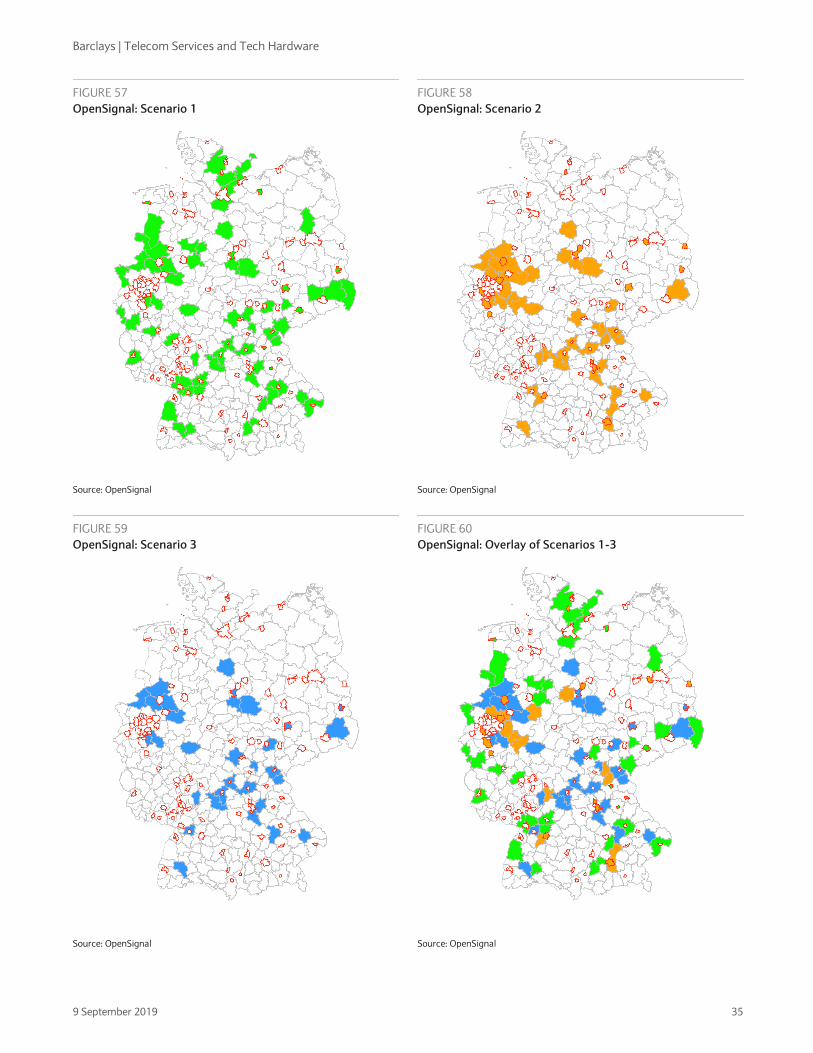
Barclays | Telecom Services and Tech Hardware
9 September 2019 35
FIGURE 57
OpenSignal: Scenario 1
FIGURE 58
OpenSignal: Scenario 2
Source: OpenSignal Source: OpenSignal
FIGURE 59
OpenSignal: Scenario 3
FIGURE 60
OpenSignal: Overlay of Scenarios 1-3
Source: OpenSignal Source: OpenSignal
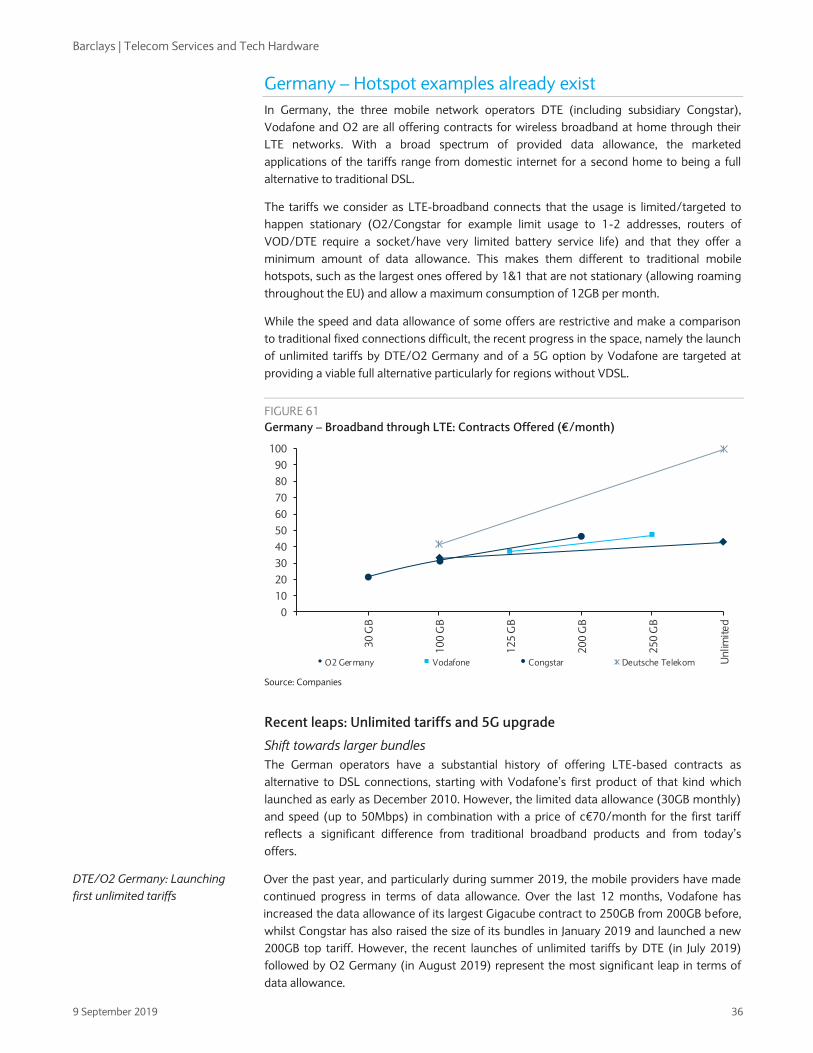
Barclays | Telecom Services and Tech Hardware
9 September 2019 36
Germany – Hotspot examples already exist
In Germany, the three mobile network operators DTE (including subsidiary Congstar),
Vodafone and O2 are all offering contracts for wireless broadband at home through their
LTE networks. With a broad spectrum of provided data allowance, the marketed
applications of the tariffs range from domestic internet for a second home to being a full
alternative to traditional DSL.
The tariffs we consider as LTE-broadband connects that the usage is limited/targeted to
happen stationary (O2/Congstar for example limit usage to 1-2 addresses, routers of
VOD/DTE require a socket/have very limited battery service life) and that they offer a
minimum amount of data allowance. This makes them different to traditional mobile
hotspots, such as the largest ones offered by 1&1 that are not stationary (allowing roaming
throughout the EU) and allow a maximum consumption of 12GB per month.
While the speed and data allowance of some offers are restrictive and make a comparison
to traditional fixed connections difficult, the recent progress in the space, namely the launch
of unlimited tariffs by DTE/O2 Germany and of a 5G option by Vodafone are targeted at
providing a viable full alternative particularly for regions without VDSL.
FIGURE 61
Germany – Broadband through LTE: Contracts Offered (€/month)
Source: Companies
Recent leaps: Unlimited tariffs and 5G upgrade
Shift towards larger bundles
The German operators have a substantial history of offering LTE-based contracts as
alternative to DSL connections, starting with Vodafone’s first product of that kind which
launched as early as December 2010. However, the limited data allowance (30GB monthly)
and speed (up to 50Mbps) in combination with a price of c€70/month for the first tariff
reflects a significant difference from traditional broadband products and from today’s
offers.
Over the past year, and particularly during summer 2019, the mobile providers have made
continued progress in terms of data allowance. Over the last 12 months, Vodafone has
increased the data allowance of its largest Gigacube contract to 250GB from 200GB before,
whilst Congstar has also raised the size of its bundles in January 2019 and launched a new
200GB top tariff. However, the recent launches of unlimited tariffs by DTE (in July 2019)
followed by O2 Germany (in August 2019) represent the most significant leap in terms of
data allowance.
0
10
20
30
40
50
60
70
80
90
100
30
GB
10
0 G
B
12
5 G
B
20
0 G
B
25
0 G
B
Un
limit
ed
O2 Germany Vodafone Congstar Deutsche Telekom
DTE/O2 Germany: Launching
first unlimited tariffs
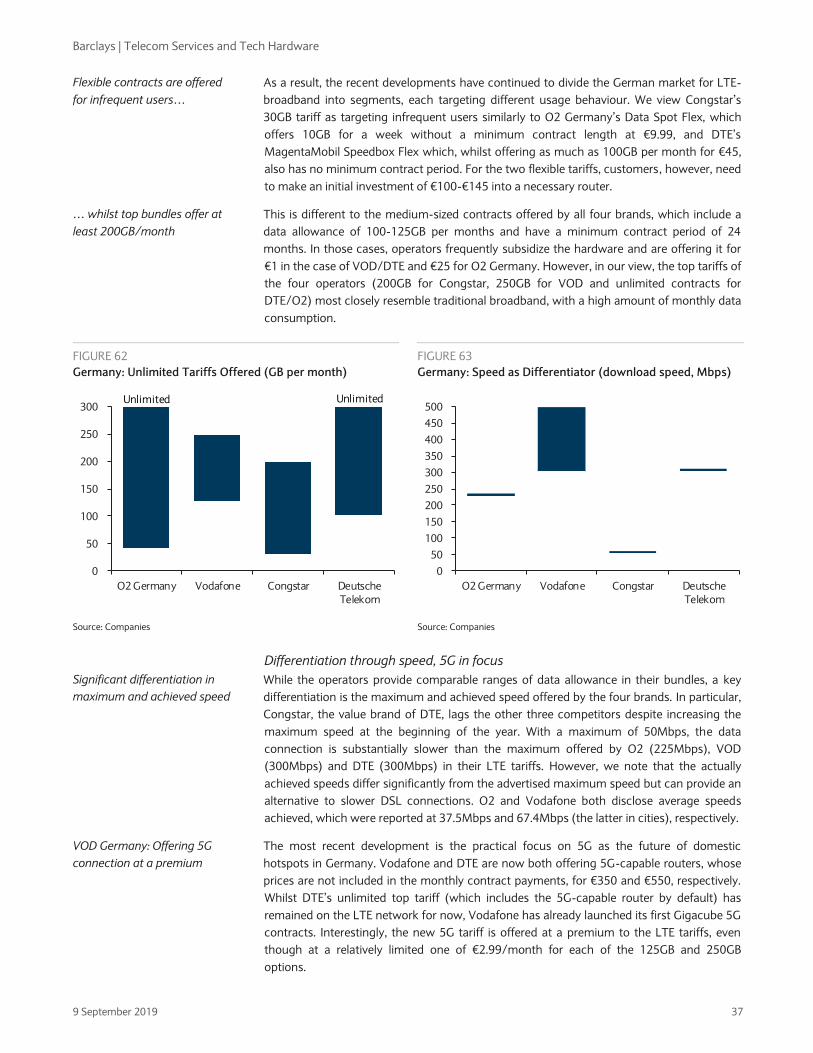
Barclays | Telecom Services and Tech Hardware
9 September 2019 37
As a result, the recent developments have continued to divide the German market for LTE-
broadband into segments, each targeting different usage behaviour. We view Congstar’s
30GB tariff as targeting infrequent users similarly to O2 Germany’s Data Spot Flex, which
offers 10GB for a week without a minimum contract length at €9.99, and DTE’s
MagentaMobil Speedbox Flex which, whilst offering as much as 100GB per month for €45,
also has no minimum contract period. For the two flexible tariffs, customers, however, need
to make an initial investment of €100-€145 into a necessary router.
This is different to the medium-sized contracts offered by all four brands, which include a
data allowance of 100-125GB per months and have a minimum contract period of 24
months. In those cases, operators frequently subsidize the hardware and are offering it for
€1 in the case of VOD/DTE and €25 for O2 Germany. However, in our view, the top tariffs of
the four operators (200GB for Congstar, 250GB for VOD and unlimited contracts for
DTE/O2) most closely resemble traditional broadband, with a high amount of monthly data
consumption.
FIGURE 62
Germany: Unlimited Tariffs Offered (GB per month)
FIGURE 63
Germany: Speed as Differentiator (download speed, Mbps)
Source: Companies Source: Companies
Differentiation through speed, 5G in focus
While the operators provide comparable ranges of data allowance in their bundles, a key
differentiation is the maximum and achieved speed offered by the four brands. In particular,
Congstar, the value brand of DTE, lags the other three competitors despite increasing the
maximum speed at the beginning of the year. With a maximum of 50Mbps, the data
connection is substantially slower than the maximum offered by O2 (225Mbps), VOD
(300Mbps) and DTE (300Mbps) in their LTE tariffs. However, we note that the actually
achieved speeds differ significantly from the advertised maximum speed but can provide an
alternative to slower DSL connections. O2 and Vodafone both disclose average speeds
achieved, which were reported at 37.5Mbps and 67.4Mbps (the latter in cities), respectively.
The most recent development is the practical focus on 5G as the future of domestic
hotspots in Germany. Vodafone and DTE are now both offering 5G-capable routers, whose
prices are not included in the monthly contract payments, for €350 and €550, respectively.
Whilst DTE’s unlimited top tariff (which includes the 5G-capable router by default) has
remained on the LTE network for now, Vodafone has already launched its first Gigacube 5G
contracts. Interestingly, the new 5G tariff is offered at a premium to the LTE tariffs, even
though at a relatively limited one of €2.99/month for each of the 125GB and 250GB
options.
0
50
100
150
200
250
300
O2 Germany Vodafone Congstar Deutsche
Telekom
Unlimited Unlimited
0
50
100
150
200
250
300
350
400
450
500
O2 Germany Vodafone Congstar Deutsche
Telekom
Flexible contracts are offered
for infrequent users…
… whilst top bundles offer at
least 200GB/month
Significant differentiation in
maximum and achieved speed
VOD Germany: Offering 5G
connection at a premium
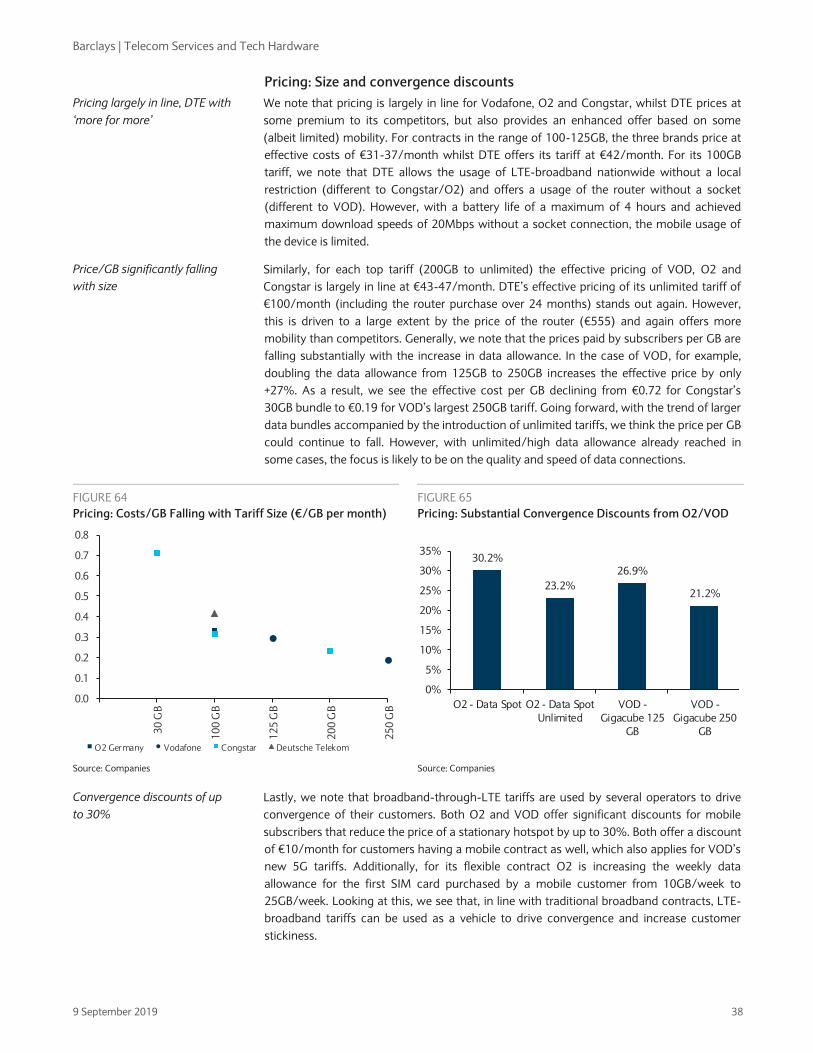
Barclays | Telecom Services and Tech Hardware
9 September 2019 38
Pricing: Size and convergence discounts
We note that pricing is largely in line for Vodafone, O2 and Congstar, whilst DTE prices at
some premium to its competitors, but also provides an enhanced offer based on some
(albeit limited) mobility. For contracts in the range of 100-125GB, the three brands price at
effective costs of €31-37/month whilst DTE offers its tariff at €42/month. For its 100GB
tariff, we note that DTE allows the usage of LTE-broadband nationwide without a local
restriction (different to Congstar/O2) and offers a usage of the router without a socket
(different to VOD). However, with a battery life of a maximum of 4 hours and achieved
maximum download speeds of 20Mbps without a socket connection, the mobile usage of
the device is limited.
Similarly, for each top tariff (200GB to unlimited) the effective pricing of VOD, O2 and
Congstar is largely in line at €43-47/month. DTE’s effective pricing of its unlimited tariff of
€100/month (including the router purchase over 24 months) stands out again. However,
this is driven to a large extent by the price of the router (€555) and again offers more
mobility than competitors. Generally, we note that the prices paid by subscribers per GB are
falling substantially with the increase in data allowance. In the case of VOD, for example,
doubling the data allowance from 125GB to 250GB increases the effective price by only
+27%. As a result, we see the effective cost per GB declining from €0.72 for Congstar’s
30GB bundle to €0.19 for VOD’s largest 250GB tariff. Going forward, with the trend of larger
data bundles accompanied by the introduction of unlimited tariffs, we think the price per GB
could continue to fall. However, with unlimited/high data allowance already reached in
some cases, the focus is likely to be on the quality and speed of data connections.
FIGURE 64
Pricing: Costs/GB Falling with Tariff Size (€/GB per month)
FIGURE 65
Pricing: Substantial Convergence Discounts from O2/VOD
Source: Companies Source: Companies
Lastly, we note that broadband-through-LTE tariffs are used by several operators to drive
convergence of their customers. Both O2 and VOD offer significant discounts for mobile
subscribers that reduce the price of a stationary hotspot by up to 30%. Both offer a discount
of €10/month for customers having a mobile contract as well, which also applies for VOD’s
new 5G tariffs. Additionally, for its flexible contract O2 is increasing the weekly data
allowance for the first SIM card purchased by a mobile customer from 10GB/week to
25GB/week. Looking at this, we see that, in line with traditional broadband contracts, LTE-
broadband tariffs can be used as a vehicle to drive convergence and increase customer
stickiness.
0.0
0.1
0.2
0.3
0.4
0.5
0.6
0.7
0.8
30
GB
10
0 G
B
12
5 G
B
20
0 G
B
25
0 G
B
O2 Germany Vodafone Congstar Deutsche Telekom
30.2%
23.2%
26.9%
21.2%
0%
5%
10%
15%
20%
25%
30%
35%
O2 - Data Spot O2 - Data Spot
Unlimited
VOD -
Gigacube 125
GB
VOD -
Gigacube 250
GB
Pricing largely in line, DTE with
‘more for more’
Price/GB significantly falling
with size
Convergence discounts of up
to 30%
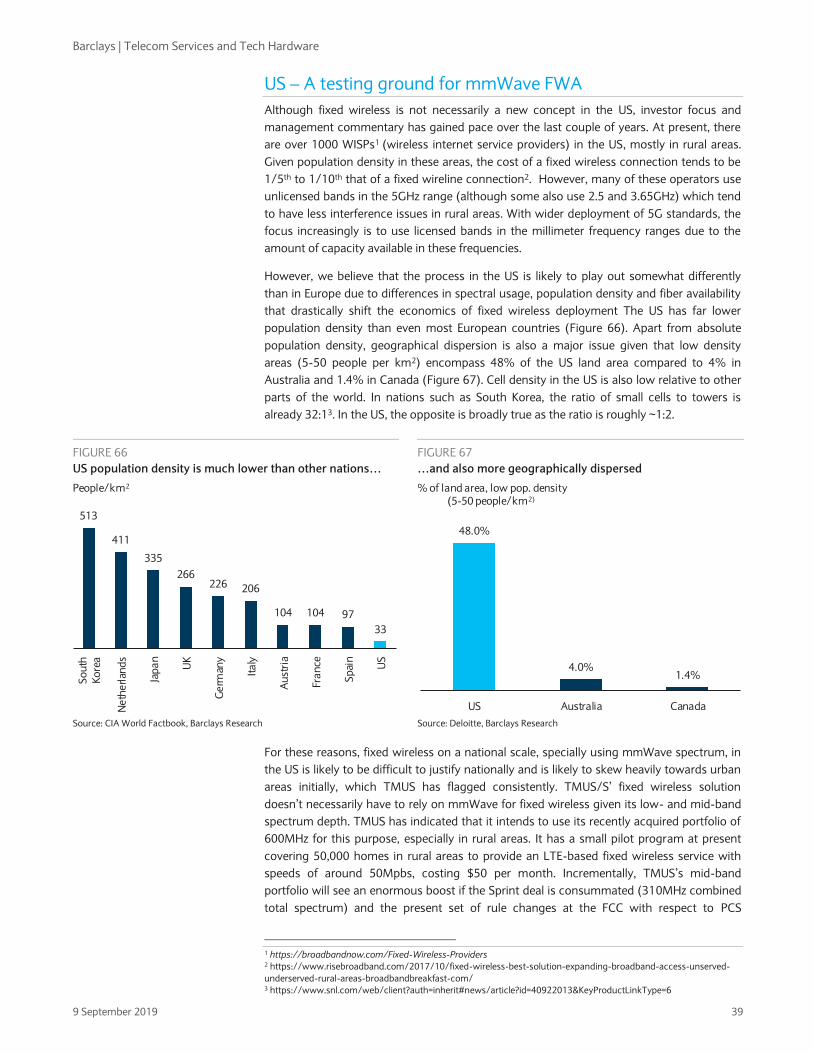
Barclays | Telecom Services and Tech Hardware
9 September 2019 39
US – A testing ground for mmWave FWA
Although fixed wireless is not necessarily a new concept in the US, investor focus and
management commentary has gained pace over the last couple of years. At present, there
are over 1000 WISPs1 (wireless internet service providers) in the US, mostly in rural areas.
Given population density in these areas, the cost of a fixed wireless connection tends to be
1/5th to 1/10th that of a fixed wireline connection2. However, many of these operators use
unlicensed bands in the 5GHz range (although some also use 2.5 and 3.65GHz) which tend
to have less interference issues in rural areas. With wider deployment of 5G standards, the
focus increasingly is to use licensed bands in the millimeter frequency ranges due to the
amount of capacity available in these frequencies.
However, we believe that the process in the US is likely to play out somewhat differently
than in Europe due to differences in spectral usage, population density and fiber availability
that drastically shift the economics of fixed wireless deployment The US has far lower
population density than even most European countries (Figure 66). Apart from absolute
population density, geographical dispersion is also a major issue given that low density
areas (5-50 people per km2) encompass 48% of the US land area compared to 4% in
Australia and 1.4% in Canada (Figure 67). Cell density in the US is also low relative to other
parts of the world. In nations such as South Korea, the ratio of small cells to towers is
already 32:13. In the US, the opposite is broadly true as the ratio is roughly ~1:2.
FIGURE 66
US population density is much lower than other nations…
FIGURE 67
…and also more geographically dispersed
Source: CIA World Factbook, Barclays Research Source: Deloitte, Barclays Research
For these reasons, fixed wireless on a national scale, specially using mmWave spectrum, in
the US is likely to be difficult to justify nationally and is likely to skew heavily towards urban
areas initially, which TMUS has flagged consistently. TMUS/S’ fixed wireless solution
doesn’t necessarily have to rely on mmWave for fixed wireless given its low- and mid-band
spectrum depth. TMUS has indicated that it intends to use its recently acquired portfolio of
600MHz for this purpose, especially in rural areas. It has a small pilot program at present
covering 50,000 homes in rural areas to provide an LTE-based fixed wireless service with
speeds of around 50Mpbs, costing $50 per month. Incrementally, TMUS’s mid-band
portfolio will see an enormous boost if the Sprint deal is consummated (310MHz combined
total spectrum) and the present set of rule changes at the FCC with respect to PCS
1 https://broadbandnow.com/Fixed-Wireless-Providers 2 https://www.risebroadband.com/2017/10/fixed-wireless-best-solution-expanding-broadband-access-unserved-
underserved-rural-areas-broadbandbreakfast-com/ 3 https://www.snl.com/web/client?auth=inherit#news/article?id=40922013&KeyProductLinkType=6
513
411
335
266226 206
104 104 97
33
So
uth
Ko
rea
Ne
the
rlan
ds
Jap
an
UK
Ge
rman
y
Ita
ly
Au
stri
a
Fra
nce
Sp
ain
US
People/km2
48.0%
4.0%1.4%
US Australia Canada
% of land area, low pop. density(5-50 people/km2)
Barclays | Telecom Services and Tech Hardware
9 September 2019 40
spectrum are finally implemented. Therefore, TMUS could be in the best position to
implement a FWA solution in the industry.
Verizon has built out 1,000 test sites in 4 locations using mmWave, but this uses non-
standard based equipment as of now and is oriented just to provide fixed wireless, contrary
to the long-term company goal of using the same equipment for fixed and mobile
connectivity. Verizon’s goal is to reach 30mm homes through fixed wireless in the next 5 to
8 years. AT&T has outlined its intention to be opportunistic around fixed wireless and look
at it on a case-by-case basis, but has also emphasised that it sees fixed wireless mainly as
an urban and suburban use case due to its economics. T already offers fixed wireless but
mostly in rural locations and has also tested non-standards-based fixed wireless solutions in
some markets (Waco, Texas for instance). AT&T, of course, is also in the process of building
out 14mm fibre homes, which is likely to make fixed wireless less of an immediate priority.
Beyond the main wireless operators, independent FWA providers are also focused on this
opportunity. The largest of these, Starry (private, not covered), has indicated that it has
been able to achieve <$5/home passed for the ~450k homes in its footprint, with ~25-30%
in MDUs. Growth has been slow in part because the company needs to work with each
building to ensure access to coax or fiber wiring in order to link the antenna on rooftops to
individual apartments, which may be owned by competitors. The company has plans to
expand this to ~8mm passings (vs. ~1.5mm at present) by the end of this year and more
than double that next year as it launches in more cities. The company’s goal is to ultimately
be at ~40-45mm homes passed including its recently acquired 24GHz spectrum portfolio.
At this scale, the service could start becoming a bigger consideration for investors, although
scaling the service will need Starry also to invest significant amounts in building out the
support organization beyond just the network. Recently there has also been news of Google
offering a 1Gbps, $70 per month FWA service in Austin, where the company already offers a
fibre-based broadband service. Google appears to be using spectrum in the 60-80GHz
range to offer the service. Google also offers fixed wireless in Chicago, Denver, Seattle and
San Francisco, but appears to have a small base of FWA customers thus far4. Google’s FWA
service is a result of the company’s acquisition of Webpass, a company that has been
providing FWA for some time, in 2016.
Overall, from a network perspective, despite the increase in investor focus on the topic,
FWA still appears to be in very early stages in the US. However, what is interesting to us is
the fact that, even without wide fixed wireless access, the number of homes with a wireless
only data connection in the US continues to grow. T-Mobile has stated that 12% of homes
in the US are mobile broadband-only, and this number continues to increase (please see Are
cable broadband growth concerns valid?, Jul 2, 2019 for details). Therefore, what could be
more impactful near term in the US could be the change in pricing dimensions for mobile
wireless. We believe that in a 5G world, mobile wireless pricing dimensions could shift from
volume to speed, which would make wireless much more comparable in service quality and
price to cable. This could be more disruptive near term to fixed broadband markets than
FWA.
4 https://www.lightreading.com/mobile/5g/yes-google-is-still-selling-fixed-wireless-but-no-its-not-doing-5g/d/d-
id/750717
Barclays | Telecom Services and Tech Hardware
9 September 2019 41
ANALYST(S) CERTIFICATION(S):
We, Maurice Patrick, Mathieu Robilliard, Simon Coles, CFA, Andrew M. Gardiner, CFA, Kannan Venkateshwar and Tim Long, hereby certify (1)
that the views expressed in this research report accurately reflect our personal views about any or all of the subject securities or issuers referred
to in this research report and (2) no part of our compensation was, is or will be directly or indirectly related to the specific recommendations or
views expressed in this research report.
IMPORTANT DISCLOSURES CONTINUED
Barclays Research is produced by the Investment Bank of Barclays Bank PLC and its affiliates (collectively and each individually, "Barclays"). All
authors contributing to this research report are Research Analysts unless otherwise indicated. The publication date at the top of the report
reflects the local time where the report was produced and may differ from the release date provided in GMT.
Availability of Disclosures:
Where any companies are the subject of this research report, for current important disclosures regarding those companies please refer to
https://publicresearch.barclays.com or alternatively send a written request to: Barclays Research Compliance, 745 Seventh Avenue, 13th Floor,
New York, NY 10019 or call +1-212-526-1072.
The analysts responsible for preparing this research report have received compensation based upon various factors including the firm's total
revenues, a portion of which is generated by investment banking activities, the profitability and revenues of the Markets business and the
potential interest of the firm's investing clients in research with respect to the asset class covered by the analyst.
Research analysts employed outside the US by affiliates of Barclays Capital Inc. are not registered/qualified as research analysts with FINRA. Such
non-US research analysts may not be associated persons of Barclays Capital Inc., which is a FINRA member, and therefore may not be subject to
FINRA Rule 2241 restrictions on communications with a subject company, public appearances and trading securities held by a research analyst’s
account.
Analysts regularly conduct site visits to view the material operations of covered companies, but Barclays policy prohibits them from accepting
payment or reimbursement by any covered company of their travel expenses for such visits.
Barclays Research Department produces various types of research including, but not limited to, fundamental analysis, equity-linked analysis,
quantitative analysis, and trade ideas. Recommendations contained in one type of Barclays Research may differ from those contained in other
types of Barclays Research, whether as a result of differing time horizons, methodologies, or otherwise.
In order to access Barclays Statement regarding Research Dissemination Policies and Procedures, please refer to
https://publicresearch.barcap.com/S/RD.htm. In order to access Barclays Research Conflict Management Policy Statement, please refer to:
https://publicresearch.barcap.com/S/CM.htm.
Materially Mentioned Stocks (Ticker, Date, Price)
Arista Networks, Inc. (ANET, 05-Sep-2019, USD 235.38), Overweight/Neutral, CE/J
Big Blu Broadband (BBB.L, 05-Sep-2019, GBp 107), Overweight/Positive, J
Ciena Corporation (CIEN, 05-Sep-2019, USD 39.62), Overweight/Neutral, CE/FA/J
Cisco Systems, Inc. (CSCO, 05-Sep-2019, USD 48.42), Equal Weight/Neutral, CD/CE/D/J/K/L/M/N
Corning Incorporated (GLW, 05-Sep-2019, USD 28.58), Overweight/Neutral, CD/CE/D/J/K/L/M
Drillisch (DRIG.DE, 05-Sep-2019, EUR 25.68), Overweight/Positive, J
Ericsson (ERICb.ST, 05-Sep-2019, SEK 76.94), Equal Weight/Neutral, CD/CE/D/J/K/L/M/N
F5 Networks, Inc. (FFIV, 05-Sep-2019, USD 131.27), Overweight/Neutral, CE/D/J/K/L/M/N
Juniper Networks, Inc. (JNPR, 05-Sep-2019, USD 23.87), Equal Weight/Neutral, A/CD/CE/D/E/J/K/L/M
Nokia (NOKIA.HE, 05-Sep-2019, EUR 4.49), Overweight/Neutral, CD/CE/D/E/J/K/L/M/N
Sunrise (SRCG.S, 05-Sep-2019, CHF 74.85), Equal Weight/Positive, J
Telefonica Deutschland (O2Dn.DE, 05-Sep-2019, EUR 2.34), Overweight/Positive, D/J/K/L/M/N
Ubiquiti Networks, Inc. (UBNT, 05-Sep-2019, USD 114.82), Underweight/Neutral, CE/J
Unless otherwise indicated, prices are sourced from Refinitiv and reflect the closing price in the relevant trading market, which may not be the last
available price at the time of publication.
Disclosure Legend:
A: Barclays Bank PLC and/or an affiliate has been lead manager or co-lead manager of a publicly disclosed offer of securities of the issuer in the
previous 12 months.
B: An employee or non-executive director of Barclays PLC is a director of this issuer.
CD: Barclays Bank PLC and/or an affiliate is a market-maker in debt securities issued by this issuer.
CE: Barclays Bank PLC and/or an affiliate is a market-maker in equity securities issued by this issuer.
D: Barclays Bank PLC and/or an affiliate has received compensation for investment banking services from this issuer in the past 12 months.
E: Barclays Bank PLC and/or an affiliate expects to receive or intends to seek compensation for investment banking services from this issuer
Barclays | Telecom Services and Tech Hardware
9 September 2019 42
IMPORTANT DISCLOSURES CONTINUED
within the next 3 months.
FA: Barclays Bank PLC and/or an affiliate beneficially owns 1% or more of a class of equity securities of this issuer, as calculated in accordance
with US regulations.
FB: Barclays Bank PLC and/or an affiliate beneficially owns a long position of more than 0.5% of a class of equity securities of this issuer, as
calculated in accordance with EU regulations.
FC: Barclays Bank PLC and/or an affiliate beneficially owns a short position of more than 0.5% of a class of equity securities of this issuer, as
calculated in accordance with EU regulations.
GD: One of the analysts on the fundamental credit coverage team (or a member of his or her household) has a financial interest in the debt or
equity securities of this issuer.
GE: One of the analysts on the fundamental equity coverage team (or a member of his or her household) has a financial interest in the debt or
equity securities of this issuer.
H: This issuer beneficially owns more than 5% of any class of common equity securities of Barclays PLC.
I: Barclays Bank PLC and/or an affiliate is party to an agreement with this issuer for the provision of financial services to Barclays Bank PLC and/or
an affiliate.
J: Barclays Bank PLC and/or an affiliate is a liquidity provider and/or trades regularly in the securities of this issuer and/or in any related
derivatives.
K: Barclays Bank PLC and/or an affiliate has received non-investment banking related compensation (including compensation for brokerage
services, if applicable) from this issuer within the past 12 months.
L: This issuer is, or during the past 12 months has been, an investment banking client of Barclays Bank PLC and/or an affiliate.
M: This issuer is, or during the past 12 months has been, a non-investment banking client (securities related services) of Barclays Bank PLC
and/or an affiliate.
N: This issuer is, or during the past 12 months has been, a non-investment banking client (non-securities related services) of Barclays Bank PLC
and/or an affiliate.
O: Not in use.
P: A partner, director or officer of Barclays Capital Canada Inc. has, during the preceding 12 months, provided services to the subject company for
remuneration, other than normal course investment advisory or trade execution services.
Q: Barclays Bank PLC and/or an affiliate is a Corporate Broker to this issuer.
R: Barclays Capital Canada Inc. and/or an affiliate has received compensation for investment banking services from this issuer in the past 12
months.
S: This issuer is a Corporate Broker to Barclays PLC.
T: Barclays Bank PLC and/or an affiliate is providing equity advisory services to this issuer.
U: The equity securities of this Canadian issuer include subordinate voting restricted shares.
V: The equity securities of this Canadian issuer include non-voting restricted shares.
Risk Disclosure(s)
Master limited partnerships (MLPs) are pass-through entities structured as publicly listed partnerships. For tax purposes, distributions to MLP
unit holders may be treated as a return of principal. Investors should consult their own tax advisors before investing in MLP units.
Guide to the Barclays Fundamental Equity Research Rating System:
Our coverage analysts use a relative rating system in which they rate stocks as Overweight, Equal Weight or Underweight (see definitions below)
relative to other companies covered by the analyst or a team of analysts that are deemed to be in the same industry (the "industry coverage
universe").
In addition to the stock rating, we provide industry views which rate the outlook for the industry coverage universe as Positive, Neutral or
Negative (see definitions below). A rating system using terms such as buy, hold and sell is not the equivalent of our rating system. Investors
should carefully read the entire research report including the definitions of all ratings and not infer its contents from ratings alone.
Stock Rating
Overweight - The stock is expected to outperform the unweighted expected total return of the industry coverage universe over a 12-month
investment horizon.
Equal Weight - The stock is expected to perform in line with the unweighted expected total return of the industry coverage universe over a 12-
month investment horizon.
Underweight - The stock is expected to underperform the unweighted expected total return of the industry coverage universe over a 12-month
investment horizon.
Rating Suspended - The rating and target price have been suspended temporarily due to market events that made coverage impracticable or to
comply with applicable regulations and/or firm policies in certain circumstances including where the Investment Bank of Barclays Bank PLC is
acting in an advisory capacity in a merger or strategic transaction involving the company.
Barclays | Telecom Services and Tech Hardware
9 September 2019 43
IMPORTANT DISCLOSURES CONTINUED
Industry View
Positive - industry coverage universe fundamentals/valuations are improving.
Neutral - industry coverage universe fundamentals/valuations are steady, neither improving nor deteriorating.
Negative - industry coverage universe fundamentals/valuations are deteriorating.
Below is the list of companies that constitute the "industry coverage universe":
European Technology Hardware
Aixtron (AIXGn.DE) ams AG (AMS.S) ASML Holding NV (ASML.AS)
Dialog Semiconductor (DLGS.DE) Ericsson (ERICb.ST) Infineon Technologies AG (IFXGn.DE)
IQE plc (IQE.L) Nokia (NOKIA.HE) Spirent (SPT.L)
STMicroelectronics NV (STM.PA) TomTom NV (TOM2.AS)
European Telecom Services
Airtel Africa (AAF.L) Altice NV (ATCA.AS) Bezeq (BEZQ.TA)
Bouygues SA (BOUY.PA) BT Group PLC (BT.L) Cellcom Israel Ltd. (CEL.TA)
Cellnex Telecom (CLNX.MC) Deutsche Telekom AG (DTEGn.DE) DNA Oyj (DNAO.HE)
Drillisch (DRIG.DE) Elisa Oyj (ELISA.HE) Euskaltel SA (EKTL.MC)
Freenet (FNTGn.DE) Gamma Communications PLC (GAMA.L) Iliad SA (ILD.PA)
Inmarsat plc (ISA.L) INWIT (INWT.MI) Iridium Communications Inc (IRDM)
KPN (KPN.AS) Liberty Global (LBTYA) Masmovil (MASM.MC)
NOS (NOS.LS) Orange (ORAN.PA) Orange Belgium (OBEL.BR)
OTE (OTEr.AT) Partner Communications Company Ltd.
(PTNR.TA)
Proximus (PROX.BR)
Sunrise (SRCG.S) Swisscom (SCMN.S) TalkTalk Telecom Group (TALK.L)
Tele Columbus AG (TC1n.DE) Tele2 AB (TEL2b.ST) Telecom Italia SpA (TLIT.MI)
Telecom Italia-RSP (TLITn.MI) Telefonica Deutschland (O2Dn.DE) Telefonica SA (TEF.MC)
Telekom Austria (TELA.VI) Telenet Group Holding NV (TNET.BR) Telenor ASA (TEL.OL)
Telia Company AB (TELIA.ST) United Internet (UTDI.DE) ViaSat (VSAT)
Vodafone Group Plc (VOD.L) Zegona Communications plc (ZEG.L)
IT Hardware and Communications Equipment
Apple, Inc. (AAPL) Arista Networks, Inc. (ANET) Casa Systems (CASA)
Ciena Corporation (CIEN) Cisco Systems, Inc. (CSCO) Corning Incorporated (GLW)
Dell Technologies Inc. (DELL) F5 Networks, Inc. (FFIV) Hewlett Packard Enterprise Company (HPE)
HP Inc. (HPQ) Juniper Networks, Inc. (JNPR) Keysight Technologies, Inc. (KEYS)
Motorola Solutions, Inc. (MSI) NetApp, Inc. (NTAP) Pure Storage, Inc. (PSTG)
Samsung Electronics Co., Ltd. (005930.KS) Seagate Technology plc (STX) Ubiquiti Networks, Inc. (UBNT)
Western Digital Corporation (WDC)
U.S. Cable, Satellite & Telecom Services
Altice USA (ATUS) AT&T (T) Charter Communications, Inc. (CHTR)
Clear Channel Outdoor Holdings, Inc. (CCO) Comcast Corp. (CMCSA) DISH Network Corp. (DISH)
Liberty SiriusXM Group (LSXMA) Sirius XM Radio Inc. (SIRI) Sprint Corp. (S)
T-Mobile US Inc. (TMUS) Verizon Communications Inc. (VZ)
Distribution of Ratings:
Barclays Equity Research has 1537 companies under coverage.
45% have been assigned an Overweight rating which, for purposes of mandatory regulatory disclosures, is classified as a Buy rating; 55% of
companies with this rating are investment banking clients of the Firm; 76% of the issuers with this rating have received financial services from the
Firm.
39% have been assigned an Equal Weight rating which, for purposes of mandatory regulatory disclosures, is classified as a Hold rating; 49% of
companies with this rating are investment banking clients of the Firm; 68% of the issuers with this rating have received financial services from the
Firm.
Barclays | Telecom Services and Tech Hardware
9 September 2019 44
IMPORTANT DISCLOSURES CONTINUED
15% have been assigned an Underweight rating which, for purposes of mandatory regulatory disclosures, is classified as a Sell rating; 34% of
companies with this rating are investment banking clients of the Firm; 65% of the issuers with this rating have received financial services from the
Firm.
Guide to the Barclays Research Price Target:
Each analyst has a single price target on the stocks that they cover. The price target represents that analyst's expectation of where the stock will
trade in the next 12 months. Upside/downside scenarios, where provided, represent potential upside/potential downside to each analyst's price
target over the same 12-month period.
Top Picks:
Barclays Equity Research's "Top Picks" represent the single best alpha-generating investment idea within each industry (as defined by the relevant
"industry coverage universe"), taken from among the Overweight-rated stocks within that industry. Barclays Equity Research publishes "Top
Picks" reports every quarter and analysts may also publish intra-quarter changes to their Top Picks, as necessary. While analysts may highlight
other Overweight-rated stocks in their published research in addition to their Top Pick, there can only be one "Top Pick" for each industry. To view
the current list of Top Picks, go to the Top Picks page on Barclays Live (https://live.barcap.com/go/keyword/TopPicks).
To see a list of companies that comprise a particular industry coverage universe, please go to https://publicresearch.barclays.com.
Types of investment recommendations produced by Barclays Equity Research:
In addition to any ratings assigned under Barclays’ formal rating systems, this publication may contain investment recommendations in the form
of trade ideas, thematic screens, scorecards or portfolio recommendations that have been produced by analysts within Equity Research. Any such
investment recommendations shall remain open until they are subsequently amended, rebalanced or closed in a future research report.
Disclosure of other investment recommendations produced by Barclays Equity Research:
Barclays Equity Research may have published other investment recommendations in respect of the same securities/instruments recommended in
this research report during the preceding 12 months. To view all investment recommendations published by Barclays Equity Research in the
preceding 12 months please refer to https://live.barcap.com/go/research/Recommendations.
Legal entities involved in producing Barclays Research:
Barclays Bank PLC (Barclays, UK)
Barclays Capital Inc. (BCI, US)
Barclays Bank Ireland PLC, Frankfurt Branch (BBI, Frankfurt)
Barclays Bank Ireland PLC, Paris Branch (BBI, Paris)
Barclays Bank Ireland PLC, Milan Branch (BBI, Milan)
Barclays Securities Japan Limited (BSJL, Japan)
Barclays Bank PLC, Hong Kong branch (Barclays Bank, Hong Kong)
Barclays Capital Canada Inc. (BCCI, Canada)
Barclays Bank Mexico, S.A. (BBMX, Mexico)
Barclays Securities (India) Private Limited (BSIPL, India)
Barclays Bank PLC, India branch (Barclays Bank, India)
Barclays Bank PLC, Singapore branch (Barclays Bank, Singapore)
DISCLAIMER:
This publication has been produced by Barclays Research Department in the Investment Bank of Barclays Bank PLC and/or one or more of its
affiliates (collectively and each individually, "Barclays"). It has been prepared for institutional investors only and not for retail investors. It has been
distributed by one or more Barclays affiliated legal entities listed below. It is provided to our clients for information purposes only, and Barclays
makes no express or implied warranties, and expressly disclaims all warranties of merchantability or fitness for a particular purpose or use with
respect to any data included in this publication. To the extent that this publication states on the front page that it is intended for institutional
investors and is not subject to all of the independence and disclosure standards applicable to debt research reports prepared for retail investors
under U.S. FINRA Rule 2242, it is an “institutional debt research report” and distribution to retail investors is strictly prohibited. Barclays also
distributes such institutional debt research reports to various issuers, media, regulatory and academic organisations for their own internal
informational news gathering, regulatory or academic purposes and not for the purpose of making investment decisions regarding any debt
securities. Media organisations are prohibited from re-publishing any opinion or recommendation concerning a debt issuer or debt security
contained in any Barclays institutional debt research report. Any such recipients that do not want to continue receiving Barclays institutional debt
research reports should contact [email protected]. Barclays will not treat unauthorized recipients of this report as its clients and
accepts no liability for use by them of the contents which may not be suitable for their personal use. Prices shown are indicative and Barclays is
not offering to buy or sell or soliciting offers to buy or sell any financial instrument.
Without limiting any of the foregoing and to the extent permitted by law, in no event shall Barclays, nor any affiliate, nor any of their respective
officers, directors, partners, or employees have any liability for (a) any special, punitive, indirect, or consequential damages; or (b) any lost profits,
lost revenue, loss of anticipated savings or loss of opportunity or other financial loss, even if notified of the possibility of such damages, arising
from any use of this publication or its contents.
Other than disclosures relating to Barclays, the information contained in this publication has been obtained from sources that Barclays Research
believes to be reliable, but Barclays does not represent or warrant that it is accurate or complete. Barclays is not responsible for, and makes no
warranties whatsoever as to, the information or opinions contained in any written, electronic, audio or video presentations of third parties that
are accessible via a direct hyperlink in this publication or via a hyperlink to a third-party web site (‘Third-Party Content’). Any such Third-Party
Content has not been adopted or endorsed by Barclays, does not represent the views or opinions of Barclays, and is not incorporated by
reference into this publication. Third-Party Content is provided for information purposes only and Barclays has not independently verified its
accuracy or completeness.
The views in this publication are solely and exclusively those of the authoring analyst(s) and are subject to change, and Barclays Research has no
obligation to update its opinions or the information in this publication. Unless otherwise disclosed herein, the analysts who authored this report
have not received any compensation from the subject companies in the past 12 months. If this publication contains recommendations, they are
general recommendations that were prepared independently of any other interests, including those of Barclays and/or its affil iates, and/or the
subject companies. This publication does not contain personal investment recommendations or investment advice or take into account the
individual financial circumstances or investment objectives of the clients who receive it. The securities and other investments discussed herein
may not be suitable for all investors. Barclays is not a fiduciary to any recipient of this publication. Investors must independently evaluate the
merits and risks of the investments discussed herein, consult any independent advisors they believe necessary, and exercise independent
judgment with regard to any investment decision. The value of and income from any investment may fluctuate from day to day as a result of
changes in relevant economic markets (including changes in market liquidity). The information herein is not intended to predict actual results,
which may differ substantially from those reflected. Past performance is not necessarily indicative of future results. The information provided
does not constitute a financial benchmark and should not be used as a submission or contribution of input data for the purposes of determining
a financial benchmark.
United Kingdom: This document is being distributed (1) only by or with the approval of an authorised person (Barclays Bank PLC) or (2) to, and
is directed at (a) persons in the United Kingdom having professional experience in matters relating to investments and who fall within the
definition of "investment professionals" in Article 19(5) of the Financial Services and Markets Act 2000 (Financial Promotion) Order 2005 (the
"Order"); or (b) high net worth companies, unincorporated associations and partnerships and trustees of high value trusts as described in Article
49(2) of the Order; or (c) other persons to whom it may otherwise lawfully be communicated (all such persons being "Relevant Persons"). Any
investment or investment activity to which this communication relates is only available to and will only be engaged in with Relevant Persons. Any
other persons who receive this communication should not rely on or act upon it. Barclays Bank PLC is authorised by the Prudential Regulation
Authority and regulated by the Financial Conduct Authority and the Prudential Regulation Authority and is a member of the London Stock
Exchange.
European Economic Area (“EEA”): This material is being distributed in the EEA by Barclays Bank PLC. Barclays Bank PLC is not registered in
France with the Autorité des marchés financiers or the Autorité de contrôle prudentiel.
Americas: The Investment Bank of Barclays Bank PLC undertakes U.S. securities business in the name of its wholly owned subsidiary Barclays
Capital Inc., a FINRA and SIPC member. Barclays Capital Inc., a U.S. registered broker/dealer, is distributing this material in the United States and,
in connection therewith accepts responsibility for its contents. Any U.S. person wishing to effect a transaction in any security discussed herein
should do so only by contacting a representative of Barclays Capital Inc. in the U.S. at 745 Seventh Avenue, New York, New York 10019.
Non-U.S. persons should contact and execute transactions through a Barclays Bank PLC branch or affiliate in their home jurisdiction unless local
regulations permit otherwise.
This material is distributed in Canada by Barclays Capital Canada Inc., a registered investment dealer, a Dealer Member of IIROC (www.iiroc.ca),
and a Member of the Canadian Investor Protection Fund (CIPF).
This material is distributed in Mexico by Barclays Bank Mexico, S.A.
Japan: This material is being distributed to institutional investors in Japan by Barclays Securities Japan Limited. Barclays Securities Japan Limited is
a joint-stock company incorporated in Japan with registered office of 6-10-1 Roppongi, Minato-ku, Tokyo 106-6131, Japan. It is a subsidiary of
Barclays Bank PLC and a registered financial instruments firm regulated by the Financial Services Agency of Japan. Registered Number: Kanto
Zaimukyokucho (kinsho) No. 143.
Asia Pacific (excluding Japan): Barclays Bank PLC, Hong Kong Branch is distributing this material in Hong Kong as an authorised institution
regulated by the Hong Kong Monetary Authority. Registered Office: 41/F, Cheung Kong Center, 2 Queen's Road Central, Hong Kong.
All Indian securities-related research and other equity research produced by Barclays’ Investment Bank are distributed in India by Barclays
Securities (India) Private Limited (BSIPL). BSIPL is a company incorporated under the Companies Act, 1956 having CIN
U67120MH2006PTC161063. BSIPL is registered and regulated by the Securities and Exchange Board of India (SEBI) as a Research Analyst:
INH000001519; Portfolio Manager INP000002585; Stock Broker/Trading and Clearing Member: National Stock Exchange of India Limited (NSE)
Capital Market INB231292732, NSE Futures & Options INF231292732, NSE Currency derivatives INE231450334, Bombay Stock Exchange Limited
(BSE) Capital Market INB011292738, BSE Futures & Options INF011292738; Depository Participant (DP) with the National Securities &
Depositories Limited (NSDL): DP ID: IN-DP-NSDL-299-2008; Investment Adviser: INA000000391. The registered office of BSIPL is at 208, Ceejay
House, Shivsagar Estate, Dr. A. Besant Road, Worli, Mumbai – 400 018, India. Telephone No: +91 2267196000. Fax number: +91 22 67196100.
Any other reports produced by Barclays’ Investment Bank are distributed in India by Barclays Bank PLC, India Branch, an associate of BSIPL in
India that is registered with Reserve Bank of India (RBI) as a Banking Company under the provisions of The Banking Regulation Act, 1949 (Regn
No BOM43) and registered with SEBI as Merchant Banker (Regn No INM000002129) and also as Banker to the Issue (Regn No INBI00000950).
Barclays Investments and Loans (India) Limited, registered with RBI as Non Banking Financial Company (Regn No RBI CoR-07-00258), and
Barclays Wealth Trustees (India) Private Limited, registered with Registrar of Companies (CIN U93000MH2008PTC188438), are associates of
BSIPL in India that are not authorised to distribute any reports produced by Barclays’ Investment Bank.
This material is distributed in Singapore by the Singapore branch of Barclays Bank PLC, a bank licensed in Singapore by the Monetary Authority
of Singapore. For matters in connection with this material, recipients in Singapore may contact the Singapore branch of Barclays Bank PLC,
whose registered address is 10 Marina Boulevard, #23-01 Marina Bay Financial Centre Tower 2, Singapore 018983.
This material is distributed to persons in Australia by Barclays Bank PLC. None of Barclays Bank PLC, nor any other Barclays group entity, holds an
Australian financial services licence and instead relies on an exemption from the requirement to hold such a licence. This material is intended to
only be distributed to “wholesale clients” as defined by the Australian Corporations Act 2001.
Middle East: Nothing herein should be considered investment advice as defined in the Israeli Regulation of Investment Advisory, Investment
Marketing and Portfolio Management Law, 1995 (“Advisory Law”). This document is being made to eligible clients (as defined under the
Advisory Law) only. Barclays Israeli branch previously held an investment marketing license with the Israel Securities Authority but it cancelled
such license on 30/11/2014 as it solely provides its services to eligible clients pursuant to available exemptions under the Advisory Law,
therefore a license with the Israel Securities Authority is not required. Accordingly, Barclays does not maintain an insurance coverage pursuant to
the Advisory Law.
This material is distributed in the United Arab Emirates (including the Dubai International Financial Centre) and Qatar by Barclays Bank PLC.
Barclays Bank PLC in the Dubai International Financial Centre (Registered No. 0060) is regulated by the Dubai Financial Services Authority
(DFSA). Principal place of business in the Dubai International Financial Centre: The Gate Village, Building 4, Level 4, PO Box 506504, Dubai,
United Arab Emirates. Barclays Bank PLC-DIFC Branch, may only undertake the financial services activities that fall within the scope of its existing
DFSA licence. Related financial products or services are only available to Professional Clients, as defined by the Dubai Financial Services Authority.
Barclays Bank PLC in the UAE is regulated by the Central Bank of the UAE and is licensed to conduct business activities as a branch of a
commercial bank incorporated outside the UAE in Dubai (Licence No.: 13/1844/2008, Registered Office: Building No. 6, Burj Dubai Business Hub,
Sheikh Zayed Road, Dubai City) and Abu Dhabi (Licence No.: 13/952/2008, Registered Office: Al Jazira Towers, Hamdan Street, PO Box 2734,
Abu Dhabi). Barclays Bank PLC in the Qatar Financial Centre (Registered No. 00018) is authorised by the Qatar Financial Centre Regulatory
Authority (QFCRA). Barclays Bank PLC-QFC Branch may only undertake the regulated activities that fall within the scope of its existing QFCRA
licence. Principal place of business in Qatar: Qatar Financial Centre, Office 1002, 10th Floor, QFC Tower, Diplomatic Area, West Bay, PO Box
15891, Doha, Qatar. Related financial products or services are only available to Business Customers as defined by the Qatar Financial Centre
Regulatory Authority.
Russia: This material is not intended for investors who are not Qualified Investors according to the laws of the Russian Federation as it might
contain information about or description of the features of financial instruments not admitted for public offering and/or circulation in the
Russian Federation and thus not eligible for non-Qualified Investors. If you are not a Qualified Investor according to the laws of the Russian
Federation, please dispose of any copy of this material in your possession.
IRS Circular 230 Prepared Materials Disclaimer: Barclays does not provide tax advice and nothing contained herein should be construed to be
tax advice. Please be advised that any discussion of U.S. tax matters contained herein (including any attachments) (i) is not intended or written to
be used, and cannot be used, by you for the purpose of avoiding U.S. tax-related penalties; and (ii) was written to support the promotion or
marketing of the transactions or other matters addressed herein. Accordingly, you should seek advice based on your particular circumstances
from an independent tax advisor.
© Copyright Barclays Bank PLC (2019). All rights reserved. No part of this publication may be reproduced or redistributed in any manner without
the prior written permission of Barclays. Barclays Bank PLC is registered in England No. 1026167. Registered office 1 Churchill Place, London, E14
5HP. Additional information regarding this publication will be furnished upon request.

BARCRES-63852b76