Embed Size (px)
Citation preview

SHOUDH – A RESEARCH JOURNAL OF MRS. KMPM VCVOL. 1 Dec.2017
EDITOR
Mrs. Meeta Jakhanwal
Co- EDITOR
Dr. Utpal Chakraborty
Asst. EDITOR
Mr. Ajay Kumar Pathak
STUDENTS-MEMBERS IN THE EDITORIAL TEAM
Vivek Sharma -BCA
Atul Kumar – B. Sc IT
Rohit Verma – B.Sc & EWM
Varsha Kumari- BBA
SEND YOU FEEDBACK TO:
The consulting editor
Shoudh- research journal of MRS. KMPM VC
Main Road, J Road, Bistupur, Jamshedpur 831001
E-mail: [email protected]
1

S. No Name of the Article Name of the Author Page
No.
1
IMPACT OF HEAVY METALS IN AND AROUND JAMSHEDPUR - A CASE STUDY ON THE DISPOSED
EFFLUENTS OF TATA STEEL Mrs. Meeta Jakhanwal4
2 TELEVISION ADVERTISING EXPOSURE AND CHILDREN'S CONSUMPTION PATTERNS &
NUTRITIONAL AWARENESS: A SURVEY STUDY.
Dr.Utpal Chakraborty, Asst. Prof Mrs.KMPM Vocational College. Jsr
9
3 CHALLENGES AND ISSUES OF PRIVATE PUBLIC PARTNERSHIP IN INDIA
Cma Shashi Kiran TiwaryAsst. Prof Mrs.Kmpm Vocational College. Jsr
18
4 SOCIO ECONOMIC EFFECTS OF E-COMMERCE Shabnam Ali, Asst ProfessorMrs.Kmpm Voc College
25
5 NINE PILLARS OF DIGITAL INDIA Mrs. Reeta Kumar , Asst ProfessorMrs. K.M. P. M. Vocational College
31
6 AN APPROACH OF MODEL DRIVEN DEVELOPMENT
Poonam Mishra, Reeta KumariAsst ProfessorMrs. K.M.P.M. Vocational College,Jamshedpur, India,
40
7 USE OF METAPROGRAMMING IN MODEL DRIVEN DEVELOPMENT
Poonam Mishra,Reeta Kumari , Asst ProfessorMrs.K.M.P.M.Vocational College
48
8 DYNAMIC SOFTWARE PRODUCT LINE: AN APPROACH TO DYNAMIC BINDING
Reeta Kumari, Asst ProfessorMrs. KMPM Vocational College
52
9 BIOMETRICS IDENTIFICATION TECHNIQUE FOR INTERFERENCE DETECTION SYSTEMS.
Ajay Kumar Pathak, Asst. Prof Mrs. KMPM Vocational College. Jsr
59
10MODELING A DYNAMIC SOFTWARE PRODUCT
LINE USINGDELTA ORIENTED PROGRAMMING
Reeta Kuamri , Poonam Mishra,Asst Professor,Mrs. KMPM Vocational College, Jsr
72
11ENHANCING PERFORMANCE OF
MULTIBIOMETRIC SYSTEM USING ANT COLONY OPTIMIZATION BASED ON SCORE LEVEL FUSION
Sandip Kumar Singh ModakAsst ProfessorMrs. KMPM Vocational College, Jsr
84
12 MULTIMEDIA DATABASESManjari , Asst. ProfMrs. KMPM Vocational College, Jsr,
93
13 REVIEW ON ACID RAIN Anand Kumar, Student EwmMrs. KMPM Vocational College
101
14 OZONE DEPLETION REVIEW Himanshu Sona, Student EwmMrs. KMPM Vocational College
107
15 DEFINING DESERTIFICATION Shitanshu Shekhar Jha, Student EwmMrs. KMPM Vocational College
112
2

16 CLOUD COMPUTING FOR LIBRARY SERVICESLata Kumari, Mrs.Kmpm College Bistupur, Jsr
118
IMPACT OF HEAVY METALS IN AND AROUND JAMSHEDPUR - A CASE STUDY ON THE DISPOSED EFFLUENTS OF TATA STEEL
Meeta Jakhanwal (Principal) Mrs.KMPM Vocational College. Jsr
ABSTRACT: The present piece of work is confined to Jamshedpur and adjoining areas which has witnessed industrial activities since last one century. This place belongs to the newly created state of Jharkhand which is abundantly endowed with a broad spectrum of mineral deposits including iron which happens to be one of the strategic metals of the mankind through the passage of civilization.
Key words: strategic metals, ecosystems, blast furnace
INTRODUCTION
It was Jamshedji Nusserwanji Tata who initiated the establishment of Tata Iron and Steel Company in the year 1907, now known as Tata Steel. Hence this place came to be known as Jamshedpur in memory of its founder. The iron ore extraction operation is associated with large scale generation of enormous amounts of blast furnace slag and coal ash which contains most of the heavy metals mentioned in the periodic table of elements. The slag materials are finally disposed into the terrestrial and aquatic eco system in the vicinity. Therefore, one century of slag disposal has certainly resulted into the enrichment of heavy metals into the abiotic components of the eco system which leave their legacy on the food chain. Jamshedpur experiences typical climate conditions due to its strategic location (longitude 86o 9 min 0 sec E – 86o 16 min 30 sec E and latitude 22o 44 min 4.5 sec N), with Temperature range between 7.5 o C and 43 o C and rainfall 1400 mm per year. The water need is augmented by two rivers viz. Kharkai and Subarnarekha. A man made reservoir known as Dalma Lake situated at the foot Hill of Dalma Mountain is source of domestic supply of the township. The iron ore which basically happens to be the earth’s crust is brought from distant areas like Noamundi, Joda, Badampahar and Jamda for processing. After iron extraction the whole range of radioactive and non-radioactive elements remain in the slag. Some of the worth mentioning toxic heavy metals present in the slag include copper, zinc, cadmium, mercury, lead, aluminum, titanium, Antimony, Bismuth, Nickel, Cobalt, Manganese and Iron. Some radio-active elements belonging to the Uranium series have also been detected in the blast furnace slag. However, iron, manganese and copper happen to be the major pollutants in this zone due to obvious reasons. Nickel is used in the manufacture of ally steel.
THE RESEARCH AIM
The present study aims to study the adjoining areas which have witnessed industrial activities & since last one century and its impact on the eco system.
OBJECTIVES OF THE STUDY:
1. To study the adverse effect of chemical synergistic edifice of nature. 2. To generate a clear picture of the scenario existing in the ecosystem of Jamshedpur.
3

DATA ANALYSIS AND INTERPRETATION:
. The changes or reformation proposed in the present work are based on the following change Management factors in TATA steel.
Production system,Product Quality,
The consequence of these changes can be viewed as the company being more competitive to meet the Global standard in terms of cost and quality and converge as a market leader and sustain. So, to measure these interpretations has been prepared through a valid questionnaire and responses from 20 executive and 15 Non-Executive to a total of 35 responses have been collected and have been measured through statistical tools and techniques. like , descriptive The questions were framed in Likert scale assigning the values like i.e. Strongly Agree (1) , Agree (2) Disagree (3) , Strongly Disagree (4) Undecided (5).So lower values indicate more significant to the response .
PRODUCTION SYSTEM
It is impediment that to include the production system in to challenges in the product type .It depends upon the product cost, strategy, inventory management, competitive pricing etc. So these five variables have been included in this study.
V1. Safety environment for quality.V2. Manufacturing is a production management philosophy built around the continuous reduction of waste.V3. Materials Requirement Planning is scientific V4.Information needed to supply production in their knowledge and experienceV5. Materials requirement planning systems are computerized tools that manage
Table- 2 Descriptive results of Production System
No. of respondents Mean score
Std.
Deviation
Std.
Error
V1 Executive 20 2.29 1.16725 .076
4

Non-Executive 15 2.05 1.242 .143
Total 35 2.23 1.189 .069
V2 Executive 20 2.36 1.056 .072
Non-Executive 15 2.46 1.100 .126
Total 35 2.38 1.066 .061
V3 Executive 20 2.17 1.029 .068
Non-Executive 15 2.03 1.112 .127
Total 35 2.14 1.047 .060
V4 Executive 20 2.92 1.383 .092
Non-Executive 15 3.02 1.540 .176
Total 35 2.95 1.422 .082
V5 Executive 20 2.99 1.368 .091
Non-Executive 15 2.65 1.428 .163
Total 35 2.90 1.389 .080
Findings:
1. The slag materials are finally disposed into the terrestrial and aquatic eco system in the vicinity. 2. Iron extraction the whole range of radioactive and non-radioactive elements remain in the slag.3. In urban areas like Jamshedpur such inset situations are being established where the threat of genetic stress looms large on the population due to occupational exposure. 4. Zinc in air occurs mostly as white zinc oxide fumes and it is toxic to human beings.
5

5. Effects of Manganese has been reported on the human central nervous system by bringing about irreversible damage to the system.
CONCLUSION:
There is a little debate that successful implementation of change can create an extreme competitive advantage and embrace healthy growing and dynamic organizations .It is well understood that lack of doing so or the companies that fear changes are stagnant entities and can send a company on their way to slow and painful death. Globalization is a boon for those companies that can change themselves to lead and produce goods according to market expectations. Tata steel in particular has to compete with low priced Chinese steel producing firms and European steel industries. So the industry has to control industrial effluents for a clean eco system.
REFERENCES
[1]. Martin Albrow, Elizabeth King, “Globalization, knowledge, and society” Sage Publications, 1990, pp-19-25
[2]. Kourdi, J. (2003). Business Strategy: A Guide to Effective Decision Making. Profile Books Ltd., London, ISBN 1 86197 459 0.
[3]. Craig, C. S., Douglas, & S. P. (1996). Responding to the Challenges of Global Markets: Change, Complexity, Competition and Conscience. Columbia Journal of World Business, 31(4): 6-18.
[4]. Kwanashie (1998)”Empirical Review of Globalization and Nigerian Economic Performance European Journal of Business and Management” www.iiste.org ISSN 2222-1905 (Paper) ISSN 2222-2839 (Online) Vol.6, No.33, 2014.
[5]. Porter, Michael E. 1985, "Competitive Advantage"., Ch. 1, pp 11-15. The Free Press. New York.
6

TELEVISION ADVERTISING EXPOSURE AND CHILDREN'S CONSUMPTION PATTERNS: A SURVEY STUDY.
Dr.Utpal chakraborty Asst. Prof Mrs.KMPM Vocational College. [email protected]
ABSTRACT
The growing prevalence of overweight and obesity children are receiving increasing public, political, and academic attention. Among the various factors identified as possible causes for the growth of childhood obesity, including time-trend changes in leisure activities and nutritional knowledge. Results showed that children’s exposure to food advertising was significantly related to their consumption of advertised brands and energy-dense product categories. The relation between advertising exposure and overall food consumption only held in lower- income families. In conclusion, Critics hold advertising responsible for the problem of childhood obesity because of its abundant promotion of energy-dense food that its products containing relatively high proportions of fat, sugar, and salt.
INTRODUCTION
The impact of television advertising exposure has been investigated as it relates to a child's cog- nitions, attitudes, and behavior. With respect to cognition, researchers have found that more exposure to television ad- vertising is related to increased belief and trust in commercials (Atkin 1975b; Thompson 1964). More exposure is also positively related to the child's understanding of the concept of commercials (Rossiter and Robertson 1974). Inconsistent findings have been reported with respect to attitudes toward television advertising and the amount of exposure. Ward and Robertson (1972) found that high exposure correlated with positive attitudes, but only for middle- and upper-class children. Atkin (1975b) found that children who view the commercials are most favorable toward advertising. Part of the explanation for this lack of consistency is the diversity of methodologies employed by the researchers. Exposure frequency was found to be positively associated with the child's attitudes toward the product Exposure was also found to be related to certain behaviors. The bulk of commercials aimed at children are for highly sugared foods such as cereal and candy (Barcus 1975; Gus- sow 1972). Atkins (1975b) found that children watching the most cereal ads on Saturday morning television are the most likely to ask parents to buy cereals. In addition, children who are heavy watchers of cereal commercials tend to eat the advertised brands. In
7

another study, found that in more than 99 per- cent of all cases, children did not make any explicit mention of vitamins, minerals, or the general health value of the product in choosing a cereal.
OBJECTIVES OF THE STUDY
The specific objectives of the study have been fixed at: To study how far advertising is responsible for the problem of childhood obesity. To study the children watching television are the most likely to ask parents to buy cereals. To study the relation between advertising exposure and overall food consumption only held in lower-
income families.
HYPOTHESES OF THE RESEARCH
Analyses of child-directed advertising, which have shown that television advertising aimed at children is dominated by high- calorie and low-nutrient food and beverages.
Repeated exposure to highly persuasive messages for sugary food products may confuse child viewers about the desirability and nutritional value of foods.
The more child-oriented the television advertising viewed, the more negative the relationship between exposure and understanding of nutritional phraseology. This hypothesis is based on the fact that many child- oriented commercials for breakfast cereals and other foods contain phrases such as "part of a good breakfast" or "fortified with vitamins," which are designed to provide nutritional information. The concern is that having such messages presented as part of highly persuasive child-oriented commercials may create confusion about their meaning among child viewers.
METHODOLOGY
Respondents for this study were 250 elementary school students in grades three to six, inclusive. The student’s represented all of the classes at these grade levels in two elementary schools in two school districts serving the community of Jamshedpur. The classes participated in the study with the permission of the school principals and the cooperation of the classroom teachers. we investigated the associations between children’s exposure to food advertising and their consumption of (a) advertised food brands, (b) advertised energy-dense food product categories, and (c) food products overall. Relations were examined using multiple hierarchical regression analysis, while controlling for various child (i.e., age, sex, television viewing time) and family variables (i.e., family income and consumption-related communication styles).
DATA COLLECTION
Data were collected from the respondents in the classroom during a normal school day with the use of interviewer administered questionnaires. The procedure followed was to have the classroom teacher introduce the interviewer and tell the students that they would be asked some questions about their television viewing. The interviewer then took a few minutes to make light conversation with the students and put them at ease, after which the questionnaire parts were distributed and administered one at a time. The administration of the questionnaires involved a brief explanatory statement, instructions, and the answering of questions from the students about what they were to do.
MEASUREMENT8

The questionnaire was a four-part instrument, with each part being administered and collected separately. Three parts of the questionnaire measured variables pertaining to this study: exposure, nutritional knowledge, and understanding of nutritional phraseology. In addition to the variables measured with the questionnaire, age and grade level were recorded for each child, and the classroom teachers provided the re- searchers with a grade for the mean level of academic achievement of each child participating in the study. to television commercials is seen as a function of the amount of television viewing experienced by the child. Exposure was therefore measured with a two-page questionnaire which asked the respondent to list the names of the television shows watched during the past week. To facilitate recall, the questionnaire was divided into sections for week- day and weekend shows. The weekday section was sub- divided by the days of the week (aftemoon and evening), and the weekend section was subdivided into morning, afternoon, and evening sections for both Saturday and Sunday. The decision to measure exposure with recall was felt to limit the span of time over which the respondents should be asked to report their viewing behavior. The use of a one-week time frame was believed to be a reasonable compromise be- tween adequate sampling for purposes of generalization and accuracy in recall. In responding to this part of the questionnaire, children were instructed to list only those programs which were watched in their entirety. In this way, respondents' attention could be focused on each weekly time segment individually, which was felt to aid recall of the shows actually watched. In all cases, it was explained that only the shows watched during the past week should be listed. The respondent's score for exposure was determined by converting each show listed into hours (with the help of local television program listings) and summing the hours across the relevant sections of the questionnaire. For the purposes of this study, hours of viewing were summed for three times of the week which represents differing levels of child-orientation in the commercials aired. They are Saturday morning (child- oriented advertising), weekday afternoons (mixture of child- and nonchild-oriented), and weekday evenings (nonchild-oriented). The child's nutritional knowledge (i.e., general level of knowledge about nutrition and diet) was measured with the use of a thirteen-item true-false test. Questions for the test were taken from the teachers' manuals accompanying seven different elementary school health textbooks covering the entire grade levels included in the study. Between one and three questions related to nutrition and diet were selected from each manual to provide a varied and fairly comprehensive set of questions. Based on the results of a factor analysis, only six items were included in the final scale (see Appendix A). The respondent's nutritional knowledge score was determined by tabulating the number of correct responses across the six questions. Understanding of nutritional phraseology was measured with the use of a seven-item multiple-choice test. A list of relevant phrases and expressions was compiled from observation of approximately five hours of television programming aimed primarily at children. Multiple choice questions were then constructed to test the respondent's understanding of several of these phrases (see Appendix B). The child's score for understanding of nutritional phraseology was determined by tabulating the number of correct responses across all questions. A factor analysis including all items from both scales was completed which showed that the items did load on separate factors in the expected manner. That is, the nutritional knowledge items loaded together and the understanding of nutritional phraseology items loaded on a separate factor. Reliabilities of the two scales yielded coefficient alphas of .56 for the nutritional knowledge scale and .69 for the under- standing of nutritional phraseology scale. These levels of reliability are within the range of acceptability.
RESULTS
Prior to testing for the hypothesized relationships, the re- searchers were interested in whether or not the amount of television viewed is significantly different for different age groups and/or different grades for each of the relevant viewing time periods. This was examined to determine whether age or grade is influencing the hypothesized relationships. Due to the high correlation between age and grade (r = .89), only age was included in the analysis. Results of a one-way analysis of variance are presented in Tables 1 and 2. It can be seen that weekday afternoon viewing does not vary significantly by age. Saturday morning viewing, however, is highly significant by age (p < .000). During this time period, with its high concentration of programming and commercials aimed at children, eight- and nine-year-old watch significantly more television than ten-, eleven-, and twelve-year- olds. The relationship between weekday evening viewing and age is also significant (p < .03). However, during this period, eleven- and twelve-year-old watch significantly more television than eight-, nine-, and ten-year-olds. Frequency distributions of scores on the nutritional knowledge and the understanding of nutritional phraseology measures are provided in Table 3. Scores ranged from zero to six correct on the nutritional knowledge test with a mean of 4.4 correct answers. Scores ranged from zero to seven correct on the nutritional phraseology test with a mean of 5.9
9

correct answers. While the number of correct answers varied by item, there was no discernible trend based on a visual inspection of the items. Table 4 shows the frequency of incorrect answers on both tests. The relationship between children's ages and nutritional awareness was also examined. It was expected that both measures of nutritional awareness would correlate positively with the child's age. The ages of the sample respondents in this study are representative of two of the stages in Piaget's theory of cognitive development. At about age eleven a child is said to move from the "concrete operations" stage, where formal thought processes are beginning to develop, to the "formal operations" stage, where the essentials of logical thought processes are in evidence (Baldwin 1968). The older children in the sample thus should be better equipped to evaluate and learn from what they see on television than their younger counterparts. Nutritional knowledge and understanding were both found to be sig- nificandy related to age (p < .000). Older children had higher scores on both measures. Cognitive development and the ex- instance of health education in the elementary school curriculum would account for improved nutritional awareness among the older children.
TABLE 1 AGE AND MEAN HOURS OF EXPOSURE
Viewing Time Period
8 9 10 11 12 ANOVA Summary Table-f
ANOVA Summary Table -p
Saturday Morning
1.7 1.8 1.2 1.0 1.1 5.27 .0004
Weekday Afternoo
n
2.8 2.8 2.6 2.8 2.9 1.12 .3478
Weekday Evening
3.8 4.6 4.4 5.3 5.6 2.89 .0224
TABLE 2 AGE AND NUTRITIONAL AWARENESS SCORES
Nutritional Awareness
8 9 10 11 12 ANOVA Summary Table-f
ANOVA Summary Table -p
Nutritional Knowledge
3.2 4.0 4.7 4.9 5.1 20.03 .000
Nutritional Phraseolog
y
5.0 5.4 6.1 6.3 6.6 11.87 .000
Due to the relationships between age and the nutritional awareness measures, the hypotheses were tested by calculating partial correlation coefficients, controlling for age. The results are shown in Table 5. The amount of
10

television exposure on Saturday mornings correlated negatively with both nutritional knowledge (r =-. 116, p < .05) and understanding of nutritional phraseology (r =-.113, p < .05). Greater levels of exposure to child-oriented commercials, then, are associated with lower scores on both the nutritional knowledge and the understanding of nutritional phraseology measures. Exposure during weekday afternoons showed no relationship to the nutritional awareness measures. Weekday evening exposure, however, was positively correlated with nutritional knowledge (r =. 114, p < .05), although it did not appear to be related to understanding of nutritional phraseology (r = .002). It should be noted that while significant correlations were found, the absolute levels of the amount of variation explained is low. These results are supportive of both hypotheses. Respondents' scores on both measures of nutritional awareness show their strongest inverse relationship with the amount of exposure to television advertising for the viewing period characterized by the highest concentration of child-oriented commercials (i.e., Saturday mornings). These findings are graphically illustrated in Figure 1.
DISCUSSION AND CONCLUSIONS
The purpose of this study was to explore the relationship between children's exposure to television advertising and their level of nutritional awareness. It appears that television viewing at different times of the week affects children differently. Specifically, exposure to child-oriented commercials was found to correlate with lower nutritional knowledge and lower understanding of nutritional phraseology. One interpretation of these findings is that the child-oriented ads have a negative impact sufficient to interfere with the normal development of nutritional awareness. Perhaps the nutrition- related phrases are themselves confusing to young viewers, due to their placement amid strong persuasive commercial messages. While the intent of the advertiser might be to have such phrases as “part of a good breakfast" or "fortified with ten essential vitamins" perform an information function and avoid the potential for deception, the effects on young viewers may be quite different. Over time, the result may be confusion regarding nutrition in general. This would account for the negative relationship between Saturday morning exposure and scores on both measures of nutritional awareness. If this can be corroborated by additional research, a renewed case may emerge for the regulation of commercial food messages aimed at children. An alternative to regulation of food advertising would be more parental involvement in the influence process. Research has indicated that having adults comment on commercial messages after they have been viewed by children enhances nutritional awareness. Ironically, the time of the week during which the greatest concentration of commercials targeted to children appear (Saturday mornings) is probably not the most conducive to family viewing and parental comment. While there have been many calls for parental involvement in regulating children's exposure to television advertising and mediating the effects of such exposure.
TABLE 3: NUTRITIONAL AWARENESS
FREQUENCY DISTRIBUTION OF TEST SCORES
No. Correct Nutritional Knowledge Frequency
Percent No. correct Nutritional Phraseology Frequency
Percent
0 3 .90 0 2 .61 9 2.81 1 6 1.82 22 6.72 2 10 3.13 39 11.93 3 5 1.54 74 22.64 4 19 5.85 94 28.75 5 46 14.16 86 26.3 6 83 25.4
7 156 47.7
11

TABLE 4: NUTRITIONAL AWARENESS: ITEM RESULTS BY TEST
Nutritional Knowledge
Nutritional Phraseology
Item No. Wrong % Wrong Item No. Wrong % Wrong1 149 45.6 1 78 23.92 88 26.9 2 61 18.73 14 4.3 3 19 5.84 49 15 4 22 6.75 131 40.1 5 63 19.36 79 24.2 6 76 23.2
7 33 10.1
Moreover, parental concern about children's advertising was found to be unrelated to parental control (Feldman, Wolf, and Warmouth 1977). Another study, however, found parental concern to be negatively related to the child's exposure to Saturday television and positively related to the incidence of parent-child discussions about commercial content (Crosby and Grossbart 1981). Other research has found the level of control reported by parents to be positively correlated with the child's under- standing of the concept of commercials and negatively corre- lated with the child's attitude toward television advertising (Wiman 1983). Thus, while parental involvement may be a viable (some would say preferable) alternative to regulation, it remains to be determined how this involvement can best be (a) stimulated on the part of parents, or (b) effectively implemented in the television-viewing environment. Another alternative to government regulation of children's food advertising might be more frequent airing of Public Ser- vice Announcements. Research to date seems to indicate that PSAs have a positive impact on the nutritional awareness and food preferences of children who are exposed to them .The incidence of such messages, however, does not currently comprise a significant portion of the typical child's television dial. In contemplating an increase in the airing of nutrition-oriented PSAs on children's television, questions come to mind regarding the substance and sponsor- ship of such messages. Without government prescriptions on such matters, it is hard to imagine PSAs having a major impact. The imposition of PSA requirements on the advertising industry, however, would be a form of regulation, rather than an alternative to it.
TABLE 5 PARTIAL CORRELATION OF EXPOSURE WITH NUTRITIONAL AWARENESS (CONTROLLING FOR AGE)
Exposure Nutritional Knowledge
Understanding of Nutritional Phraseology
Saturday Morning
-0.116" --0.113
Weekday Aftemoon
0.059 0.000
Weekday Evening
0.I 14t 0.020
12

Exposure to commercials which are nonchild-oriented correlated with higher scores on the nutritional knowledge measure. It is difficult to speculate on the reasons for this positive association. The possibility exists that these scores result from the greater diversity and higher level of sophistication.
TABLE 6 ACADEMIC ACHIEVEMENTS AND EXPOSURE*
Viewing Time Period
A AIB B Academic Achievement
B/C
C C/D D F
Saturday Morning
1.1 1.1 1.3 1.4 1.8 1.5 `1.1 1.6
Weekday Afternoon
3.2 2.8 2.8 3.5 2.2 3.3 3.4 0.5
Weekday Evening
4.8 5.0 4.9 4.9 4.3 3.8 1.6 6.2
*Hours of viewing.
Of evening programming, as well as commercials. The cumulative effect of such diverse exposure may be education- al in nature, thus enhancing nutritional awareness in general. It remains for future research to corroborate this finding and to uncover the factors responsible for it. The absence of a relationship between exposure to non- child-oriented advertising and understanding of nutritional phraseology may simply be due to the fact that the proportion of commercials having the relevant phraseology is very small during the evening viewing hours. Few commercials during this time period are for breakfast cereals and other products which employ the language in question. Exposure to a mixture of child- and nonchild-oriented ad- vertising was not found to be significantly related to either measure of nutritional awareness. Weekday afternoon viewing, consisting of a mixture of child and nonchild programming and commercials, apparently has little or no impact on the child's nutritional awareness. The concentration of child- oriented advertising during this viewing period is apparently not great enough to produce the results observed for Saturday mornings. A possible relationship between academic achievement and exposure was also investigated. The analysis found no significant results for any of the viewing periods tested. A child's grades in school do not appear to be related to the amount of television viewing which is taking place on Saturday mornings, weekday afternoons, or weekday evenings (see Table 6). Academic achievement was, however, found to be positive- ly related to both measures of nutritional awareness (see Table 7). Better students had significantly higher scores on both nutritional knowledge (r = .304, p < .001) and under- standing of nutritional phraseology (r-- .297, p < .001). It was expected that children whose grades in school indicate that they are adept at learning and performing successfully on academic tests would score higher on these instruments. This expectation was particularly true for the first instrument, inasmuch as the individual items were, in fact, test questions from elementary school health textbooks.
LIMITATIONS
In conclusion, however, for the continued efforts of a broad range of researchers and a variety of perspectives as essential to building an understanding of the effects of television advertising on children. Another potential problem is that the measure of exposure may have underestimated the respondents' hours of viewing, due to its reliance on the subjects' recall. However, it seems reasonable to assume that such an error, if it exists, is distributed across respondents of different ages and other charac- teristics. One week of viewing may not have been an adequate basis for this measure. But as pointed out earlier in the paper,
13

lengthening the viewing period surveyed would likely reduce the accuracy of the responses. An alternate approach to measuring exposure is aided recall, where respondents are provided program schedules and asked to identify either the shows watched over a defined period of time or those “usually watched." This, however, tends to produce an error in the opposite direction, namely, overestimates of viewing time. Another alternative approach to the measurement of exposure
TABLE 7 ACADEMIC ACHIEVEMENT AND NUTRITIONAL AWARENESS SCORES
Nutritional Awareness
A A/B B B/C C C/D D F
Nutritional Knowledge
5.1 4.6 4.4 4.6 3.9 3.8 3.6 3.6 r= .304p<.001
Nutritional Phraseology
6.6 6.2 6. l 5.9 5.1 5.5 5.0 4.6 r=.297 p<.001
is the use of a log or diary to record the programs watched as the viewing occurs. The accuracy of the diary is still a function of the respondent's memory and care. In the case of child viewers, this could be a particular problem because much viewing is done without parents being present to assist in the record keeping. The ideal, of course, would be to electronically record the times and channels viewed. Even then, however, there may be some question about who the viewers were. Another limitation of the study relates to the socioeconomic characteristics of the sample. The two schools from which the sample was drawn serve a fairly broad range of middle-class residents. Whether the findings would have been the same for very high or very low socioeconomic groups is not known. Children's television advertising continues to be a potential public policy issue, particularly in the area of health and nutrition, despite the current non- regulatory environment. At the same time, the viability of parental involvement should be explored as an alternative to regulation in this area.
APPENDIX A NUTRITIONAL KNOWLEDGE
Name:-Grade:-
Q1.What do you think? Are these sentences true or not? Read each one carefully before you make up your mind. T means: the sentence is true. F means: the sentence is false. 1. Food that is not needed at once can be stored in the body. - True2. Milk contains all the vitamins you need each day.-False 3. You need just one kind of food to take care of all your body's needs. -False4. A very useful food guide is this: "Eat lots and lots of food daily." -False5. Milk should always be taken in liquid form.-False 6. Your body does not need sugar at any time.-False
APPENDIX B UNDERSTANDING OF NUTRITIONAL PHRASEOLOGYName:-
14

Grade:-
1. If a commercial for Capt. Crunch cereal says that it is “part of a good breakfast," this means A. a bowl of Capt. Crunch is all you should eat for breakfast.B. you should eat Capt. Crunch only in the mornings. C. you should have more than just a bowl of Capt. Crunch for breakfast.Ans.C 2. If a commercial for Cocoa Crispies says that it is "fortified with vitamins" this means: A. Cocoa Crispies has things in it that are good for you.B. if you eat Cocoa Crispies you don't need to take vitamin pillsC. you can eat as much Cocoa Crispies as you want. Ans. A3. A "nutritious breakfast" is: A. one that only tastes good. B. a healthy meal you should start your day withC. always a very big meal. Ans. B4. If a commercial for Cheerios says that it has "10 essential vitamins and minerals," this means: A. you will probably get sick if you don't eat Cheerios.B. Cheerios is the only kind of cereal you should eat.C. Cheerios has certain things in it that are .very important for your body.Ans. C5. A "balanced diet" is:A. a group of foods that gives your body everything it needs. B. a group of foods that weigh the right amount.C. a meal that has only one kind of food.Ans. A
6. Which one of the following is the best example of a "nutritious breakfast?"A. a glass of orange juice and a bowl of cereal with milk.B. Three pancakes and 3 pieces of toast. C. a glass of tomato juice and 2 pieces of toast.Ans. A
REFERENCES:-
Atkin, Charles K. 1975a. "Effects of Television Advertising on Children's and Mothers' Responses to Television Commercials." Report No. 7. Michigan State University.
Caroli, M., Argentieri, L., Cardone, M., & Masi, A. (2004). Role of television in childhood obesity prevention. International Journal of Obesity, 28, 104–108.
. Buijzen, M., & Valkenburg, P. M. (2002). Appeals in television advertising: A content analysis of commercials aimed at children and teenagers. Communications: The European Journal of Communication Research, 27, 349–364.
Roberts, D. and C. Baehen. 1978. "The Impact of Within-Ad Disclosures vs. Supplemental Nutrition Messages on Children Understands of the Concept of a 'Balanced Breakfast.'" Technical Report submitted to the Federal Trade Commission, Division of National Advertising, Bureau of Consumer Protection (November).
15

W. Gibson and C. Bachen. 1979. "The Impact of Animated Public Service Announcements on Children's Responses to Questions about Health and Safety."" Technical Report submitted to ABC Television, Inc. (May).
Robertson, Thomas S. and John R. Rossitcr. 1976. "Short-Run Advertising Effects on Children: A Field Study." Journal of Marketing Research 13 (February): 68-70.
16

CHALLENGES AND ISSUES OF PRIVATE PUBLIC PARTNERSHIP IN INDIA
CMA Shashi Kiran TiwaryAsst. Prof Mrs.KMPM Vocational College. Jsr
INTRODUCTION
The Public Private Partnership (PPP) model in India is mostly directed towards attracting private investment in infrastructure projects. Though India is one of the largest recipients of private investment in infrastructure, yet due to regulatory and policy issues among others, there have been a few hiccups in this area as well, new challenges have cropped up in recent times. A few private companies have walked out of big projects and some others have been demanding renegotiation or are under arbitration. Public-private partnerships are typically found in transport infrastructure such as highways, airports, railroads, bridges and tunnels. Municipal and environmental infrastructure includes water and wastewater facilities. Public service accommodations include school buildings, prisons, and entertainment or sports facilities.The companies like GMR and GVK walked out of mega highway projects and Delhi Airport.
OBJECTIVE OF THE RESEARCH:
The present research investigation has been undertaken with the following objectives:
To know about the term PPP. To know about various activities and development related to PPP. To focus on its challenges and constraints in financing the desired projects. To highlight the effectiveness of implementing PPP by looking at past experiences in infrastructure projects To investigate the best conditions under which PPP is most appropriate. To identify the benefits, success and difficulties of PPP
17

FUND PROVIDERS
There are international lending agencies that also provide long term investment finance towards this sector. World Bank, Asian Development Bank and other global agencies supplement the state efforts by lending money to the state authorities. When the state alone cannot bear the entire burden then start for weighing several alternative avenues attracting investment namely: Sovereign state finance; Aid from world multilateral lending agencies; Fiscal budgetary support from state and public finance; Foreign direct investment Public private partnership.
18

Private sector involvement in the delivery of public services is not a new concept; PPPs have been used for over three decades, starting in 1970s. Initially focusing on economic infrastructure, PPPs have evolved to include the procurement of social infrastructure assets and associated non-core services. PPPs are used in housing, health, corrective facilities, energy, water, and waste treatment projects. PPP policy has also evolved globally as public sectors budgetary challenges limit potential options. One method of tapping into alternative sources of capital is the public-private partnership.
According to the Federal Highway Administration (FHWA) of United States Department of Transportation, PPP is defined as: “A contractual arrangement between public and private sector entities pursuant to which the private sector is involved in multiple elements of public infrastructure projects” (FHWA, 2010) Public-private partnerships have contract periods of 25 to 30 years or longer. Financing comes partly from the private sector but requires payments from the public sector and/or users over the project's lifetime. The private partner participates in designing, completing, implementing and funding the project, while the public partner focuses on defining and monitoring compliance with the objectives. Risks are distributed between the public and private partners according to the ability of each to assess, control and cope with them.
PAYMENT FOR PUBLIC-PRIVATE PARTNERSHIPS
Although public works and services may be paid for through a fee from the public authority's revenue budget, such as with hospital projects, concessions may involve the right to direct users' payments, as with toll highways. In cases such as shadow tolls for highways, payments are based on actual usage of the service. In cases involving wastewater treatment, payment is made with fees collected from users.
BENEFITS OF PUBLIC-PRIVATE PARTNERSHIPS
Private-sector technology and innovation help provide better public services through improved operational efficiency. The public sector provides incentives for the private sector to deliver projects on time and within budget. In addition, creating economic diversification makes the country more competitive in facilitating its infrastructure base and boosting associated construction, equipment, support services and other businesses.A good PPP can have the following benefits infecting down to the objective of creation of infrastructure and assets. Good PPP’s have lowered the life cycle cost of projects, Introduced state of the art technology, It substantially improved customers service, Corporate are voluntarily seeking ways to increase positive impact of their projects by undertaking CSR initiatives. It may be mentioned here Companies Act 2013 has mandated upon the companies to mandatorily spent 2% of their profits CSR related activities. In case on viability gap funding (VGF). The ministry of finance offers priority to socio –economically desirable projects viable under the PPP format and the Govt extends budgetary grants and fiscal resources support to the projects.
ISSUES & CHALLENGES of PPP IN INDIA
The high economic growth witnessed by India during the last decade was accompanied by realization of the need for enhanced investment in infrastructure. Rapid urbanization and industrial growth led to demand for basic infrastructure such as water supply and sanitation, transportation and energy. Rapid growth in purchasing power in the rural areas simultaneously meant a need for improving connectivity and services for attaining a seamlessly integrated network of logistics and facilities. In order to augment economic growth, the government initiated several policy and enabling measures to support the creation of high-quality infrastructure and efficient delivery of services to its citizens.
The Twelfth Five Year Plan (2012-2017) was formulated against the backdrop of a remarkable performance of the infrastructure sector during the Eleventh Plan. The Twelfth Plan projected an
19

investment of Rs.55.75 lakh crores (at current prices) in infrastructure during the Plan period (2012-17), which was more than twice that achieved during the Eleventh Plan period. Furthermore, the Plan adopted a strategy of encouraging higher private investment in infrastructure which was projected to rise substantially from 37% in the Eleventh Plan to approximately 48% in the Twelfth Plan.
Macro-economic developments in the late 2000s saw an overall slowdown in delivery and investment in infrastructure projects in general, including private sector projects and non-PPP projects, as in the case of the power sector. This combined with country specific issues including weak capacity in public sector administration and private sector constraints to meet the requirements of a developing economy, led to a deleterious impact on investment in infrastructure, and choking of further capacity to invest by the private sector.
The performance in the first two years of the Twelfth Plan suggests that infrastructure investment has slowed and there will be a shortfall of approximately 30%, with the shortfalls in public investment (central and states combined) and private investment 5 at 20% and 43% respectively .
The use of PPP an as instrument of procurement for creation of infrastructure assets and delivery of public services has been recognized globally. Given the enormity of investment required and the limited availability of public resources for investment in physical infrastructure in India, the projected infrastructure requirements have made it imperative for the government to explore avenues for increasing investment in infrastructure through a combination of public investment and the PPP mode of delivery.
While augmenting delivery and financing of public projects, PPPs are expected to bring in new and cost-effective technology for creation of infrastructure assets, managerial efficiency, and superior competencies in service standards for the Economic Survey, 2015 Report of the Committee on Revisiting and Revitalizing the PPP Model of Infrastructure operation and maintenance of public assets. There is a contractual accountability for the private party to guarantee timely and high-quality infrastructure services to end users.
In India, PPP applies to a contractual arrangement between a government or statutory entity, or a government-owned entity on one side and a private sector entity on the other, for the provision of public assets or public services. This is done through investments made and management undertaken by the private sector entity for a specified period of time, with a well-defined allocation of risk between the private sector and the public entity, whereby the private entity receives performance linked revenues that conform or are benchmarked to specified and pre-determined performance standards, measurable by the public entity or its representative.
In essence, therefore, PPP refers to the provision of a public asset and service by a private partner who has been conceded the right (the “Concession”) for the purpose over a specified period on the basis of market-determined revenue streams that allow a commercial return on investment.
PPPs do not include public investment in private infrastructure, private investment in private infrastructure, private investment in avenues other than providing a public service or good or joint ventures between the government and the private sector for activities such as manufacturing or the New Exploration Licensing Policy for Production-sharing Contracts in the Oil sector.
20

While the fallout of the slowdown has been particularly harsh on the infrastructure sector, especially in projects that were not in PPP mode, the PPP segment overall has done reasonably well, both at the central government level and in some states. The measures taken by the Government of India over the last 10-15 years had resulted in a robust pipeline of projects at different stages of implementation (under bidding, construction and operations). The sectorial spread of PPPs has been fairly diverse in hard infrastructure sectors such as transport (roads, airports and ports), which has seen the largest share in terms of numbers and success. The new airports at Delhi, Mumbai, Bengaluru and Hyderabad and the large dimension of highway projects are part of the programmatic success of PPPs in the country. Report of the Committee on Revisiting and Revitalizing the PPP Model of Infrastructure.
THERE ARE SEVERAL STAGES INVOLVED IN INVITING PRIVATE CONTRACTING PARTIES TO THE PPP CONTRACT:
Inviting competitive bidding either national or international; Acceptance of contract award method; Determining the terms and conditions of contract; Determining the price at which contract is offered to private parties; The future monetary benefits assured to the private entities.
VARIOUS ACTIVITIES & EXAMPLE RELATED TO PPP
In November 2013, a newly proposed regulatory authority for highways in India (RHAI) bill was drafted , which besides adjudicatory functions, seeks major role for regulator in contract management to lessen the litigation or arbitration cases to facilitate dispute resolution, dispute redressal machinery .
In the budget speech of 2013-14 the Govt. has decided to constitute a regulatory authority for the road sector given that the road construction sector has reached a certain level of maturity; but it faces challenges not envisaged earlier, including financial stress, enhanced construction risk and contract management issues, that are best addressed by an independent authority and regulator for road sector.
Attracting private participation imbibes with it innovation with different structures and expedited the process of implementation. According to PPP status Report of government of India as on July 31,2011,in terms of total value of contracts in cores of rupees, Andhra Pradesh occupies the first rank with Rs 66,918.3 crore; followed by Maharashtra Rs 45,592.0 crore; Karnataka Rs 44658.9 crore; Gujarat Rs 39637.2 crore; Uttar Pradesh Rs 26,595.8 crore. It signifies that infrastructure development finance is positively inverse towards south and western part of India.
In terms of total value of contracts in crores of rupees, roads occupy the first rank with Rs 176724.9 crore; followed by Ports Rs 81,038.2 crore; Energy Rs 67244.6 crore; urban development Rs 29475.0; Airports Rs 19,111.0 crore. During the last eleven years under PPP financing these five states are top most priority areas of our national growth agenda. Surveying of additional public investment coupled with private resources and expertise are essential but not sufficient condition for achieving a double digit growth rate of the country.
In terms of total number of projects based on contract award method and the total project offered under PPP mode, roads occupy first rank with 405 numbers; followed by urban development 152; Ports 61; Energy 56; Tourism 50.
Another angle of analysis is the contract award method. There are four process available in this regard namely Domestic competitive bidding; International competitive bidding, negotiated MOU, unsolicited.
21

Almost all the project under consideration were offered on competitively bid, either national or international competitive bidding; while negotiated one through MOU was offered primarily to Railway PPP project. In terms of contract award method, the international competitive bidding yielded 35percent of total investment in India followed by domestic competitive bidding 26 percent.
THE FOLLOWING ARE THE CONSTRAINTS THAT ARE REVEALED IN COURSE OF OUR FIELD SURVEY OVER THE IMPLEMENTATION OF PPP PROJECTS:-
1. There is no formal law governing the project contract
2. Whether bidding will be done through multi-stage bidding after scrutiny of the project proposal at two or three layers
3. Whether there will be open public action or through mere official notification, then receiving the tender proposal and then assignment of contract.
4. Who will be authority to fix the price for bidding of the project, whether it is going to ensure a reasonable amount of public revenue and at the same time leave some remunerative commercial gain for private parties
5. What is the scope of CAG scrutiny and audit over the work allocation by public authorities, government departments?
6.In case a private party suffers loss at a subsequent period on account of work contingency, strike, price escalation, natural calamity, higher compensation payable for land acquisition and rehabilitation of the affected people, or for other reasons.
7. There is less information available in terms of actual contracts used.
8. Initial spadework and the garnering of statutory approvals is done by the Govt, prior to inviting bids.
9. Delays, litigation in land acquisition, payment of monetary compensation; over shifting of utilities in the states can hold projects for a long period.
10. What is the scope of CAG scrutiny and audit over the work allocation by public authorities, government departments?
11.In case a private party suffers loss at a subsequent period on account of work contingency, strike, price escalation, natural calamity, higher compensation payable for land acquisition and rehabilitation of the affected people, or for other reasons.
12. There is less information available in terms of actual contracts used.
13. Initial spadework and the garnering of statutory approvals is done by the Govt, prior to inviting bids.
14. Delays, litigation in land acquisition, payment of monetary compensation; over shifting of utilities in the states can hold projects for a long period.
22

RECOMMENDATIONS
Having accepted the Rangarajan Committee formula, the Centre has approved premium rescheduling for road projects. Premium is the amount road developers agree to pay the Govt, as the projected returns to them from tolls etc. are seen as very attractive. Reportedly premiums adding up to Rs 151000 crore are due to the Centre. The centre and the concerned state may form a Joint Venture (JV) to fast forward project clearances in a time bound manner. This would obviously make the project bankable and speed up its execution through debt financing from lenders. It would enable winning bidders raising funds at finer rates free of various risks. Revenue streams from tolls or real estate development can be quite different from initial estimates, it is worth to have built in mechanism for transparent renegotiations for the greater good. The contracts must clearly spell out the obligations of all the stakeholders. There is need to have an independent regulator for highways for oversight on project development and follow-through, including maintenance and the vital aspect of Road safety.
CONCLUSION
Risk allocation and sharing is a very important subject that was mentioned in the literature review as well as in the survey responses. Much emphasis is placed on the appropriate allocation of resources in PPP projects. This is of much importance because each party might have other adherent motives and objectives for entering into a PPP project. How best the private sector deals with these risks determine the success of the project. PPP projects are mostly used on large projects which incorporate modern and innovative ideas. Due to their scale and technicalities involved, such projects tend to cost more and have a higher risk associated. Without the resources and expertise of the private sector, the success of such projects might never be accomplished. Most companies in the private sector would like to get involved in such projects to improve their image in the industry. Fiscal administration and resource allocation principal stipulates that public revenue should be deployed in the best possible way which ensure percolation of benefits to the large number of members in the society, sharing benefits among all, making common fiscal resources delivering services to large number of members in the course of governance. PPP is one of the instruments of delivering public service blending together the benefits of both the world of public ownership of assets with private enterprising zeal and sprit. It is essential but not sufficient to create and environment of reciprocate, commonality of goals based on mutual trust and good faith. Our research findings revealed that PPP mode has attained quite a degree of success during the last ten year period and the model would continue to serve the nation in creating development in put for the future generation with sustainable development sans destruction.
REFERENCES
Banerjee Shyamal, Understanding Infrastructure and some options for its financing, The Management Accountant, ICAI, January 2013, Kolkata, p.11
Golden off R. N.(2001) Opportunities and challenges in public –private partnership, The Public Manager, 31-35 quoted in Smythe, Kevin . F (May 2004) Development and Analysis of a PPP: Implications for Practice. Doctor of Psychology Dissertation, School of Psychology, James Madison University (27-11-07). Grimsey, Darrin and Lewis, Mervynk (2002) Evaluating the risks of Public Private Partnership for Infrastructure projects, International Journal of Project Management, 20(2):248
23

SOCIO ECONOMIC EFFECTS OF E-COMMERCE
Shabnam AliAsst ProfessorMrs.Kmpm Voc College
INTRODUCTION:
The revolution in computing and communications of the past few decades, indicate that technological progress and use of information technology will continue at a rapid pace the internet growth and e commerce has begun to create fundamental change in government societies and economies with social economic and political implications, this advances present many significant opportunities but also are having wide range effects across numerous domains of society and for –policy makers. Issue involve economic productivity intellectual property rights privacy protection and affordability of and access to information among other concerns e-commerce has already improve business value by fundamentally changing the ways products are conceived marketed delivered and supported. E-commerce is helping organizations to reduce transactions sales, marketing and advertising costs it is also helping businesses to reach global markets efficiently 24hrs. per day, 7 days per week and 365 days per year. Many of the benefits come from improved consumer convenience, expended choices lower prices and the opportunity for better interactions with partner’s suppliers and targeted customers for services and relationship e-commerce has also improved product promotion through mass customization and one to one marketing
Adoption of new information technologies, particularly e-commerce is expected to result in improvement in firm performance such as reducing cost and closer coordination of economic activity among business partners. E-commerce specifically is predicted to result in lower coordination or transaction costs due to automation of transaction online as well as productivity and efficiency gains. As e-commerce continuous to grow rapidly it could have significant effects on the social and economic structure of economy. The impacts of this changes are diverse and may even widen the digital divide among nations, alter the composition of trade disrupt labor markets and change taxation.
OBJECTIVE:
Electronic commerce over the internet is a new way of conducting business. Through only few years old, it has the potential to radically alter economic activities and the social environment. Already it affects such large sectors as communications finance and retail trade, it holds promise in areas such as education, health and government. An innovation in information’s and communication technologies have created a revolution that is changing the way the world works, learns, communications and transacts business. E-commerce continues to show strong growth and has been influencing the social and economic growth of nations on one hand e-commerce technologies have helped nations to accelerate their economic growth and to provide more opportunities for business to grow but it has also created many challenges and effects across numerous domain of society and policy makers. this issues involves economic productivity intellectual property right privacy protection and affordability of an access to information, among other concerns this paper describes the various socio economic impacts and influences that have been created by e-commerce.
ECONOMIC DRIVERS OF E-COMMERCE:
Five broad themes have emerged as important for understanding the economic and social impact of e-commerce.24

E-COMMERCE TRANSFORMS THE MARKET PLACE: e-commerce will change the way business is conducted. Traditional intermediary functions will be replaced, new products and markets will be developed, new and far close relationships will be created between business and consumers. it will change the organization of work, new channels of knowledge diffusion and human interactivity in the work place will be opened, more flexibility and adaptability will be needed and workers functions and skill will be redefined.
E-COMMERCE HAS A CATALYTIC EFFECTS: e-commerce will serve to accelerate and diffuse more widely changes that are already underway in the economy such as the reforms of regulations, the establishment of electronic links between business and the demand for higher skilled workers. Likewise many sectoral trends already underway such as e-banking, direct booking of travel and one to one marketing will be accelerated because of e-commerce
E-COMMERCE OVER THE INTERNET VASTLY INCREASES INTERACTIVITY IN THE ECONOMIC : these linkage now extend down to small business and households and reach out to the world at large. Access will shift away from relatively expensive personal computer to cheap and easy to use TVs and telephones devices. People will increasingly have the ability to communicate and transact business anywhere any time.
OPENNESS IS AN UNDERLYING TECHNICAL AND PHILOSOPHICAL TENET OF THE EXPANSION OF E-COMMERCE: the widespread adoption of internet as a platform for business is due to its nonproprietary standards and open nature as well as to the huge industry that has evolve to support it. The economic power that stems from joining a large network will help to ensure that new standards remain open. More importantly openness has emerged as a strategy, with many of the most successful e-commerce ventures granting business partners and consumers unparalleled access to their inner workings, databases and personnel. This has led to a shift in the role of consumers, who are increasingly implicated as partners in product design and creation. An expectation of openness is building on the part of consumers / citizens which will cause transformations, for better or for worse in the economy and society.
E-COMMERCE ALTERS THE RELATIVE IMPORTANCE OF TIME : Many of the routines that help define the look and feel of the economy and society are a function of time, mass production is the fastest way of producing at the lowest cost , one’s community tends to be geographically determined because time is a determinant of proximity. E-commerce is reducing the importance of time by speeding up production cycles, allowing conducting transactions around the clock. As the role of time changes , so will the structure of business and social activities , causing potentially large impacts.
POSITIVE INFLUENCE OF E-COMMERCE FOR BUSINESS
24\7 business: e-commerce allows a show, showroom or an office to open 24\7 it also means that time zones are not a problem,
Developed complete new type of business: e-commerce has allowed the establishment of completely new type of business such as online shopping and internet banking which with new ways of thinking and processes provides many benefits and advantages
Brings substantial net benefits to the economy reasonable costs and price: real impact of it is its ability to reduce costs and prices and make during business more efficient
25

Large number of enterprises has migrated to internet based system for increased efficiencies, lower cost and the ability to operate in real time across different platform
E-commerce permit customers to custom order products based on individual needs and preferences virtually thousands of choices.
Increased competitiveness of small and mid-size business
Social impacts of e-commerce: social impacts mean the structure and functioning of societies at an individual and aggregate level.
E-COMMERCE AND THE DIGITAL DIVIDE
the term digital divide means a lack of equal access to computer technologies and the internet, creating a gap between those who have & those who have not on one hand , e-commerce has provided new opportunities for eco, growth on the other hand it has created a social problem of digital divide –more than 2\3 of the world population still is deprived of access to information and communication technologies tin the adoption of digital technologies among different social groups and firms depending on industry structure, business size & location
E-COMMERCE AND MARGINALIZATION: with the use of internet to conduct business fewer people are required as jobs are automated or made obsolete. This also means that those who are employed in the formal sectors require skills and knowledge this implies that the other half is either unemployed or as or is in the informal sector of the economy they are therefore marginalized as they are pushed to the periphery due to their inappropriate education or skills they are further marginalized s the gap in the knowledge attained between themselves and those in the formal sector grows
SOCIAL ISOLATION: e-commerce makes it possible for an order consumer to purchase almost all needs from home & have those items delivered. But this can head social isolation. the only time there is any personal contact in tour his situation is when consumer signs for the packages & when they call up customer services.
SOCIAL DISPARITIES & CHANGE OF LIFE STYLE: change is household’s role, division of labor responsibilities & relationship take place at least partially influenced by the adoption and use of modern information & communication technologies have based e work and other combinations of time and place flexibility have created a variety of important effects in partnership, families, and family life.
LOSS OF INDIVIDUALITY: organization used sophisticated tools to reach customers and get their personal data record into their database. Many believe that e-commerce technology is eroding personal privacy because consumer has no control over their personal data, the merchants have collected during their shopping experience.
PRIVACY : it is not just our personal information that is being abused but we are subjected to almost daily scrutiny of our lives, computers can monitor every aspects of our online activities whether we are in our cars and just a short walk away from where we parked, someone somewhere will be able to know our location
ECONOMIC BEHAVIORAL CHANGES: The changes that B2C e-commerce has sparked arguably have had a more significant impact on the economy and on buyers' behavior than has B2B ecommerce. In the past, when consumers wanted to make purchases they had to set aside time to shop during certain hours of the day, or they had to read through catalogs sent to them by mail-order houses. Today, many consumers can simply use their
26

computers— and now smart phones or other portable electronic devices—to shop online. Buyers and sellers that engage in e-commerce retail trade are no longer restricted by store hours, geographic marketing areas, or catalog mailing lists. With a few simple clicks they can gain access to a variety of goods 24 hours a day, seven days a week. The characteristics of retail e-commerce merchandise also have changed significantly over the past decade. Back in 2000, computer hardware was the most common type of merchandise sold over the Internet. Today, the variety of merchandise is extremely diverse, and shoppers can buy almost anything online
ECONOMIC IMPACT AND INFLUENCE OF E-COMMERCE: it could have significant effects on the structure and functioning of economics at the firm, sector and aggregate level. the most basic of economic transactions— the buying and selling of goods—continues to undergo changes that will have a profound impact on the way companies manage their supply chains. Simply put, e-commerce has altered the practice, timing, and technology of business-to-business (B2B) and business-to-consumer (B2C) commerce. It has affected pricing, product availability, transportation patterns, and consumer behavior in developed economies worldwide.
E-COMMERCE INFLUENCES DEMAND PATTERNS: As technology, e-commerce, and globalization become more intertwined, buyers and sellers are increasing their connectivity and the speed with which they conduct sales transactions. As we saw during the recent turmoil in the financial markets and some supply chain networks, speeding up sales transactions can be a very positive attribute when small market corrections are taking place. However, during a major economic correction like the one we witnessed during the Great Recession, a quicker response to sales transactions can have cascading impacts on supply chains, resulting in large contractions or expansions in orders, production, shipments, and inventory.
That's because years ago, it might have taken two years for events in one country to affect another's economy. Now, thanks to technology and instant communication, the impact can be almost immediate.
ORGANIZATIONAL CHANGES OF ENTERPRISES: e-commerce can influence the process of governance in various ways and in varying degrees, from improving the current mechanism of delivery of services to transforming the entire mechanism and the nature of services themselves. It can lead to increase participation inclusion and integration on one hand and increased marginalization loneliness and exclusion from information and communication on the other.
E-COMMERCE AND LOCAL BUSINESSES: As e-commerce grows it will create an important socio-economic effect which will be increased competition with the traditional businesses in any local community. In general local merchants are ill prepared to take full advantage of e-commerce dye to various reasons and thus they are unlikely to see gains from it.
COMMUNITY: Level Impacts of E-Commerce –It has many positive influences on the individual level whereby local buyers gain more value and greater access to suppliers. However, the results at the community level may be undesirable as it can creates job losses, loss of local shopping options, even with higher prices, decreased attractiveness of local community etc.
Some of the intangible downside risks of increasingly "virtual" interaction within rural community include the possible "de-socialization" of individuals who have less and less direct contact with their peers, their co-workers, and their community. This can extend to family relations as well, particularly if technology creates further imbalances between those who are "on-line", and those without access to these technologies. On the other hand,
27

equitable deployment of infrastructure and educational resources could provide a means of maintaining and expanding family and communal ties that would otherwise be broken by distance and cost.2) Other problem includes psychological and physical health-related effects of sedentary, computer anchored work environments. Early experience suggests that as this type of work (and social) activity expands, businesses and government will have to consider broad-based means to offset health hazards with new policies and treatments.3) E-commerce may offer the potential for shifting the balance of opportunity, wealth, and social and political inclusion. As much as these trends can be beneficial to the majority of rural community, they are also likely to bring unanticipated effects on cultural and social norms. Indigenous traditions that have so far survived the intrusion of modernity may be less resilient in the face of global networks and instantaneous communication. These types of impact are just as significant as changes in bottom-line incomes, and can really only be "measured" by the persons whose lives are being changed by forces largely beyond their control.
IMPACT ON EMPLOYMENT AND LABOR POLICY – The growth of e-commerce is likely to have both direct and indirect impacts on labor markets as well as the composition of employment since e-commerce may create more knowledge base products, it is likely to drive wide spread changes in the labor market shifting the composition of workers required to produce and deliver a product or services. There will be shifts in the kind of skills needed, faster rates of innovation and diffusion may also be associated with a higher turnover of jobs this may create more turbulence as workers will need to enhance their skill from time to time.
COMPETITIVE ENVIRONMENT: e-commerce will have a significant impact on the competitive environment because in e-commerce the entry cost is low and transaction costs are lower, it allows small entrepreneur to enter the market place easily. On the other hand e-commerce especially facilitates enterprises who’s success depends on network effects. These effects may create problems for competition and antitrust policy. Since e-commerce would transcend geographical boundaries many big firms of known brands may not only expand their markets but also may enter into new business activities this may help to reduce the cost and prices but it will create the danger of creating an e-commerce monopoly by a few corporation or networks of corporations many firms may use the low price strategy to grab the market and eliminate the competition.
IMPACT ON PRICES: e-commerce widely expected to improve efficiency due to reduce transactions and search costs, increase competition and more streamlined business processes lower search costs may also lead to internet consumers being more sensitive to price changes. By reducing search cost and increasing the flow of information e-commerce might effectively shift power from producers to consumers and make it harder for firms to maintain higher prices.
IMPROVING MARKETING AND SALES:
Product promotion. The existence of e-marketplaces has increased the promotion of products and services through direct marketing. Contact with customers has become more information rich and interactive.◗ New sales channel. Because of the direct reach to customers and the bidirectional nature of communications in EC, a new distribution channel for existing products has been created.◗ Direct savings. The cost of delivering information to customers over the Internet results in substantial savings to senders of messages. Major savings are realized in delivering digitized products (such as music and software) rather than physical ones.◗ Reduced cycle time. The delivery time of digitized products and services can be reduced to seconds. Also, the administrative work related to physical delivery, especially across international borders, can be reduced
28

significantly, cutting the cycle time by more than 90 percent. One example of this is Trade Net in Singapore, which reduced the administrative time of port-related transactions from days to minutes. Cycle time can be reduced through improvements along the supply chain (e.g., by using RFID).◗ Improved customer service. Customer service can be greatly enhanced by enabling customers to find detailed information online. For example, FedEx and other shippers allow customers to trace the status of their packages. Also, auto responders (see Chapter 11) can answer standard e-mail questions in seconds. Finally, human experts’ services can be expedited using help-deskSoftware.◗ Brand or corporate image. On the Web, newcomers can establish corporate images very quickly. What Amazon.com did in just 3 years took traditional companies generations to achieve. A good corporate image facilitates trust, which is necessary for direct sales. Traditional companies such as Intel, Disney, and Wal-Mart use their Web activities to affirm their corporate identity and brand image. Case A.1 demonstrates how one company uses personalization to bolster its image.◗ Customization. EC enables customization of products via the build-to-order process (see Appendix 2A). Buying in a store or ordering from a television advertisement usually limits customers to a supply of standard products. Dell is the classic example of customization success. Today, customers can configure not only computers but also cars, jewelry, shoes, clothes, gifts, and hundreds of other products. If done properly, a company can achieve mass customization that provides a competitive advantage and increases the overall demand for certainProducts and services. Customization is changing marketing and sales activities both in B2C and in B2B.
CONCLUSION:
As e-commerce grows, there will be important socio economic side effects. Although information technology has the potential to reduce disparities between nations, a symmetric access to its benefits by different sections of societies can have far reaching social and economic implications. our research suggest that e-commerce technologies are helping organizations societies and nations to accelerate their socio economic growth and to provide more opportunities for business to grow, but it has also created many challenges and effects across numerous domains of society and process many challenges for policy makers. In this paper we have identified a comprehensive set of socio economic variables that are influenced by e-commerce. Further imperial validation could be done for this variables in different countries.
BIBLIOGRAPHY
Gupta, JND and Sharma, SK cyber shopping in privacy
Chris G. Christopher Jr. is the director of U.S. macroeconomics and global consumer markets at the research and consulting firm IHS.
Source: Bloch, M., Y. Pigneur, and A. Segev. “Leveraging Electronic Commerce for Competitive Advantage: A Business Value Framework.”Proceedings of the Ninth International Conference of EDI-IOS, Bled, Slovenia, June 1996. Reprinted by permission of Yves Pigneur.Appendix A: Economics and Impacts of E-Commerce A-7.
29

NINE PILLARS OF DIGITAL INDIA
Mrs. Reeta KumariDepartment of Information TechnologyMrs. K.M. P. M. Vocational College, Jsr Email: [email protected]
The 21st century is an era of WWW that is internet. People are highly influenced by the digital gadgets like computers, laptops, mobile & smart phones etc. These gadgets are giving rise to eCommerce and on line transactions. To improvise these facilities Digital India is a campaign launched by the Government of India to ensure that Government services are made available to citizens electronically by improved online infrastructure and by increasing Internet connectivity or by making the country digitally empowered in the field of technology. It was launched on 1 July 2015 by Prime Minister Sri Narendra Modi. The initiative includes plans to connect rural areas with high-speed internet networks. So, we can see it as a programme to transform India into a digitally empowered society and knowledge economy. Digital India consists of three core components. These include: The creation of digital infrastructure, Delivery of services digitally & Digital literacy. The Government of India hopes to achieve growth on multiple fronts with the Digital India Programme. Specifically, the government aims to target nine 'Pillars of the Digital India' that can be introduced in different areas with electronic facilities. Overall Costs of Digital India is Rs 100,000 Cr in ongoing schemes (only DeitY, DOT & not incl. those in other line Ministries) & Rs 13,000 Cr for new schemes & activities. Although it looks very beneficial, same time it has several challenge like literacy problem, high cost, lack of resources like equipment, skilled manpower etc.
In this paper we are going to discuss the nine pillars of Digital India along with its advantages & challenges etc.
Keywords : internet, digital infrastructure, digital literacy, knowledge economy.
INTRODUCTION
Digital India is a program to transform India into a digitally empowered society and knowledge economy.
It is a program which will create all round development to the country. We all know that 21st century is an era of WWW that is internet. People are highly influenced by the digital gadgets like computers, laptops, mobile & smart phones etc. These gadgets are giving rise to e-commerce and on line transactions. The impacts of these electronic gadgets are changing the life styles of the people both in cities and villages. We can see various advertisements showing the people in remote areas are using 4G facilities of Airtel & Idea etc. Life is difficult to imagine without technology. In this scenario Digital India is a program launched by our honorable Prime Minister Sri Narendra Modi on 1 July 2015 with a motive “Power to Empower” [1]. In 21st century the most important technology is power of digitization, which will allow individual to communicate globally [2].
We find the new technology for nextGen services like Cloud Computing, Big Data, Green computing that are going to give remote services to far away areas, consumption of less electricity, Easy access of information through big data. These facilities should be applied for society, especially in villages. As we know India is a country of villages, so main center for digitization should be the villages and rural areas. The objective of the Digital India program is to connect rural areas with high-speed Internet networks and improving digital knowledge[3][4][5] of the people.
30

[2] VISION & PLANS OF DIGITAL INDIA PROGRAMME
The vision of Digital India programme is inclusive growth in areas of electronic services, products,
manufacturing and job opportunities etc. and it is centered on three key areas – Digital Infrastructure as a
Utility to Every Citizen, Governance & Services on Demand and Digital Empowerment of Citizens [6].
Bharat Broadband Network Limited (BBNL), an entity of the government of India which executes the
National Optical Fibre Network project will be the custodian of Digital India (DI) project. BBNL had
ordered United Telecoms Limited to connect 250,000 villages through GPON to ensure FTTH based
broadband. This will provide the first basic setup to achieve towards Digital India and is expected to be
completed by 2017 [1].
The government is planning to create 28,000 seats of BPOs in various states and set up at least one
Common Service Centre in each of the gram panchayats in the state [7].
The 2016 Union budget of India announced 11 technology initiatives including the use data analytics to nab
tax evaders, creating a substantial opportunity for IT companies to build out the systems that will be
required. Digital Literacy mission will cover six crore rural households [8]. It is planned to connect 550
farmer markets in the country through the use of technology [9].
One of the big problem in India is language. Out of 10% English speaking Indians, only 2% reside in rural
areas. Rest everyone depends on their vernacular language for all living their lives. However, as of now,
email addresses can only be created in English language. To connect rural India with the Digital India, the
Government of India impelled email services provider giants including Gmail, office and rediff to provide
email address in regional Languages. However, the email provider companies has shown positive sign and
is working in the same process [10]. An Indian based company, Data Xgen Technologies Pvt Ltd, has
launched world’s first free linguistic email address under the name ‘DATAMAIL [11] which allows to
create email ids in 8 Indian languages, English; and 3 foreign languages – Arabic, Russian and Chinese.
Over the period of time the email service in 22 languages will be offered by Data XGen Technologies [12].
[3] THE 9 PILLARS OF DIGITAL INDIA
The Government of India hopes to achieve growth on multiple fronts with the Digital India Programme.
Specifically, the government aims to target nine 'Pillars of the Digital India' that they identify as being: [13]
1. Broadband Highways
2. Universal access to Internet/phones
3. Public Internet Access Programme31

4. e-Governance – Reforming Government through Technology
5. e-Kranti - Electronic delivery of services
6. Information for All
7. Electronics Manufacturing target NET ZERO imports
8. IT for Jobs
9. Early Harvest Programmes.
BROADBAND HIGHWAYS
This covers three sub components, namely Broadband for All Rural, Broadband for All Urban and National
Information Infrastructure. Under Broadband for All Rural, 250 thousand village Panchayats would be covered by
December, 2016. DoT will be the Nodal Department and the project cost is estimated to be approximately Rs.
32,000 Cr. Under Broadband for All Urban, Virtual Network Operators would be leveraged for service delivery and
communication infrastructure in new urban development and buildings would be mandated. National Information
Infrastructure would integrate the networks like SWAN, NKN and NOFN along with cloud enabled National and
State Data Centres. It will also have provision for horizontal connectivity to 100, 50, 20 and 5 government offices/
service outlets at state, district, block and panchayat levels respectively. DeitY will be the nodal department and the
project cost is estimated to be around Rs 15,686 Cr for implementation in 2 years and maintenance & support for 5
years.
UNIVERSAL ACCESS TO MOBILE CONNECTIVITY
The objective is to connect each individual globally that is to focus on network penetration and fill the gaps in
connectivity in the country. All together 42,300 uncovered villages will be covered for providing universal mobile
connectivity in the country. DoT will be the nodal department and project cost will be around Rs 16,000 Cr during
FY 2014-18.
PUBLIC INTERNET ACCESS PROGRAMME
The two sub components of Public Internet Access Programme are Common Service Centres (CSCs) and Post
Offices as multi-service centers. Common Service Centers would be strengthened and its number would be
increased from approximately 135,000 operational at present to 250,000 i.e. one CSC in each Gram Panchayat.
CSCs would be made viable, multi-functional end-points for delivery of government and business services. DeitY
would be the nodal department to implement the scheme. A total of 150,000 Post Offices are proposed to be
converted into multi service centres. Department of Posts would be the nodal department to implement this scheme.
32

E-GOVERNANCE: REFORMING GOVERNMENT THROUGH TECHNOLOGY
e-Governance will transform all manual works into electronic . Government Business Process Re-engineering using
IT to improve transactions is the most critical for transformation across government and therefore needs to be
implemented by all ministries/ departments.
THE GUIDING PRINCIPLES FOR REFORMING GOVERNMENT THROUGH
TECHNOLOGY ARE:
Form simplification and field reduction – Forms should be made simple and user friendly and only
minimum and necessary information should be collected.
Online applications, tracking of their status and interface between departments should be provided.
Use of online repositories e.g. school certificates, voter ID cards, etc. should be mandated so that citizens
are not required to submit these documents in physical form.
Integration of services and platforms, e.g. UIDAI, Payment Gateway, Mobile Platform, Electronic Data
Interchange (EDI) etc. should be mandated to facilitate integrated and interoperable service delivery to
citizens and businesses.
Electronic Databases – all databases and information should be electronic and not manual.
Workflow Automation Inside Government – The workflow inside government departments and
agencies should be automated to enable efficient government processes and also to allow visibility of these
processes to the citizens.
Public Grievance Redressal - IT should be used to automate, respond and analyze data to identify and
resolve persistent problems. These would be largely process improvements.
e-Kranti - Electronic Delivery of Services
e-Kranti will fully focus on digital knowledge program, where eduction,health, farming, rights, farming and many
more services will be delivered on a very high bandwidth [2]. There are 31 Mission Mode Projects under different
stages of e-governance project lifecycle. Further, 10 new MMPs have been added to e-Kranti by the Apex
Committee on National e-Governance Plan (NeGP) headed by the Cabinet Secretary in its meeting held on 18th
March 2014. Few are:
33

Technology for Education – e-Education: All Schools will be connected with broadband. Free
wifi will be provided in all secondary and higher secondary schools (coverage would be around 250,000
schools). A programme on digital literacy would be taken up at the national level. MOOCs –Massive
Online Open Courses shall be developed and leveraged for e-Education.
Technology for Health – e-Healthcare: e-Healthcare would cover online medical consultation,
online medical records, online medicine supply, pan-India exchange for patient information. Pilots shall be
undertaken in 2015 and full coverage would be provided in 3 years.
Technology for Farmers: This would facilitate farmers to get real time price information, online
ordering of inputs and online cash, loan and relief payment with mobile banking.
Technology for Security: Mobile based emergency services and disaster related services would be
provided to citizens on real time basis so as to take precautionary measures well in time and minimize loss
of lives and properties.
Technology for Financial Inclusion: Financial Inclusion shall be strengthened using Mobile
Banking, Micro-ATM program and CSCs/ Post Offices.
Technology for Justice: Interoperable Criminal Justice System shall be strengthened by leveraging e-
Courts, e-Police, e-Jails and e-Prosecution.
Technology for Planning: National GIS Mission Mode Project would be implemented to facilitate
GIS based decision making for project planning, conceptualization, design and development.
Technology for Cyber Security: National Cyber Security Co-ordination Center would be set up to
ensure safe and secure cyber-space within the country.
INFORMATION FOR ALL
Websites and mobile apps will provide information to all. Open Data platform and online hosting of information
& documents would facilitate open and easy access to information for citizens. Government shall pro-actively
engage through social media and web based platforms to inform citizens. MyGov.in has already been launched as
a medium to exchange ideas/ suggestions with Government. It will facilitate 2-way communication between citizens
and government. Online messaging to citizens on special occasions/programs would be facilitated through emails
and SMSes. The above would largely utilize existing infrastructure and would need limited additional resources.
ELECTRONICS MANUFACTURING
Target NET ZERO Imports is a striking demonstration of intent.
This ambitious goal requires coordinated action on many fronts like Taxation, incentives, Economies of scale,
eliminate cost disadvantages etc. Its Focus areas are Big Ticket Items FABS, Fab-less design, Set top boxes,
34

VSATs, Mobiles, Consumer & Medical Electronics, Smart Energy meters, Smart cards, micro-ATMs, Incubators,
clusters, Skill development, Government procurement
There are many ongoing programs which will be fine-tuned.
Existing structures are inadequate to handle this goal and need strengthening.
IT FOR JOBS
Government is planning to provide training and teaching skills to youth to create job opportunities in IT sectors.
Under this project 1 Cr students from smaller towns & villages will be trained for IT sector jobs over 5 years.
DeitY would be the nodal department for this scheme. BPOs would be set up in every north-eastern state to facilitate
ICT enabled growth in these states. DeitY would be the nodal department for this scheme. 3 lakh service delivery
agents would be trained as part of skill development to run viable businesses delivering IT services. DeitY would be
the nodal department for this scheme. 5 lakh rural workforce would be trained by the Telecom Service Providers
(TSPs) to cater to their own needs. Department of Telecom (DoT) would be the nodal department for this scheme.
EARLY HARVEST PROGRAMMES
This program will include generation of short timeline projects to convert the manual services to e-Services. Few
are:
IT Platform for Messages: A Mass Messaging Application has been developed by DeitY that will
cover elected representatives and all Government employees. 1.36 Cr mobiles and 22 Lakh emails are part
of the database.
Government Greetings to be e-Greetings: Basket of e-Greetings templates have been made
available. Crowd sourcing of e-Greetings through MyGov platform has been ensured. E-Greetings
portal has been made live on 14th August 2014.
Biometric attendance: It will cover all Central Govt. Offices in Delhi and is already operational in
DeitY and has been initiated in the Department of Urban Development. On-boarding has also started in
other departments.
Wi-Fi in All Universities: All universities on the National Knowledge Network (NKN) shall be
covered under this scheme. Ministry of HRD is the nodal ministry for implementing this scheme.
Secure Email within Government: Email would be the primary mode of communication. Phase-I
upgradation for 10 lakh employees has been completed. In Phase II, infrastructure would be further
upgraded to cover 50 lakh employees by March 2015 at a cost of Rs 98 Cr. DeitY is the nodal department
for this scheme.
35

Standardize Government Email Design: Standardised templates for Government email are under
preparation and would be ready by October 2014. This would be implemented by DeitY.
Public Wi-fi hotspots: Cities with population of over 1 million and tourist centres would be provided
with public wi-fi hotspots to promote digital cities. The scheme would be implemented by DoT and MoUD.
School Books to be eBooks: All books shall be converted into eBooks. Min. of HRD/ DeitY would
be the nodal agencies for this scheme.
SMS based weather information, disaster alerts: SMS based weather information and disaster
alerts would be provided. DeitY’s Mobile Seva Platform is already ready and available for this purpose.
MoES (IMD) / MHA (NDMA) would be the nodal organizations for implementing this scheme.
National Portal for Lost & Found children:This would facilitate real time information
gathering and sharing on the lost and found children and would go a long way to check crime and improve
timely response. DeitY/ DoWCD would be the nodal departments for this project.
[4] SUPPORT FOR DIGITAL INDIA
At the launch ceremony of Digital India Week by Prime Minister Narendra Modi in Delhi on 1 July 2015 [14] top
CEOs from India and abroad committed to invest Rs.224.5 lakh crore (US$3.3 trillion) towards this initiative. The
CEOs said the investments would be utilitized towards making smartphones and internet devices at an affordable
price in India which would help generate jobs in India as well as reduce the cost of importing them from abroad
[15].
Leaders from Silicon Valley, San Jose, California expressed their support for Digital India during PM Narendra
Modi's visit in September 2015. Facebook's CEO, Mark Zuckerberg, changed his profile picture in support of
Digital India and started a chain on Facebook and promised to work on WiFi Hotspots in rural area of India. Google
committed to provide broadband connectivity on 500 railway stations in India. Microsoft agreed to provide
broadband connectivity to five hundred thousand villages in India and make India its cloud hub through Indian data
centres. Qualcomm announced an investment of US$150 million in Indian startups. Oracle plans to invest in 20
states and will work on payments and Smart city initiatives. However back home in India, cyber experts expressed
their concern over internet.org and viewed the Prime Minister's bonhomie with Zuckerberg as the government's
indirect approval of the controversial initiative. The Statesman reported, "Prime Minister Narendra Modi's chemistry
with Facebook CEO Mark Zuckerberg at the social media giant's headquarters in California may have been greeted
enthusiastically in Silicon Valley but back home several social media enthusiasts and cyber activists are
disappointed. Later the Prime Minister office clarified that net neutrality will be maintained at all costs and vetoed
the Basic Internet plans [1].
[4] Tech Relateted Announcement in Union Budget of 2017-18 [16]
36

Further in union budget of 2017 the Finance Minister Sri Arun Jaitley made 10 tech related announcements from
focus on making India a global hub for electronic manufacturing. He further said that the government will continue
to divest stakes in state-owned companies for financial year 2017-18. Two new schemes will be launched to push
the adoption of BHIM digital payment app. High Speed broadband on opticle fibre will be available in over 1.5 lakh
gram panchayats with hotspots and access to digital services at low tariffs. A “Digi Gaon” initiative will also be
launched to provide telemedicine, education and skills through digital technology. A computer emergency response
team will be established for financial sector to prevent the cyber crimes as cyber security is critical for the integrity
and stability of finance system. An Adhar-enabled payment system (AEPS) will be launched soon, which will
enable bank customers to access their Adhar-linked bank accounts through the Adhar authentication. AEPS will on
excluded segments to conduct banking transactions through micro ATMs in village. The no. of POS terminals will
be increased to 10 lakh unit by march 17. Adhar based smart cards will be provided to the senior citizens for their
health & well being. The pilot implementation will start off in 15 cities.
[6] CONCLUSION & FUTURE WORKS :
Gandhi said that the soul of India resides in villages. Looking back we find India was in her Golden Age when there
was a happy life in villages. With invent of foreigners the small industries and farms of villages were damaged and
growth of India slowed down. Now after the 70 years of independence things are slowly improving. Still the lives of
farmers are miserable. The Digital India is a Program by the government to improve the lives of the villagers by
making them digitally literate. But it is not a simple task.
First the Government should implement the educational plans to make the villagers literate so they will be able to
understand and use the digital devices and apply them to get the nextGen services like cloud & green computing. At
the same time projects should launched by the government through the NGOs, literate people and computer experts
to apply the services for society and give a foundation for “HAPPY INDIA” with Minimum facilities for all.
REFERENCES:
[1] http://makeinindia/Digital_India_-_Wikipedia.html
[2] Sudhir Ku. Sharma, Vandana Lama, Nidhi Goyal, “digital India : A Vision Towards Digitally Empowered
Economy”, in Indian Research Of Applied Research, Volume:5, Issue:10, October 2015, ISSN-2249-555X
[3] “DNA Webdesk” (28 September 2015), “Here's what you need to know about the Digital India initiative”,
Mumbai: Daily News and Analysis
37

[4] "Government School in Remote Bandahalli Village Gets Inspired by Digital India", The New Indian Express, 15
March 2016
[5] "Digital India Week: Digital Locker, MyGov.in, and other projects that were unveiled", The Indian Express, 5
July 2015
[6] "GST to take care of many of e-commerce firms' tax issues: IT minister", Live Mint, 21 November 2014
[7] "Under the Digital India initiative: Software Technology Park of India", The Indian Express, 28 February 2016
[8] "Budget 2016: Technology initiatives to boost Digital India drive", The Economic Times, 29 February 2016
[9] "Government aims to give 'Digital India' benefits to farmers: PM Modi", The Times of India, 18 February 2016
[10] "Vernacular Push: Govt. Wants Email Providers To Support Regional Email Addresses", Trak.in - Indian
Business of Tech, Mobile & Startups, 2016-08-01, Retrieved 2016-10-28
[11] "DataMail: World's first free linguistic email service supports eight India languages - The Economic Times" ,
The Economic Times, Retrieved 2016-10-28
[12]"Data Xgen Technologies launches email address in Indian languages", www.deccanchronicle.com, 2016-10-18,
Retrieved 2016-10-28
[13] Programme Pillars, Government of India
[14] "PM Narendra Modi invites tech enthusiasts for a 'Digital Dialogue'", The Times of India, 4 July 2015
[15] "Digital India: Top CEOs commit to invest Rs 4.5 trillion"
[16] www.indiatoday.intoday.in, 1 February, 2017
38

AN APPROACH OF MODEL DRIVEN DEVELOPMENT
Poonam Mishra Reeta KumariDepartment of Computer Application, Department of Information Technology,Mrs. K.M.P.M. Vocational College, Jsr Mrs. K.M.P.M. Vocational College, Js [email protected] [email protected]
ABSTRACTThe main aspect of model-driven-development is to move the focus from programming to modelling. In this paper
we explain MDD approach in terms of the major concepts, the premises, benefits and characteristics which derive its
adoption. It is a way of software development where primary software artifacts are models from which code and
other artifacts are generated. In this approach the developer design software to increase productivity and quality of
the system under development.
Keywords: Unified modeling language, DSLs, Meta model.
INTRODUCTION : Model-Driven Development (MDD) is software development process. It is an integrated approach to architecting,
developing, testing and deploying complex, high performance systems that specifies programs in domain specific
languages (DSLs). In this approach, software systems are documented and produced as models. MDD uses models
to represent a program. A model is written in a DSL that specifies particular details of a program’s design. As an
individual model captures limited information, a program is often specified by several different models. A model
can be derived from other models by transformations, and program synthesis is the process of transforming high-
level models into executables (which are also models) [1].
In a traditional software development process we generally start with gathering requirements for the
system that we want to develop. According to the list of requirements we specify a number of scenarios and use
cases to get a clear concept on the behaviour of the system. Then we can create an initial conceptual model
containing the classes of the system and their interrelations. The next step is to design a more detailed model, which
acts as a blueprint for the system under development; this model contains all attributes and methods of classes in the
system. At last, the blueprint model is used as a guideline to write the source code for the system.
In model-driven development (MDD) these steps are performed automatically. The UML(Unified
modelling language) is used to create models for MDD. These models have well defined semantics and can be
transformed into implementation of source code.
So in future , i will design UML for any abstract data type like linked list, stack and queue etc. Then it will proceed
for source code.
39

BASIC CONCEPTSMDD provides three main concepts. These are the model, the meta-model and the model transformation. All are
required for a proper MDD approach. We explain each of these concepts and how they are related to each other.
MODELSA system and a relation is known as the RepresentationOf relation between the system and a model. The system is
represented by a model, but it does not have to be a full description. A model is created with a particular goal in
mind and therefore only information necessary to achieve this goal is included in the model [2]: all other
information about the system is considered irrelevant. Models of software systems are often specified in the Unified
Modeling Language (UML) [3]. A UML class diagram is an example of a model of a software system, as shown in
fig 1.
Represented by
fig. 1.
CLASSIFICATION OF MODELS Models can be classified using different approaches:-
First classification approach is to make a distinction between specification models and description models The first
type of models is created before implementation of the system and is used to specify how the system under
development should look like when it is implemented. The implemented system is only considered valid if it
completely matches its specifications defined in the model where as description models are created to describe
existing systems. In this case the model is validated instead of the system under study. The model is valid if all its
statements are true for the described system.
Another classification approach is to distinct between sketchy models, blueprint models and executable
models In this approach sketchy and blueprint models can be used for both forward and reverse engineering.
Sketchy models for forward engineering are used to communicate ideas with other developers; they present a rough
sketch of some part of the system under development. Sketches therefore do not contain all the details of the system.
Blueprint models give the complete specification of a system. In forward engineering the blueprint model specifies
all details needed for a programmer to implement the system under development. Blueprint models for reverse
engineering completely describe (a part of) the existing system. The main difference between sketchy models and
blueprint models is that the former are aimed to be explorative, while the latter are definitive .Executable models are
directly compiled to executable code.
40
Model System
META-MODELSA specific kind of model is the meta-model. A definition of the concept meta-model, taken from [4] is given below.
A meta-model is a specification model for a class of systems where each system in the class is itself a valid model
expressed in a certain modeling language.
A metamodel is a model of a language that captures its essential properties and features. These include the language
concepts it supports, its textual and/or graphical syntax and its semantics (what the models and programs write).
It is the analysis, construction and development of the frames, rules, constraints, models and theories applicable and
useful for modeling a predefined class of problems. A meta-model typically defines the languages and processes
from which to form a model[11].
If we explain this definition, we can say that a meta-model is a model of a set of models. In this set all the models
are specified in a certain modeling language. i.e. , the UML meta-model is a model for all models that are specified
in the UML.
The two basic metamodeling relationships is shown in fig. 2.
Conforms to
Represented by
Fig. 2
A model represents a system and conforms to a metamodel
UML gives numerous options to developers for specifying software systems. A UML model can
graphically depict the structure and/or behaviour of the system under discussion from a certain viewpoint
and at a certain level of abstraction. It is used to generate code in various languages using UML diagrams.
There are two broad categories of diagrams and then are again divided into sub-categories:
1) Structural Diagrams
41
metamodeling
model
system

2) Behavioural Diagrams Structural diagrams represent the structures which are used extensively in documenting the software
architecture of software system.
The four structural diagrams are:
a) Class diagram
b) Object diagram
c) Component diagram
d) Deployment diagram
a) Class Diagram models class structure and contents using design elements such as classes,packages and
objects. It also displays relationships such as containment, inheritance, associations and others. Class diagrams are
the most common diagrams used in UML.class diagrams basically represent the object oriented view of a system
which is static in nature.
Class diagram represents the object orientation of a system. So it is generally used for development purpose. This is
the most widely used diagram at the time of system construction.
b) Object diagrams can be described as an instance of class diagram. So these diagrams are more close to real
life scenarios where we implement a system
c) Component Diagram: Component diagrams represent a set of components and their relationships. These components consist of classes,
interfaces or collaborations. So Component diagrams represent the implementation view of a system. During design
phase software artifacts (classes, interfaces etc) of a system are arranged in different groups depending upon their
relationship. Now these groups are known as components. Finally, component diagrams are used to visualize the
implementation.
d) Deployment Diagram: Deployment diagrams are a set of nodes and their relationships. These nodes are
physical entities where the components are deployed. Deployment diagrams are used for visualizing deployment
view of a system.
Behavioural diagrams represents the behaviour of the system which are used extensively to describe the
functionality of software system.
UML has the following five types of behavioural diagrams:
a) Use case diagram
b) Sequence diagram
c) Collaboration diagram
d) State chart diagram
e) Activity diagram
42

a) Use case diagrams are a set of use cases, actors and their relationships. They represent the use case view of a
system. A use case represents a particular functionality of a system.
So use case diagram is used to describe the relationships among the functionalities and their internal/external
controllers. These controllers are known as actors.
b) Sequence Diagram: A sequence diagram is an interaction diagram. From the name it is clear that the diagram deals with some sequences,
which are the sequence of messages flowing from one object to another.Interaction among the components of a
system is very important from implementation and execution perspective. So Sequence diagram is used to visualize
the sequence of calls in a system to perform a specific functionality.
c) Collaboration Diagram: Collaboration diagram is another form of interaction diagram. It represents the structural organization of a system
and the messages sent/received. Structural organization consists of objects and links.
The purpose of collaboration diagram is similar to sequence diagram. But the specific purpose of collaboration
diagram is to visualize the organization of objects and their interaction.
d) State chart Diagram: Any real time system is expected to be reacted by some kind of internal/external events. These events are
responsible for state change of the system. State chart diagram is used to represent the event driven state change of a
system. It basically describes the state change of a class, interface etc. State chart diagram is used to visualize the
reaction of a system by internal/external factors.
e) Activity Diagram: Activity diagram describes the flow of control in a system. So it consists of activities and links. The flow can be
sequential, concurrent or branched.
Activities are nothing but the functions of a system. Numbers of activity diagrams are prepared to capture the entire
flow in a system.
Activity diagrams are used to visualize the flow of controls in a system. This is prepared to have an idea of how the
system will work when executed.
MODEL TRANSFORMATIONSModels can be transformed into other models using model transformation. Model transformations are the key
challenge in MDD, because it generate source code from higher-level models. At higher levels of abstraction, these
transformations between models can become very complex.
In the introduction of this chapter we described the traditional process of software development. If we
would use MDD for this process, we would at least need four types of models: - a list of requirements, a conceptual
model, a blueprint model, and the source code and three transformations. The process starts with a model at a very
high level of abstraction i.e. the requirements and transforms these into models of lower level of abstraction i.e. up
to source code.
43

Model transformations take at least one model as input to produce at least one output model, but it is also possible to
have multiple inputs or output models [6]. Meta-models of the input and output models are needed to specify
transformations between two models. The transformation between the source model and target model is defined in a
number of transformation rules that make use of the meta-models of both the source and target model. These rules
are specified in a transformation language and conform to a certain meta-model. The transformation rules are also a
model, not of the software system, but of the transformation between a source and target model.
There are three different architectural approaches for defining transformations-
the direct model manipulation approach, the intermediate representation approach, or the transformation language
support approach.
Direct Model Manipulation – With the help of this tool users access to an internal model representation and the
ability to manipulate the representation using a set of procedural APIs.
Intermediate Representation – the tool can export the model in a standard form, typically XML. An external tool can
then take the exported model and transform it.
Transformation Language Support – the tool offers a language that provides a set of constructs or mechanisms for
explicitly expressing, composing and applying transformations.
BENEFITS OF MODEL-DRIVEN DEVELOPMENT The advantages of an MDD approach are as follows:
1. Increased productivity: MDD reduces the cost of software development by generating code and artifacts from
models, which increases developer productivity.
2. Maintainability: In MDD high-level models are kept free of irrelevant implementation detail. These
implementation details make it easier to handle changes its technical architecture. A change in the technical
architecture of the implementation is made by updating a transformation. The transformation is reapplied to the
original models to produce implementation an artifact following the new approach.This flexibility also means that it
is possible to try out different ideas before making a final decision.
3. Decrease of development time: Since most of the code is generated instead of implemented manually, which
decreases development time.
4. Reuse of legacy: You can consistently model existing legacy platforms in UML.
If there are many components implemented on the same legacy platform, you
can develop reverse transformations from the components to UML. Then you
have the option of migrating the components to a new platform .
5. Adaptability: Adaptability is a key requirement IT systems. When adding or modifying new function, we only
develop the behaviour specific to that capability. The remaining information needed to generate implementation
artifacts was captured in transformations.
6. Raise of abstraction: When the developers design the application, the abstraction hides implementation details
from developers, which leads to a reduction of complexity of the software artifacts that developers use to design the
44

application. Since current platforms and frameworks are getting more and more complex, this reduction is most
welcome [8].
7. Consistency: Manually applying coding and architectural decisions is an error prone activity. MDD ensures that
artifacts are generated consistently.
CHARACTERISTICS OF MODELThe following five key characteristics of an effective model are : -.
Abstraction: Abstraction is the most important attribute of a model .Through abstraction a model hiding detail that is
irrelevant for a given view point. Software systems get more and more complex; if models hide the complexity of
the underlying system, the developers get a better overview on the system’s functionality, which gives higher quality
and productivity.
Understandability : Just hiding non-relevant information is not enough, a model should present its contents in a clear
and understandable way. Models can be presented in both textual and graphical form. Usually system requirements
are presented in structured text documents, while an object model of a software system is often in the form of a
graph [7].
Predictiveness: The model should present the system in such a way that it is possible to correctly predict the
system’s non-obvious characteristics.
Accuracy: The important features of the modelled system should be represented accurately
in the model.
Inexpensiveness: A model should be significantly cheaper to construct than the actual system.
EVOLUTION OF MODEL DRIVEN DEVELOPMENT Model-Driven Development (MDD) is software development process. Software systems need to evolve and systems
built using model-driven approaches are no exception .The development and maintenance effort can be reduced by
working at the model instead of the code level. Models define what is variable in a system, and code generators
produce the functionality that is common in the application domain.
Software systems are continually required to increasing demands of correctness. To achieve these requirements,
software development has evolved into a process of reusing existing software rather than constructing a new
software system completely [9].
Its require various types of evolution: -
In regular evolution, the modeling language is used to make the changes. In meta-model evolution, changes are
required to the modeling notation. In platform evolution, the code generators and application framework change to
reflect new requirements on the target platform. Finally, in abstraction evolution, new modeling languages are added
to the set of (modeling) languages to reflect increased understanding of a technical or business domain [10].
CONCLUSION
45

In this paper we presented the applicability of model-driven development to increase productivity of the software
development process of small and simple endeavour applications. As this type of application is mainly data-driven,
it can be used as a model an initial model. It can also be concluded the features that we described will be useful for
initial stage researcher.
REFERENCES[1] Salvador Trujillo, Don Batory and Oscar Diaz. “Feature Oriented Model Driven Development” , University of
the Basque Country, Spain, pages 1- 6, 2007.
[2] Maarten Schilt, “Applying Model-Driven Development to Reduce Programming Efforts for Small Application
Development” , Delft University of Technology Delft, the Netherlands , pages 15- 21.
[3] Object Management Group. The Unified Modeling Language 2.0. http://www.
uml.org.
[4] Ed Seidewitz. What Models Mean. IEEE Software, 20(5):26–32, 2003.
[5] Jean B´ezivin. In Search of a Basic Principle for Model Driven Engineering. Upgrade, V(2):21–24, April 2004.
[6] Shane Sendall and Wojtek Kozaczynski. Model Transformation: The Heart and Soul of Model-Driven Software
Development. IEEE Software, 20(5):42–45, 2003.
[7] Maarten Schilt, “Applying Model-Driven Development to Reduce Programming Efforts for Small Application
Development” , Delft University of Technology Delft, the Netherlands ,pages 16-21.
[8] Peter Swithinbank, Mandy Chessell, Tracy Gardner, Catherine Griffin, Jessica Man, Helen Wylie and Larry
Yusuf , “Patterns: Model-Driven Development Using IBM Rational Software Architect ”, International Technical
Support Organization , pages 7-14, December 2005.
[9] Fei Cao, “MODEL DRIVEN DEVELOPMENT AND DYNAMIC COMPOSITION OF WEB SERVICES ”,
BIRMINGHAM, ALABAMA, pages 1- 6, 2005.
[10] Arie van Deursen, Eelco Visser, Jos Warmer, “Model-Driven Software Evolution” , Delft University of
Technology Delft, The Netherlands, pages 1- 5 .
[11] Warsaw, “Modeling and metamodeling in Model Driven Development ” , Gonzalo Génova, pages 3-9, 2009.
46

USE OF METAPROGRAMMING IN MODEL DRIVEN DEVELOPMENT
Poonam Mishra, Reeta kumari
Department of Computer Science,Mrs. K.M.P.M.Vocational College, Jsr ABSTRACT:
Metaprogramming is the process of specifying generic software template which can automatically produce new software components. It is a special kind of programming to achieve higher productivity in system development which produces better software products. It plays an important role of creating software artefacts automatic the production of domain solution. In this article we explain evolution of metaprogramming, different views on metaprogramming, how it is used in Model driven development and to show how it helps to generate automated code for user. It is very powerful concept in MDD in terms of software automation.
Keywords: Metaprogramming, MDD, metamodel, metalanguage , DSL
[1] INTRODUCTION
Meta means higher level. So Metaprogramming is a higher-level programming technique which is used to extend the boundaries in constructing programs automatically.
So according to the above definition we follow two observations: -
1. Meta-programming cannot be developed without knowing the basics of programming.
2. It deals with automatic programming also known as program generation.
In the simplest way we can say that programming is the process of writing programs for a computer system. Then it can be described as a transformation of given task into the executable specification which is known as computer program.
Here we are going to focus on two aspects only:
1. On the program structure
2. On the execution process of a program
According to Wirth [1] programs using formula
Program = data structure + algorithm ----------------- --------------------- (1)
This formula is very simple. We can reformulate this formula in another way :When a program is executed, a program performs data manipulations on the input data, that is, transforms the input data into the output data. The transformation process is performed according to the rules specified by operations of an algorithm. With respect to the second aspect, the symbol ‘+’ in formula(1) denotes manipulations. In that sense, programming is a
47

process of writing programs and then automatic solving of various computational and other tasks resulting in creating the output data as a solution of the task.
[2] VIEWS OF METAPROGRAMMING :
We cannot imagine metaprogramming without knowing programs. That is it is an extension of programs . The extension includes two views to generalization:
1. Generalization of an algorithm
2. Generalization of data
Generalization of data means : what are data, in what aspects are they different from programs and in what aspects are they similar to them? Data and programs are syntactically pre-specified sets of symbols from the same alphabet arranged according to some predefined order of grammar. That means, programs and data are not very different.
Therefore above discussion , we conclude two important facts:
1. Program is some generalization of data.
2. In order to manipulate a program as a generalization of data, we need to generalize an algorithm too and to use a meta-algorithm rather than an algorithm.
Now we can apply the stated facts to the introduced formula (1), in the form of meta-programming. We can rewrite formula (1) in the following way:
Meta-program = program + meta-algorithm (2)
Here, the term ‘meta-algorithm’, means the higher-level algorithm, is used in the sense of generalization of an algorithm. The term ‘program’ is used in the sense of the data generalization. The symbol ‘+’ has the meaning ‘higher-level program manipulations.
[3] EVOLUTION OF METAPROGRAMMING
Meta-programming was started to the EDVAC computer in the 1940s [2]. The new idea developed in the EDVAC’s design was to store data and programs in the same memory space. This allowed manipulating programs in the same way as data at run time. After a long time the modification of program code at run time started by an external program such as a compiler .
In 1959, the Share 709 system (a suite of system software for the IBM 709 computer) introduced the idea of programmer macros as a sequence of computing instructions available in a single program statement. The aim of macros was to save time and avoid errors in writing a sequence of instructions that repeats often in a program [3].
48

The IBM/360 system with a high-level programming language PL/1 has been developed in 1966. This language had the pre-processing capabilities to modify the source code before translation.
Now meta-programming introduced the idea of frame languages developed by Minsky for knowledge representation [4]. In this language, the data is represented in terms of units, called frames. Frames contain not only information about the problem domain but also knowledge about the stored data.
After that various metaprogramming has been introduced such as formal metaprogramming, template metaprogramming, generative metaprogramming etc.
[4] MODEL DRIVEN DEVELOPMENT TO METAPROGRAMMING
We use feature-based models to describe and represent a domain model and problem domain tasks. The reason is that feature models are suitable to express, analyse and configure variability and commonality [5] of domain tasks to be implemented using meta-programming.
Feature diagram represents three important items: problem domain (left branch), solution domain (right branch) and the result of their linking, that is, the developed meta-program. In both domains there are three levels of abstraction. They are meta-model, model and instance. By the problem domain, we mean abstractions used to represent domain models. By the solution domain, we mean meta-programming abstractions (languages and meta-models, models, etc.).
The main point of the model-driven analysis of meta-programming is that how meta-programs should be developed using a transformative approach. The process is interpreted either as horizontal or vertical transformation. The horizontal transformation is to achieve the abstract goal (i.e. to check a possibility to combine domains) at the highest abstraction level. If, at this abstraction level, there is not enough information about the model elements to derive transformation rules to perform the horizontal transformation, a meta-designer needs to go through vertical transformations to lower the abstraction level by introducing more details within the model representations.
[5] CONCLUSION
Code reuse is the main feature of metaprogramming. So, We conclude that it will be useful to generate automated code in GUI environment for different common applications which will help the user by providing user friendly environment.
49

(REFERENCES
Wirth N (1976) Algorithms C data structures D programs. Prentice Hall, Englewood Cliffs.
Templ J (1995) Metaprogramming in Oberon. Ph.D. dissertation, ETH Z¨urich.
Greenwald ID, Kane M (1959) The share 709 system: programming and modification. J ACM 6(2):128–133..
Minsky M (1975) A framework for representing knowledge. In: Winston PH (ed) The psychology of computer vision. McGraw-Hill, New York .
Coplien J, Hoffman D, Weiss D (1998) Commonality and variability in software engineering. IEEE Softw 15:37–45 .
50

DYNAMIC SOFTWARE PRODUCT LINE: AN APPROACH TO DYNAMIC BINDING
Reeta Kumari Department of Information Technology Mrs. K.M.P.M. Vocational College. Jsr [email protected]
Abstract: Dynamic Software Product Lines (DSPLs) are emerging as a latest methodology to develop software for Service Based System, Self Adaptive Systems, Self Managed Systems, Autonomous Systems etc which require runtime capabilities for flexible adaptation, reconfiguration, and post-deployment activities. The traditional Software Product Lines are unable to provide these facilities due to their static binding nature. Being a new technology with high post deployment activities DSPLs are facing several challenges and they are still not having a very mature architecture. This paper describes about the features of DSPLs that that make it a suitable for runtime or dynamic binding. The paper includes definition, evolution, development methodology, architecture, application areas of DSPLs highlighting its niche for dynamic binding.
Keyword— Dynamic Software Product Lines; Dynamic Binding; Adaptive Systems
INTRODUCTION
As software systems become increasingly dynamic and complex, configuration management must keep pace with a host of changing requirements and context-awareness demands. The cost of explicitly identifying and managing all possible feature configurations in such dynamic systems becomes complex as the designers cannot always pinpoint alternatives early on [1]. So there has been increasing demand for the postponement of decision on software adaptation and product variations to provide the flexibility required by dynamic environment and users [2]. Consequently, systems must be able to react to changes and adjust their behavior as they execute. In other words runtime adaptation is rapidly becoming essential to software system design.
A research theme that addresses development issues for reusable and dynamically reconfigurable core assets has emerged and it is called Dynamic Software Product Line with its consequential need to manage runtime variability [2].
Definition: DSPLs are Software Product Lines, which support late or runtime variability that is built into the system to address requirements that change at runtime [3]. DSPL focuses on the development of software products that can be adapted at runtime depending on the requirements of the users and the conditions of the environment [4]. DSPLs integrate the concepts of Software Product Lines (SPLs) and adaptive systems by extending existing product line engineering approaches by moving their capabilities at runtime [5].
EVOLUTION OF DSPLSince last 20 years Software product Lines have been used successfully in industry for building families of systems of related products, maximizing reuse, and exploiting their variable and configurable options. A static or traditional software product line is mainly targeting the variability at the development time. SPL is basically proposed in order to cut down the costs and reduce the time-to-market. By the use of commonalities and variability management,
51

products are selected from a set of features. These features are selected at different binding times. The features that will be used at runtime will be postponed till the end of the product cycle to get bound. Once the product is released from the SPL, it has no connection with it, i.e. no automated activity is specified in the SPL in order to keep the features updatedNewly introduced technologies such as ubiquitous computing, service robotics, unmanned space and water explorations, etc. are facing pressure in producing economically high quality software on time [6]. Such technologies are dependent on collecting the inputs through sensors that vary dynamically and adapting themselves to variation in requirements at runtime. Therefore, there is a need for a DSPL that gets software done with a high capability in adapting itself according to the users’ needs and resource limitations.A dynamic software product line targets the variability at the runtime of a system by binding variation points at runtime according to the changes in the environment. In other words, for the generated products in a SPL, binding features could be accomplished at any time, either at design time, compile time, configuration time or runtime. On the other hand, DSPL aims to create products that are configurable at runtime. The products also will have the capability to reconfigure themselves and gain advantage from constant updates. So they are capable to fulfill the needs of modern software requirements partially or fully [6].The main difference between the DSPL and SPL is that product functionalities could change automatically without any human intervention in DSPL.
1.PROPERTIES & LIFE CYCLE
DSPLs has the following properties [7] which make them different from SPLs:
A Runtime variability support and management: A DSPL must support the activation and deactivation of features and changes in the structural variability that can be managed at runtime. Dynamic variability should also encompass runtime reconfiguration property.Example: Automated transportation systems or Wireless Sensor Networks are application domains where new system features can be changed or reconfigured dynamically, which has a clear impact in the structural variability and state for variability models to handle such changes at runtime.
B. Multiple dynamic binding: A DSPL requires multiple binding times in place of one single binding time, as and when the software adapts its system properties to a new context, features can be bound several times and at different binding times (e.g., from deployment to runtime). Post-deployment capabilities might also need late binding.
Example: Systems that change their status dynamically (e.g., critical systems) and those that match to different services at runtime (e.g., services bound dynamically) demand more than one binding time (e.g., from configuration to execution time).
C. Context-awareness and self-adaptation for autonomic behavior: Dynamic SPLs must handle context-awareness properties that are used as input data to change the values of system variants dynamically and/or to select new system options depending on the conditions of the environment. The information that often changes in a DSPL is used to make new decisions or to select different system options on-the-fly. Run-time decisions often rely on context information, quality levels demanded by the running software, and user preferences among others. This context knowledge should be used in conjunction with adaptation mechanisms, context profiles, and data gathered during the execution of the system in order to select the best choices. Example: Self-adaptive systems or smart home systems are clear example where context properties drive the behavior of the systems dynamically. Also, autonomous robots exploit context information to adapt its behavior to varying conditions. DSPL utilizes part of SPL infrastructure to adapt at runtime, hence like SPLs it also has dual life cycle [7] as shown in Fig 1.
52

Fig.
53
Product reconfigura
tion, testing &
Product Implementation
Product Design &
Product Analysis & runtime requirement
FM & reconfigurabl
e
DSPL reconfig
urable products
DSPL runtime architecture variability
Domain & context Analysis
Context
Post deploy
ment & reconfiguration
DL PRODUCTS
Runtime changes runtime checking/testing/reconfiguration

Fig. 1. Dual Life Cycle of DSPL
It has two phases in its development:A. DSPL runtime Domain EngineeringB. DSPL runtime Application Engineering
For traditional SPLs the terms domain engineering refers to the creation of assets, whereas application engineering refers to the process of using those assets in order to build individual software products [4].
Based on the challenges to face, the organization of a DSPL varies slightly from the traditional SPL dual-lifecycle including new activities supporting the runtime nature of DSPL assets and products [7], as given in Fig. In the DSPL runtime domain engineering phase, the traditional domain analysis activity is extended with a context analysis task, in which we identify not only the asset requirements and family member features but also those context-aware properties relevant for needed DSPL products. Therefore, context variability and context-specific features are identified during the initial modeling phase. Also, multiple binding times and rebinding options of features can be defined as properties in the feature model, as well as the valid states for those context features. The runtime software architecture should include all those mechanisms able to handle the dynamic changes of DSPL assets and products, the activation and deactivation of features dynamically and the possible modification of the structural variability at runtime. This architecture should lead to the implementation of those reconfigurable and non-reconfigurable assets that will be tested at the end of the line, as well as the validity of the feature model. All these assets will populate the DSPL repository for the subsequent phase. During the DSPL runtime application engineering phase, runtime and non-runtime requirements drive the construction of DSPL family members. The runtime DSPL architecture will be customized alongside the feature model to produce the DSPL products that will exhibit the reconfigurable characteristics required. Once products are tested, configured, and deployed, if a new software configuration (e.g., due to the activation of new features, changes in the quality level of the system, or the selection to new services) is required at runtime, our DSPL dual lifecycle support encompasses post-deployment and reconfiguration task for handling all these changes. In some cases, certain runtime checking, testing and monitoring, and reconfiguration operations have to be made after the product is re-redeployed before it goes to its normal operational mode. Feedback from this task populates again the DSPL repository. As a result, these new activities extend the traditional application engineering phase with new post-reconfiguration tasks that are performed dynamically.
I. ARCHITECTUREAs we have seen DSPL aims to create products that are configurable at runtime [6]. The products also will have the capability to reconfigure themselves and gain advantage from constant updates. A configurable product (CP) is that produced from a DSPL and it is similar to the one produced from a traditional SPL [8]. However, the reconfiguration ability implies the usage of two artifacts to control it: the decision maker and the reconfiguration.
The decision maker's task is to retrieve the environmental changes that suggest modification such as external sensors or users. Such information is then analyzed and the appropriate actions are chosen to be carried out. The reconfigurator's mission is to execute such changes by the use of the standard SPL runtime binding.
There are two types of DSPLs.
A. Connected DSPL
The DSPL is in charge of the product adaptation. It means the DSPL is responsible for the product adjustments. Updates are the task of the DSPL to be sent to the products attached to it. It works when the CP senses new environmental changes [8]. It sends such collected data to the DSPL in charge, which in turn starts processing the sent information and calculates the variations that could be done. If the changes do not apply to any variant, the
54

process fails and the adaptation may not be completed. If the changes are applicable, the updates and the configurations are sent to the CP after they get generated. Finally the CP updates itself.
B. Disconnected DSPL
The CP itself is in charge of the adaptation once the product is released. The DSPL produces artifacts that have the capability to configure themselves to deal with contextual changes. It works when the CP senses changes. This time the CP calculates the changes that are required to be done without contacting the DSPL. If there is no configuration that suits the requirements, the adaptation process fails. The CP reconfigures itself to the new adaptations if there is a generated configuration [8].
2.APPLICATION DOMAINS
The various application domains where DSPLs [7] can be proved to provide better results are:
A. Service-oriented systems: Service-based and cloud systems are driving the SaaS (Software-as-a-Service) trend to provide flexible and low cost services to replace part of the core functionality of systems. Customizable services often rely on quality factors and other context properties (e.g., the user selects a new service as a configurable option in a mobile device), and software variability can help to make better decisions during the selection of a new service. Context-aware service engineering becomes an essential part of modern service computing as it can be extensively used to control the behavior of services.
B. Mobile software: Another application domain suitable for implementing runtime variability using a DSPL is the large variety of mobile software products that currently exist in the market. The increasing trend of the customers that use smart phones is to connect to Internet services is pushes to download and use more and more third party applications (e.g., downloaded from Google Play Store) and other services (e.g., News, Weather, Navigation, Maps, etc.). Smart phones and other related products increase user experience and satisfaction as they allow a high degree of personalization, as users can customize many of the services and applications installed in the device (e.g., profile configuration of latest WhatsApp versions).
C. Ecosystems: Successful software product lines experience an expanding scope in terms of products, features and customer bases. The scope of a software product line typically evolves because it receives broader adoption within the company. This may be extended and expanded at the organizational boundary. The product line architecture and shared components typically referred to as the platform, can also be made available to parties external to the company. Once the company decides to make its platform available outside the organizational boundary, the company transitions from a software product line to a software ecosystem.
D. Autonomous and self-adaptive systems: Self-adaptive systems or smart home systems are clear example where context properties drive the behavior of the systems dynamically. Also, autonomous robots exploit context information to adapt its behavior to varying conditions. Other systems like mobile devices exploit location properties or user preferences to configure the device to different user needs.
E. Business System: Although very little work is done for application of DSPLs in business systems involving the daily transaction due to its high cost for post-deployment activities, it can give fruitful profits if applied properly. All business systems are open systems which get affected by the external factors. The solutions generally include for the
55

problems which are already experienced (historical). When a new challenge comes, it becomes a problem. Use of DSPL methodology will help a lot to adapt the business systems in these scenarios.
F. Related WorksSome of the work in the area is: -Cetina et al. (2009-10) used PervML, a domain specific language for reconfiguring a smart home using DSPL.-Hallstein et al. (2008) gave the idea of application of DSPL in ubiquitous computing, Robotics, life support services etc.-Abbas et al. (2011-12) discussed automatic product evolution by enhancing self adaptation in embedded systems.
II. Tools for Runtime ImplementationWe have various approaches to implement SPLs. Like Feature-oriented Programming, Aspect-oriented Programming (AOP), Delta-oriented Programming (DOP) etc. A study of these approaches is summarized below:
A. Feature-oriented programming: FOP is a programming paradigm where source code is decomposed for each feature.
B. Aspect-oriented Programming: AOP provides a new construct, an aspect, to modularize crosscutting concerns in code. There are two types of crosscutting concerns: dynamic and static. In dynamic crosscutting, behavior is modified by augmenting or replacing the core program execution flow in a way that cuts across modules. In static crosscutting, modifications are made to the static structure of the system.
C. Delta-oriented programming: DOP is proposed as a novel programming language approach. In this approach a product line is represented by a core module and a set of delta modules. The core module provides an implementation of a valid product that can be developed with well-established single application engineering techniques. Delta modules specify changes to be applied to the core module to implement further products by adding, modifying and removing code. Application conditions attached to delta modules allow handling combinations of features explicitly. A product implementation for a particular feature configuration is generated by applying incrementally all delta modules with valid application condition to the core module [9].
3. Conclusion and Future WorkDSPLs are emerging technology to deal with the runtime variability, automatic adaptation to build self adaptive systems. Its architecture and approach is different from traditional SPLs to support dynamic binding. It is mostly used in Service Oriented Systems. Due to high expenses for implementation of runtime variability mechanism it is not widely used in business applications. As we have seen use of DSPLs can allow the systems to deal with uncertain situations. Hence they can be used in complex areas of the business which are affected from external factors. Future research is still necessary to recognize the business areas as an application for DSPL and provide more efficient mechanisms able to manage the dynamic and adaptive characteristics of modern business software and also to determine how systems can be deployed and re-deployed automatically using variability mechanisms and multiple binding times, reducing the effort required by systems engineering operations.
REFERENCES
[1] Luciano Baresi, Sam Guinea, Liliana Pasquale, “Service-Oriented Dynamic Software Product Lines”, Politecnico di Milano, Italy, 2 Lero—the Irish Software Engineering Research Centre, vol. 15, issue 10, pp. 42-48, 2012
56

[2] Nelly Bencomo, Jaejoon Lee, Svein Hallsteisen, “How dynamic is your Dynamic Software Product Line”, Computing Department, Lancaster University, United Kingdom, SINTEF ICT, Norway.
[3] Tom Dinkelaker, Ralf Mitschke, Karin Fetzer, Mira Mezini, “A Dynamic Software Product Line Approach using Aspect Models at Runtime”, Technische Universität Darmstadt, Germany, SAP Research Dresden, Germany, 2010.
[4] Carlos Parra, “Towards Dynamic Software Product Lines: Unifying Design and Runtime Adaptations”, Software Engineering, Universite des Sciences et. Technologie de Lille - Lille I, 2011
[5] Lorena Arcega, “Achieving Run-time Evolution of Dynamic Software Product Lines through a Variability Modeling Approach”, FOSD 2015, pp. 3-31.
[6] Mostafa Hamza, “Feature-based Generation of Pervasive Systems’ Architectures Utilizing Software Product Line Concepts”, The American University in Cairo, September, 2011.
[7] Rafael Capillaa, Jan Boschb, Pablo Trinidadc, Antonio Ruiz-Cortésc, Mike Hinchey, “An overview of Dynamic Software Product Line architectures and techniques: Observations from research and industry”, Journal of Systems and Software, Volume 91, May 2014, pp. 3–23
[8] Rey Juan Carlos University, Madrid, Spainb Chalmers University of Technology, Gothenburg, Swedenc University of Seville, Seville, SpaindLero – The Irish Software Engineering Research Centre, Limerick, Irelanda.
[9] C. Cetina, P. Trinidad, V. Pelechano, A. Ruiz-Cortés. "An architectural discussion on DSPL", in proc. 2nd
International Workshop on Dynamic Software Product Lines, DSPL 2008.
[10] Ferruccio Damimani, Ina Schaefer, Luca Padovani “A Formal Foundation for Dynamic Delta-Oriented Programming”, Proceedings of the 11th International Conference on Generative Programming and Component Engineering, ACM SIGPLAN Notices - GPCE '12 . Vol. 48 Issue 3, March 2013 Pages 1-10.
57

BIOMETRICS IDENTIFICATION TECHNIQUE FOR INTERFERENCE DETECTION SYSTEMS.
Ajay Kumar Pathak,Asst. Prof Mrs.KMPM Vocational College. Jsr [email protected],
ABSTRACT: Identifying an enemy committing fraud is a major fear to all business, schools, colleges, organizations, governments etc. Recently, the most used applications for prevention or detection of enemy committing fraud are interference detection systems. Biometrics technology is simply the measurement and use of the unique characteristics of living humans to distinguish them from one another and it is more useful as compared to passwords and symbols, sign, indication, signal, hint as they can be lost or stolen, so we have to opt the technique biometric authentication. The biometric authentication provides the ability to require more request of authentication in such a quick and easy manner that users are not disturbed by the additional requirements. In this paper, I have prearranged a brief introduction about biometrics. Then I have prearranged the information regarding the interference detection system and finally I have proposed a method which is based on fingerprint recognition which would allow us to detect more efficiently any misuse of the computer system that is running.
KEYWORDS: Interference detection, Key press, Biometrics, Palm Print, Ear, Gait (way of walking), Authentication.
INTRODUCTION
In the current scenario, the word “biometrics” comes from the Greek language and is derived from the words bio (life) and metric (to measure), one of the main fears of the IT system and security environment can have is the possibility of burglary in the system. This is normally solved by user authentication schemes based on passwords, secret codes and identification cards or symbol. Schemes based only on passwords or secret codes can be cracked by seize the presentation of such a password or by creature force attacks. On the other hand, a burglar can attack systems based on identification card or symbol by cheating, copying or fake them. As it is a well-known, biometric deal with identification of individuals based on their physical and behavioral features. Biometric solutions, such as identification systems using Palm Print, Ear, gait, fingerprint, iris, face, hand geometry and signature, etc.; have many advantages over the traditional authentication techniques based on what you know or what you possess. In its place of
58

carrying nonsense of keys, all those access cards or passwords you carry around with you, your body can be used to uniquely identify you. Among them, iris recognition is tested as the most accurate manner of personal identification. Therefore in the current scenario many automatic security systems based on iris, palm print, ear, and gait (way of walking) recognition have been installed worldwide for border control, restricted access and so on. This paper represents the comparison about recognition of a person using a number of biometric systems available, after studying a number of papers, articles, conference paper and real facts.
THE RESEARCH AIM:-
The present study aims to identifying an enemy committing fraud which is a major fear to all business, schools, colleges, organizations, governments etc. And to find ways to prevent such fraud.
OBJECTIVES OF THE STUDY:- 1. To identifying an enemy committing fraud.2. Find ways to protect information, data safe from piracy duplication or cyber fraud.
RESEARCH DESIGN:
Identification method Verification mode. Identification mode. Working theory of biometric system. Types of biometrics and applications of biometrics in forensic investigation. According to physiological biometrics. According to behavioral biometrics Challenges in biometric authentication. Conclusion.
IDENTIFICATION METHODS: As there exist so many number of identification methods. According to my knowledge I have categorized identification methods in two parts (a) Non Biometric Based (b) Biometric Based.
Non Biometric Based: - The non-biometrics systems includes password, keys, signature which can be taken or copied easily.Biometric Based :- The biometric based systems include palm print, ear, iris, face, gait (way of walking), fingerprint and so on, which is very difficult to copy.
VERIFICATION MODE:In the verification mode, the system confirms a person’s identity by comparing the captured biometric data with her own biometric model(s) stored in the system database. In such a data base system, a person
59

who desires to be recognized, declare an identity, generally via a Mobile number, PIN (Personal Identification Number), user name, smart card, etc., and the system identify a one-to-one comparison to resolve whether the declare is true or not. Identity verification is normally used for positive recognition, where the aim is to prevent multiple people from using the same identity.
IDENTIFICATION MODE:
In the identification mode, the system identifies a person by searching the pattern of all the users in the database system for a match. Therefore, the system proves a one-to-many comparison to set up an individual’s identity (or if the non-biometric or biometric subject data base not found) without the subject having to declare an identity. Identification is a vital role in negative recognition applications. The main intention of negative recognition is to stop a single person from using multiple identities. Identification may also be used in positive recognition for convenience, while non biometric based methods of personal identification such as passwords, mobile number, PIN, key press and signature may work for positive recognition, but negative recognition can only be recognized through the biometrics.
Behavioral Characteristic Based: It depends upon the behavior of a person as signature and voice feature.
Physical Characteristic Based: A physical characteristic is related to the sketch of the body. It is a stable human physical characteristic, such as palm print, ear shape, fingerprint, iris pattern. It remains unchangeable without major issue.
WORKING THEORY OF BIOMETRIC SYSTEM:
All the biometric system such as non-biometric system based and biometric system based use the same basic theory as given below. It consist of predefined steps as well as we must know some basic rules related to both non biometric system and biometric system as enrollment number or registration such as Matching, Biometric data, Feature extraction, Shape , Presentation, etc.
Enrollment or Registration: The enrollment or registration process, by which a user’s biometric data is in the beginning get, processed and stored in the form of a model for ongoing use in a biometric system. It is called enrollment or registration process. This model will be used for further as well as future use process as verification.
Matching: A matching process where stored model is matched with live model at the time of verification and we obtained a data, on the basis of this obtained data we can identify that a user is correct person or not.
60

Figure 1: A non-biometric system based or biometric system based (Personal experience “Personal Identification Using Iris Recognition System, a Review)
Biometric Data: The biometric data provided by the user during enrollment or registration is called raw image data, which is also referred as raw biometric data. The raw biometric data cannot be used to achieve biometric matches so it is used to produce biometric form with the help of feature extraction process.
Feature Extraction: The process of locating and encoding unique characteristics from biometric data in order to produce a shape is called feature extraction. Feature extraction takes place during enrollment or registration and identification, any time a shape is created.
Shape: A shape is a mathematical representation of raw biometric data which is obtained after applying a number of feature extraction algorithms. A shape size can vary in size as few bytes for hand geometry to several thousand bytes for facial recognition [3]. The shape created at the time of enrollment or registration is called stored data and at the time of identification is called live shape.
Presentation: The presentations process by which user present his/her biometric data to the acquisition devices, the hardware which is used to collect information / data. For example placing a palm print, face recognition, finger print etc. on a plate at acquisition device.
TYPES OF BIOMETRICS AND APPLICATIONS OF BIOMETRICS IN FORENSIC INVESTIGATION.
61

When using different types of biometric like non biometrics based system and biometrics based system, it is important to know and distinguish between physical and behavioral human characteristic. Both non-biometric system based and biometric system based is defined below. Biometric recognition systems based on the above methods can work in two modes.
According to physiological biometrics.According to behavioral biometrics.
Figure 2: Categories of biometric by graphically representation.62

ACCORDING TO PHYSIOLOGICAL BIOMETRICS:
Biometrics is the science of analyzing physical or behavioral characteristics specific to each individual in order to be able to authenticate their identity. In the literal and most simple sense, biometrics means the “measurement of the human body”. OR a biometric bases system related to the human body and not easy to copy. It remains con not altered without major issue. This type of biometric includes palm print, hand geometry, face, iris, retinal, fingerprint, DNA, ear and gait.
Palm Print: Palm print verification is a slightly different implementation of the fingerprint technology. Palm print scanning uses optical readers that are very similar to those used for fingerprint scanning their size is however much bigger.
Figure 3: A palm print image.
Hand Geometry: It is based on the fact that almost every person’s hand is shaped differently and that the shape of a person’s hand does not change after certain age. These techniques include the view of length, width, thickness and surface area of the hand. Various method are used to measure the hands- Mechanical or optical principle.
63

Figure 4: A hand geometry image
Face Recognition: Different technologies can be used for face recognition. One approach consists on capturing an image of the face using an inexpensive camera (visible spectrum). This method typically models key features from the central portion of a facial image extracting these features from the captured image(s) that do not change over time while avoiding superficial features such as facial expressions. Major benefits of facial recognition are that it is non-intrusive, hands-free, provides for continuous authentication and is accepted by most users.
Figure 5: A face recognition image
Iris: This recognition method uses the iris of the eye which is colored area that surrounds the pupil. Iris patterns are unique and are obtained through digital image or video based image acquisition system. Each
64

iris structure is featuring a complex pattern. This can be a combination of specific characteristics known as corona, crypts, filaments, freckles, pits, furrows, striations and rings.
Figure 6: An iris image
Retina scan: The retina biometric analyzes the layer of blood vessels located at the back of the eye. This technique uses a low intensity light source through an optical coupler and scans the unique patterns of the retina’s blood vessels. Retina scanning is quite accurate and very unique to each individual similar to the Iris scan; but unlike the Iris scan, it requires the user to look into a receptacle and focus on a given point for the user's retina to be scanned. This is inconvenient for people who wear glasses and those concerned about close contact with the scanning device. This technique is more intrusive than other biometric techniques although the technology itself is very accurate for use in identification, verification and authentication.
Figure 7: A retina scan image.
65

Fingerprint biometrics: Fingerprints have been used in criminal investigations as a means of identification for centuries. It is one of the most important tools of crime detection because of their robustness and uniqueness .A fingerprint is the pattern of friction ridges and valleys on the surface of a fingertip. In order to match a print, a finger print technician digitalizes or scans the print obtained at crime scene andcomputer algorithms of a biometric system locate all the unique minutia and ridge points of a questioned print. These unique feature sets are then matched against a stored fingerprint database.
Figure 8: A fingerprint image.
DNA (Deoxyribonucleic Acid): At present, there exists no technology to allow for automated recognition of DNA samples. DNA analysis requires a lab environment and a form of tissue, blood or other bodily sample. This method of capture still has to be refined. So far the DNA analysis has not been sufficiently automatic to rank the DNA analysis as a biometric technology. The analysis of human DNA is now possible within 10 minutes. As soon as, the technology advances, DNA can be matched automatically in real time, it may become more significant.
66

Figure 9: A DNA image.
Ear: It has been suggested that the shape of the ear and the structure of the cartilaginous tissue of the pine are distinctive. The ear recognition approaches are based on matching the distance of salient points on the pine from a landmark location.
Figure 10: An ear image
67

Gait: Gait is the peculiar way one walks and is a complex temporal biometric. Gait is not supposed to be very distinctive, but is sufficiently discriminatory to allow verification in some low-security applications. Gait is a behavioral biometric and may not remain invariant, especially over a long period of time, due to fluctuations in bodyweight, major injuries involving joints or brain, or due to inebriety.
Figure 11: A gait image.
ACCORDING TO BEHAVIORAL BIOMETRICS:
It is the field of study related to the measure of uniquely identifying and measurable patterns in human activities. The term contrasts with physical biometrics, which involves innate human characteristics such as fingerprints or iris patterns. It depends on the present state of mind and can vary frequently as per situation or environment. For example, voice of human being can be affected by various factors as sadness, happiness, disease as throat infection, environment and so on. This type of biometric includes signature, typing rhythm and voice print recognition.
68

Signature Verification: The way a person signs her name is known to be a characteristic of that individual. Signatures of some people vary substantially even successive impressions of their signature are significantly different. It is based on measuring dynamic signature features such as speed, pressure and angle used when a person signs a standard, recorded pattern (e.g., autograph).
Figure 12: A signature image.
Keystroke: The functionality of this biometric is to measure the stay time (the length of time a key is held down) and flight time (the time to move from one key to another) for keyboard actions. Keystroke biometrics work on the basis of multiple feature extraction being used to create a profile of an individual. This profile is used to identify or authenticate the user. Keystroke analysis is concerned with the frequency, accuracy, the pause between strokes and the length of time a key is depressed.
69

Figure 13: A key press image.
Voice: Individuals (speakers) can be recognized by their voice print, the set of measurable characteristics of a human voice. Different algorithms are applied in text-dependent, text-prompted or text-independent speaker recognition systems, as explained.
Figure 14: A voice recognition image.
Text-dependent systems: The user is requested to speak a word or phrase, A Comparison Based Study on Biometrics for Human Recognition which was saved earlier during the enrollment process. The spoken input is represented by a sequence of feature vectors and compared with previously recorded input vectors, to calculate the degree of similarity.
Text-prompted systems: The user is prompted to repeat or read a word or phrase from a pre-recorded vocabulary displayed by the system (e.g., “Please tell the numbers 1 2 3 4 5 6 7 8”).
Text-independent systems: Systems have no initial knowledge /vocabulary. Reference templates are generated for different phonetic sounds of the human voice, rather than samples for certain words.
CHALLENGES IN BIOMETRIC AUTHENTICATION Privacy issues. High cost of the hardware and the software. Weak signal in villages’ area of the Internet. Awareness to people especially in village area. Smarter sensors is not in use
CONCLUSION:
70

Non biometrics based system and biometrics based system is a means of verifying personal identity by measuring and analyzing unique physical or behavioral characteristics like palm print, finger print, hand geometry, face , voice, ear, gait, voice and iris patterns. These systems overcomes the drawbacks of the traditional computer based security systems which are used at the places like Aadhar card, PAN card, ATM card, passport, payroll, drivers’ licenses, credit cards, access control, smart cards, PIN, government offices and network security. The non-biometric based security systems and biometric based security system have been proved to be accurate and very effective in various applications. The biometric features can be easily acquired and measured for the processing only in the presence of a person. Therefore these systems are proved highly confidential computer based security systems in the current scenario and future use.
REFERENCES:
A Comparison Based Study on Biometrics for Human Recognition Himanshu Srivastava Department of Computer Science & Engineering Roorkee Institute of Technology, Roorkee (U.K.), India.e-ISSN: 2278-0661, p- ISSN: 2278-8727Volume 15, Issue 1 (Sep.- Oct. 2013), PP 22-29 www.iosrjournals.org.
Corresponding author: Monika Saini, University of Delhi, Delhi, India, Tel: 91-8130634711; E-mail: [email protected], Rec date: March 04, 2016; Acc date: May 19, 2016; Pub date: May 25, 2016.
Debnath Bhattacharyya, “Biometric Authentication: A Review,” International Journal of u- and e- Service, Science and Technology, vol. 2, no. 3, 2009.
David Maltoni, Anil K. Jain, Handbook of fingerprint recognition, Springer publication (2002).
Himanshu Srivastava, “Personal Identification Using Iris Recognition System, a Review,” International Journal of Engineering Research and Applications (IJERA), vol. 3, no. 3, pp. 449-453, 2013. www.iosrjournals.org.
International Journal of Computer Science, Engineering and Information Technology (IJCSEIT), Vol.2, No.1, February 2012 Smita S. Mudholkar 1, Pradnya M. Shende 2, Milind V. Sarode, Department of Computer Science & Engineering, Amravati University, India.Jammi Ashok et.al. / (IJCSE) International Journal on Computer Science and Engineering Vol. 02, No. 07, 2010, 2402-2408 ,An overview of biometrics.Journal of Forensic Medicine, Biometrics in Forensic Identification: Applications and Challenges.Jammi Ashok 1 Professor and Head Assistant Professor Associate. Department of IT, GCET, Hyderabad, India.
Monika Saini* and Anup Kumar Kapoor, University of Delhi, Delhi, India.
P.V.G.S.Mudiraj, Associate Professor, MCA Dept., Adams Engg. College, Paloncha, Khammam.
Padma, Manivannan, “Comparative and Analysis of Biometric Systems” International Journal on Computer Science and Engineering (IJCSE,) vol. 3, no. 5, pp2156-2162, 2011.
71

Simon Liu and Mark Silverman, “A Practical Guide to Biometric Security Technology,” IT Pro 27-32, 2001.
Vaka Shiva Shankar, Assistant Professor, Department of MCA, KCCS, WarangalVol. 02, No. 07, 2010, 2402-2408.
MODELING A DYNAMIC SOFTWARE PRODUCT LINE USING
DELTA ORIENTED PROGRAMMING
Reeta Kuamri1 , Poonam Mishra2
1Department of Information Technology2 Department of Computer Applications,
Mrs. K.M. P. M. Vocational College, Jamshedpur, India
_______________________________________________
__________
ABSTRACT:
The increasing complexity and demand of automation is giving rise to the need of
Software Product Lines (SPLs) consisting of a core (common) module with variable
features to form a product family. The study of commonality and variability is done at
design time to develop the SPL, so SPLs are static in nature. The modern self adaptive
systems need late variability and reconfiguration of product at run time. Static SPLs do
not support this. We are finding a more evolving technology of software development
namely Dynamic Software Product Lines (DSPLs) which fulfill the need of modern
software. As DSPLs support dynamic binding, we need tools to develop them. Delta-
oriented programming (DOP) is a modular, yet flexible approach to implement software
product lines. In DOP, a product line is implemented by a set of deltas, which are
containers of modifications to a program. A delta-oriented product line is specified by
its code base, i.e., the set of delta modules, and a product line declaration specifying the
set of possible product variants. In this paper we present the design model and partial
implementation of a DSPL to show how dynamic DOP supports for runtime
reconfiguration. It is done using DeltaJ 1.5.
72

Keywords: self adaptive systems, dynamic binding, delta oriented programming, late
variability.
_____________________________________________________________________
___________
[1] INTRODUCTION
A software product line (SPL) is a family of software systems with well-defined
commonalities and variabilities that are developed by (re)using common features. Many
industries have successfully adopted an SPL development approach for building families of
related systems with better quality, shorter time-to-market, and lower production costs. Modern
software systems tend to be extremely long-lived. Hence, they have to evolve to meet changing
user requirements or resource constraints over time. To remain operational over long periods,
these systems additionally need to be designed to adapt at runtime. Conventional (static) SPLs
fail to provide mechanisms for addressing these new requirements. Dynamic software product
lines [Hallsteinsen et al. 2008; Capilla et al. 2014] focus on engineering adaptive systems using
a dedicated variability model describing all possible configurations a system may adapt to at
runtime [1].
A delta-oriented SPL consists of a code base comprising a set of delta modules and a
product
line declaration linking delta modules to the product features. A delta module encapsulates
modifications to an object-oriented program. A particular product in a delta-oriented SPL is
generated by applying the modifications contained in the suitable delta modules to a core
program that, without loss of generality, can always be assumed to be empty [Schaefer and
Damiani 2010]. A dynamic delta-oriented SPL adds to these a dynamic reconfiguration graph
defining which configurations the system can adapt to at runtime and describes how objects
allocated on the heap need to be reallocated in case they are instances of classes changed by the
reconfiguration. To lessen the runtime overhead caused by the reconfiguration, it would be
desirable that already allocated objects are reallocated on demand only when their fields are
accessed or a method is called upon them [1].
Besides runtime adaptation, dynamic DOP supports unexpected evolution by introducing or
removing products from the product line and modifying the implementation of existing
products. This evolution can be carried out at runtime relying on the same principles as runtime
adaptation.
73

In summary, here are the contributions of this work:
—we use DOP to model dynamic SPLs;
—we give a design of SPL and evolved SPL for Inventory Control System (ICS)
—we provide a partial implementation of the above showing the reconfiguration dependencies.
The paper is organized as follows. Section 2 introduces DOPand DeltaJ 1.5 as dynamic DOP
tool to develop DSPL.
Section 3 explains the concept of late variability in SPL.
Section 4 presents the product base line for ICS.
Section 5 shows partial implementation of ICS.
Section 6 discusses the related works and concludes by outlining possible directions for future
work.
[2] INTRODUCTION TO DELTA ORIENTED PROGRAMMING &
DELTAJ
Delta Oriented Programming (DOP) is proposed as a novel programming approach.
In this approach a product line is represented by a core module and a set of delta modules. The
core module contains a complete product implementation for some valid feature configuration,
which can be developed by conventional single-application engineering techniques. Delta
modules specify changes to be applied to the core module in order to implement other products
[6].
DeltaJ is a Java-like language which allows organizing classes in modules [2]. There are two
kinds of modules: core and delta. A core module is a simple collection of classes, while a delta
module is a set of operations that allow to add a new class and modify or remove classes
declared in other delta or core modules. The software is so organized in a single core module
and a set of delta modules dependents on each other or on the core module. It has following
versions:
74

1. DELTAJ 1.0 for Core DOP: Core DOP was used for original formulation of DOP. The
Product Line code base consist of:
a) A core module which contains the implementation of the base product variant (A Java
programme) and
b) A set of delta modules that express modification to the product introduced by core module,
for adding/removing features.
2. DELTAJ 1.1 for Pure DOP: Pure DOP was first formalized using core calculi for Java by
using LIGHTWEIGHT JAVA (LJ) and then by using FEATHERWEIGHT JAVA(FJ). DeltaJ
1.1 is a union of LJ AND FJ for small subset of Java. It supports int, boolean and String types
but does not provide any API access, support for interfaces, packages and visibility modifiers
for classes, methods or fields, hence unfit for full Java.
3. DELTAJ 1.5:- DeltaJ 1.5 is a prototypical language supporting DOP for full Java 1.5. It
provides additional Delta modules that support programme transformation involving the Java
1.5 package system, interfaces, inheritance hierarchy, nested classes, enum classes and field
qualifiers. It provides a new unified code removal operation. Hence, we find DeltaJ 1.5 is an
improved language to express Product-Line Declaration [3].
[3] LATE VARIABILITY IN AN SPL
Our example SPL is the Inventory Control System (ICS), which is a software system
for the management of stock, including updating of stock based on four basic transaction sales,
purchase, sales returns and purchase returns. The main focus of the ICS is on stock
management processes, where the core processes are sales, sales returns, purchase, purchase
returns and stock updation. The main goal of the ICS is to integrate all processes and
corresponding data of an organization into one system. The stock or inventory management
task includes the receiving of picking lists from the sales order department, checking of the
stock availability, packing of goods, dispatching of goods and accordingly updating the stock
[4].
The needs for these features vary depending on the size of sales order by the
customer for sales and sales returns as well as size of purchase order to the supplier and
purchase returns. Thus making it advantageous for the software provider to implement the
system as a SPL. The products resulting from the SPL might be as small as a simple way to
75

keep track of the stock for executed orders, or as large as a complete stock management
system, in which the stock from first sales to delivery and payment of the sold product and the
stock management for the sales returns can be managed.
The processes in the ICS Scenario are modeled using model-driven techniques.
Thus, we can identify variation in the processes on the model level. For example, Fig. 1 depicts
a short version of the inventory management process, which consists of at least four steps: sales
(goods are dispatched to a customer), sales returns (sold items or part of sold item items are
returned by the customer), receive the sales returns (returned goods are received) and add the
sales returns to the stock.
The lower part of Fig. 1 models an example of late variability in the inventory
management process. The modeling elements with solid lines describe the static part of the
process. The receive step is subject to a dynamic variation that is described using modeling
elements with dashed lines.
As an example for late variability, we model an additional checking of sales returns
after it is received. We have identified three subcategories of for checking, namely store
customer details before adding to stock. It is to keep track of the customers and reason for
returning the goods. The second one is new which denotes the packaged goods came as it was
then add it to stock for resell. The third one is second which means if the goods returned have
came as slightly used or damaged. The further it is checked that if it slightly damaged, with
few repairing task it can be added to stock for resell and if it is damaged it should be excluded
from adding to stock.
To provide flexibility we allow users of the product line to adapt their software
system from one process model to another without the need to redeploy the whole system.
Therefore, these three variants of checking before add to stock processes are modeled as
dynamic features.
76 FIGURE 1: STATIC SPL FOR ICS
ADD TO STOCKPURCHASE RETURNSRECEIPTSALES RETURNSDESPATCH
PURCHASEINVENTORY MANAGEMENT
SALES
INVENTORY CONTROL SYSTEM

[4] PRODUCT-LINE CODE BASE
A product line code base consists of a set of delta modules, which are containers of
modifications to an object-oriented program. The modifications may add, remove or modify
classes. Modifying a class means to change its super class, to add or to remove fields or
methods or to modify methods. The modification of a method can either replace the method
body by another implementation, or wrap the existing method using the original construct. The
original construct expresses a call to the method with the same name before the modifications
and is bound at the time the product is generated. Before or after the original construct, other
statements can be introduced wrapping the existing method implementation. DOP supports
extractive product line development starting for existing legacy products [1].
ICS Product Line: We have an ICS product line to design a DOP DSPL. In Static SPL the
sales returns are simply added to stock. In Dynamic DSPL we have added three features to
check the returned goods before adding it to stock. Figure 1 shows the ICS SPL and Figure 2
shows the evolved ICS including the dynamic features.
The code base for the ICS PL includes the delta modules store customer detail, new and
second. DRECIVE is introduced to perform the updation tasks for the above delta modules at
run time by adding the returned goods to existing stock which is the existing legacy product,
realizing the Basic feature stock management.
The Basic feature is implemented by classes INVENTORY, DISPATCH, SALES RETURNS,
PURCHASE, PURCHASE RETURNS.
Listing given contains the design for code base for the ICS PL.
77
INVENTORY CONTROL SYSTEM
R
DAMAGED SLIGHTLY
ADD TO STOCK
TEMPORARY PERMANENT STORE
STORE CUSTOMER DETAILS NEW SECOND
RECEIVE
PURCHASE RECEIPTSALES DISPATCH
PURCHASEINVENTORY MANAGEMENT
SALES
Figure.2: EVOLVED SPL FOR ICS

The class Inventory represents the current stock, which initialized with the opening quantity of
the item along with, item_no, item_name, and price, parameters for type of update ( add or
subtract according to purchase or sales transaction), sales_qty to an update method for
manipulating the stock quantity and a show method to display the current quantity.
The class Dispatch represents completion of a sales transaction. The goods are packed and
dispatched to the customers and stock is updated. It contains the attributes item_no,
item_name, price, and sales_qty, a method to enter the data ,a method to show the data and a
method to call the update method of Inventory class to update the stock.
The class Sales_returns represents that some goods are returned by the customers due to some
reasons after receiving it. It contains the attributes customer_no, name, address, item_no,
item_name, price and sales_return_qty and type (denoting reason for return), a method to enter
the data,and a method to show the data and a method to update the stock.
The class Purchase represents completion of a purchase transaction. The packed goods are
received by the supplier and added to stock. It contains the attributes item_no, item_name,
price, and sales_qty, a method to enter the data, a method to show the data and a method to
update the stock.
The class Purchase_returns represents that some goods are returned to the supplier due to some
reasons after receiving it. It contains the attributes supplier_no, name, address, item_no,
item_name, price and purchase_return_qty, a method to enter the data, a method to show the
data and a method to update the stock.
The Main class provides a method main that starts the application by creating a scanner, an
inventory scanner, and a controller for the management of the stock_qty and then loops forever
by reading commands from the input stream and passing them to the controller.
The delta module dreceive implement the store customer details and new or second
by maintaining a customer list for sales_returns before executing add to stock module, then it
checks whether the returned goods is suitable for resell( in NEW module) or partially suitable
for resell ( in SECOND module) and accordingly adds the returned sales qty to stock. Further
store customer details checks the type of customers. If it’s temporary customer stores the
details in a list for short period of time. If it’s a permanent customer, stores the details in
database for further reference. Similarly the delta module second checks the returned goods, if
it is damaged, it’s not added to stock (shown by the constraint exclude), if it is slightly used
and can be resold, is added to stock.
[5] PARTIAL IMPLEMENTATION USING DELTAJ1.5
78

The ICS PL is partially implemented using Deltaj1.5. The implementation of
deltaJ1.5 is done using eclipse plug in and it is implemented with xtext. Xtext is a language
workbench.
package inventproject;
SPL inventpl {
Features = {Inventory, Sales, Sales_Returns, Purchase, Purchase_Returns}
Deltas = {Dreceive, Cust_detail_store, New, Second, Permanant, Temporary,
Damaged, Slightly_used}
Constraints {
Inventory & (Sales | Purchase);
Sales & Sales_Returns;
Purchase & Purchase_Returns;
// Put boolean expression representation of the feature model here.
}
Partitions {
{Dreceive, Cust_detail_store,New, Second, Permanant, Temporary,
Damaged, Slightly_used } when (Sales_Returns);
// Put mapping between deltas and feature configurations here.
}
79

Products {
// Put product definitions here. }}
Figure.3: The ICS SPL
public class Inventory {
int item_no;
String item_name;
int price
int opening_stock;
void update_process(boolean update_type, int u_qty)
{// method to add or subtract the stock qty based on update_type to/from
opening_stock
}
void show_stock()
{//method to show the details of current stock
}
}
public class Dispatch extends Inventory {
int item_no; String item_name;
80

int price
int sales_qty;
boolean update_type;
Despatch()
{
update_type=true; //for sales
}
void sales_update_process()
{// method to add sales qty based on update_type to opening_stock
//calls update_process() of super class with parameter update_type and
sales_qty
}
void show_sales()
{//method to show the details of current sales
}}
public class Sales_Returns extends Inventory {
int item_no ;
int sales_return_qty;
boolean update_type;
Sales_Returns()
{
update_type=true; //for sales
81

}
void sales_update_process()
{// method to invoke delta modules }
void show_sales()
{//method to show the details of sales returns
}
}
Figure.4: Classes of ICS PL
delta Dreceive {
//checks for arrival of sales returns
}
delta Cust_detail_store {
//stores the details of customers who has returned the goods after sales
}
delta New {
// precedes to add the sales returned qty to stock
}
delta Second {
//checks the returned goods are damaged or used for resell
}
82

delta Slightly_used {
//precedes to add the sales returned qty to stock
}
delta Damaged {
//discards the sales returned goods without adding to stock
}
Figure.5: Delta modules of ICS PL
The above listing shows partial implementation of ICS PL using DeltaJ 1.5 [5].
[6] CONCLUSION AND FUTURE WORK
Dynamic SPLs [Hallsteinsen et al. 2008; Capilla et al. 2014] represent an
increasingly important research topic aiming to enhance SPLs to provide capabilities for
flexible post-deployment reconfiguration. DOP is a flexible approach to the implementation of
SPLs [Bettini et al. 2013b]. Dynamic DOP is an extension of DOP that allows runtime
reconfiguration and unanticipated software evolution. A prototypical implementation of DOP
which supports SPLs of JAVA 1.5 programs is available in Eclipse plug in. Implementation
and tool support for dynamic DOP are planned.
While this paper presents a partial implementation of ICS PL as dynamic DOP by taking only
sales and sales_return transactions, in future work, we would like fully implement the complete
PL by taking Purchase, Purchase_Returns, Payment etc.
To evaluate the performance and scalability of dynamic DOP using real case-studies.
Recently, proof systems for the verification of delta-oriented SPLs [Hahnle and Schaefer 2012;
83

Damiani et al. 2012a] and model-based testing frameworks for delta-oriented SPLs [Lochau et
al. 2012; Damiani et al. 2013] have been proposed. We plan to extend these approached to
dynamic delta-oriented SPLs for business systems.
REFERENCES
[1] Ferruccio Damiani, Luca Padovani, Ina Schaefer, “A Formal Foundation for Dynamic Delta- Oriented Programming”, In. ACM Trans. Program. Lang. Syst. 0, 0, Article 0 ( 0), 35 pages, DOI:http://dx.doi.org/10.1145/0000000.0000000
[2] SourceForge.net[3] Jonathan Koscielny ,Sönke Holthusen, Ina Schaefer, Sandro Schulze, Lorenzo
Ferruccio Damiani,”DeltaJ 1.5: Delta-oriented Programming for Java 1.5 “, From
source: http://deltaj.sourceforge.net/
[4] Tom Dinkelaker, Ralf Mitschke, Karin Fetzer, Mira Mezini, “A Dynamic Software Product Line
Approach using Aspect Models at Runtime “, In. First Workshop on Composition and
Variability’10
Rennes, France collocated with AOSD’2010
[5] Source: DeltaJ website at TU Braunschweig
[6] Mahua Banerjee, Reeta Kumari, “Dynamic Software Product Line: An Approach to
Dynamic Binding”, In. Proceedings of the 3 rd International Conference on Recent
Advances in Information Technology | RAIT 2016 , 978-1-4799-8578-
4/16/$31.00©2016IEEE, organized by ISM, Dhanbad, India
84

ENHANCING PERFORMANCE OF MULTIBIOMETRIC SYSTEM USING ANT COLONY OPTIMIZATION BASED ON SCORE LEVEL FUSION
Sandip Kumar Singh ModakDept.of Computer science &EngBirla Institute of TechnologyRanchi, [email protected]
ABSTRACTUnimodal biometric systems have several inherent problems such as intra-class variation, noisy-sensor data, spoofing attacks and non-universality. To overcome this limitation multibiometric is a good option where we can use two or more individual modalities. In this paper we propose a multibiometric system to enhance the performance and minimize the error rate using Ant colony optimization (ACO) based on score level fusion. This work extracts the feature from two different modalities namely face and iris (left/right). In this work we use ACO as an optimization technique to select the fusion parameter like weights for the different biometric matcher and fusion rule which is used further for score level fusion. The experimental results show that the multibiometric system using ACO based on sum rule is outperform than the other fusion rule like product, tanh and exponential sum.
KeywordsUnimodal, multibiometric, ant colony optimization, fingerprint, iris, particle swarm optimization, score level fusion.
INTRODUCTIONBiometric authentication is a system which is capable to identify a person based on the inherent physical or behavioral traits associated with that person [1].In recent year the application of biometric in authentication system increase gradually; one of the main reasons of its popularity is that biometric traits like fingerprint, face and iris feature of a person are same during the whole life time and it is not easily guess, forgotten and misplace. Biometric based system are more secure and accurate compare to the traditional system which is based on user personal identification number(PIN) and the user set PIN can be easily guess by the third party. Unimodal system which is based on single modalities has several inherent problems like noisy senses data, intra-class variation, spoofing attack and unaccepted error rate [2]. To overcome this limitation multibiometric is a good option where we can use more than one modality at a time to improve the performance and accuracy level of the systems. Fusion process plays an important role in multibiometric where the features of more than one modality are combined together [3].The whole fusion process can be classified as sensor level, feature level (combining feature from different biometrics), score level (combining the genuine and imposter score) and decision level (combing the decisions) [4]. Among all the fusion methods score level fusion very popular and simple, lots of research have been done in the area of score level fusion. Researcher preferred to use score level fusion due to ease of combining matching score. Further score level fusion technique can be categories as a) transformation-based score fusion like sum rule, weighted sum rule and product rule. b) Classifier based like support vector machine (svm) and c) density based fusion like likelihood ratio test [5]. Evolutionary approaches plays an important role in multibiometric, it generate a optimum solution among a large population and finally the optimum solution is achieve through the searching and updating the past history of the particle [6].ACO (ant colony optimization), PSO (particle swarm optimization) and GA (genetic algorithm) are all comes under these category.PSO based algorithm sometime face the problem of premature convergence and its somehow effect in to get the optimum solution [7]. Score normalization play an important role in fusion process of different biometric modalities. After the matching process the output score obtained by each individual modalities are may not be homogenous in nature and they need not be on the same numerical range. So normalization is a technique which convert the output score into a common range so that it is easy to get a final score and further it is used in a decision module to decide whether the claimed user is genuine or not. The obtained scored form face and hand-geometry are distance score, whereas in the case of fingerprint it is similarity score. The different types of normalization technique are Min-min, z-score, double sigmoid and tan-h estimators, among them Min-max normalization technique is most popular and mostly used in fusion purpose in multibiometric [2].The remainder of this paper is organized as follow:
85

in section 2 related works are presented; section 3 give details about ACO; section 4 give details about the proposed work; section 5 give details about experimental result and section 6 concludes the papers.
RELATED WORK Lots of researches have been done in multibiometric based on score level fusion. In this section we only mention the related works of score level fusion which is based on evolutionary technique like Pso, Ga, Aco and other optimization technique. Dynamic selection of matching score was proposed by Tronci et al. [8] in which they show that the dynamic selection of matching score can provide a better performance than a unimodal system. Veeramachaneni et al. [9] was proposed an adaptive multimodal biometric management algorithm which is based on the combination of PSO and Bayesian decision fusion. In this paper the system has N biometric sensors to collect the data, a particle swarm optimizer (PSO), Bayesian decision fusion processor and a mission manager. Bayesian decision fusion processor is used to fuse the decisions from different biometric sensors and the optimal fusion rule from PSO into a final decision.Srinivas et al. [10] proposed a system for enhancing the performance of correlated biometric classifiers, in which weighted sum rule with the combination of PSO is used in score level fusion. The weights of individual classifier are calculated using the concept of PSO.Raghavendra et al. [11] proposed a PSO based fusion of near infrared and visible image for improved face verification, in the first scheme PSO is used to calculate the optimum weight of a weighted linear combination of the coefficients and in the 2nd scheme PSO is used to select the optimal fused feature of near infrared and visible image.L.Mezai and F.Hachouf [6] proposed a fusion of face and voice using PSO and belief function at score level fusion, in which the belief assignment is generated from the score of each modality using Denoeux and Appriou models.PSO is used to estimates the confidence factor, the fusion of weighted belief assignment is carried out using Dempster-Shafer(DS) and finally make decision making whether the claim user is genuine or not. Kumar et al. [12] proposed an adaptive combination of multiple biometrics classifier based on evolutionary approach in which the hybrid PSO model is used to obtain the different fusion parameter and optimal fusion strategy. The authors use different possible methods like simple sum, weighted sum, product and exponential sum as a score level fusion strategy. They have uses different combination of modalities like combination of iris and palmprint, face and speech and fingerprint and hand geometry to carry out their experiment. Amioy Kumar and Ajay Kumar [13] proposed a multimodal biometric fusion using ant colony optimization (ACO) in which they shows their experiment results using publicly available database like IIITD database of palmprint and iris; database from speech and face, and the NIST database of fingerprint and face images. Kumar et al. [14] proposed an ant colony optimization (ACO) based fuzzy binary decision tree for bimodal hand knuckle verification system, in which they uses ACO to choose optimal fusion parameter for each level of security.FBDT (fuzzy binary decision tree) are used for decision making purpose and classify the classes as genuine or imposter using matching score obtained from knuckle database. The application of GA (genetic algorithm) for selection of different fusion parameter at score level fusion was proposed by Romain Giot et al. [15] in which they define a fitness function based on a fast Error Equal Rate computing method. They have tested three different kinds of score fusion methods whose parameter are automatically set by genetic algorithm, the score fusion functions have been validate on three different multibiometric database on which two are real and one is chimerical.Cherifi Dalila and Hafnaoui Imane [16] proposed a multibiometric system using combination of GA and PSO based on score level fusion, in which PSO and GA is applied to find the optimum weights associated to the modalities being fused. They conclude that the performance of hybrid GA with PSO, GA and PSO at score level is differing significantly in terms of time consumption.Aniesha et al. [17] proposed a Genetic and Evolutionary computation (GEC)-based multibiometric fusion scheme to optimize the weights assigned to the different biometric modalities of a multibiometric system for score level fusion, the modalities tested were face and periocular biometrics. They conclude that the after using the concept of GEC at score level, it can help to improve the recognition accuracy of the system.
ANT COLONY OPTIMIZATION Ant colony optimization [18] was first introduce by Marco Dorigo in the year 1992 is a one kind of probabilistic technique used to find the optimal solution of a problem based on the behavior of the ant. This algorithm is a member of the ant colony algorithm family, in swarm intelligence methods, and it constitute some metaheuristic optimization. Initially each ant has an equal amount of pheromone (a chemical substance produced and released into the environment by an ant) level, using that they direct each other to the resource and similarly record their position to obtain the better solution in next iteration. Two important factors in ACO are Q (pheromone constant) and ρ (evaporation factor) whose
86

value is less than 1.Initially each ant select its possible solution randomly from the set of available possible values. For each ant, the objective function G (shown in Eqn. 2) is calculated and pheromone level of all the solution are updated using the initial pheromone level, computed function E, pheromone constant Q and evaporation factor ρ as follow:
τ i (t+1 )=ρ∗τ i ( t )+ QE If ith solution is selected in ith iteration
= ρ∗τ i(t ) If ith solution is not selected in ith iteration …………. (1)
Where Q=pheromone constant, E=Error calculated, ρ =evaporation constant and τ i (t )=¿ pheromone level at tth
iteration. The objective function is given by Eqn. 2.
G=CFA∗FA R (α )+CFR∗FRR (α ) .. …. (2)
Where CFA+CFR=2
BIMODAL FUSION STRATEGYResearcher preferred to use score level and decision level as a fusion strategy in multibiometric system employed for the fusion of two or more biometric modalities. In this work we used score level fusion for fingerprint and iris, and finally ACO is used for optimal selection of fusion parameter like different weight for output matcher by different modalities and fusion rule. FAR (false acceptance rate) and FRR (false rejection rate) are two key parameter for measure the performance of any biometric system. FAR is the rate at which imposter user are accepted as genuine users while FRR is the rate at which genuine users are rejected considering imposter ones. Both FAR and FRR are complement to each other and for achieve high level of security it is mandatory to maintain the value of FAR and FRR as low as possible. But it is very difficult to set both these value low at the same time.EER (equal error rate) is another key parameter to measure the performance of the multibiometric system which is a value at which both FAR and FRR are equal. The cost of false acceptance (CFA) and cost of false rejection (CFR) are two parameters through which we can measure the security level of the system. Both of these cost belong to [0, 2] in the step of 0.1. The four popular score level fusion rule are sum rule, product rule, exponential sum and Tan-hyperbolic (Tanh) which are as follows:
∑ ¿∑j=1
2
s j w j ………. (3)
Product=∏j=1
2
s jw j ………… (4)
Exponential∑ ¿∑j=1
2
exp (s j)w j …….. (5)
tanh∑ ¿∑j=1
2
tanh (s j¿)w j¿ ….. (6)
Where s j be the matching score obtained by the jth modality and w jbe the corresponding weight assign for j=1, 2.
ACO FOR PROPOSED BIMODALEach ant in the search space is represented byxmd=(xm1, xm2 ,…… .. , xmD), where the first subscript m denotes a mth solution
and D denote the dimension. As we use score level fusion for two modalities so each ant can be represented by “N+1” dimensions where N denotes the total number of modality which is 2 in this case and the last dimension is for fusion rule chosen from Eqs (3)- (6). Each ant can be represented by xmd={w1 , w2, F } , where first two parameters are the weights assigned and last parameter is the fusion rule. Initially each ant is assign with the equal amount of pheromone level. To obtain the fused matched score the individual weights assign by the ACO is applied to the corresponding matching score and fusion is performed with the chosen fusion rule like weighed sum,product,tanh and exponential sum. For each ant the value of G (Eqn. 2) is calculated and that fusion parameter is selected as optimum which minimizes the
87

value of G.the update on the pheromone level at (t+1) th iteration where i denote the ith ant is given in Eqn. 1. The main problem with the ACO technique is the saturation of pheromone level for small value of ρ(approx. 0) and forcing the ant stuck on a particular path. To overcome this problem if we set the value of ρ to approx. 1 then every path will have the same probability and there is no scope of optimization. So better solution of this problem is to initially set the value of ρ near to 1 and gradually decrease the value in steps of 0.005.
PROPOSED WORKIn this paper we propose a multibiometric system using ACO based on score level fusion to enhance the overall system performance. This work extract feature from two biometric modalities namely faces and iris (left/right). In the enrollment phase the extracted features from two different biometric modalities face and iris (left/right) are stored in the respective database which is shown in Fig 1. During the authentication phase the extracted face and iris (left/right) features of claimed identity is compared with the existing stored template of face and iris, which in result produce three match score namelyw1 , w2∧w3. In this work we use ACO as an optimization technique to select the fusion parameter like weights
for the different biometric matcher ¿ w3¿and fusion rule which is used further for score level fusion. And finally the claimed identity is considered genuine if the resultant score value is above the system threshold value, otherwise the claimed identity is considered as imposter shown in Fig 2.
4.1 FACIAL FEATURE EXTRACTION
The various phases involve in feature extraction of face are pre-processing, Image-enhancement and feature extraction. In the face recognition system the first phase is pre-processing in which face image are detect using the Active Appearance Modeling (AAM toolbox) [19] used to locate the center position of the left and right iris of eyes. This toolbox is helped to measure the angle of head roll that may be occurred during the acquisition of the face image. By using the center position and measured angle both eyes are aligned in the face image. After pre-processing the next step is image enhancement used to enhance the image quality. For this purpose we use Histogram Equalization (HE) and mean-variance normalization (MVN) [20] which is apply on resized image of size 60×60 to reduce the effect of illumination, finally Log-Gabor transform technique is used for facial feature extraction to transform the image of size 40×80.Finally,match scores are produced using the Manhattan distance measurement.
4.2 IRIS FEATURE EXTRACTION
The various phases of iris feature extraction are as follow
4.2.1 Segmentation
The main goal of segmentation is to isolate the require iris region from the whole eye image by separating the part of an image between the inner boundary and outer boundary. Two well known iris segmentation method are attributed to Daugman and Wildes. Daugman developed integro-differential operator to find circular pupils and limbus boundaries. It can be interpreted as a circular edge detector, which searches in a smoothed image by Gaussian filter, the parameter of a circular boundary along which the integra derivative is maximal [21].Wilds proposed a two stage iris segmentation method gradient based intensity image, and next the inner and outer boundaries are detected using Hough transform[22].
4.2.2 Normalization
The extracted iris region is then normalized into a fixed rectangular box. The most common normalization method proposed by Daugman. According to Daugman’s rubber sheet model, the remapping of the iris image I(x(r, ϴ), y(r, ϴ))I(r,ϴ) from Cartesian coordinate to doubly dimensionless pseudo polar coordinate system can be represented as
x (r ,∅ )=(1−r ) x p (∅ )+r x s (∅ ) ……….. (7)
y (r ,∅ )= (1−r ) y p (∅ )+r ys(∅ ) ……….. (8)
88

Where (x p (∅ ) , y p (∅ )) and (xs (∅ ) , ys (∅ )) are respectively the discrete co-ordinate nearest to the papillary boundary and r is the normalized radius in the interval [0, 1].
4.2.3 Feature extraction
In this step the unique pattern of iris is extracted using Log-Gabor transform with the same strategy as in face recognition. And the final size of the Log-Gabor transform image is set to 40×80. Finally, match scores are produced using the Manhattan distance measurement.
Experimental ResultsIn this paper fusion of face and iris (left/right) at score level fusion is presented. We considered four bimodal systems these are a) face and left iris b) face and right iris c) left iris and right iris d) face, left iris and right iris.
Fig 1: Enrollment Phase
Fusion parameter in Aco based learning is mostly depends on the cost factor CFA; so the ACO algorithm runs for each value of CFA.The fusion parameter are computed for each value of CFA and initially the value of ρ is set to 1 which is decrease in step of 0.005 to get the global optimal value. Experiment are carried out in the range of [0.005, 0.01] and it is found that Q=0.01 is acceptable. In this experiment we select total 15 numbers of ants which is found enough for the convergence of the algorithm. The number of iteration for ACO algorithm is taken as 50 and found sufficient for the convergence of the solution. The whole experiment are carried out using on a publicly available database called CASIA-IRIS-DISTANCE [23] which is a combination of both dual-eye iris and facial feature of 2567 images of 142 subjects. The average size of extracted iris is 170×150, and the average number of pixels between irises is 760.It was implemented in MATLAB R2016a.we consider randomly 90 subjects and each subject possess 10 sample, on which 5 sample for references and 5 for testing which is performed 10 times without any overlapping. In each trial we got (90×5=450) genuine score by compare the image of same person and 40,050 (90×89×5) imposter score by compare an image of a person with an image of another person. The performance of the system is measured by FAR (False acceptance rate), GAR (Genuine acceptance rate), and TER (Total error rate).It is represented by the ROC (Receiver Operating Characteristic) curve which plots FAR probability versus GAR probability for different value of the decision threshold. Table 1-4 shows the values of FAR and FRR correspond to the value of decision threshold for fusion of (face and left iris), (face and right iris), (left iris and right iris) and (face, left iris and right iris).
89

Fig 2: Authentication Phase
Table 1: FAR and FRR for fusion of face and left iris
For each bimodal system the minimum overall error rate computed corresponding to each CFA is shown in Fig. 3a-d, respectively.
Table 2: FAR and FRR for fusion of face and right iris
90

Table 4: FAR and FRR for fusion of face, left and right iris
Table 3: FAR and FRR for fusion of left and right iris
Fig.3 (a): CFA vs. Error rate for face and left iris
Fig.3 (b): CFA vs. Error rate for face and right iris Fig.3 (c): CFA vs. Error rate for left and right iris
91

Table 5: ACO based Error rate for different fusion rule
Fig.3 (d): CFA vs. Error rate for face, left and right iris
CONCLUSIONSIn this paper we propose a multibiometric system using ant colony optimization (ACO) as an optimization technique based on score level fusion to improve the performance and reduce the error rate of the proposed system. The role of ACO is to select the most optimal value of fusion parameter like fusion rule and the weights assign to the different biometric matcher. The security level of the system is totally depends on two parameter like FAR (false acceptance rate) and FRR (false rejection rate). The ACO is selected to choose optimal fusion parameter corresponding to each CFA, which denotes the different security level in the bimodal system. For obtained the high security level in the bimodal system the cost of false acceptance rate(FAR) can be set higher than those of false rejection rate(FRR) because imposter acceptance should be as less as possible. In order to obtain the low security we choose the cost of FRR much higher than the FAR because in this case the genuine rejection is required to be maintain as less as possible. In bimodal system CFA (cost of false acceptance) and CFR (cost of false rejection) are used to measure the security level of the system. We considered four bimodal systems these are a) face and left iris b) face and right iris c) left iris and right iris d) face, left iris and right iris. The experimental result shows that among the several fusion rules (sum, exponential sum, tanh and product), the sum rule is one of the best fusion rule with minimum error rate and its accuracy level is outperformer than the other fusion rule.
REFERENCES:
[1] A.K.Jain, A.Ross, and S.Prabhakar. “An Introduction to biometric recognition”, IEEE Transaction on Circuits and Systems for Video Technology. Special Issue on Image and Video-Based Biometrics, vol.14 (1):pp.4-20, 2004.[2] Anil Jain,Karthik Nandakumar, Arun Ross,” Score Normalization in Multimodal Biometric System”, journal of Pattern Recognition, Vol.38,pp.2270-2285,2005.
[3] He, Mingxing, et al. "Performance evaluation of score level fusion in multimodal biometric systems”, Pattern Recognition, vol. 43.5, pp: 1789-1800, 2010.[4] Hanmandlu, Madasu, et al. "Score level fusion of multimodal biometrics using triangular norms", Pattern recognition letters, vol. 32.14, pp: 1843-1850, 2011.[5] Nandakumar, Karthik, et al. "Likelihood ratio-based biometric score fusion”, IEEE transactions on pattern analysis and machine intelligence, vol.30.2, pp: 342-347, 2008.[6] Mezai, Lamia, and Fella Hachouf. "Score-level fusion of face and voice using particle swarm optimization and belief functions", IEEE Transactions on Human-Machine Systems, vol. 45.6, pp: 761-772, 2015.
92

[7] Kumar, Amioy, et al. "Decision level biometric fusion using Ant Colony Optimization", Image Processing (ICIP), 2010 17th IEEE International Conference on. IEEE, 2010. [8] Tronci, Roberto, Giorgio Giacinto, and Fabio Roli. "Dynamic score selection for fusion of multiple biometric matchers", Image Analysis and Processing, 2007. ICIAP 2007. 14th International Conference on. IEEE, 2007.[9] Veeramachaneni, Kalyan, Lisa Ann Osadciw, and Pramod K. Varshney. "An adaptive multimodal biometric management algorithm”, IEEE Transactions on Systems, Man, and Cybernetics, Part C (Applications and Reviews) ,vol.35.3, pp: 344-356,2005.[10] Srinivas, Nisha, Kalyan Veeramachaneni, and Lisa Ann Osadciw. "Fusing correlated data from multiple classifiers for improved biometric verification", Information Fusion, 2009. FUSION'09. 12th International Conference on. IEEE, 2009.[11] Raghavendra, Ramachandra, et al. "Particle swarm optimization based fusion of near infrared and visible images for improved face verification”, Pattern Recognition, vol. 44.2, pp: 401-411, 2011. [12] Kumar, Ajay, Vivek Kanhangad, and David Zhang. "A new framework for adaptive multimodal biometrics management", IEEE transactions on Information Forensics and Security, vol. 5.1, pp: 92-102, 2010.[13] Kumar, Amioy, and Ajay Kumar. "Adaptive management of multimodal biometrics fusion using ant colony optimization", Information Fusion, vol. 32, pp: 49-63, 2016.[14] Kumar, Amioy, Madasu Hanmandlu, and H. M. Gupta. "Ant colony optimization based fuzzy binary decision tree for bimodal hand knuckle verification system”, Expert Systems with Applications, vol. 40.2, pp: 439-449, 2013.[15] Giot, Romain, Mohamad El-Abed, and Christophe Rosenberger. "Fast learning for multibiometric systems using genetic algorithms", High Performance Computing and Simulation (HPCS), 2010 International Conference on. IEEE, 2010.[16] Cherifi, Dalila, Imane Hafnaoui, and Amine Nait Ali. "Multimodal score-level fusion using hybrid ga-pso for multibiometric system." (2015).[17] Alford, Aniesha, et al. "GEC-based multi-biometric fusion", Evolutionary Computation (CEC), 2011 IEEE Congress on. IEEE, 2011. [18] Dorigo, Marco, and Luca Maria Gambardella. "Ant colony system: a cooperative learning approach to the traveling salesman problem”, IEEE Transactions on evolutionary computation, vol. 1.1, pp: 53-66, 1997. [19] Huang, Chen, Xiaoqing Ding, and Chi Fang. "Pose robust face tracking by combining view-based AAMs and temporal filters", Computer Vision and Image Understanding, vol.116.7, pp: 777-792, 2012.[20] Pujol, Pere, Dusan Macho, and Climent Nadeu. "On real-time mean-and-variance normalization of speech recognition features", Acoustics, Speech and Signal Processing, 2006. ICASSP 2006 Proceedings. 2006 IEEE International Conference on. Vol. 1. IEEE, 2006.[21] Daugman, John G. "High confidence visual recognition of persons by a test of statistical independence”, IEEE transactions on pattern analysis and machine intelligence, vol.15.11, pp: 1148-1161, 1993.[22] Wildes, Richard P. "Iris recognition: an emerging biometric technology”, Proceedings of the IEEE, vol. 85.9, pp: 1348-1363, 1997.[23] Biometric Ideal Test. Available online: http://biometrics.idealtest.org/dbDeatailForUser.do?id=4 (assessed on 30 August 2013).
93

MULTIMEDIA DATABASES
Manjari Asst. prof Mrs. KMPM Voc. College, JSR [email protected]
ABSTRACT
Multimedia is the most popular and widely used culture around the world. In this modern era of computers, multimedia has captured an important place in our day to day life. Multimedia data typically means digital images, audio, video, animation and graphics together with data. With the increasing popularity of the www, the more challenges in computer science has become content-based retrieval of multimedia data and objects. This paper gives the general introduction of multimedia database and the types of queriesused to retrieve the data from database. In today’s world not only personal data but professional data is also digitized. These data are stored in digitized form whichmake backup copies and help to access the other professionals easier. This paper introduces the basic concept as well as general framework for multimedia database system and describes the requirement, need and architecture of Multimedia database.
Key words: Database Management System (DBMS), Multimedia Database (MMDB),Data Models, Data Mining
INTRODUCTION
Multimedia can be defined as a technique that combines avariety of media items to make the Information more attractive and enables into communicate in variety of ways. A multimedia Database consists of a variety of multimedia data such as text, images, Audios, videos, animations etc.. A multimedia database is a database that hosts one or more primary media file types such as .txt (documents), .jpg (images), .mp4 (videos), .mp3 (audio), etc. All primary media files are stored in binary strings of zeros and ones, and are encoded according to file type. The term "data" is typically referenced from the computer point of view, whereas the term "multimedia" is referenced from the user point of view. Multimedia object are multimedia document or presentation containing one or more multimedia data. The difference between multimedia database and standard database is a multimedia database stores information internally where a normal database can only store textual or numerical data. Due to the advancement of modern computer and information technology, multimedia plays more and more impact on our lives.
This paper reviews:Multimedia data typesMultimedia requirements and FunctionsArchitecture, design of Multimedia databaseMultimedia data mining
EVOLUTION OF MMDBMS
Since existing relational and object oriented databases comprise the basic requirements of any database, but to store multimedia data multimedia database were evolved , that includes :
Long bit and byte strings BLOBS Paths or references of images where the actual images stored elsewhere, such as on an optical storage
subsystem. Content retrieval capacities.
94

MULTIMEDIA DATA
In addition to the standard numeric, date and text data types, there are a number of data types that are regarded as the basic building blocks of MM applications. These data types, which are elements of more complex MM objects, are:
Text - different fonts and to produce special effects such as color and fill using a standard Languages HTML.
Audio - various audio file formats include Microsoft WAV (wave) and MIDI, which is a more compact representation of sound. It is a string of bits in digitized form.
Images - pixels can be 0 or 1 ('white' or 'black') or hi-res color images with 8, 16 or 24 bits per pixel. It can be bitmap, JPEG, MPEG.
Digital video - usually stored as a sequence of frames. For realistic playback, the transmission, compression, and decompression of digitized continuous frames requires transfer rates of 30 frames per second. If audio is required as well, the audio and video must be interleaved so that the sequences can be timed properly. Microsoft's AVI format can synchronize playback of audio and video.
Graphical objects– encoded in CGM, Postscript, such as 2- and 3-dimensional images. These loosely fall underthree main categories: Static media (time-independent, i.e. images, graphic object and handwriting) Dynamic media (time-dependent, i.e. audio, video ,animation and sound bytes) Dimensional media (i.e. 3D games or computer-aided drafting programs- CAD) .
Data Structure in MMDBMS
Raw Data-Uncompressed ImageRegistering Data-Size and coding details of raw dataDescriptive data-Textual numerical annotations
95
MULTIMEDIAAudio
Video
TextImages
Animation
IMAGES
Raw data -Pixel Registering data-
Height and width
Descriptive data-pic. date

CONTENTS OF MMDBMS Media data- actual data repressing images, audio, video that are captured, digitized, process, compressed
and stored. Media format data- It contains format information of the media data after it goes through the processing
and encoding phases Media keyword data-It contains the keyword descriptions. For example for a video , this might include the
date of recording ,time of recording and place of recording, the person who recorded, etc. This is also called as content descriptive data.
Media feature data-It contains the features derived from the media dat. For example the kinds of textures, distribution of colors, and the different shapes present in an images. This is also referred to as content dependent data.
CHARACTERISTICS OF MULTIMEDIA DATABASE MANAGEMENT SYSTEM
Storage media-multimedia data must be stored and managed according to the specific characteristic of the storage media. It must be capable of handling large amount of data.
Descriptive search methods-query of multimedia data should based on a descriptive and content oriented search.
Simultaneous data access-allow consistent, multiple and simultaneous data access through different queries of several application
Long Transaction -Most multimedia transitions are long and require long processing and retrieval time.
Recovery-Failures of transaction should not affect the persistent data storage.
Persistence-Data objects can be saved and re-used by different transitions and program invocations.
REQUIREMENTS OF MULTIMEDIA DATABASE MANAGEMENT SYSTEM
Using the general functions provided by a traditional DBMS as a guide, we can describe the purposes of a multimedia DBMS as follow:
Data persistence: Data this time, computer technology continues to develop and, together with this development, operating systems and other programs change. For this reason, a DBMS should be able to process data, even when the environment has changed. The ability of data objects to persist (survive) through different transactions and program invocations.
Consistent view of the data: Ensures consistency of the database state from one transaction to another
through constraints imposed on transaction. Particularly in concurrent multi-user operation, it is important to provide a consistent view of the data during concurrent database queries at specific point in time. This property is ensured by protocols for time synchronization.
Data Security: Restrict unauthorized access and modification of stored data. The security and integrity of
data in case of an error is one of the most important conditions for a DBMS. This property is achieved by use of the transaction concept.
Database query and output: Databases store different information (entries), which can be retrieved at any given time by database queries. Database queries are formulated by use of query languages, such as SQL. In addition, each entry in a database includes some status information (e.g. that the entry was changed). This information has to be reproduced exactly to ensure that the correct information about entry is supplied. Ensure that that the query mechanisms are suited for multimedia data.
96

A few more properties of multimedia database system that are worth a mention are: •Integration: Ensures that data items needs not be duplicated during different program invocation requiring
the data. •Data Independence: Separation of the database and the management functions from the application
programs. •Recovery: Methods needed to ensure that results of transaction that fail do not affect the persistent data
storage. •Version Control: Organization and management of different version of persistent objects, which might be
required by applications.
OPERATIONS ON MMDBMSThe operations are-
Input - Data will be written to the database.RAW and Registering data is mandatory.Descriptive data is optimal.
Output-Reads the data from database as per the registering data
Modification- changing of RAW, Registering and descriptive data Deletion –
Comparison-Search and Retrieval of stored dataPatter matching techniques is used.
Deleting – removes the entry from database.
Evaluation-Generation of descriptive data from Raw and registering data.
INTEGRATION OF MMDBMS
An appropriate data model is critical for representing a multimedia database.Relational, object-oriented, and object-relational data models have been examinedto represent multimedia data. Some argue that relational models are better becausethey can capture relationships, while others argue that object models are betterbecause they represent complex structures. Still others argue that hypersemantic datamodels are better because they capture both objects, relationships, and rules. Wediscuss all these models in the following subsections.
Design of multimedia database management system is based on two different kinds of DBMS:
97

1.EXTENSIBLERELATIONALMMDBMS:-
- Embedded new functions and types into RDBMS
2. OBJECT ORIENTED DATABASE MANAGEMENT SYSTEM:-
- An object-oriented data model, each object in thefigure corresponds to an object in the object model. The attributes of an object maybe represented as instance variables and will include time interval, frames, andcontent description.
- Different medias are presented by classes , whose instance variable include the data as Internal state. classes with objects are defined- objects can be put in relations via a class hierarchy- a semantic specialization of classes and objects can follow
3. HYPERSEMANTIC MODELS:- - Hypersemantic models are essentially semantic data model which support for representing constraints and rules.One can consider both object and object-relational data models to be semantic models that capture the semantics of an application. It was noted in the previous model that with both object and object-relational data models, one cannot represent constraints in a natural manner. Although one could enforce them as part of methods, it is better to express them in a more natural way, such as with rules. Hypersemantic models enable the representation of constraints. Note that there is no standard hypersemantic datamodel. One can extend any type of semantic model such as semantic nets as wellas objects with rules in a hypersemantic data model.
ARCHITECTURE OF MMDBMSVarious architectures are being examined to design and develop a multimedia data-base management system (MM-DBMS).
Architecture of a multi-user database can become complex. It is not clear which architecture would be the best option for a multimedia database. MDBMS has formal database architecture. It has a separate user view from the system view.It basically constitutes three layer architecture. A simple representation is shown below:
INTERFACEThe interface between the user and the database is used for the following activities: Object browsing, Compose, and Dispose
OBJECT COMPOSITIONThe object composition part of the multimedia database manages the multimedia objects.
STORAGEStorage functions of multimedia database involve clustering and indexing of multimedia data.
98

THREE-LAYER ARCHITECTURE
User’s view-object browsing, query, compose and decompose
Image index, video index, audio index, Text index —these all are connected to multimedia query engine.There is a presentation engine-the output is given through the presentation layer to user
FUNCTIONALITY OF MMDBMS
The Functionality of multimedia comprise of the following:•The operating system provides the management interface for MDBMS to all local devices.•The MDBMS provides an abstraction of the stored data and their equivalent devices, as is the case in DBMS without multimedia.•The communication system provides for MDBMS abstractions for communication with entities at remote computers.These communication abstractions are specified through interfaces according to, for example, the Open System Interconnection (OSI) architecture.•A layer above the DBMS, operating system and communication system can unify all these different abstractions and offer them, for example, in an object oriented environment such, as a toolkit. Thus, an application should have access to each abstraction at different level.
MULTIMEDIA DATA MINING
Recently, there has been much interest in mining multimedia databases such as text,images and video. Many data mining tools work on relational data-bases. However, a considerable amount of data is now in multimedia format. There is a large amount of text and image data on the Web. News services provide a lot of video and audio data. This data has to be mined so that useful information can be extracted. One solution is to extract structured data from the multimedia databases and then mine the structured data using traditional data mining tools. Another solution is to develop mining tools to operate on the multimedia data directly. Note that to mine multimedia data, we must mine combinations of two or more data types,
99

such as text and video, or text, video, and audio. However, in this paper we dealmainly with one data type at a time because we first need techniques to mine thedata belonging to the individual data types before mining multimedia data. In thefuture, tools for multimedia data mining will probably be developed.
There are number of data mining tasks such as classification, prediction, time-series analysis, clustering etc. All these tasks are either predictive data mining tasks or descriptive data mining tasks.
Predictive data mining tasksTasks come up with a model from the available data set that is helpful in predicting unknown or future
values of another data set of interest. Example- A medical practitioner trying to diagnose a disease based on the medical test results of patient can be considered as predictive data mining task.
Descriptive data mining tasksThese tasks usually find data describing patterns and comes up with new, significant information from the
available data set. Example- A retailer trying to identify products that are purchased together can be considered as a descriptive data mining task.
ISSUES AND CHALLENGES
Multimedia data consists, of variety of media formats including DOC,AVI, MPEG,PNG, etc. The tremendous amount of bandwidth they consume. Creating a Globally-accepted operating system applicable storage and resource management programs need
to accommodate the vast Global multimedia information hunger. Multimedia database consume a lot of processing time. Multimedia data structure takes much time in retrieval than standard database structures. Creating Globally data handing platforms, such as JOOMLA that these new multimedia database structure
require.
CONCLUSION
100
Data Mining
Predictive
Descriptive
Classification
Prediction
Time- Series Analysis
Association
Clustering
Summarization

Multimedia has emerged in every field of work. Compared with traditional textual application, multimedia applications usually require much higher bandwidth. There occur a lot of challenges while designing, maintaining and retrieving data from multimedia database. For most multimedia application, the receiver has limited buffer. If no measure is taken to smooth the data stream, it may overflow or underflow the application buffer. One of the main challenges is to bridge the gap between the concepts in the real world environment of the end users and the low level features that can be presented and computed from the raw data of multimedia objects. The use of IR theory was presented for this purpose and a novel architecture for multimedia database management systems that integrates these techniques in all levels of the system proposed.
FUTURE WORK:
Future work in the information access research lone consists of the application of machine learning techniques to improve the representations of multimedia objects in the concept layer using feedback across sessions. Also, significant improvements are expected in the quality of multimedia information retrieval, by obtaining finer granted information from the dialogue with the user.
REFERENCES
1. Multimedia: computing, communication and application by Ralf Steinmetz, KlaraNahrstedt, Prentice Hall2. Multimedia Database Management System by B. Prabhakaran, Springer3. https://en.wikipedia.org/wiki/Multimedia_database 4. Managing and Mining Multimedia Databases By Bhavani Thuraisingham
101

REVIEW ON ACID RAIN Anand kumarStudent EWM
ABSTRACT
Acid rain in reality has been well documented for many places, viz. the eastern USA, Canada, Bermuda, etc. Plants are drastically affected by acid rain (AR)-caused acid deposition. One of the main effects of acid rainfall on plants is the leaching of nutrients and cations from leaves. The literature review of acid rain-induced effects on various plants is described in the present paper, which gives the detailed description of different AR-induced effects observed in herbs, crop and vegetable plants, trees and forest, etc.
INTRODUCTION
Acid rain is rainfall that has been acidified by oxides of sulfur and nitrogen. Acid rain usually has a pH of less than 5.6. Acid rain is formed when pollutants called oxides of sulfur and nitrogen, contained in power plant smoke, factory smoke, and car exhaust, react with the moisture in the atmosphere. It is a rain or any other form of precipitation that is unusually acidic. i.e. elevated levels of hydrogen ion. It can have harmful effects on plants, aquatic animals, and infrastructure through the process of wet deposition. Acid rain is caused by emissions of compounds of ammonium, carbon, nitrogen, and sulfur which react with the water molecules in the atmosphere to produce acids. Also, Dry deposition, such as soot and ash, sleet, hail, snow, smog and low level ozone are forms that Acid rain. AR is caused by emissions of SO2 and NO, which react with the water molecules in the atmosphere to produce acids. These pollutants (SO2, NOX), once released into the atmosphere, can be converted chemically (under the influence of sunlight and moisture) into secondary pollutants such as sulphuric acid (H2SO4) and nitric acid (HNO3). Both H2SO4 and HNO3 can dissolve easily in clouds and water. Ambient concentrations of the primary pollutants, SO2 and NOX, and the secondary pollutants, ozone (O3) and acidic wet deposition have been reported. The effects of the above gaseous pollutants (O3, SO2, NOX) and AR have been assessed and compared for a wide variety of crop cultivars and species. In simple words, Acid rain is acid mixed with rain water. Some acidic gases mixed in air, such as sulfur dioxide, some oxides of nitrogen etc. on prolonged reaction with oxygen and moisture of air produce various acids. When there is rain, these acids (along with some suspended particulate substances) being dissolved in rain water come down on the earth and may render the soil or water of surface water bodies acidic. Acid rain is thus an outcome of air pollution
THE HISTORY OF THE ACID RAIN PROBLEM
Here is a little bit on the history of the acid rain problem. The problem of acid rain probably originated during the 1730's, at the height of the industrial revolution. It was discovered in the 1950's and started being noticed in the 1960's. Since the 1960's, the problem has gotten worse in rural areas because the tall chimneys on factories allow the wind to transport pollutants far away from their sources. In 1984 it was reported that almost half of the trees in the famous black forest in Germany had been damaged by acid rain. In 1988, as part of the United Nations-sponsored Long Range Trans boundary Air Pollution Agreement, the U.S.A. and 24 other nations agreed to some rules limiting nitrogen oxide emissions to 1987 levels.1990 changes to the Clean Air Act set rules to cut down the release of sulfur dioxide from power plants down to 10 million tones by January 1, 2000.
DATA COLLECTION
CASE STUDY:
102

There are many bad things that have happened because of acid rain and here are some. In Sweden, drinking water once contained enough water to make people's hair turn green. In the Czech Republic, many trees lost all their leaves as a result of acid rain. The Taj Mahal in India, one of the ten wonders of the world, is being constantly threatened by acid rain. Some famous statues, such as the Lincoln Memorial and Michelangelo’s statue of Marcus Aurelius, have started deteriorating because of acid rain. In London in 1952, very thick acid smog killed 4,000 people
This map shows the areas that are currently affected by acid rain (heavily or moderately) and could be affected by acid rain in the future
SOURCES OF UK SULPHURE DIOXIDE & NITROGEN OXIDES, 1999.
SULPHUR DIOXIDE NITROGEN OXIDES
Domestic 4%Commercial 2%Road Transport 1%Power Stations 65%Refineries 8%Other Industry 10%Shipping 2%Iron & Steel 4%
(total in 1999 = 1.19 million tonnes)
Domestic 4%Commercial 2%Road Transport 44%Power Stations 21%Refineries 2%Other Industry 9%Shipping 3%Iron & Steel 2%
(total in 1999 = 1.61 million tonnes)
103

FINDINGS
IMPACT
Acid rain can be caused by many things. Industrial emissions from factories and power plants that burn fuels such as natural gas, coal or oil, emit smoke that gives off oxides of sulfur and nitrogen is one cause. Another cause is vehicles (e.g. cars, buses) that burn gasoline and diesel. The exhaust emitted by burning these fuels contains sulfur dioxide, an oxide of sulfur. Also, vehicles that have gas engines will produce oxides of nitrogen, another cause of acid rain. One other cause is home fires giving off smoke that contains sulfur dioxide. Some fairly minor causes are natural causes which are volcanoes, swamps and rotting plants giving off sulfur dioxide. Natural causes only account for 10% of the pollution causing acid rain.
EFFECTS AND PROBLEMS
There are many problems and effects caused by acid rain. Acid rain can cause buildings, statues and bridges to deteriorate faster than usual. Another problem is it harms thousands of lakes, rivers, and streams worldwide. It disrupts lake ecosystems and kill wildlife in affected lakes, rivers and streams. Acid rain also damages soil and the tree roots in it. When soil is acidified, tree roots are damaged, leaving them not able to draw in enough nutrients to support the tree. When acid rain falls on trees, it makes their leaves turn brownish-yellow and the tree can no longer carry out photosynthesis properly. Another problem is it will harm people when they breathe in smog, acid rain in one of its many forms. Acid rain can also harm people indirectly. This happens when people eat fish caught in affected lakes or rivers. Also, if the water source is acidic enough, it will react with copper or lead pipes to harm humans. It also washes aluminum into the water supply. Birds can be harmed if they live in affected waters or feed on fish living in affected waters.
EFFECT ON CROP AND VEGETABLE PLANTS
Crop and vegetable plants have shown a wide range of sensitivity to the acidity of rain water. As reported by Firebaugh , the effects of SiAR (pH < 3) on Phaseolus vulgaris L. plants exhibited a failure to attain normal height, had necrotic and wrinkled leaves, excessive and adventitious budding, and premature abscission of primary leaves. Again, apparent rates of photosynthesis, however, increased dramatically. Both carbohydrate production and root biomass were reduced by low pH treatments, and application of Congo red indicator to the acid-treated leaf tissue showed that the cell contents were acidified to a pH of below 4.0. it has been reported that Arabidopsis leaves treated with SiAR showed phenotypes similar to necrotic lesions caused by biotic stresses like pseudomonad infiltration. Again, exposure of Arabidopsis to SiAR resulted in the up-regulation of genes. In their report, they suggested that SiAR activates at least the salicylic acid pathway, and activation of this pathway is sensitive to sulfuric acid. The impact of SiAR with pHlevels of 5.0, 4.0 and 3.0 on three most popular vegetable plants species, viz. Capsicum annuum, Lycopersicon esculentum and Solanum melongea of the family Solanaceae. From the above study, they have reported that the growth parameters and fruiting were severely curtailed with increasing acidity in all the three species.
EFFECT ON TREE AND FOREST
The effect of AR on higher plants viz. pine , Beech and Holm Oak, apple tree, litchi , and even forest is highly adverse due to acid deposition. Leaf is the most sensitive organ to AR-caused pollutant damage, and has been the target of many studies. Usually, the effect of acid depositions on higher plants arises in two ways-either through foliage or through roots. The symptoms include direct damage to the plant tissue (especially roots and foliage), reduced canopy cover, crown dieback and whole tree death. The germination rate of Norway spruce, Scots Pine and silver birch seeds was found to be moderately inhibited at pH 3.8 and 5.4photosynthetic rate on a unit chlorophyll basis, and on chlorophyll degradation. When NO3- concentrations in rain water increased, the chlorophyll a+b
104

contents of the leaves increased in parallel, even though the pH of the simulated rain decreased. The nitrogen content of the rain was sufficient to stimulate the production of chlorophyll and was able to override any degradative effect expected due to the H+ input from AR. The AR does, therefore, simultaneously increase chlorophyll content and reduce the efficiency of the use of chlorophyll in photosynthesis. This reduced efficiency may be linked to the increase in the rate of degradation of chlorophyll to pheophytin.
EFFECT ON HERB
To the best of my knowledge is concerned, there are only a few reports available on the effect of medicinal herbs due to acid rain. The effects of simulated acid rain (SiAR) of pH 2.5, 3.5, 4.5 and 5.5 on chlorophyll and ascorbic acid contents of two cultivars of a medicinal herb Menthapiperita. In the above study, they found that chlorophyll and ascorbic acid contents of the leaves were adversely affected (at pH 2.5 and 3.5), and chlorophyll-a showed more reduction than chlorophyll-b. In both the cultivars, more sensitive on chlorophyll and ascorbic acid contents. Various aluminium-based new phases formed due to the substitution of sulphur, which have been analyzed using X-Ray diffraction technique, have been reported in Behera. In this study, an attempt has been made to analyze the various aluminium phase (salt) formations due to the substitution of sulphur because of their toxicological importance. The new phases like AIH(SO4)2 and AI2S3 along with usual Al2O3; H2O, MgO, FeAI2 (PO4)2 (OH)2; 8H2O, and (K2Ca(SO4)2; H2O), when treated with sulphuric-simulated acid rain of two different pH (3.39 and 5.45) for 20 weeks.
AREAS AFFECTED
There are several places around the world affected by acid rain and here are the main ones. The Northeastern section of the United States where acid rain is caused by high numbers of factories and power plants is one affected area. Also in that same region, the Southeastern section of Canada is affected and the main cause is factories in the Toronto-Hamilton area and possibly large numbers of automobiles. Central Europe (Black Triangle of Lower Silesia in Poland, Southern Saxony in Germany and Northern Bohemia in Czech Republic) and Scandinavia (Sweden, Norway and Finland) are also affected, here being the British and other European factories doing the damage. One more main area that is affected is parts of Asia, specifically India and China, where acid rain is caused by large numbers of factories.
RECOMMENDATIONS
There are many possible solutions to the acid rain problem. One is to use fuels that burn more cleanly. Another solution is to burn coal more efficiently. Power plant and factory chimneys can be fitted with a scrubber that release 90-95% sulfur free smoke and also produces sludge from which gypsum, a building material, can be produced. This problem can also be solved by enforcing tight emission standards on vehicles that burn gas and diesel. One other solution is fitting devices such as a catalytic converter into car exhaust pipes to minimize the amount of sulfur dioxide in car exhaust.
We can do things to help solve the acid rain problem. We can cut back on car use by walking, cycling, using public transit or carpooling. We can also help by turning off electrical devices not in use such as lights and computers.
REFRERENCES:
1. Likens, Gene E.; Keene, William C.; Miller, John M.; Galloway, James N. (1987). "Chemistry of precipitation from a remote, terrestrial site in Australia". Journal of Geophysical Research. 92: 13299. Bibcode:1987JGR....9213299L. doi:10.1029/JD092iD11p13299.
2. E. S. de Beer, ed. The Diary of John Evelyn, III, 1955 (19 September 1667) p. 495.3. Glossary, United States: NASA Earth Observatory, acid rain, archived from the original on 2011-12-13,
retrieved 2013-02-15
105

4. Weathers, K. C. and Likens, G. E. (2006). "Acid rain", pp. 1549–1561 in: W. N. Rom and S. Markowitz (eds.). Environmental and Occupational Medicine. Lippincott-Raven Publ., Philadelphia. Fourth Edition, ISBN 0-7817-6299-5.
5. Seinfeld, John H.; Pandis, Spyros N (1998). Atmospheric Chemistry and Physics — From Air Pollution to Climate Change. John Wiley and Sons, Inc. ISBN 978-0-471-17816-3
6. Likens, G. E.; Bormann, F. H.; Johnson, N. M. (1972). "Acid rain". Environment. 14 (2): 33–40. doi:10.1080/00139157.1972.9933001.
7. Acid Rain in New England, A Brief History Archived September 25, 2010, at the Wayback Machine.. Epa.gov. Retrieved on 2013-02-09.
8. Likens, G. E.; Bormann, F. H. (1974). "Acid Rain: A Serious Regional Environmental Problem". Science. 184 (4142): 1176–9. doi:10.1126/science.184.4142.1176. PMID 17756304.
9. Keller, C. K.; White, T. M.; O'Brien, R.; Smith, J. L. (2006). "Soil CO2 dynamics and fluxes as affected by tree harvest in an experimental sand ecosystem". Journal of Geophysical Research. 111. Bibcode:2006JGRG..111.3011K. doi:10.1029/2005JG000157.
10. Galloway, JN; Dianwu, Z; Jiling, X; Likens, GE (1987). "Acid rain: China, United States, and a remote area". Science. 236(4808): 1559–62. doi:10.1126/science.236.4808.1559. PMID 17835740.
11. Chandru (2006-09-09). "CHINA: Industrialization pollutes its country side with Acid Rain". Southasiaanalysis.org. Archived from the original on June 20, 2010. Retrieved 2010-11-18.
12. Lefohn, A.S.; Husar, J.D.; Husar, R.B. (1999), Global Sulfur Emissions Database, United States: A.S.L. & Associates
13. Likens, G. E.; Wright, R. F.; Galloway, J. N.; Butler, T. J. (1979). "Acid rain". Scientific American. 241 (4): 43–51. doi:10.1038/scientificamerican1079-43.
14. Likens, G. E. (1984). "Acid rain: the smokestack is the "smoking gun"". Garden. 8 (4): 12–18.15. "Art Under Wraps", Harvard Magazine, March–April 200016. Likens, Gene E.; Bormann, F. Herbert; Johnson, Noye M. "Acid Rain". Environment: Science and Policy
for Sustainable Development. 14 (2): 33–40. doi:10.1080/00139157.1972.9933001.17. Johnson, Noye M.; Driscoll, Charles T.; Eaton, John S.; Likens, Gene E.; McDowell, William H. (1981-09-
01). "'Acid rain', dissolved aluminum and chemical weathering at the Hubbard Brook Experimental Forest, New Hampshire". Geochimica et Cosmochimica Acta. 45 (9): 1421–1437. doi:10.1016/0016-7037(81)90276-3.
18. Hall, Ronald J.; Likens, Gene E.; Fiance, Sandy B.; Hendrey, George R. (1980-08-01). "Experimental Acidification of a Stream in the Hubbard Brook Experimental Forest, New Hampshire". Ecology. 61 (4): 976–989. doi:10.2307/1936765. ISSN 1939-9170.
19. Lackey, R.T. (1997). "Science, policy, and acid rain: lessons learned" (PDF). Renewable Resources Journal. 15 (1): 9–13.
20. Winstanley, Derek; Lackey, Robert T.; Warnick, Walter L.; Malanchuk, John (1998). "Acid rain: Science and policy making". Environmental Science & Policy. 1: 51. doi:10.1016/S1462-9011(98)00006-9.
21. Times, Robert Reinhold, Special To The New York (1982-06-08). "ACID RAIN ISSUE CREATES STRESS BETWEEN ADMINISTRATION AND SCIENCE ACADEMY". The New York Times. ISSN 0362-4331. Retrieved 2016-11-16.
22. "Ronald Reagan on Environment". www.ontheissues.org. Retrieved 2016-11-16.23. "HYSTERIA ABOUT ACID RAIN Even Ronald Reagan now casts it as the villain. He is overriding a lot
of scientific evidence. - April 14, 1986". archive.fortune.com. Retrieved 2016-11-16.24. "Ronald Reagan: Nomination of William A. Nierenberg To Be a Member of the National Science
Board". www.presidency.ucsb.edu. Retrieved 2016-11-16.25. "Report of the Acid Rain Peer Review Panel". Document Display | NEPIS | US EPA. July 1984.
Retrieved 2016-11-16.26. "From tobacco to climate change, 'merchants of doubt' undermined the science". Grist. 2010-04-17.
Retrieved 2016-11-16.27. Franklin, Ben A. (1984-08-18). "LEGISLATORS SAT WHITE HOUSE SUPPRESSED ACID RAIN
REPORT". The New York Times. ISSN 0362-4331. Retrieved 2016-11-16.28. "US EPA: A Brief History of Acid Rain". Epa.gov. Archived from the original on 2010-09-25.
Retrieved 2010-11-18.29. 'Cap-and-trade' model eyed for cutting greenhouse gases, San Francisco Chronicle, December 3, 2007.30. "Facts On File News Services Databases". 2facts.com. Retrieved 2010-11-18.[permanent dead link]
106

31. Gilberston, T. and Reyes, O. 2009. Carbon Trading: how it works and why it fails. Dag Hammarskjöld Foundation: 22
32. Acid Rain Program 2007 Progress Report, United States Environmental Protection Agency, January 2009.33. Gerdes, Justin. "Cap and Trade Curbed Acid Rain: 7 Reasons Why It Can Do The Same For Climate
Change". Forbes. Forbes. Retrieved 27 Oct 2014.34. Muki Haklay (2015). "Citizen Science and Policy: A European Perspective" (PDF). Woodrow Wilson
International Center for Scholars. p. 11. Retrieved 3 June 2016.35. R. Kerson (1989). "Lab for the Environment". MIT Technology Review. Vol. 92 no. 1. pp. 11–12.36. Berresheim, H.; Wine, P.H. and Davies D.D. (1995). "Sulfur in the Atmosphere". In Composition,
Chemistry and Climate of the Atmosphere, ed. H.B. Singh. Van Nostrand Rheingold ISBN 0-442-01264-037. Clean Air Act Reduces Acid Rain In Eastern United States, ScienceDaily, September 28, 199838. "UK National Air Quality Archive: Air Pollution Glossary". Airquality.co.uk. 2002-04-01. Archived
from the original on 2009-04-17. Retrieved 2010-11-18.39. US EPA: Effects of Acid Rain – Surface Waters and Aquatic Animals40. Rodhe, H., et al. The global distribution of acidifying wet deposition. Environmental Science and
TEchnology. vlo. 36, no. 20 (October) p. 4382–841. US EPA: Effects of Acid Rain – Forests Archived July 26, 2008, at the Wayback Machine.42. Likens, G.E.; Driscoll, C.T.; Buso, D.C.; Mitchell, M.J.; Lovett, G.M.; Bailey, S.W.; Siccama, T.G.;
Reiners, W.A.; Alewell, C. (2002). "The biogeochemistry of sulfur at Hubbard Brook" (PDF). Biogeochemistry. 60 (3): 235. doi:10.1023/A:1020972100496.
43. Likens, G. E.; Driscoll, C. T.; Buso, D. C. (1996). "Long-Term Effects of Acid Rain: Response and Recovery of a Forest Ecosystem" (PDF). Science. 272 (5259): 244. doi:10.1126/science.272.5259.244.
44. DeHayes, D.H., Schaberg, P.G. and G.R. Strimbeck. (2001). Red Spruce Hardiness and Freezing Injury Susceptibility. In: F. Bigras, ed. Conifer Cold Hardiness. Kluwer Academic Publishers, the Netherlands ISBN 0-7923-6636-0.
45. Lazarus, Brynne E.; Schaberg, Paul G.; Hawley, Gary J.; DeHayes, Donald H. (2006). "Landscape-scale spatial patterns of winter injury to red spruce foliage in a year of heavy region-wide injury" (PDF). Can. J. For. Res. 36: 142–152. doi:10.1139/x05-236.[permanent dead link] high beam copy
46. "Acid Rain Has Disproportionate Impact on Near-Shore Ocean Waters - Windows to the Universe". www.windows2universe.org.
47. Effects of Acid Rain – Human Health. Epa.gov (2006-06-02). Retrieved on 2013-02-09.48. "ICP on effects on materials". Water, Air, & Soil Pollution. 85: 2701–2706. doi:10.1007/BF01186242.
Retrieved 2010-11-18.49. "Approaches in modeling the impact of air pollution-induced material degradation" (PDF). Retrieved 2010-
11-18.50. Ed. Hatier (1993). "Acid Rain in Europe". United Nations Environment Programme GRID Arendal.
Archived from the original on 2009-08-22. Retrieved 2010-01-31.51. US Environmental Protection Agency (2008). "Clean Air Markets 2008 Highlights". Retrieved 2010-01-31.52. "Acid Rain - Green Education Foundation | GEF | Sustainability
Education". Www.greeneducationfoundation.org. Retrieved 2017-11-02.
107

OZONE DEPLETION REVIEW
HIMANSHU SONAStudent EWMABSTRACTOzone (O3) is a stratospheric layer that plays important role in providing support to humans for their survival. It is an essential factor for many global, biological and environmental phenomena. The ultra-violet (UV) rays emitted from sun are captured by ozone and thereby provide a stable ontological structure in the biosphere. Various anthropogenic activities such as emissions of CFCs, HCFCs and other organo-halogens lead to the depletion of ozone. The ozone depletion resulted in secondary production of an ozone layer near the ground (terrestrial ozone layer), which is responsible for adverse effects on plants, humans and environment with increased number of bronchial diseases in humans. The mutations caused by UV rays result in variation in morphogenic traits of plants which ultimately decreases crop productivity. However, UV radiation is required in optimum intensity for both plants and animals. This review takes into an account the wide ranging effects of ozone depletion with a majority of them being detrimental to the plant system.
INTRODUCTION
That is, the layer of life-protecting ozone found at the top of the stratosphere. A brief history of the discovery of the ozone 'hole' is included. The general concepts found in this section include the following:Concentrations of stratospheric ozone represent a balance, established over eons, between creative and destructive forces and this balance, or dynamic equilibrium, has been changed by human activity. Ozone is formed in the earth's stratosphere and is critical to life on earth as we know it. There is compelling scientific evidence that ozone is destroyed in the stratosphere and that some human-released chemicals are speeding up the breakdown of ozone in the atmosphere. CFCs, a human-developed compound, are particularly destructive to the breakdown of ozone in the atmosphere. Ultraviolet radiation is present in natural outdoor light and can be blocked or filtered by various substances.
HISTORY
Ozone depletion describes two distinct but related phenomena observed since the late 1970s: a steady decline of about 4% per decade in the total volume of ozone in Earth's stratosphere (the ozone layer), and a much larger springtime decrease in stratospheric ozone over Earth's Polar Regions. The latter phenomenon is referred to as the ozone hole. In addition to these well-known stratospheric phenomena, there are also springtime polar troposphere ozone depletion events.CFCs were invented by Thomas Midgley, Jr. in the 1920s. They were used in air conditioning and cooling units, as aerosol spray propellants prior to the 1970s, and in the cleaning processes of delicate electronic equipment. They also occur as by-products of some chemical processes. No significant natural sources have ever been identified for these compounds — their presence in the atmosphere is due almost entirely to human manufacture. As mentioned above, when such ozone-depleting chemicals reach the stratosphere, they are dissociated by ultraviolet light to release chlorine atoms. The chlorine atoms act as a catalyst, and each can break down tens of thousands of ozone molecules before being removed from the stratosphere. Given the longevity of CFC molecules, recovery times are measured in decades. It is calculated that a CFC molecule takes an average of about five to seven years to go from the ground level up to the upper atmosphere, and it can stay there for about a century, destroying up to one hundred thousand ozone molecules during that time.
IMPACT OF OZONE LAYER DEPLETION
Increased UV, is responsible for most of the absorption of UVB radiation. The amount of UVB radiation that penetrates through the ozone layer decreases exponentially with the slant-path thickness and density of the layer. When stratospheric ozone levels decrease, higher levels of UVB reach the Earth’s surface UV-driven phenolic formation in tree rings has dated the start of ozone depletion in northern latitudes to the late 1700s.Ozone, while a minority constituent in Earth's atmosphere in October 2008, the Ecuadorian Space Agency published a report called
108

HIPERION, a study of the last 28 years data from 10 satellites and dozens of ground instruments around the world among them their own, and found that the UV radiation reaching equatorial latitudes was far greater than expected, with the UV Index climbing as high as 24 in some very populated cities; the WHO considers 11 as an extreme index and a great risk to health. The report concluded that depleted ozone levels around the mid-latitudes of the planet are already endangering large populations in these areas. Later, the CONIDA, the Peruvian Space Agency, published its own study, which yielded almost the same findings as the Ecuadorian study.
BIOLOGICAL EFFECTS
EFFECTS ON HUMANS
Some of the possible harmful effects of increased UV-B light on humans include: Immune inhibition Skin deterioration Cataracts Skin cancer
IMMUNEINHIBITIONThe effects of immune inhibition, skin deterioration and cataracts will not be quantified here for the following reasons: Immune inhibition has been demonstrated in laboratory animals but is not well quantified. Also, cancers other than skin cancer do not increase at lower latitudes (where there is greater UV-B).
SKIN DETERIORATION
Skin deterioration due to sunlight is well documented but primarily affects. Appearance and is not life-threatening
CATARACTS
Cataracts are a major cause of blindness in the world. In countries with good medical facilities, surgery can prevent most cataracts from causing blindness. Nevertheless, even in the U.S., cataracts are a leading cause of blindness. Every year, about 50,000 Americans become blind. Worldwide, there are approximately 17 million people who are blind due to cataracts, accounting for more than 50% of the blindness in the world (UNEP, 1994).
SKIN CANCER
There are two basic types of skin cancer: melanoma and non-melanoma.Melanoma is the most serious form of skin cancer and is also one of the fastest growing types of cancer in the U.S.
If not caught in its early stages, melanoma is often fatal. Melanoma cases in the U.S. have almost doubled in the
past two decades with 34,000 cases and 7,200 deaths in 1995 alone (Long et al., 1996). This corresponds to a lifetime cancer risk factor of roughly one per 100 persons.Non-melanoma skin cancer is the most common form of all cancers, but has a low fatality rate. There were an estimated 800,000 cases and 2,100 deaths in 1995 (Long et al., 1996) in the U.S. The lifetime cancer risk factor for non-melanoma skin cancer in the U.S. is roughly one in five persons.The evidence for UV being a causative factor in skin cancers are as follows:There is a striking increase with decreasing latitude (increasing UV-B).The cancers are most often found on areas of the body exposed to the sun.The incidence is higher in people with outdoor occupations, and is higher in men that in women (although this is not the case for melanoma skin cancer).The incidence increases with age.Conclusions are supported by animal studies.
109

CONCLUSION:
The potential effects of an increase in UV-B radiation on the biosphere due to ozone depletion are very serious. It is fortunate the world governments have united to restrict the production and use of chlorofluorocarbons. Many of the worlds food staples would be adversely impacted by an increase in UV-B light. Because of the adverse impact of UV-B light on the productivity of phytoplankton and zooplankton, marine fisheries would be severely impacted.In addition, a decrease in the productivity of forests and phytoplankton due to increased UV-B would dramatically reduce the uptake of carbon dioxide by plants. This would not only reduce oxygen production but would contribute to global warming, with attendant changes in cloud cover, precipitation patterns, temperatures, and so on, which would impact all life on this planet.The complexity of interdependent effects makes it virtually impossible to predict the full consequences of ozone depletion on the biosphere. Fortunately, actions are already being taken by the world community to deal with this problem.
REFRENCES :
1. "Twenty Questions and Answers About the Ozone Layer". Scientific Assessment of Ozone Depletion: 2010 (PDF). World Meteorological Organization. 2011. Retrieved March 13, 2015.
2. Jump up ^ Andino, Jean M. (October 21, 1999). "Chlorofluorocarbons (CFCs) are heavier than air, so how do scientists suppose that these chemicals reach the altitude of the ozone layer to adversely affect it?". Scientific American.
3. Jump up ^ "Part III. The Science of the Ozone Hole". Retrieved March 5, 2007.4. ^ Jump up to:a b "The Antarctic Ozone Hole Will Recover – June 4, 2015". NASA. Retrieved 2017-08-05.5. Jump up ^ Newman, Paul A. "Chapter 5: Stratospheric Photochemistry Section 4.2.8 ClX catalytic
reactions". In Todaro, Richard M. Stratospheric ozone: an electronic textbook. NASA Goddard Space Flight Center Atmospheric Chemistry and Dynamics Branch. Retrieved May 28, 2016.
6. Jump up ^ "Stratospheric Ozone Depletion by Chlorofluorocarbons (Nobel Lecture)—Encyclopedia of Earth". Eoearth.org. Archived from the original on September 9, 2011.
7. Jump up ^ Scientific Assessment of Ozone Depletion 2010, National Oceanic & Atmospheric Administration
8. Jump up ^ "The Ozone Hole Tour: Part II. Recent Ozone Depletion". University of Cambridge. Retrieved March 28, 2011.
9. ^ Jump up to:a b c Solomon, Susan, et al. (June 30, 2016). "Emergence of healing in the Antarctic ozone layer". Science. 353 (6296): 269–74. Bibcode:2016Sci...353..269S. doi:10.1126/science.aae0061. PMID 27365314.
10. Jump up ^ https://www.nasa.gov/feature/goddard/2017/warm-air-helped-make-2017-ozone-hole-smallest-since-1988
11. Jump up ^ U.S. EPA: Ozone Depletion. epa.gov12. ^ Jump up to:a b "Myth: Ozone Depletion Occurs Only In Antarctica". EPA. June 28, 2006.
Retrieved March 28, 2011.13. Jump up ^ Self, Stephen, et al. (1996). "The Atmospheric Impact of the 1991 Mount Pinatubo Eruption".
USGS. Retrieved May 28,2016.14. ^ Jump up to:a b "Climate Change 2001: Working Group I: The Scientific Basis". Intergovernmental Panel
on Climate Change Work Group I. 2001. pp. Chapter 6.4 Stratospheric Ozone. Retrieved May 28, 2016.15. Jump up ^ 2008 News, Briefs, and Features. NASA16. Jump up ^ "Climate Change 2013: The Physical Science Basis". UNEP. Retrieved May 28, 2016.17. Jump up ^ "Scientific Assessment of Ozone Depletion 1998 – Preface". US National Oceanic &
Atmospheric Administration. Retrieved 21 December 2012.18. Jump up ^ P. A. Newman; J. S. Daniel; D. W. Waugh; E. R. Nash (2007). "A new formulation of
equivalent effective stratospheric chlorine (EESC)". Atmos. Chem. Phys. 7 (17): 4537–52. doi:10.5194/acp-7-4537-2007.
19. Jump up ^ "chlorofluorocarbons". Encyclopedia.com. Retrieved March 28, 2011.
110

20. Jump up ^ Johannes C. Laube; Mike J. Newland; Christopher Hogan; Carl A. M. Brenninkmeijer; Paul J. Fraser; Patricia Martinerie; David E. Oram; Claire E. Reeves; Thomas Röckmann; Jakob Schwander; Emmanuel Witrant; William T. Sturges (March 9, 2014). "Newly detected ozone-depleting substances in the atmosphere". Nature Geoscience. 7 (4): 266–269. Bibcode:2014NatGe...7..266L. doi:10.1038/ngeo2109. Retrieved March 10, 2014.
21. Jump up ^ McGrath, Matt. "Mysterious new man-made gases pose threat to ozone layer". BBC. Retrieved March 10, 2014.
22. Jump up ^ Nash, Eric; Newman, Paul (September 19, 2001). "NASA Confirms Arctic Ozone Depletion Trigger". Image of the Day. NASA. Retrieved April 16, 2011.
23. Jump up ^ Sparling, Brien (June 26, 2001). "Antarctic Ozone Hole". NASA Advanced Supercomputing Department. Archived from the original on April 3, 2009. Retrieved April 16, 2011.
24. Jump up ^ Parson, Robert (December 16, 1997). "Antarctic ozone-depletion FAQ, section 7". Faqs.org. Retrieved April 16, 2011.
25. Jump up ^ Toon, Owen B.; Turco, Richard P. (June 1991). "Polar Stratospheric Clouds and Ozone Depletion" (PDF). Scientific American. 264 (6): 68–74. Bibcode:1991SciAm.264...68T. doi:10.1038/scientificamerican0691-68. Retrieved April 16, 2011.
26. Jump up ^ Sumi´nska-Ebersoldt; Lehmann, R.; Wegner, T.; Grooß, J.-U.; Hösen, E.; Weigel, R.; Frey, W.; Griessbach, S.; Mitev, V.; Emde, C.; Volk, C. M.; Borrmann, S.; Rex, M.; Stroh, F.; von Hobe, M.; et al. (July 2011). "ClOOCl photolysis at high solar zenith angles: analysis of the RECONCILE self-match flight" (PDF). Atmos. Chem. Phys. 12 (3): 1353–1365. Bibcode:2012ACP....12.1353S. doi:10.5194/acp-12-1353-2012. Retrieved October 9, 2012.
27. Jump up ^ "Ozone Facts: What is the Ozone Hole?". Ozone Hole Watch. NASA. November 18, 2009. Retrieved April 16, 2011.
28. Jump up ^ Rowland, Frank Sherwood (May 29, 2006). "Stratospheric ozone depletion". Phil. Trans. R. Soc. B. 361 (1469): 769–790. doi:10.1098/rstb.2005.1783. PMC 1609402 . PMID 16627294. 4. Free radical reactions for ozone removal: Reaction 4.1
29. Jump up ^ Boyesa, Edward; Stanisstreeta, Martin (1992). "Students' perceptions of global warming". International Journal of Environmental Studies. 42 (4): 287–300. doi:10.1080/00207239208710804.
30. Jump up ^ Compare Sheldon Ungar, 2000 and various web sites such as Gavin Schmidt's realclimate complaint in Ozone depletion and global warming 2005 or the UCS FAQ on the topic
31. ^ Jump up to:a b c d e f Reiner Grundmann Technische Problemlösung, Verhandeln und umfassende Problemlösung, generic problem solving capability) in Gesellschaftliche Komplexität und kollektive Handlungsfähigkeit (Societys complexity and collective ability to act), ed. Schimank, U. (2000). Frankfurt/Main: Campus, p.154-182 book summary at the Max Planck Gesellschaft
32. Jump up ^ "Öko-Coup aus Ostdeutschland". September 13, 2013.33. ^ Jump up to:a b c d Ungar, Sheldon (1 July 2000). "Knowledge, ignorance and the popular culture: climate
change versus the ozone hole". Public Understanding of Science. 9 (3): 297–312. doi:10.1088/0963-6625/9/3/306. ISSN 0963-6625.
34. Jump up ^ Grundmann, Reiner (14 May 2007). "Climate Change and Knowledge Politics" (PDF). Environmental Politics. 16 (3): 414–432. doi:10.1080/09644010701251656.
35. ^ Jump up to:a b Zehr, Stephen C. (1994). "Accounting for the Ozone Hole: Scientific Representations of an Anomaly and Prior Incorrect Claims in Public Settings". The Sociological Quarterly. 35 (4): 603–19. doi:10.1111/j.1533-8525.1994.tb00419.x. JSTOR 4121521.
36. Jump up ^ "Climate Change 2001: Working Group I: The Scientific Basis". Intergovernmental Panel on Climate Change Work Group I. 2001. pp. Chapter 9.3.2 Patterns of Future Climate Change. Retrieved May 28, 2016.
37. Jump up ^ Muir, Patricia (March 6, 2008). "Stratospheric Ozone Depletion". Oregon State University. Retrieved April 16, 2011.
38. Jump up ^ "Long-term increase in summer UV radiation". NIWA. Retrieved December 4, 2013.39. Jump up ^ McKenzie, Richard; Conner, Brian; Bodeker, Greg (September 10, 1999). "Increased
Summertime UV Radiation in New Zealand in Response to Ozone Loss". Science. 285 (5434): 1709–1711. doi:10.1126/science.285.5434.1709. PMID 10481002.
111

40. Jump up ^ "Health and Environmental Effects of Ozone Layer Depletion". EPA. Retrieved September 26, 2013.
41. Jump up ^ "Reconstruction of Paleobehavior of Ozonosphere Based on Response to UV-B Radiation Effect in Dendrochronologic Signal" (PDF). Atmospheric Radiation Measurement, USA. Retrieved May 28, 2016.
42. Jump up ^ Lilley, Ray (October 5, 2000). "Ozone Hole Over City for First Time". Associated Press. Retrieved March 13, 2015.
43. Jump up ^ de Gruijl, Frank R. (Summer 1995). "Impacts of a Projected Depletion of the Ozone Layer". Consequences. 1 (2).
44. Jump up ^ TR Fears; CC Bird; D Guerry; et al. (2002). "Average midrange ultraviolet radiation flux and time outdoors predict melanoma risk". Cancer Res. 62 (14): 3992–6. PMID 12124332
112

DEFINING DESERTIFICATION
Shitanshu Shekhar JhaStudent EWM
ABSTRACT
The concept of desertification was introduced in the late forties to designate a number of ecological degradation processes in tropical Africa, in particulate the progressive transformation of tropical forests in even drier ecosystem. Since, then the word has received a number of other meanings, some of the contradictory, most of them ambiguous.This paper reviews the historical developments that lead to the introduction of the concept of desertification, sum arises some of the reasons why this issue is so controversial and suggests specific elements that should be incorporated in the definition of the concept. The point is made that each people of the concept should probably design a definition for his or her own use, depending on the goal, among other things.
Even a short look at the literature will show that the term desertification has been accepted from the various scientific communities and that it has received a number of contradictory definitions and meanings. It is therefore difficult to start talking about desertification without bias. The first section below will nevertheless attempt such an approach. In the second section, I will describe briefly how this term came about and how its meaning evolved in time. In the third section, I will present sample published definition as different and contradictory as possible, to show the extent of the confusion, and in the fourth section I will try to rationalize these contradictions, with view to identify the basic element that should be included in a definition for it to be both unambiguous and useful.
1) NEUTRAL APPROACH –One way to try to define desertification is as an unbiased way as possible to look at the etymology of the word. Desertification is composed of “desert” and “fiction” a suffix, also used in many other words like electrification. Usually this suffix means the making of, the production of something. Then a first definition of desertification could be “the making of the desert” or “the production of desert condition”.The National center for atmospheric research is operated by the university corporation for atmospheric research and sponsored by the national science foundation. This approach seems simple enough, but it has merely displaced the main problem, which is now to clarify what a desert is! Of course every scientific discipline has its own definition of what a desert is, but for most standard directories the verb ‘to desert’ means to abandon, the adjective ‘desert’ describe an uninhabited region and the noun ‘desert’ refers to a bare or water less land.If we accept this meaning, desertification becomes the creation or maintenance of barren or waterless region. Whether this particular approach or even used in the past in another question: I am just suggesting that this might be a starting point in our investigations of the published definition of desertification. Because it does not refer to any particular discipline, it should be agreeable to most interested researchers, at least as a starting point.
2) HISTORICAL BACKGROUND –
Environment degradation in arid and semi-arid regions is a very old problem for human civilizations. People have been living in the drier regions of the word. Archaeologists have found evidence of Neolithic culture living in the Sahara regions, and historians have documented and other early civilization. In this section, I will concentrate on the 20th century (because this is the most relevant period of our purpose), by identifying some of the events which could be thought of as benchmarks in the development and evolution of the concept of desertification. This list may not be complete; it is just an attempt to identify key events that may have shaped our current perception of this concept.the first decade of this century witnessed severe drought on both northern and southern Africa, as evidenced by some documents as barber(1910), or the interim report of the south African drought investigation commission(1977). Other catastrophic events that have attracted much attention w 1978, stabbing, 1935).ere the dust bowl in the united states, in early thirties and perceived expansion of the Sahara. (e.g. lockeretz)
113

During the 1960s, the rainfall, levels, and the timing and duration of the rainy season in the Sahel started to shift and resulted in very severe drought condition that became clearly identifiable in 1968. This drought was the focus of attention for a number of years in the early and mid 70’s. Somehow, the connection with desertification was made because of the environmental degradation, but also because a wider concept than drought was required to describe the multiple aspects of the problem. In parallel to this, a rising interest in environmental conservation and quality of life become evident in developed world. This movement eventually leads to the holding of Stockholm conference on the environment in 1972 and the creation of the united Nation environmental programs (UNEP). That some year was a very unusual climatic year for many regions of the earth; EL-Nino event, couple with over fishing, almost destroyed the Peruvian fisheries industry; drought, floods and other ‘natural disasters’ occurred in many parts of the world. The first oil crisis compounded the problem and may also have provided the first acute example of the limitation associated with non-renewable resources.
3) GETTINGCONFUSED –with that background, let us investigate why desertification is a controversial issue, what are debated questions and why this is important. For a starter, one must realize that desertification is by far not the only word used in the literature to describe environmental degradation in arid regions. In fact, a number of words have been proposed and use for this purpose. Again, limiting myself to the 20 th century, the first word I found in the published literature was ‘dessication’, used by Hubert (1917, 1920), Schwartz (1919), and Chudeau (1921). These authors referred specifically to what they climate, particularly in the margins of the Sahara. In 1947, Aubreville introduced the term ‘bovalization’, followed in 1949, by desertification. Some ten years later, Le Houerou (1959), recognizing that the word desertification was being used to describe ecological degradation in any kind of environment including tropical forests, invented the word ‘desertization’ to refer specifically to semi-deserted areas bordering actual deserts.Finally, some authors and organization have even gone as far as creating words to describe the reversal of the desertification process: UNEP organized, in 1975, a conference on ‘ de- desertization’ in Iran, and Wilson(1976) used the term ‘ossification’. On the other hand, other authors have been concerned by the disappearance of pristine desert environments, as Nowinson (1972) explains, due to degradation from tourism and in particular four wheel drive vehicles driving off-road, so while many are concerned about the advance of the desert, others believe deserts are being transformed in wasteland. It is interesting to note that those worded p not quite occur at random: there is some kind of progression. In the early part of the century, the concern was mainly with expanding deserts, especially at the southern border of the Sahara. Later on, emphasis was progressively on the degradation of the otherwise non-deserted region from within, rather than on an invasion from outside. Clearly, there would be no particular problem with these words and expression if they were synonymous. The fact is, however, that each author insists that his word is different from lit not better all other and should not be confused with them. Moreover, different authors often assign different meanings to the same word. For evidence on this latter point, consider the following question.
Desertification is the impoverishment of acid, semi-arid and some subhumid ecosystem by the impact of man’s activities. Desertification is the result of land abuse.
Natural desert are widespread over the surface of the earth. Their extent fluctuated in the quaternary period but exhibited a general inclination to increase. This is the process of natural desertification of former meadows, prairies, steppes, and alluvial plains.
‘Desertification’ is the diminution or destruction of the biological potential of the land and can lead ultimately to desert like conditions. It is an aspect of the widespred of ecosystem and has diminished or destroyed the biological potential of the land, i.e. plant and animal production, for multiple use purpose at a time when increased productivity is needed to support growing population in quest of development.
This latter definition is in fact the one given in the UN plan of action to combat desertification. Interestingly enough, the definition included in the draft plan of action, prepared before the conference, read as follows:
Let us move now from the definition of word to their intended meaning. For the clarity of the discussion, I will identify five specific areas of disagreement; reversibility, location.
114

Whether the process of desertification is reversible or not seem to be a matter of debate. For example, Talla and Sengele say ‘we consider desertification as being the ultimate and irreversible degradation status of a fragile environment long subject to an aggressive climate and a heavy human pressure; this may be contrasted with the view of UN plan of action, which states that ‘the immediate goal of the plan of action to combat desertification is to prevent and to arrest the advance of desertification and where possible, to reclaim desertification and for productive use.
How fast is desertification progressing? This is a very interesting question to study from a historical perspective. Stebbing quoted one of the earlier figures of ‘desert encroachment’. Finally, Simon in a review article questioned the validity of the evidence and suggested that since cultivated area globally increased by one percent per year between 1950 and 1960, there might be no problem after all.
Authors do not seem to agree better on the causes of desertification. It will suffice here to two extreme positions on the subject. EL-Baz views desertification as the result of a progressive drying of the climate of Africa, a trend that began 5000 years ago. On the other hand dregne ‘considers desertification to be a man-induced global phenomenon that has no respect for climatic zones.
Understandably, if one cannot agree on what the causes of the problem are, one can’t either on what should be done about it. For example, EL-Baz in an interview with Holden, find it extremely important not to throw any money into trying to reverse an inevitable natural process, and this is of course consistent with his view of desertification. The united nations predictably have an opposite view, claiming that desertification can be hated and ravaged land reclaimed in terms of what is known now: all that is needed is political will and determination to do it.
4) HINTS FOR AN IMPOSSIBLE TASK-
where do we go from here? Is the situation hopeless? It seems indeed impossible to give a definition of desertification that will be acceptable to everybody, or that can be used in all circumstance. Different scientist has different background and needs, different people perceive the problem differently, and different social groups are differently affected by it. Some authors dislike the word desertification may be because it comes from French. Incidentally, the earliest reference to the word desertification that I have been able to track down in an English text is Hasting and Turner. The next two are kassas and grave although there may well be others, and the first use of the word within the united nations system may well have been in a FAO report written in French. Here are the ingredients that I find most important to include or discuss explicitly when defining desertification:
WHO WILL BE USING THE DESERTIFICATION?
It is important to realize that the user of the land, an administrator, a scientist, and a politician, to name but a few all have different needs: the farmer and the pastoralist both have to live in these harsh environment: they have to cut trees because this is the only source of fuel and building materials they can afford. They certainly see desertification quite differently from the economist or the scientist.
FOR WHAT PURPOSE DO WE NEED A DEFINITION?
It is for academic research, economic development, aid programs, and economic preservation. If somebody is concerned about ecological preservation, he or she will most probably mean something different, then other who may be interested in developing the area, and increasing its productivity. There usually is some connection between the user of a definition and his purpose, but it would help to make both explicit.
WHERE IS DESERTIFICATION TAKING PLACE ?
In the framework of a particular paper or project, it is usually possible to identify clearly whether the intended scope is global, continental, regional or local. Furthermore, it would also be very important to specify whether
115

desertification is considered to be spatially homogeneous over the region to interest or rather, localization to limited spots.
When is desertification occuring?
As was shown earlier, some authors view desertification as a slow, progressive destruction of the environment. However, other has been concerned only with the accelerated degradation that occurs in limited periods of stress, such as dry season. Furthermore, is desertification considered to be a continuous process, like the daily destruction of vegetation due to wood cutting, or is it rather a catastrophic event such as a land slide or severe erosion problem, which occurs infrequently?
What is the nature of the issue?
The exact nature of desertification is often unclear from the literature. Some view it as the cause of social-economic disruptions, others as the process leading to ecological changes, and still others as the consequence of land abuse.
What are the appropriate indicators of desertification?
Before one can attempt to cure desertification, it is necessary to know where the problem is more acute, what are the potential losses and the possible benefits to be gained from intended corrective actions. A number of indicators have been proposed in the past: albedo, vegetation cover, soil depth etc. this is why often very animated. In any case specifying exactly what will be measured to identify the problem is very good way to give explicit content to a definition of desertification.
Is desertification reversible or not?
Reversibility may mean different things to different people. Are we talking about an ecosystem that can be physically brought back to same previous state or about a situated that can be brought back to stage of economical viability? Are we talking about reversibility of states may be the damage cannot be repaired but more destruction can be avoided. And if one talks about reverting to a previous state, then which one, corresponding to how long age? Finally, how do we see reversibility taking place? Are we waiting for ‘mother nature’ to do the job over the next decades and centuries or do we want to reverse the process ourselves? Clearly desertification may be reversible in some countries and not in others, for certain processes and not for others, simply due to the availability to attack the problem.I would like to tackle two more points before concluding. One is concerned with pitfalls to avoid when attempting to define desertification I have identified at least four unsatisfactory practices, the first one is to define desertification in terms of deserts, this is not an a acceptable define because deserts themselves are not clearly defined.The second thing to avoid is to define arid, semi-arid, desert or semi-desert regions to desertification in terms of mean annual rainfall levels. Climatic variability is automatically an important cause of desertification.Another logical deficiency is to define desertification solely in terms of ecological changes: urbanization is an extreme case of ecological degradation. Similarly, it is unwarranted to define desertification only in economical terms, because the productivity of a region depends on many factors, such as climate, soils, agricultural practices. They may also be inapplicable to subsistence economies. finally, it is important to realize that a definition of desertification may have implications beyond the intended wording: the meaning given to the concept may have financial implications, since a funding agency, for example, if the climate is not the main culprit, someone or a social group may be held responsible for the degradation. This is an eminently political issue that can’t be avoided.
CONCLUSION-
If most authors agree or disagree on what desertification actually is, there seems to be a consensus on the fact that it is undesirable. Beyond that, the literature gets confusing. Hence, the need for clearly specifying what we use the
116
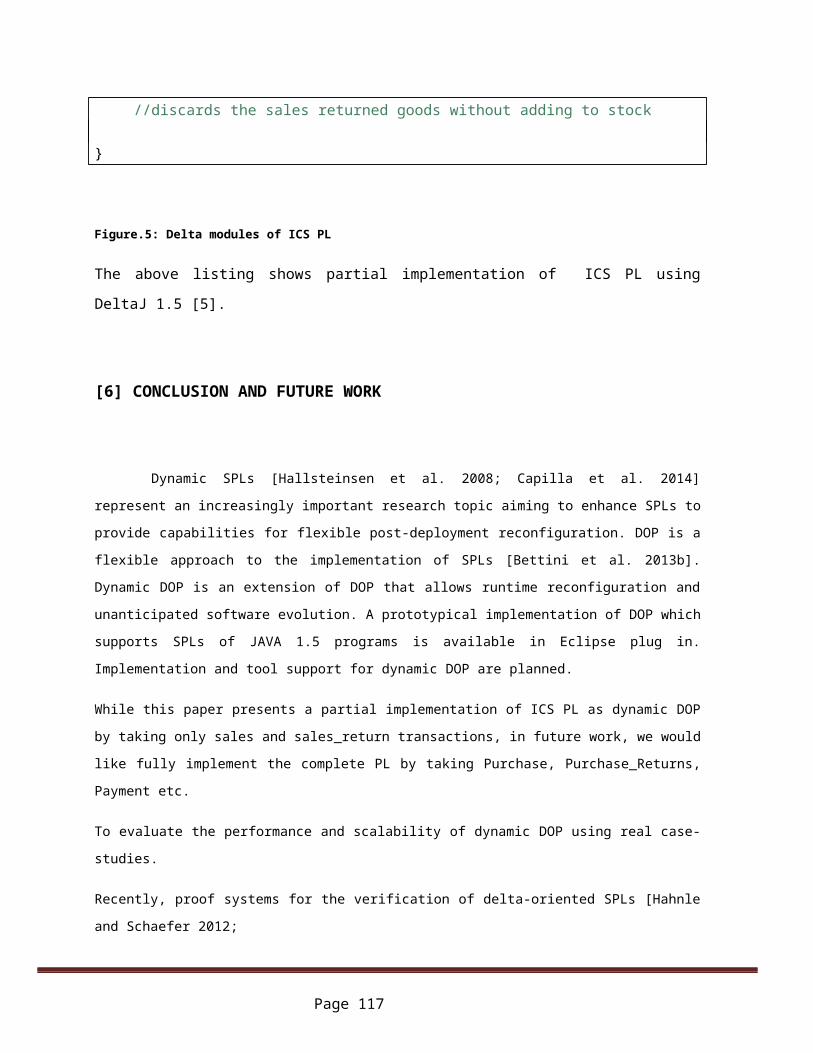
word. in this paper, I have tried to show that there are many possible reasons for the confusion, including the evolution of the concept in time, the various background of the authors, etc. there seems to be no hope, nor perhaps any need to try to select a define to fit the needs and requirements of all parties interested. but there is no necessity for confusion either, I have suggested that each user or group o user of the concept of desertification should take great care in specifying exactly what is meant, and a checklist of key items that should be investigated explicitly in any definition was given. I hope that this paper may be clarify and useful in this respect. Additional information on this and related issues can be found in qlantz and orlovski (1983) and verstraete (1983).
REFERENCES
Andrew, G.: 1944, ‘Memorandum on Desert Creep’, Soil
Conservation Committee, Sudan Government, Report, Khartoum.Google Scholar
Anonymous: 1980, ‘The Creeping Desert’, The Economist, May 17, 1980, 37.Google Scholar
Aubréville, A.: 1947, ‘Erosion et BovalisationenAfrique Noire Française’, AgronomieTropicale.Google Scholar
Aubréville, A.: 1949, Climats, Forêts et Désertification de l'AfriqueTropicale, Société d'EditionGéographiques, Maritimes et Coloniales, Paris, 351 pp.Google Scholar
Barber, F. H.: 1910, ‘Is South Africa Drying Up?’, Agricultural Journal Cape Good Hope, 86, 167–170.Google Scholar
Bovill, E. W.: 1921, ‘The Encroachment of the Sahara on the Sudan’, Journal of the African Society, London.Google Scholar
Brynmor J.: 1938, ‘Dessication and the West African Colonies’, Geographical Journal.Google Scholar
Chudeau, R.: 1921, ‘Le Problème du DessèchementenAfriqueOccidentale’, Bulletin de la Commission de l'AfriqueOccidentaleFrançaise.Google Scholar
Dregne, H.: 1984, ‘Desertification—Present and Future’, International Journal for Development Technology, 2, 255–259.Google Scholar
Eckholm, E. and L. R. Brown: 1978, ‘Spreading Deserts— The Hand of Man’, Bulletin of the Atomic Scientists, 34, No. 1, 10–16, 44–51.Google Scholar
El-Baz, F.: 1983, ‘A Geological Perspective of the Desert’, in Origin and Evolution of Deserts, Edited by Wells and Haragan, The University of New Mexico Press, 163–183.Google Scholar
Flohn, H.: 1971, Investigations on the Climatic Conditions of the Advancement of the Tunisian Sahara, WMO Technical Note 116, World Meteorological Organization.Google Scholar
Forbes, R. H.: 1958, ‘The Expanding Sahara’, Physical Science Bulletin, No. 3, 28 pp., University of Arizona.Google Scholar
Garduño, M. A.: 1977, ‘Technology and Desertification’, in UNCOD (1977), 319–448.Google Scholar
Glantz,M. H.: 1977, Desertification, Environmental Degradation in and around Arid Lands, Westview Press, 346 pp.Google Scholar
117

Glantz, M. H. and N. Orlovski: 1983, ‘Desertification: A Review of the concept’, Desertification Bulletin, No. 9, 15–22.Google Scholar
Grove, A. T.: 1971, ‘Desertification in the African Environment’, Background paper presented at the UN Seminar on the Human Environment, Addis Ababa, August 1971, unpublished.Google Scholar
Hastings, J. R. and R.M. Turner: 1965, The Changing Mile, The University of Arizona Press, 317 pp.Google Scholar
Holden, C.: 1979, ‘Egyptian Geologist Champions Desert Research’, Science, 205, 1357–1360.Google Scholar
Hubert, H.: 1917, ‘Progression du Dessèchementdans les RégionsSénégalaises’, Annales de Géographie.Google Scholar
Hubert, H.: 1920, ‘Le DessèchementProgressif de l'AfriqueOccidentaleFrançaise’, Bulletin de la Commission d'EtudesHistoriques et Scientifiques de l'AfriqueOccidentaleFrançaise.Google Scholar
Kates, R. W., D. L. Johnson and K. Maizels: 1977, ‘Population, Society and Desertification’, in UNCOD (1977), 261–317.Google Scholar
Kassas, M.: 1970, ‘Desertification versus Potential for Recovery in Circum-Saharan Territories’, in Arid Lands in Transition, Edited by Dregne, AAAS, 123–142.Google Scholar
Klintworth, H.: 1948, ‘Desert Encroachment Over the Karoo’, Farming in South Africa., 23, 723–728.Google Scholar
Kovda, V. A.: 1980, Land Aridization and Drought Control, Westview Press, 277 pp.Google Scholar
118

CLOUD COMPUTING FOR LIBRARY SERVICESLata Kumari
[email protected] College Bistupur, Jamshedpur – 831001
ABSTRACT:This paper is based on usefulness of Cloud computing at present. Today’s every human beings wants to get updated with latest information for they wants to develop their skills and be connected with everyone. It’s quite simple that knowledge is very important for all not only in urban area but also a rural area. Through this paper we tried to encourage those students who always worked hard to give their best but notable to do due to lack of good source of knowledge and information where cloud computing is helpful for them. It is an era of internet no wants to stand on back side. Cloud computing is a way of sharing our resources in an digital manner i.e. it is the process of storing frequently used data on multiple servers which could be easily accessed by the help of internet without requirement of large numbers of manpower and space. Proper utilization of libraries resources and available to all at time is a big issue and at present users prefer internet .so cloud computing is proper solution and useful by those users who have no time to go libraries for their desired data.
KEYWORDS Cloud computing, IAAS, PAAS, SAAS, Public cloud, Private cloud, Hybrid cloud, Community cloud, Information cloud. Software, Global Scale
INTRODUCTIONCloud computing is simple and can be handled by anyone who have common knowledge just as mobile phone can be used .Cloud computing is basically required one servers which connected with internet and can be accessed anywhere through world same website is open. In Cloud computing the key point is portable storage which we do not have to carry. In this data stored in one place and can access in one way. Today’s libraries are being converted into digital environment i.e. libraries are fully automated for this we need to set up large servers, storage devices and lots of other equipment to support the business.
On the other side rural area facing such problem because libraries are still in bad condition .Keeping in view’’ Digital India ‘’we need to corporate and comes forward to give their best to develop skills those area through cloud computing.
Cloud computing normally people think that cloud carry lots of water but not dropped down until it contact with air just as in a cloud computing environment, individuals and businesses work with applications and data stored and/or maintained on shared machines in a web-based environment rather than physically located in the home of a user or a corporate environment. Lew Tucker, Vice President and Chief Technology Officer of Cloud Computing at Sun Microsystems, explained that cloud computing is ‘the movement of application services onto the Internet and the increased use of the Internet to access a wide variety of services traditionally originating from within a company’s data center’ (Creeger 2009: 52). For example, web-based applications such as Google’s Gmail can be accessed in real time from an Internet-connected machine anywhere in the world.
119

Fig.1. A Computer Service Scenario in Cloud Computing
CLOUD COMPUTING: AN OVERVIEW Cloud computing is a computing paradigm, where a large pool of systems are connected in private or public networks, to provide dynamically scalable infrastructure for application, data and file storage. With the advent of this technology, the cost of computation, application hosting, content storage and delivery is reduced significantly.
Cloud computing is a practical approach to experience direct cost benefits and it has the potential to transform a data center from a capital-intensive set up to a variable priced environment.
The idea of cloud computing is based on a very fundamental principal of „reusability of IT capabilities'. The difference that cloud computing brings compared to traditional concepts of “grid computing”, “distributed computing”, “utility computing”, or “autonomic computing” is to broaden horizons across organizational boundaries.
Forrester defines cloud computing as: “A pool of abstracted, highly scalable, and managed compute infrastructure capable of hosting end-customer applications and billed by consumption.”
120

Fig.2. Conceptual view of cloud computing
BASIC PRINCIPLES OF CLOUD COMPUTING1. ON-DEMAND allows users to call up resource from the cloud and use them as needed. When the user
is finished with the resources they release them in a self-service fashion. 2. ELASTIC UNLIMITED CAPACITY or flexibility that includes scalability, allows the cloud to
be dynamic to the users demands allowing the cloud to satisfy peak demands release resources when demand subsides. Networked access allows the cloud to be accessible widely, primarily though the internet.
3. PAY AS YOU GO is usage-based metering allows users of the cloud to pay for the services when needed and used and to release them when they are no longer need, resulting in many benefits including cost and storage efficiency.
PARTS OF CLOUD COMPUTINGCloud computing architecture refers to the components and subcomponents required for cloud computing. These components typically consist of a front end platform (fat client, thin client, mobile device), back end platforms (servers, storage), a cloud based delivery, and a network (Internet, Intranet, Intercloud).
1. Front end platform means simple, fluid, secure sometime users cannot understand how to use but can prefer to those data which can easily uploaded or downloaded I.e. users’ friendly (user interface).
2. Back end platform means major portion and major function i.e. programme work which are not explained by the organizer.
So it is clear that more difficult the back end platform more easily will front end platform easy to use.
BASIC ELEMENTS OF CLOUD COMPUTINGCloud computing is made up of a variety of layered elements, starting at the most basic physical layer of storage and server infrastructure and working up through the application and network layers. The cloud can be further divided into different implementation models based on whether it's created internally, outsourced or a combination of the two.
THREE CLOUD LAYERS 1. Infrastructure cloud: Abstracts applications from servers and servers from storage
121

2. Content cloud: Abstracts data from applications3. Information cloud: Abstracts access from clients to data
HOW CLOUD COMPUTING WORKS?Cloud computing services all work a little differently, depending on the provider. But many provide a friendly, browser-based dashboard that makes it easier for IT professionals and developers to order resources and manage their accounts. Some cloud computing services are also designed to work with REST APIs and a command-line interface (CLI), giving developers multiple options.
USES OF CLOUD COMPUTINGYou are probably using cloud computing right now, even if you don’t realise it. If you use an online service to send email, edit documents, watch movies or TV, listen to music, play games or store pictures and other files, it is likely that cloud computing is making it all possible behind the scenes. The first cloud computing services are barely a decade old, but already a variety of organisations—from tiny start-up’s to global corporations, government agencies to non-profits—are embracing the technology for all sorts of reasons. Here are a few of the things you can do with the cloud: Create new apps and services Store, back up and recover data Host websites and blogs Stream audio and video Deliver software on demand Analyse data for patterns and make predictions
CLOUD COMPUTING FOR LIBRARY SERVICESSome of the usefulness and advantages of cloud computing for the library services are given below.
Cost reduction- Ability to increase or decrease the consumption of hardware or software resources immediately and in some cases automatically.
Scalability- “Pay as you go” allowing a more efficient control of expenditures. Lower investment, reduced risk- Immediate access to the improvements in the resource proposed (hardware
and software) and debugging. Support included- Enjoyment of the most advanced security procedures, availability and performance of
providers with experience and knowledge in this type of service. Greater security and accessibility- Access to resources from any geographical point and the ability to test
and evaluate resources at no cost. Portability- since the service is available over the web, the service can be availed through browser from any
part of the world. Adjustable storage- In the traditional system, if the server is less than what we have. The server should be
replaced with the new one. In this computing, the storage capacity can be adjusted according to the needs of the library, since the storage is controlled by the service provider.
Cloud OPAC- Most of the libraries in the world are having the catalogue over the web. These catalogues are available with their libraries local server made it available over the web. If the catalogue of the libraries made it available through cloud, it will be more benefit to the users to find out the availability of materials.
Another benefit of cloud computing is that it addresses resource management in profoundly better ways. Through a cloud computing environment users can save and eliminate cost in services, personnel, and IT infrastructure. Reducing cost is one of the major attractions to cloud computing.
ConclusionCloud computing has brought us a new perspective to look at libraries resource-sharing problem. Cloud computing can be applied to digital library resources to improve information sharing capabilities, improve resource utilization. Therefore it is time for libraries think seriously before clubbing libraries services with cloud based technologies and
122

provide reliable and rapid services to their users. Another role of LIS professionals in this virtual era is to make cloud based scrokes as a reliable medium to disseminate library services to their target users with ease of use and trustworthiness.
123