Embed Size (px)
Citation preview
Telstra Corporation Limited and controlled entities
Telstra Corporation Limited and controlled entitiesAustralian Business Number (ABN): 33 051 775 556
Half-Year Financial Reportfor the half-year ended 31 December 2006
Pagenumber
Half-Year Financial Statements
Income Statement . . . . . . . . . . . . . . . . . . . . . . . . . . . . . . . . . . . . . . . . . . . . . . . . . . . . . . . . . . . . . . . . . . . . . . . . . 2Balance Sheet . . . . . . . . . . . . . . . . . . . . . . . . . . . . . . . . . . . . . . . . . . . . . . . . . . . . . . . . . . . . . . . . . . . . . . . . . . . . 3Statement of Recognised Income and Expense . . . . . . . . . . . . . . . . . . . . . . . . . . . . . . . . . . . . . . . . . . . . . . . . . . . . . . . 4Statement of Cash Flows . . . . . . . . . . . . . . . . . . . . . . . . . . . . . . . . . . . . . . . . . . . . . . . . . . . . . . . . . . . . . . . . . . . . . 5
Notes to the Half-Year Financial Statements
Note 1 - Basis of preparation . . . . . . . . . . . . . . . . . . . . . . . . . . . . . . . . . . . . . . . . . . . . . . . . . . . . . . . . . . 6Note 2 - Summary of accounting policies . . . . . . . . . . . . . . . . . . . . . . . . . . . . . . . . . . . . . . . . . . . . . . . . . . . 7Note 3 - Items requiring specific disclosure . . . . . . . . . . . . . . . . . . . . . . . . . . . . . . . . . . . . . . . . . . . . . . . . . . 11Note 4 - Dividends . . . . . . . . . . . . . . . . . . . . . . . . . . . . . . . . . . . . . . . . . . . . . . . . . . . . . . . . . . . . . . . . 12Note 5 - Segment information . . . . . . . . . . . . . . . . . . . . . . . . . . . . . . . . . . . . . . . . . . . . . . . . . . . . . . . . . . . . . . 13Note 6 - Notes to the statement of cash flows . . . . . . . . . . . . . . . . . . . . . . . . . . . . . . . . . . . . . . . . . . . . . . . . . . . . 15Note 7 - Contingent liabilities, contingent assets and expenditure commitments . . . . . . . . . . . . . . . . . . . . . . . . . . . . 17Note 8 - Events after balance date . . . . . . . . . . . . . . . . . . . . . . . . . . . . . . . . . . . . . . . . . . . . . . . . . . . . . . . 19
Directors’ Declaration . . . . . . . . . . . . . . . . . . . . . . . . . . . . . . . . . . . . . . . . . . . . . . . . . . . . . . . . . . . . . . . . . . . . . . . 20
Independent Review Report . . . . . . . . . . . . . . . . . . . . . . . . . . . . . . . . . . . . . . . . . . . . . . . . . . . . . . . . . . . . . . 21
Telstra Corporation Limited and controlled entities
2
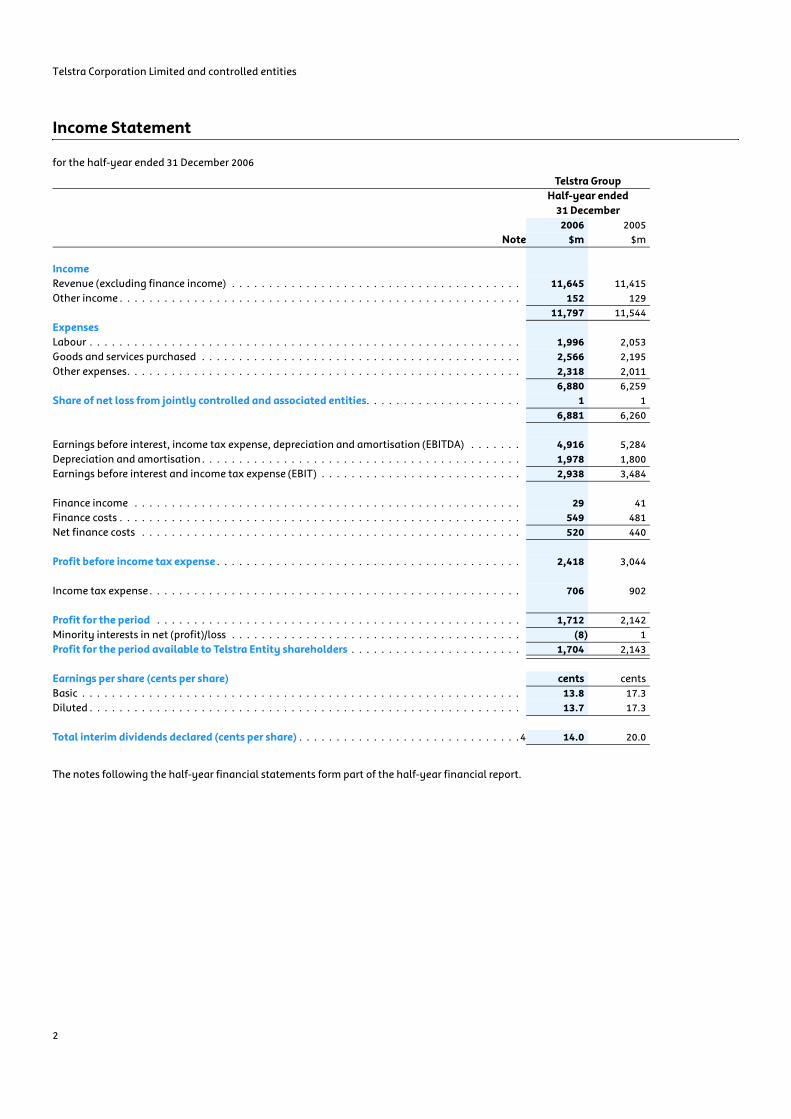
Income Statement
for the half-year ended 31 December 2006
The notes following the half-year financial statements form part of the half-year financial report.
Telstra GroupHalf-year ended
31 December2006 2005
Note $m $m
IncomeRevenue (excluding finance income) . . . . . . . . . . . . . . . . . . . . . . . . . . . . . . . . . . . . . . . 11,645 11,415Other income . . . . . . . . . . . . . . . . . . . . . . . . . . . . . . . . . . . . . . . . . . . . . . . . . . . . . . 152 129
11,797 11,544ExpensesLabour . . . . . . . . . . . . . . . . . . . . . . . . . . . . . . . . . . . . . . . . . . . . . . . . . . . . . . . . . . 1,996 2,053Goods and services purchased . . . . . . . . . . . . . . . . . . . . . . . . . . . . . . . . . . . . . . . . . . . 2,566 2,195Other expenses. . . . . . . . . . . . . . . . . . . . . . . . . . . . . . . . . . . . . . . . . . . . . . . . . . . . . 2,318 2,011
6,880 6,259Share of net loss from jointly controlled and associated entities. . . . . . . . . . . . . . . . . . . . . 1 1
6,881 6,260
Earnings before interest, income tax expense, depreciation and amortisation (EBITDA) . . . . . . . 4,916 5,284Depreciation and amortisation . . . . . . . . . . . . . . . . . . . . . . . . . . . . . . . . . . . . . . . . . . . 1,978 1,800Earnings before interest and income tax expense (EBIT) . . . . . . . . . . . . . . . . . . . . . . . . . . . 2,938 3,484
Finance income . . . . . . . . . . . . . . . . . . . . . . . . . . . . . . . . . . . . . . . . . . . . . . . . . . . . 29 41Finance costs . . . . . . . . . . . . . . . . . . . . . . . . . . . . . . . . . . . . . . . . . . . . . . . . . . . . . . 549 481Net finance costs . . . . . . . . . . . . . . . . . . . . . . . . . . . . . . . . . . . . . . . . . . . . . . . . . . . 520 440
Profit before income tax expense . . . . . . . . . . . . . . . . . . . . . . . . . . . . . . . . . . . . . . . . . 2,418 3,044
Income tax expense . . . . . . . . . . . . . . . . . . . . . . . . . . . . . . . . . . . . . . . . . . . . . . . . . . 706 902
Profit for the period . . . . . . . . . . . . . . . . . . . . . . . . . . . . . . . . . . . . . . . . . . . . . . . . . 1,712 2,142Minority interests in net (profit)/loss . . . . . . . . . . . . . . . . . . . . . . . . . . . . . . . . . . . . . . . (8) 1Profit for the period available to Telstra Entity shareholders . . . . . . . . . . . . . . . . . . . . . . . 1,704 2,143
Earnings per share (cents per share) cents centsBasic . . . . . . . . . . . . . . . . . . . . . . . . . . . . . . . . . . . . . . . . . . . . . . . . . . . . . . . . . . . 13.8 17.3Diluted . . . . . . . . . . . . . . . . . . . . . . . . . . . . . . . . . . . . . . . . . . . . . . . . . . . . . . . . . . 13.7 17.3
Total interim dividends declared (cents per share) . . . . . . . . . . . . . . . . . . . . . . . . . . . . . . 4 14.0 20.0
Telstra Corporation Limited and controlled entities
3
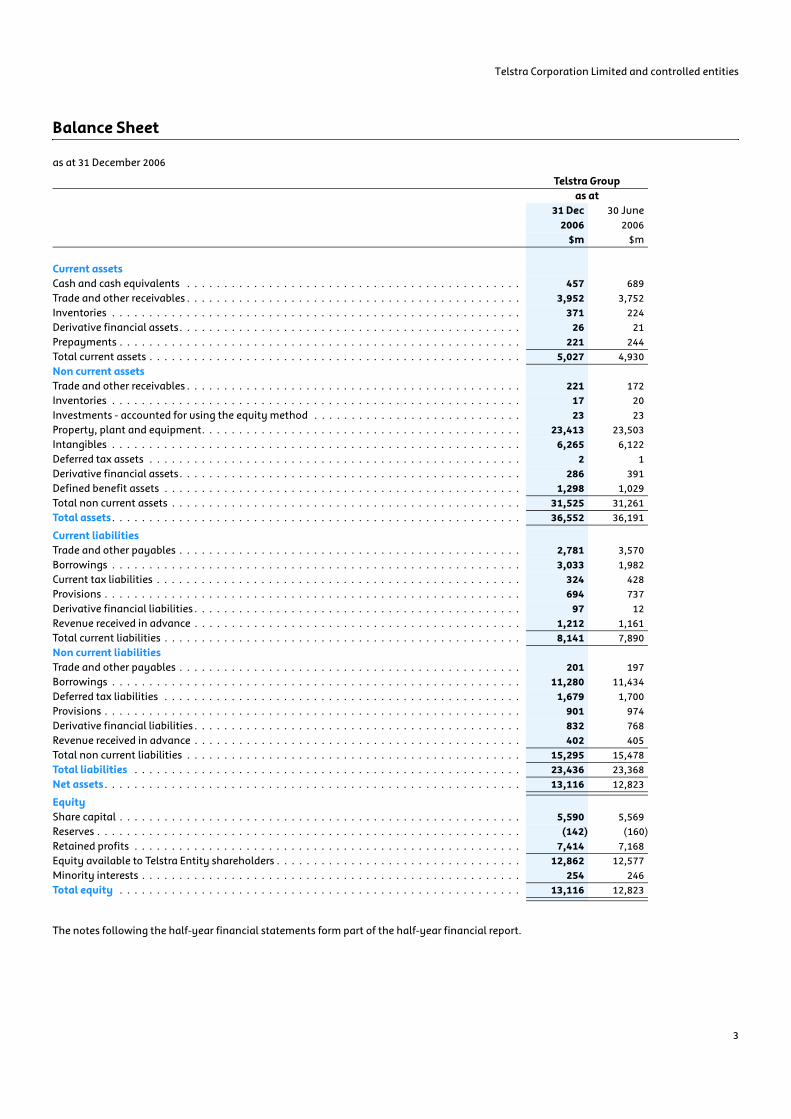
Balance Sheet
as at 31 December 2006
The notes following the half-year financial statements form part of the half-year financial report.
Telstra Groupas at
31 Dec 30 June2006 2006
$m $m
Current assetsCash and cash equivalents . . . . . . . . . . . . . . . . . . . . . . . . . . . . . . . . . . . . . . . . . . . . . 457 689Trade and other receivables . . . . . . . . . . . . . . . . . . . . . . . . . . . . . . . . . . . . . . . . . . . . . Inventories . . . . . . . . . . . . . . . . . . . . . . . . . . . . . . . . . . . . . . . . . . . . . . . . . . . . . . .
3,952 3,752371 224
Derivative financial assets. . . . . . . . . . . . . . . . . . . . . . . . . . . . . . . . . . . . . . . . . . . . . . 26 21Prepayments . . . . . . . . . . . . . . . . . . . . . . . . . . . . . . . . . . . . . . . . . . . . . . . . . . . . . . Total current assets . . . . . . . . . . . . . . . . . . . . . . . . . . . . . . . . . . . . . . . . . . . . . . . . . .
221 2445,027 4,930
Non current assetsTrade and other receivables . . . . . . . . . . . . . . . . . . . . . . . . . . . . . . . . . . . . . . . . . . . . . 221 172Inventories . . . . . . . . . . . . . . . . . . . . . . . . . . . . . . . . . . . . . . . . . . . . . . . . . . . . . . . 17 20Investments - accounted for using the equity method . . . . . . . . . . . . . . . . . . . . . . . . . . . . 23 23Property, plant and equipment. . . . . . . . . . . . . . . . . . . . . . . . . . . . . . . . . . . . . . . . . . . 23,413 23,503Intangibles . . . . . . . . . . . . . . . . . . . . . . . . . . . . . . . . . . . . . . . . . . . . . . . . . . . . . . . 6,265 6,122Deferred tax assets . . . . . . . . . . . . . . . . . . . . . . . . . . . . . . . . . . . . . . . . . . . . . . . . . . 2 1Derivative financial assets. . . . . . . . . . . . . . . . . . . . . . . . . . . . . . . . . . . . . . . . . . . . . . 286 391Defined benefit assets . . . . . . . . . . . . . . . . . . . . . . . . . . . . . . . . . . . . . . . . . . . . . . . . 1,298 1,029Total non current assets . . . . . . . . . . . . . . . . . . . . . . . . . . . . . . . . . . . . . . . . . . . . . . . 31,525 31,261Total assets . . . . . . . . . . . . . . . . . . . . . . . . . . . . . . . . . . . . . . . . . . . . . . . . . . . . . . . 36,552 36,191
Current liabilitiesTrade and other payables . . . . . . . . . . . . . . . . . . . . . . . . . . . . . . . . . . . . . . . . . . . . . . 2,781 3,570Borrowings . . . . . . . . . . . . . . . . . . . . . . . . . . . . . . . . . . . . . . . . . . . . . . . . . . . . . . . 3,033 1,982Current tax liabilities . . . . . . . . . . . . . . . . . . . . . . . . . . . . . . . . . . . . . . . . . . . . . . . . . 324 428Provisions . . . . . . . . . . . . . . . . . . . . . . . . . . . . . . . . . . . . . . . . . . . . . . . . . . . . . . . . 694 737Derivative financial liabilities . . . . . . . . . . . . . . . . . . . . . . . . . . . . . . . . . . . . . . . . . . . . 97 12Revenue received in advance . . . . . . . . . . . . . . . . . . . . . . . . . . . . . . . . . . . . . . . . . . . . 1,212 1,161Total current liabilities . . . . . . . . . . . . . . . . . . . . . . . . . . . . . . . . . . . . . . . . . . . . . . . . 8,141 7,890Non current liabilitiesTrade and other payables . . . . . . . . . . . . . . . . . . . . . . . . . . . . . . . . . . . . . . . . . . . . . . 201 197Borrowings . . . . . . . . . . . . . . . . . . . . . . . . . . . . . . . . . . . . . . . . . . . . . . . . . . . . . . . 11,280 11,434Deferred tax liabilities . . . . . . . . . . . . . . . . . . . . . . . . . . . . . . . . . . . . . . . . . . . . . . . . 1,679 1,700Provisions . . . . . . . . . . . . . . . . . . . . . . . . . . . . . . . . . . . . . . . . . . . . . . . . . . . . . . . . 901 974Derivative financial liabilities . . . . . . . . . . . . . . . . . . . . . . . . . . . . . . . . . . . . . . . . . . . . 832 768Revenue received in advance . . . . . . . . . . . . . . . . . . . . . . . . . . . . . . . . . . . . . . . . . . . . 402 405Total non current liabilities . . . . . . . . . . . . . . . . . . . . . . . . . . . . . . . . . . . . . . . . . . . . . 15,295 15,478Total liabilities . . . . . . . . . . . . . . . . . . . . . . . . . . . . . . . . . . . . . . . . . . . . . . . . . . . . 23,436 23,368Net assets . . . . . . . . . . . . . . . . . . . . . . . . . . . . . . . . . . . . . . . . . . . . . . . . . . . . . . . . 13,116 12,823
EquityShare capital . . . . . . . . . . . . . . . . . . . . . . . . . . . . . . . . . . . . . . . . . . . . . . . . . . . . . . Reserves . . . . . . . . . . . . . . . . . . . . . . . . . . . . . . . . . . . . . . . . . . . . . . . . . . . . . . . . . Retained profits . . . . . . . . . . . . . . . . . . . . . . . . . . . . . . . . . . . . . . . . . . . . . . . . . . . . Equity available to Telstra Entity shareholders . . . . . . . . . . . . . . . . . . . . . . . . . . . . . . . . .
5,590 5,569(142) (160)
7,414 7,16812,862 12,577
Minority interests . . . . . . . . . . . . . . . . . . . . . . . . . . . . . . . . . . . . . . . . . . . . . . . . . . . 254 246Total equity . . . . . . . . . . . . . . . . . . . . . . . . . . . . . . . . . . . . . . . . . . . . . . . . . . . . . . 13,116 12,823
Telstra Corporation Limited and controlled entities
4
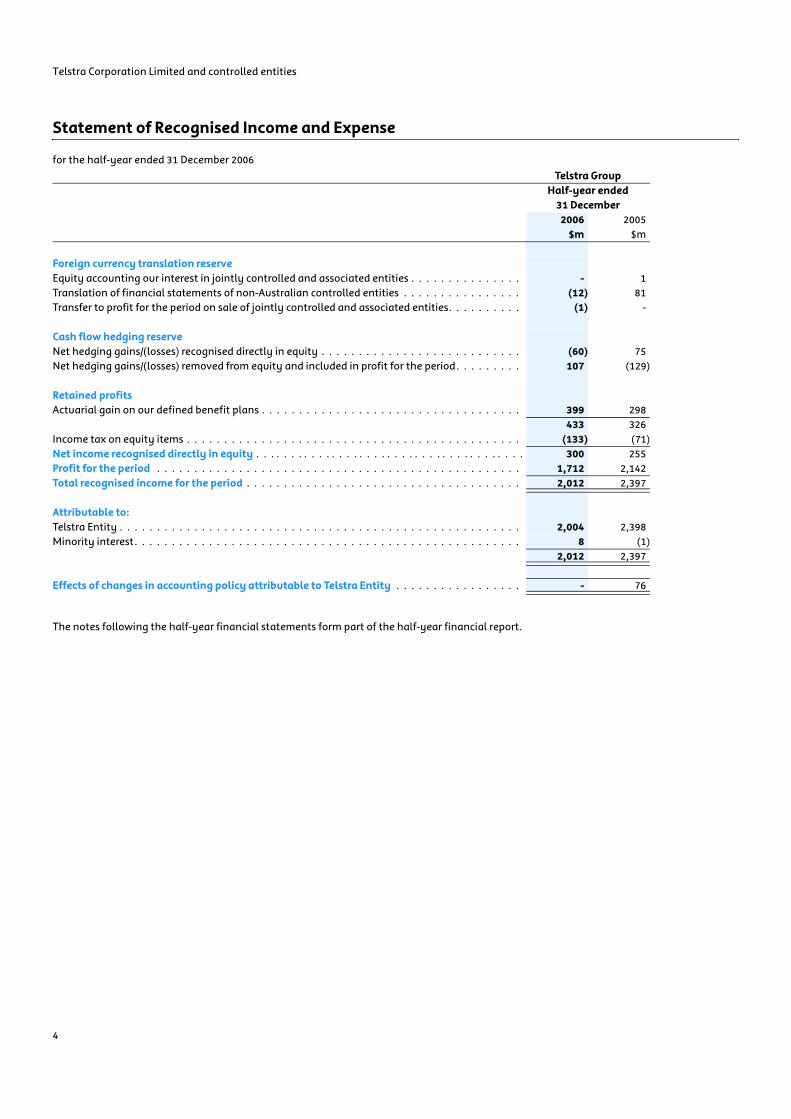
Statement of Recognised Income and Expense
for the half-year ended 31 December 2006
The notes following the half-year financial statements form part of the half-year financial report.
Telstra GroupHalf-year ended
31 December2006 2005
$m $m
Foreign currency translation reserveEquity accounting our interest in jointly controlled and associated entities . . . . . . . . . . . . . . . - 1Translation of financial statements of non-Australian controlled entities . . . . . . . . . . . . . . . . (12) 81Transfer to profit for the period on sale of jointly controlled and associated entities. . . . . . . . . . (1) -
Cash flow hedging reserveNet hedging gains/(losses) recognised directly in equity . . . . . . . . . . . . . . . . . . . . . . . . . . . (60) 75Net hedging gains/(losses) removed from equity and included in profit for the period. . . . . . . . . 107 (129)
Retained profitsActuarial gain on our defined benefit plans . . . . . . . . . . . . . . . . . . . . . . . . . . . . . . . . . . . 399 298
433 326Income tax on equity items . . . . . . . . . . . . . . . . . . . . . . . . . . . . . . . . . . . . . . . . . . . . . (133) (71)Net income recognised directly in equity . . . . . . . . . . . . . . . . . . . . . . . . . . . . . . . . . . . . . . . 300 255Profit for the period . . . . . . . . . . . . . . . . . . . . . . . . . . . . . . . . . . . . . . . . . . . . . . . . . 1,712 2,142Total recognised income for the period . . . . . . . . . . . . . . . . . . . . . . . . . . . . . . . . . . . . . 2,012 2,397
Attributable to:Telstra Entity . . . . . . . . . . . . . . . . . . . . . . . . . . . . . . . . . . . . . . . . . . . . . . . . . . . . . . 2,004 2,398Minority interest. . . . . . . . . . . . . . . . . . . . . . . . . . . . . . . . . . . . . . . . . . . . . . . . . . . . 8 (1)
2,012 2,397
Effects of changes in accounting policy attributable to Telstra Entity . . . . . . . . . . . . . . . . . - 76
Telstra Corporation Limited and controlled entities
5
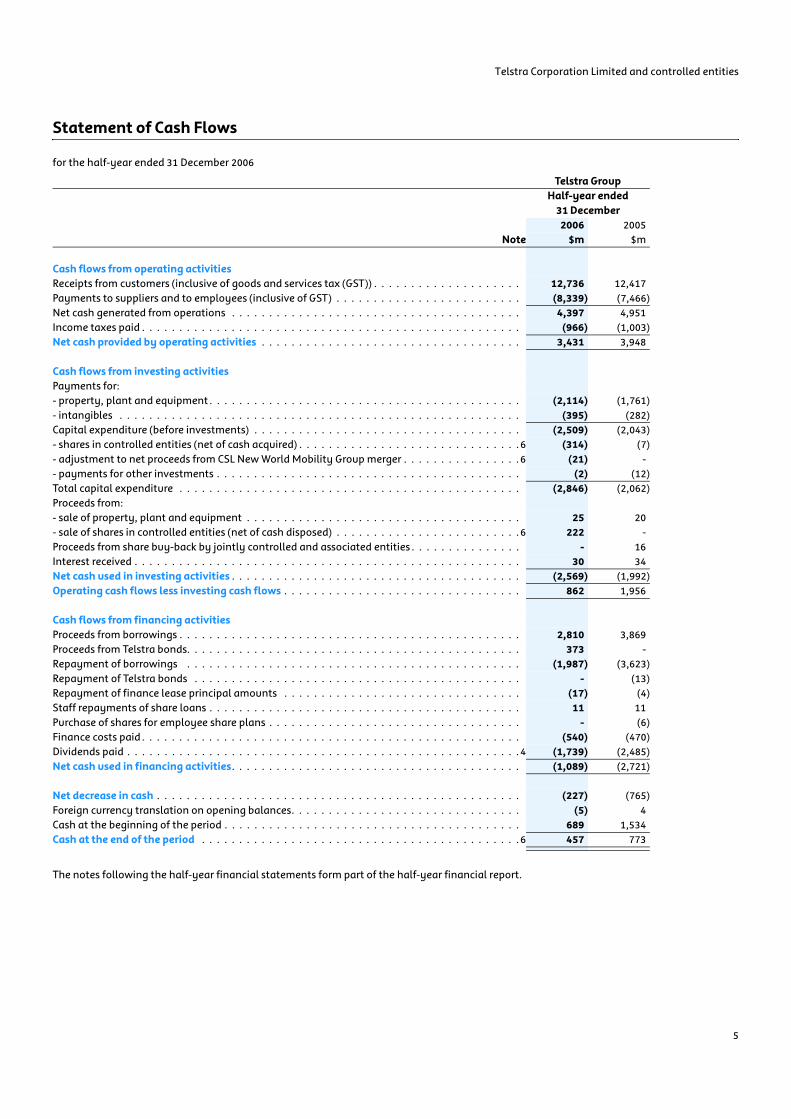
Statement of Cash Flows
for the half-year ended 31 December 2006
The notes following the half-year financial statements form part of the half-year financial report.
Telstra GroupHalf-year ended
31 December2006 2005
Note $m $m
Cash flows from operating activitiesReceipts from customers (inclusive of goods and services tax (GST)) . . . . . . . . . . . . . . . . . . . . 12,736 12,417Payments to suppliers and to employees (inclusive of GST) . . . . . . . . . . . . . . . . . . . . . . . . . (8,339) (7,466)Net cash generated from operations . . . . . . . . . . . . . . . . . . . . . . . . . . . . . . . . . . . . . . . 4,397 4,951Income taxes paid . . . . . . . . . . . . . . . . . . . . . . . . . . . . . . . . . . . . . . . . . . . . . . . . . . . (966) (1,003)Net cash provided by operating activities . . . . . . . . . . . . . . . . . . . . . . . . . . . . . . . . . . . 3,431 3,948
Cash flows from investing activitiesPayments for:- property, plant and equipment . . . . . . . . . . . . . . . . . . . . . . . . . . . . . . . . . . . . . . . . . . (2,114) (1,761)- intangibles . . . . . . . . . . . . . . . . . . . . . . . . . . . . . . . . . . . . . . . . . . . . . . . . . . . . . . (395) (282)Capital expenditure (before investments) . . . . . . . . . . . . . . . . . . . . . . . . . . . . . . . . . . . . (2,509) (2,043)- shares in controlled entities (net of cash acquired) . . . . . . . . . . . . . . . . . . . . . . . . . . . . . . 6 (314) (7)- adjustment to net proceeds from CSL New World Mobility Group merger . . . . . . . . . . . . . . . . 6 (21) -- payments for other investments . . . . . . . . . . . . . . . . . . . . . . . . . . . . . . . . . . . . . . . . . (2) (12)Total capital expenditure . . . . . . . . . . . . . . . . . . . . . . . . . . . . . . . . . . . . . . . . . . . . . . (2,846) (2,062)Proceeds from:- sale of property, plant and equipment . . . . . . . . . . . . . . . . . . . . . . . . . . . . . . . . . . . . . 25 20- sale of shares in controlled entities (net of cash disposed) . . . . . . . . . . . . . . . . . . . . . . . . . 6 222 -Proceeds from share buy-back by jointly controlled and associated entities . . . . . . . . . . . . . . . - 16Interest received . . . . . . . . . . . . . . . . . . . . . . . . . . . . . . . . . . . . . . . . . . . . . . . . . . . . 30 34Net cash used in investing activities . . . . . . . . . . . . . . . . . . . . . . . . . . . . . . . . . . . . . . . (2,569) (1,992)Operating cash flows less investing cash flows . . . . . . . . . . . . . . . . . . . . . . . . . . . . . . . . 862 1,956
Cash flows from financing activitiesProceeds from borrowings . . . . . . . . . . . . . . . . . . . . . . . . . . . . . . . . . . . . . . . . . . . . . . 2,810 3,869Proceeds from Telstra bonds. . . . . . . . . . . . . . . . . . . . . . . . . . . . . . . . . . . . . . . . . . . . . 373 -Repayment of borrowings . . . . . . . . . . . . . . . . . . . . . . . . . . . . . . . . . . . . . . . . . . . . . (1,987) (3,623)Repayment of Telstra bonds . . . . . . . . . . . . . . . . . . . . . . . . . . . . . . . . . . . . . . . . . . . . - (13)Repayment of finance lease principal amounts . . . . . . . . . . . . . . . . . . . . . . . . . . . . . . . . (17) (4)Staff repayments of share loans . . . . . . . . . . . . . . . . . . . . . . . . . . . . . . . . . . . . . . . . . . 11 11Purchase of shares for employee share plans . . . . . . . . . . . . . . . . . . . . . . . . . . . . . . . . . . - (6)Finance costs paid . . . . . . . . . . . . . . . . . . . . . . . . . . . . . . . . . . . . . . . . . . . . . . . . . . . (540) (470)Dividends paid . . . . . . . . . . . . . . . . . . . . . . . . . . . . . . . . . . . . . . . . . . . . . . . . . . . . . 4 (1,739) (2,485)Net cash used in financing activities. . . . . . . . . . . . . . . . . . . . . . . . . . . . . . . . . . . . . . . (1,089) (2,721)
Net decrease in cash . . . . . . . . . . . . . . . . . . . . . . . . . . . . . . . . . . . . . . . . . . . . . . . . . (227) (765)Foreign currency translation on opening balances. . . . . . . . . . . . . . . . . . . . . . . . . . . . . . . (5) 4Cash at the beginning of the period . . . . . . . . . . . . . . . . . . . . . . . . . . . . . . . . . . . . . . . . 689 1,534Cash at the end of the period . . . . . . . . . . . . . . . . . . . . . . . . . . . . . . . . . . . . . . . . . . . 6 457 773
Telstra Corporation Limited and controlled entities
6
Notes to the Half-Year Financial Statements
1. Basis of preparation
In this financial report, we, us, our, Telstra and the Telstra Group - all mean Telstra Corporation Limited, an Australian corporation and its controlled entities as a whole. Telstra Entity is the legal entity, Telstra Corporation Limited.
Our half-year financial report is a general purpose financial report and is to be read in conjunction with our Annual Financial Report as at 30 June 2006. This should also be read together with any public announcements made by us in accordance with the continuous disclosure obligations arising under Australian Stock Exchange listing rules and the Corporations Act 2001, up to the date of the Directors’ Declaration.
1.1 Basis of preparation of the financial report
This half-year financial report has been prepared in accordance with the requirements of the Australian Corporations Act 2001 and Accounting Standards applicable in Australia, including AASB 134: “Interim Financial Reporting”.
Our half-year financial report does not include all notes of the type normally included in the Annual Financial Report. Therefore, it cannot be expected to provide as full an understanding of the income statement, balance sheet and cash flows of the Telstra Group as the full financial report.
This half-year financial report is prepared in accordance with historical cost, except for some categories of investments, which are equity accounted and some financial assets and liabilities (including derivative instruments) which are recorded at fair value. Cost is the fair value of the consideration given in exchange for net assets acquired.
In preparing this half-year financial report, we are required to make judgments and estimates that impact:
• income and expenses for the half-year;• the reported amounts of assets and liabilities; and• the disclosure of off balance sheet arrangements, including
contingent assets and contingent liabilities.
We continually evaluate our judgements and estimates. We base our judgements and estimates on historical experience, various other assumptions we believe to be reasonable under the circumstances and, where appropriate, practices adopted by international telecommunications companies. Actual results may differ from our estimates.
For the purpose of preparing this half-year financial report, each half-year has been treated as a discrete reporting period.
1.2 Further clarification of terminology used in our income statement
Under the requirements of AASB 101: “Presentation of Financial Statements”, we must classify all of our expenses (apart from any finance costs and our share of net (gain)/loss from jointly controlled and associated entities) according to either the nature (type) of the expense or the function (activity) to which the expense relates. We have chosen to classify our expenses using the nature classification as it more accurately reflects the type of operations we undertake.
Earnings before interest, income tax expense, depreciation and amortisation (EBITDA) reflects our profit for the year prior to including the effect of net finance costs, income taxes, depreciation and amortisation. We believe that EBITDA is a relevant and useful financial measure used by management to measure the company’s operating profit.
Our management uses EBITDA, in combination with other financial measures, primarily to evaluate the company’s operating performance before financing costs, income tax and non-cash capital related expenses. In consideration of the capital intensive nature of our business, EBITDA is a useful supplement to net income in understanding cash flows generated from operations that are available for payment of income taxes, debt service and capital expenditure.
In addition, we believe EBITDA is useful to investors because analysts and other members of the investment community largely view EBITDA as a key and widely recognised measure of operating performance.
Earnings before interest and income tax expense (EBIT) is a similar measure to EBITDA, but takes into account the effect of depreciation and amortisation.
When a specific item from ordinary activities is of such a size, nature or incidence that its disclosure is relevant in explaining our operating performance for the reporting period, its nature and amount is disclosed separately in note 3.
1.3 Rounding
All dollar amounts in this financial report (except where indicated) have been rounded to the nearest million dollars ($m) for presentation. This has been done in accordance with Australian Securities and Investments Commission (ASIC) Class Order 98/100, dated 10 July 1998, issued under section 341(1) of the Corporations Act 2001.
Telstra Corporation Limited and controlled entities
7
Notes to the Half-Year Financial Statements (continued)
2. Summary of accounting policies
2.1 Accounting policies
Our accounting policies are consistent with those disclosed in the Annual Financial Report as at 30 June 2006, with the exception of those detailed below.
2.2 Change in accounting policies
The following accounting policy changes occurred during the half-year ended 31 December 2006.
(i) Financial guarantees
AASB 2005-9: “Amendments to Australian Accounting Standards” became applicable to annual reporting periods beginning on or after 1 January 2006. We have applied this interpretation in our financial report for the half-year ended 31 December 2006.
These amendments require that liabilities arising from the issue of financial guarantee contracts be recognised on the balance sheet. The amendments have resulted in no impact on our balance sheet, income statement or statement of cash flows.
(ii) Lease arrangements
UIG 4: "Determining Whether an Arrangement Contains a Lease" (UIG 4) became applicable to annual reporting periods beginning on or after 1 January 2006. We have applied this interpretation in our financial report for the half-year ended 31 December 2006 including the restatement of our comparative information.
UIG 4 requires entities to assess whether arrangements they enter into contain leases. An arrangement contains a lease if fulfilment of the arrangement is dependent on the use of specific assets and conveys a right to use those assets to the customer. The lease component of the arrangement is then separated and accounted for as either a finance or operating lease depending on the nature of the arrangement.
Some of our solutions management and outsourcing arrangements that we enter into as a service provider meet the requirements of UIG 4 as we provide the customer with the right to use dedicated equipment. We have applied this new accounting policy to these arrangements in existence at the start of our comparative period (1 July 2005). We have assessed that all embedded leases in existence at 1 July 2005 were finance leases in accordance with our current accounting policy for leases and AASB 117: “Leases” as substantially all of the risks and benefits incidental to ownership of this equipment are transferred to the customer. This required property, plant and equipment identified as part of an UIG 4 arrangement to be transferred to finance lease receivable and for lease accounting to be applied post this date.
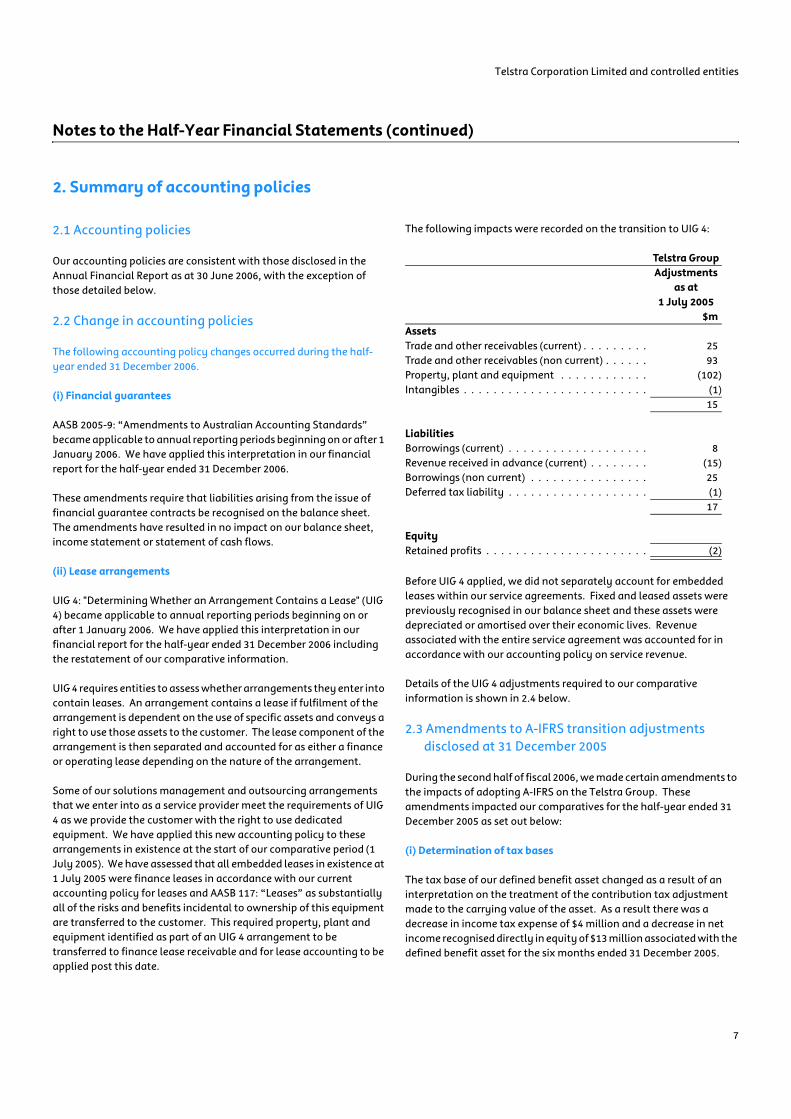
The following impacts were recorded on the transition to UIG 4:
Before UIG 4 applied, we did not separately account for embedded leases within our service agreements. Fixed and leased assets were previously recognised in our balance sheet and these assets were depreciated or amortised over their economic lives. Revenue associated with the entire service agreement was accounted for in accordance with our accounting policy on service revenue.
Details of the UIG 4 adjustments required to our comparative information is shown in 2.4 below.
2.3 Amendments to A-IFRS transition adjustments disclosed at 31 December 2005
During the second half of fiscal 2006, we made certain amendments to the impacts of adopting A-IFRS on the Telstra Group. These amendments impacted our comparatives for the half-year ended 31 December 2005 as set out below:
(i) Determination of tax bases
The tax base of our defined benefit asset changed as a result of an interpretation on the treatment of the contribution tax adjustment made to the carrying value of the asset. As a result there was a decrease in income tax expense of $4 million and a decrease in net income recognised directly in equity of $13 million associated with the defined benefit asset for the six months ended 31 December 2005.
Telstra GroupAdjustments
as at 1 July 2005
$mAssetsTrade and other receivables (current) . . . . . . . . . 25Trade and other receivables (non current) . . . . . . 93Property, plant and equipment . . . . . . . . . . . . (102)Intangibles . . . . . . . . . . . . . . . . . . . . . . . . . (1)
15
LiabilitiesBorrowings (current) . . . . . . . . . . . . . . . . . . . 8Revenue received in advance (current) . . . . . . . . (15)Borrowings (non current) . . . . . . . . . . . . . . . . 25Deferred tax liability . . . . . . . . . . . . . . . . . . . (1)
17
EquityRetained profits . . . . . . . . . . . . . . . . . . . . . . (2)
Telstra Corporation Limited and controlled entities
8
Notes to the Half-Year Financial Statements (continued)
2. Summary of accounting policies (continued)
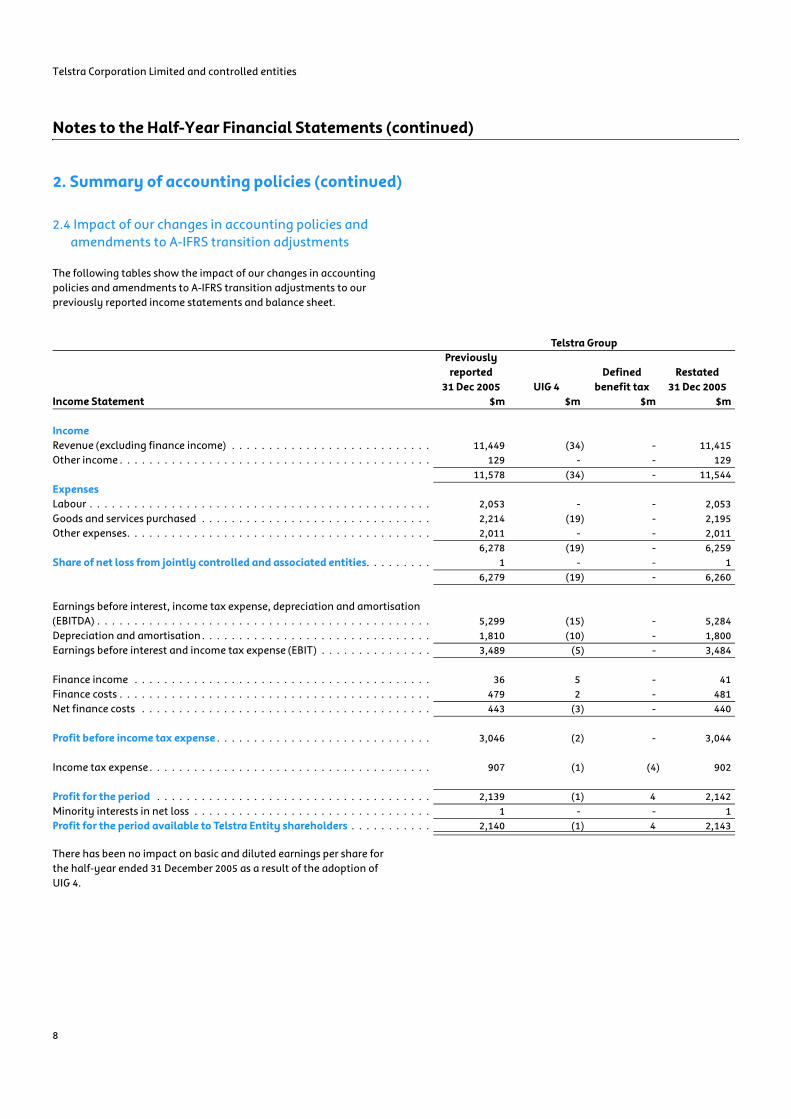
2.4 Impact of our changes in accounting policies and amendments to A-IFRS transition adjustments
The following tables show the impact of our changes in accounting policies and amendments to A-IFRS transition adjustments to our previously reported income statements and balance sheet.
There has been no impact on basic and diluted earnings per share for the half-year ended 31 December 2005 as a result of the adoption of UIG 4.
Telstra GroupPreviously
reported 31 Dec 2005 UIG 4
Defined benefit tax
Restated31 Dec 2005
Income Statement $m $m $m $m
IncomeRevenue (excluding finance income) . . . . . . . . . . . . . . . . . . . . . . . . . . . 11,449 (34) - 11,415Other income . . . . . . . . . . . . . . . . . . . . . . . . . . . . . . . . . . . . . . . . . . 129 - - 129
11,578 (34) - 11,544ExpensesLabour . . . . . . . . . . . . . . . . . . . . . . . . . . . . . . . . . . . . . . . . . . . . . . 2,053 - - 2,053Goods and services purchased . . . . . . . . . . . . . . . . . . . . . . . . . . . . . . . 2,214 (19) - 2,195Other expenses. . . . . . . . . . . . . . . . . . . . . . . . . . . . . . . . . . . . . . . . . 2,011 - - 2,011
6,278 (19) - 6,259Share of net loss from jointly controlled and associated entities. . . . . . . . . 1 - - 1
6,279 (19) - 6,260
Earnings before interest, income tax expense, depreciation and amortisation (EBITDA) . . . . . . . . . . . . . . . . . . . . . . . . . . . . . . . . . . . . . . . . . . . . . 5,299 (15) - 5,284Depreciation and amortisation . . . . . . . . . . . . . . . . . . . . . . . . . . . . . . . 1,810 (10) - 1,800Earnings before interest and income tax expense (EBIT) . . . . . . . . . . . . . . . 3,489 (5) - 3,484
Finance income . . . . . . . . . . . . . . . . . . . . . . . . . . . . . . . . . . . . . . . . 36 5 - 41Finance costs . . . . . . . . . . . . . . . . . . . . . . . . . . . . . . . . . . . . . . . . . . 479 2 - 481Net finance costs . . . . . . . . . . . . . . . . . . . . . . . . . . . . . . . . . . . . . . . 443 (3) - 440
Profit before income tax expense . . . . . . . . . . . . . . . . . . . . . . . . . . . . . 3,046 (2) - 3,044
Income tax expense . . . . . . . . . . . . . . . . . . . . . . . . . . . . . . . . . . . . . . 907 (1) (4) 902
Profit for the period . . . . . . . . . . . . . . . . . . . . . . . . . . . . . . . . . . . . . 2,139 (1) 4 2,142Minority interests in net loss . . . . . . . . . . . . . . . . . . . . . . . . . . . . . . . . 1 - - 1Profit for the period available to Telstra Entity shareholders . . . . . . . . . . . 2,140 (1) 4 2,143
Telstra Corporation Limited and controlled entities
9
Notes to the Half-Year Financial Statements (continued)
2. Summary of accounting policies (continued)
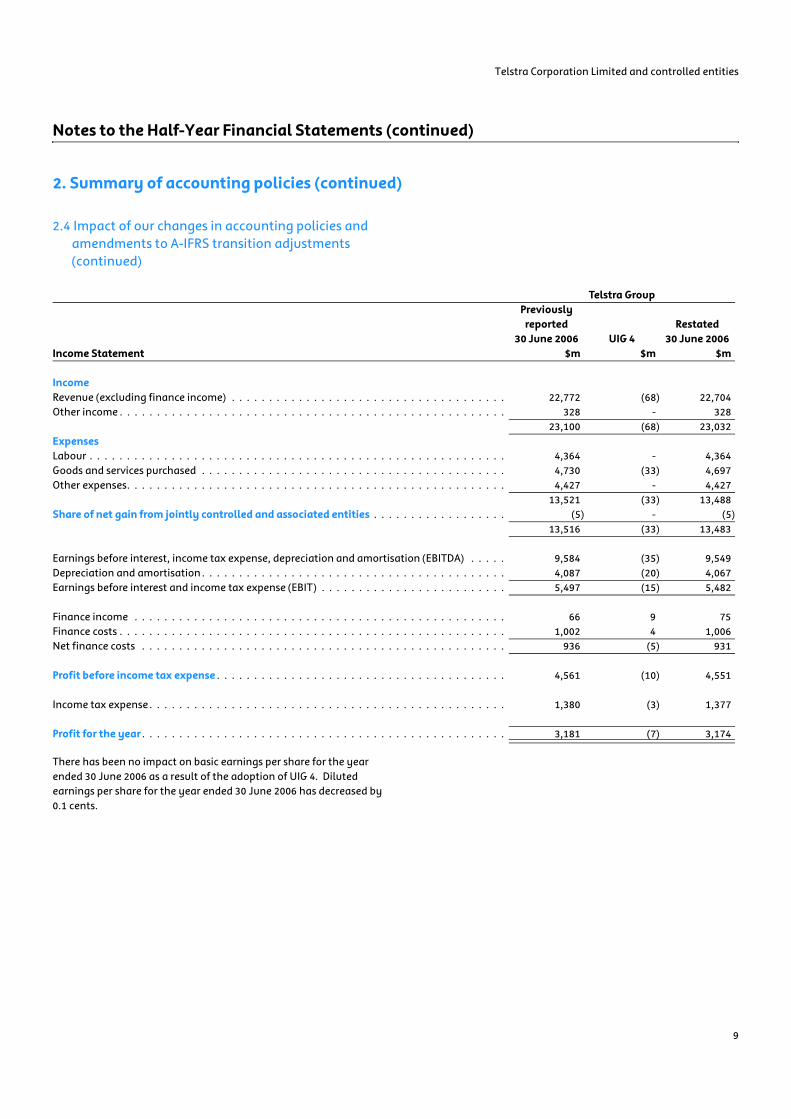
2.4 Impact of our changes in accounting policies and amendments to A-IFRS transition adjustments (continued)
There has been no impact on basic earnings per share for the year ended 30 June 2006 as a result of the adoption of UIG 4. Diluted earnings per share for the year ended 30 June 2006 has decreased by 0.1 cents.
Telstra GroupPreviously
reported 30 June 2006 UIG 4
Restated30 June 2006
Income Statement $m $m $m
IncomeRevenue (excluding finance income) . . . . . . . . . . . . . . . . . . . . . . . . . . . . . . . . . . . . . 22,772 (68) 22,704Other income . . . . . . . . . . . . . . . . . . . . . . . . . . . . . . . . . . . . . . . . . . . . . . . . . . . . 328 - 328
23,100 (68) 23,032ExpensesLabour . . . . . . . . . . . . . . . . . . . . . . . . . . . . . . . . . . . . . . . . . . . . . . . . . . . . . . . . 4,364 - 4,364Goods and services purchased . . . . . . . . . . . . . . . . . . . . . . . . . . . . . . . . . . . . . . . . . 4,730 (33) 4,697Other expenses. . . . . . . . . . . . . . . . . . . . . . . . . . . . . . . . . . . . . . . . . . . . . . . . . . . 4,427 - 4,427
13,521 (33) 13,488Share of net gain from jointly controlled and associated entities . . . . . . . . . . . . . . . . . . (5) - (5)
13,516 (33) 13,483
Earnings before interest, income tax expense, depreciation and amortisation (EBITDA) . . . . . 9,584 (35) 9,549Depreciation and amortisation . . . . . . . . . . . . . . . . . . . . . . . . . . . . . . . . . . . . . . . . . 4,087 (20) 4,067Earnings before interest and income tax expense (EBIT) . . . . . . . . . . . . . . . . . . . . . . . . . 5,497 (15) 5,482
Finance income . . . . . . . . . . . . . . . . . . . . . . . . . . . . . . . . . . . . . . . . . . . . . . . . . . 66 9 75Finance costs . . . . . . . . . . . . . . . . . . . . . . . . . . . . . . . . . . . . . . . . . . . . . . . . . . . . 1,002 4 1,006Net finance costs . . . . . . . . . . . . . . . . . . . . . . . . . . . . . . . . . . . . . . . . . . . . . . . . . 936 (5) 931
Profit before income tax expense . . . . . . . . . . . . . . . . . . . . . . . . . . . . . . . . . . . . . . . 4,561 (10) 4,551
Income tax expense . . . . . . . . . . . . . . . . . . . . . . . . . . . . . . . . . . . . . . . . . . . . . . . . 1,380 (3) 1,377
Profit for the year . . . . . . . . . . . . . . . . . . . . . . . . . . . . . . . . . . . . . . . . . . . . . . . . . 3,181 (7) 3,174
Telstra Corporation Limited and controlled entities
10
Notes to the Half-Year Financial Statements (continued)
2. Summary of accounting policies (continued)
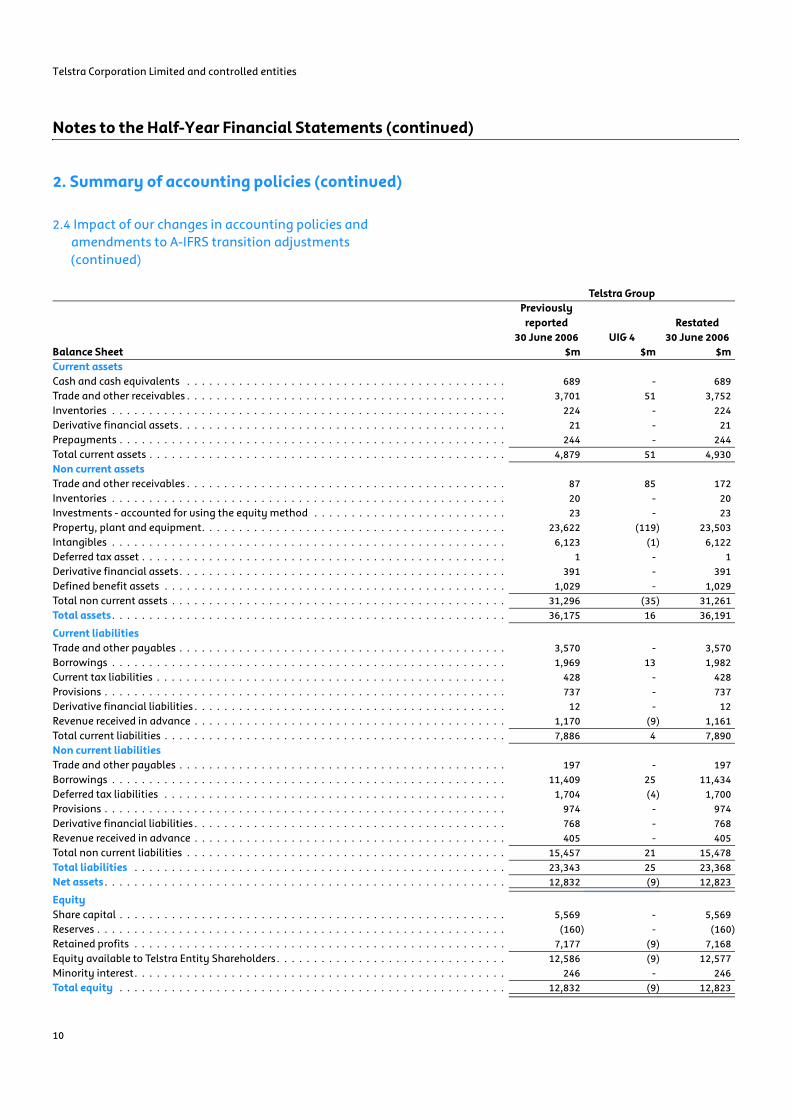
2.4 Impact of our changes in accounting policies and amendments to A-IFRS transition adjustments (continued)
Telstra GroupPreviously
reported30 June 2006 UIG 4
Restated 30 June 2006
Balance Sheet $m $m $mCurrent assetsCash and cash equivalents . . . . . . . . . . . . . . . . . . . . . . . . . . . . . . . . . . . . . . . . . . . 689 - 689Trade and other receivables . . . . . . . . . . . . . . . . . . . . . . . . . . . . . . . . . . . . . . . . . . . 3,701 51 3,752Inventories . . . . . . . . . . . . . . . . . . . . . . . . . . . . . . . . . . . . . . . . . . . . . . . . . . . . . 224 - 224Derivative financial assets. . . . . . . . . . . . . . . . . . . . . . . . . . . . . . . . . . . . . . . . . . . . 21 - 21Prepayments . . . . . . . . . . . . . . . . . . . . . . . . . . . . . . . . . . . . . . . . . . . . . . . . . . . . 244 - 244Total current assets . . . . . . . . . . . . . . . . . . . . . . . . . . . . . . . . . . . . . . . . . . . . . . . . 4,879 51 4,930Non current assetsTrade and other receivables . . . . . . . . . . . . . . . . . . . . . . . . . . . . . . . . . . . . . . . . . . . 87 85 172Inventories . . . . . . . . . . . . . . . . . . . . . . . . . . . . . . . . . . . . . . . . . . . . . . . . . . . . . 20 - 20Investments - accounted for using the equity method . . . . . . . . . . . . . . . . . . . . . . . . . . 23 - 23Property, plant and equipment. . . . . . . . . . . . . . . . . . . . . . . . . . . . . . . . . . . . . . . . . 23,622 (119) 23,503Intangibles . . . . . . . . . . . . . . . . . . . . . . . . . . . . . . . . . . . . . . . . . . . . . . . . . . . . . 6,123 (1) 6,122Deferred tax asset . . . . . . . . . . . . . . . . . . . . . . . . . . . . . . . . . . . . . . . . . . . . . . . . . 1 - 1Derivative financial assets. . . . . . . . . . . . . . . . . . . . . . . . . . . . . . . . . . . . . . . . . . . . 391 - 391Defined benefit assets . . . . . . . . . . . . . . . . . . . . . . . . . . . . . . . . . . . . . . . . . . . . . . 1,029 - 1,029Total non current assets . . . . . . . . . . . . . . . . . . . . . . . . . . . . . . . . . . . . . . . . . . . . . 31,296 (35) 31,261Total assets . . . . . . . . . . . . . . . . . . . . . . . . . . . . . . . . . . . . . . . . . . . . . . . . . . . . . 36,175 16 36,191
Current liabilitiesTrade and other payables . . . . . . . . . . . . . . . . . . . . . . . . . . . . . . . . . . . . . . . . . . . . 3,570 - 3,570Borrowings . . . . . . . . . . . . . . . . . . . . . . . . . . . . . . . . . . . . . . . . . . . . . . . . . . . . . 1,969 13 1,982Current tax liabilities . . . . . . . . . . . . . . . . . . . . . . . . . . . . . . . . . . . . . . . . . . . . . . . 428 - 428Provisions . . . . . . . . . . . . . . . . . . . . . . . . . . . . . . . . . . . . . . . . . . . . . . . . . . . . . . 737 - 737Derivative financial liabilities . . . . . . . . . . . . . . . . . . . . . . . . . . . . . . . . . . . . . . . . . . 12 - 12Revenue received in advance . . . . . . . . . . . . . . . . . . . . . . . . . . . . . . . . . . . . . . . . . . 1,170 (9) 1,161Total current liabilities . . . . . . . . . . . . . . . . . . . . . . . . . . . . . . . . . . . . . . . . . . . . . . 7,886 4 7,890Non current liabilitiesTrade and other payables . . . . . . . . . . . . . . . . . . . . . . . . . . . . . . . . . . . . . . . . . . . . 197 - 197Borrowings . . . . . . . . . . . . . . . . . . . . . . . . . . . . . . . . . . . . . . . . . . . . . . . . . . . . . 11,409 25 11,434Deferred tax liabilities . . . . . . . . . . . . . . . . . . . . . . . . . . . . . . . . . . . . . . . . . . . . . . 1,704 (4) 1,700Provisions . . . . . . . . . . . . . . . . . . . . . . . . . . . . . . . . . . . . . . . . . . . . . . . . . . . . . . 974 - 974Derivative financial liabilities . . . . . . . . . . . . . . . . . . . . . . . . . . . . . . . . . . . . . . . . . . 768 - 768Revenue received in advance . . . . . . . . . . . . . . . . . . . . . . . . . . . . . . . . . . . . . . . . . . 405 - 405Total non current liabilities . . . . . . . . . . . . . . . . . . . . . . . . . . . . . . . . . . . . . . . . . . . 15,457 21 15,478Total liabilities . . . . . . . . . . . . . . . . . . . . . . . . . . . . . . . . . . . . . . . . . . . . . . . . . . 23,343 25 23,368Net assets . . . . . . . . . . . . . . . . . . . . . . . . . . . . . . . . . . . . . . . . . . . . . . . . . . . . . . 12,832 (9) 12,823
EquityShare capital . . . . . . . . . . . . . . . . . . . . . . . . . . . . . . . . . . . . . . . . . . . . . . . . . . . . 5,569 - 5,569Reserves . . . . . . . . . . . . . . . . . . . . . . . . . . . . . . . . . . . . . . . . . . . . . . . . . . . . . . . (160) - (160)Retained profits . . . . . . . . . . . . . . . . . . . . . . . . . . . . . . . . . . . . . . . . . . . . . . . . . . 7,177 (9) 7,168Equity available to Telstra Entity Shareholders . . . . . . . . . . . . . . . . . . . . . . . . . . . . . . . 12,586 (9) 12,577Minority interest. . . . . . . . . . . . . . . . . . . . . . . . . . . . . . . . . . . . . . . . . . . . . . . . . . 246 - 246Total equity . . . . . . . . . . . . . . . . . . . . . . . . . . . . . . . . . . . . . . . . . . . . . . . . . . . . 12,832 (9) 12,823
Telstra Corporation Limited and controlled entities
11
Notes to the Half-Year Financial Statements (continued)
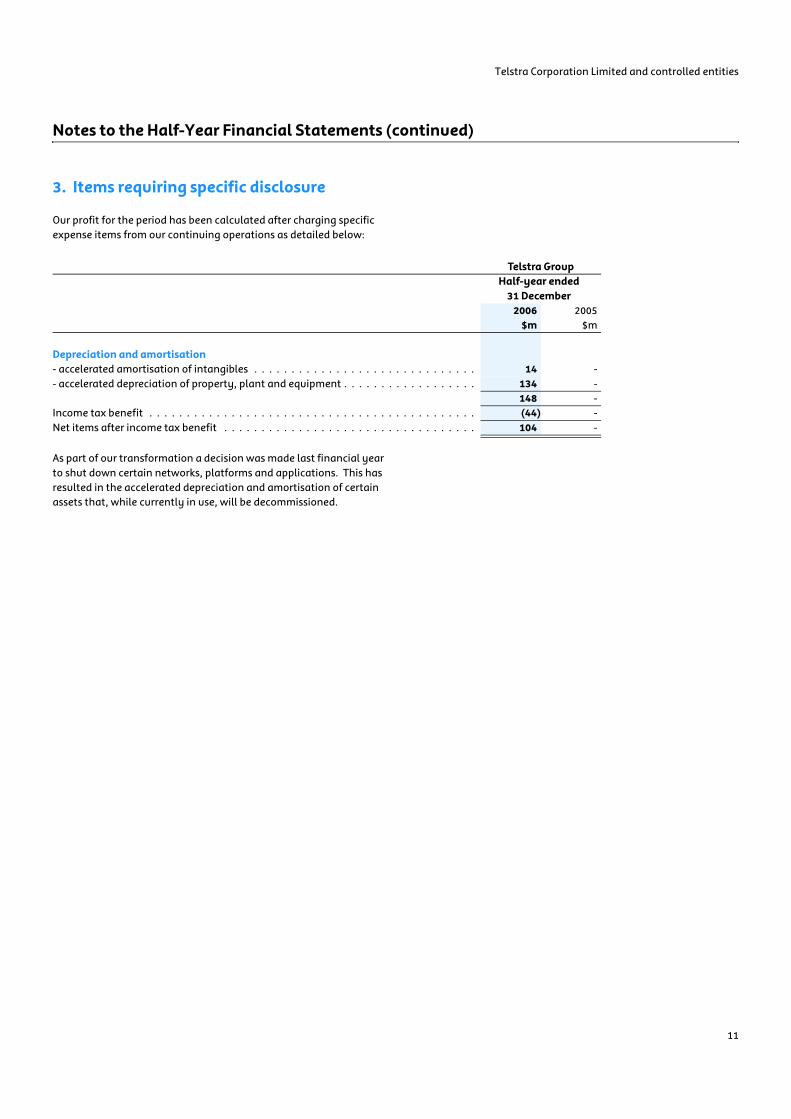
Our profit for the period has been calculated after charging specific expense items from our continuing operations as detailed below:
As part of our transformation a decision was made last financial year to shut down certain networks, platforms and applications. This has resulted in the accelerated depreciation and amortisation of certain assets that, while currently in use, will be decommissioned.
3. Items requiring specific disclosure
Telstra GroupHalf-year ended
31 December2006 2005
$m $m
Depreciation and amortisation- accelerated amortisation of intangibles . . . . . . . . . . . . . . . . . . . . . . . . . . . . . . 14 -- accelerated depreciation of property, plant and equipment . . . . . . . . . . . . . . . . . . 134 -
148 -Income tax benefit . . . . . . . . . . . . . . . . . . . . . . . . . . . . . . . . . . . . . . . . . . . . (44) -Net items after income tax benefit . . . . . . . . . . . . . . . . . . . . . . . . . . . . . . . . . . 104 -
Telstra Corporation Limited and controlled entities
12
Notes to the Half-Year Financial Statements (continued)
4. Dividends
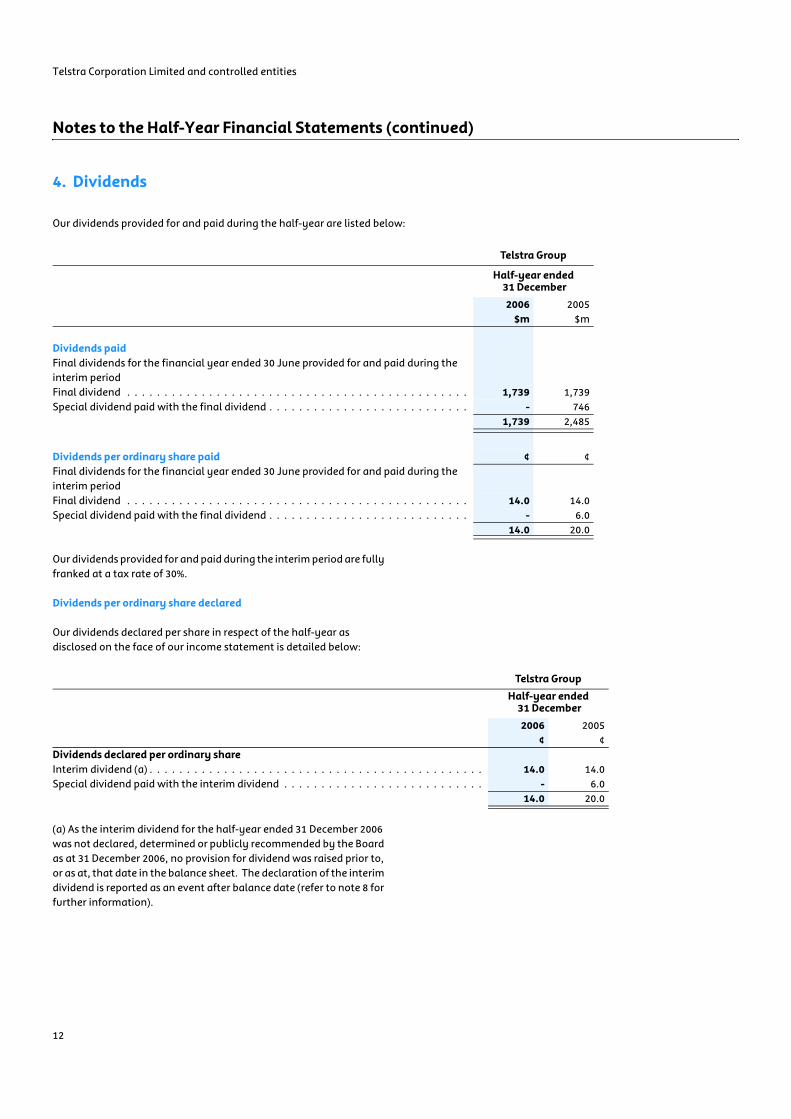
Our dividends provided for and paid during the half-year are listed below:
Our dividends provided for and paid during the interim period are fully franked at a tax rate of 30%.
Dividends per ordinary share declared
Our dividends declared per share in respect of the half-year as disclosed on the face of our income statement is detailed below:
(a) As the interim dividend for the half-year ended 31 December 2006 was not declared, determined or publicly recommended by the Board as at 31 December 2006, no provision for dividend was raised prior to, or as at, that date in the balance sheet. The declaration of the interim dividend is reported as an event after balance date (refer to note 8 for further information).
Telstra Group
Half-year ended 31 December
2006 2005$m $m
Dividends paidFinal dividends for the financial year ended 30 June provided for and paid during the interim periodFinal dividend . . . . . . . . . . . . . . . . . . . . . . . . . . . . . . . . . . . . . . . . . . . . . . 1,739 1,739Special dividend paid with the final dividend . . . . . . . . . . . . . . . . . . . . . . . . . . . - 746
1,739 2,485
Dividends per ordinary share paid ¢ ¢Final dividends for the financial year ended 30 June provided for and paid during the interim periodFinal dividend . . . . . . . . . . . . . . . . . . . . . . . . . . . . . . . . . . . . . . . . . . . . . . 14.0 14.0Special dividend paid with the final dividend . . . . . . . . . . . . . . . . . . . . . . . . . . . - 6.0
14.0 20.0
Telstra Group
Half-year ended 31 December
2006 2005¢ ¢
Dividends declared per ordinary shareInterim dividend (a) . . . . . . . . . . . . . . . . . . . . . . . . . . . . . . . . . . . . . . . . . . . . . 14.0 14.0Special dividend paid with the interim dividend . . . . . . . . . . . . . . . . . . . . . . . . . . . - 6.0
14.0 20.0
Telstra Corporation Limited and controlled entities
13
Notes to the Half-Year Financial Statements (continued)
5. Segment information
Business segments
We report our segment information on the basis of business segments as our risks and returns are affected predominantly by differences in the products and services we provide through those segments.
During the half-year ended 31 December 2006 there were no adjustments to our business segments.
In our segment financial results, the “Other” segment consists of various business units that do not qualify as reportable segments in their own right. These include:
• Telstra Country Wide;• Telstra BigPond;• Telstra Media;• Strategic Marketing; and• our corporate areas.
Segment financial results
For segment reporting purposes, we have reallocated certain items between the respective business segments pursuant to the definitions of segment revenues and segment expenses contained in the applicable accounting standard, where a reasonable allocation basis exists.
Where no reasonable allocation basis exists, we have not reallocated individual items to alternative segments. For segment reporting purposes, these items are reported within the same business segment as for internal management reporting. As a result, our segment revenues and segment expenses do not reflect actual operating results achieved for our business segments in certain circumstances.
The following narrative explains our segment results for those individual items where no reasonable allocation basis exists:
• Sales revenue associated with mobile handsets for Telstra Consumer Marketing and Channels (TC&C), Telstra Business (TB) and Telstra Enterprise and Government (TE&G) are allocated totally to the TC&C segment, with the exception of some products sold which are allocated to TB and TE&G. Ongoing prepaid and postpaid mobile revenues derived from our mobile usage is recorded in TC&C, TB and TE&G depending on the type of customer serviced. In addition, the majority of goods and services purchased associated with our mobile revenues are allocated to the TC&C segment.
These allocations reflect management's accountability framework and internal reporting system and accordingly no reasonable basis for reallocation to the respective business segments exists.
In addition, revenue derived from our BigPond Internet products are recorded in the customer facing business segments of TC&C, TB and TE&G. Certain distribution costs in relation to these products are recognised in these three business segments. Telstra Operations recognise certain expenses in relation to the installation and running of the broadband cable network. In accordance with our application of the business segment definition in relation to customer type, we have not reallocated these items to the Telstra BigPond business segment.
Inter-segment transfers
We account for all transactions of entities within the Telstra Group, including international transactions between Australian and non-Australian businesses, at market value. For segment reporting purposes, transfer pricing is not used within the Company. As such the inter-segment revenue line purely relates to intercompany revenue.
The Asset Accounting Group does not allocate depreciation expense related to the use of assets owned at the corporate level to other business segments.
Telstra Corporation Limited and controlled entities
14
Notes to the Half-Year Financial Statements (continued)
5. Segment information (continued)
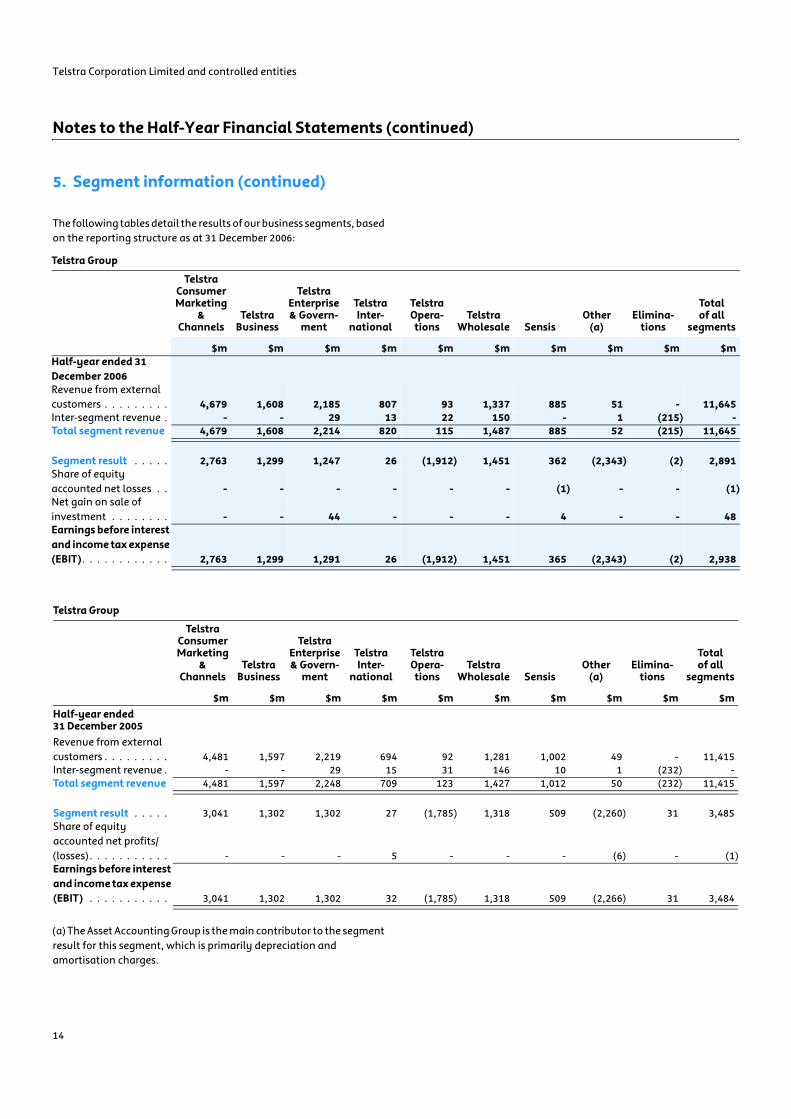
The following tables detail the results of our business segments, based on the reporting structure as at 31 December 2006:
(a) The Asset Accounting Group is the main contributor to the segment result for this segment, which is primarily depreciation and amortisation charges.
Telstra Group
Telstra Consumer Marketing
& Channels
Telstra Business
TelstraEnterprise & Govern-
ment
Telstra Inter-
national
Telstra Opera-tions
Telstra Wholesale Sensis
Other(a)
Elimina-tions
Total of all
segments
$m $m $m $m $m $m $m $m $m $mHalf-year ended 31 December 2006Revenue from external customers . . . . . . . . . 4,679 1,608 2,185 807 93 1,337 885 51 - 11,645Inter-segment revenue . - - 29 13 22 150 - 1 (215) -Total segment revenue 4,679 1,608 2,214 820 115 1,487 885 52 (215) 11,645
Segment result . . . . . 2,763 1,299 1,247 26 (1,912) 1,451 362 (2,343) (2) 2,891Share of equity accounted net losses . . - - - - - - (1) - - (1)Net gain on sale of investment . . . . . . . . - - 44 - - - 4 - - 48Earnings before interest and income tax expense (EBIT). . . . . . . . . . . . 2,763 1,299 1,291 26 (1,912) 1,451 365 (2,343) (2) 2,938
Telstra Group
Telstra Consumer Marketing
& Channels
Telstra Business
Telstra Enterprise & Govern-
ment
Telstra Inter-
national
Telstra Opera-tions
Telstra Wholesale Sensis
Other (a)
Elimina-tions
Total of all
segments
$m $m $m $m $m $m $m $m $m $mHalf-year ended 31 December 2005Revenue from external customers . . . . . . . . . 4,481 1,597 2,219 694 92 1,281 1,002 49 - 11,415Inter-segment revenue . - - 29 15 31 146 10 1 (232) -Total segment revenue 4,481 1,597 2,248 709 123 1,427 1,012 50 (232) 11,415
Segment result . . . . . 3,041 1,302 1,302 27 (1,785) 1,318 509 (2,260) 31 3,485Share of equity accounted net profits/(losses). . . . . . . . . . . - - - 5 - - - (6) - (1)Earnings before interest and income tax expense (EBIT) . . . . . . . . . . . 3,041 1,302 1,302 32 (1,785) 1,318 509 (2,266) 31 3,484
Telstra Corporation Limited and controlled entities
15
Notes to the Half-Year Financial Statements (continued)
6. Notes to the statement of cash flows
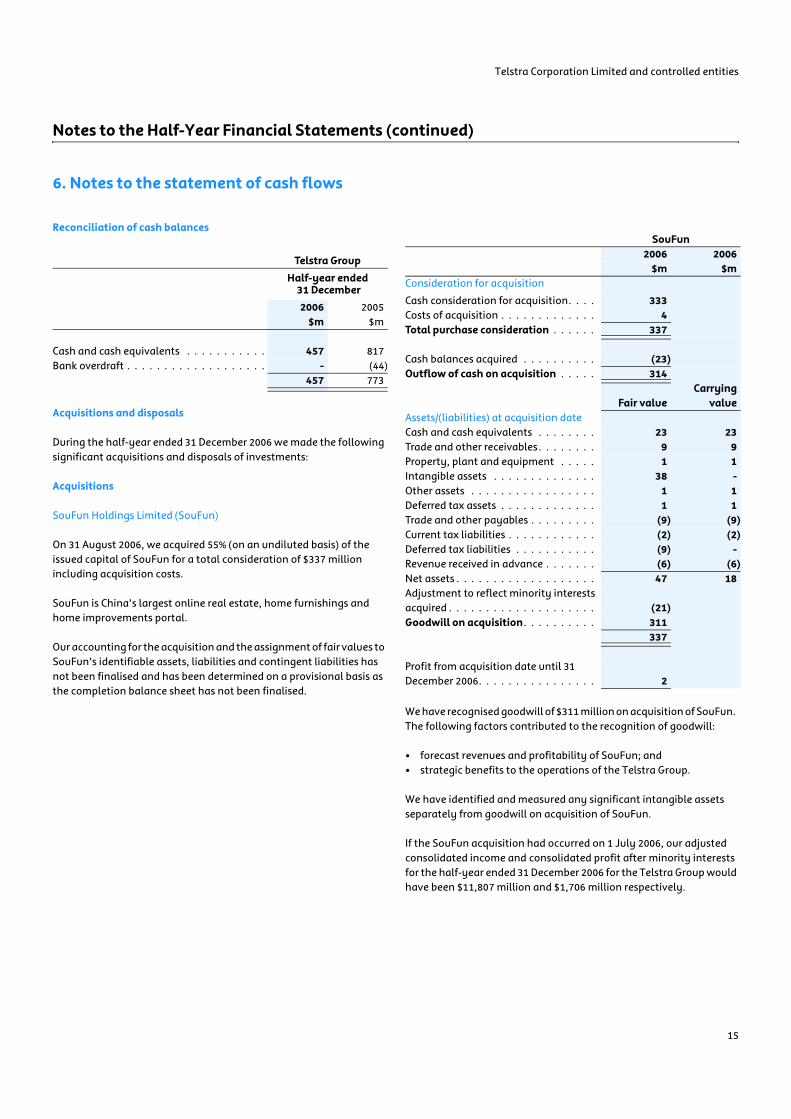
Reconciliation of cash balances
Acquisitions and disposals
During the half-year ended 31 December 2006 we made the following significant acquisitions and disposals of investments:
Acquisitions
SouFun Holdings Limited (SouFun)
On 31 August 2006, we acquired 55% (on an undiluted basis) of the issued capital of SouFun for a total consideration of $337 million including acquisition costs.
SouFun is China’s largest online real estate, home furnishings and home improvements portal.
Our accounting for the acquisition and the assignment of fair values to SouFun’s identifiable assets, liabilities and contingent liabilities has not been finalised and has been determined on a provisional basis as the completion balance sheet has not been finalised.
We have recognised goodwill of $311 million on acquisition of SouFun. The following factors contributed to the recognition of goodwill:
• forecast revenues and profitability of SouFun; and• strategic benefits to the operations of the Telstra Group.
We have identified and measured any significant intangible assets separately from goodwill on acquisition of SouFun.
If the SouFun acquisition had occurred on 1 July 2006, our adjusted consolidated income and consolidated profit after minority interests for the half-year ended 31 December 2006 for the Telstra Group would have been $11,807 million and $1,706 million respectively.
Telstra Group
Half-year ended 31 December
2006 2005$m $m
Cash and cash equivalents . . . . . . . . . . . 457 817Bank overdraft . . . . . . . . . . . . . . . . . . . - (44)
457 773
SouFun2006 2006
$m $mConsideration for acquisition
Cash consideration for acquisition. . . . 333Costs of acquisition . . . . . . . . . . . . . 4Total purchase consideration . . . . . . 337
Cash balances acquired . . . . . . . . . . (23)Outflow of cash on acquisition . . . . . 314
Fair valueCarrying
valueAssets/(liabilities) at acquisition dateCash and cash equivalents . . . . . . . . 23 23Trade and other receivables. . . . . . . . 9 9Property, plant and equipment . . . . . 1 1Intangible assets . . . . . . . . . . . . . . 38 -Other assets . . . . . . . . . . . . . . . . . 1 1Deferred tax assets . . . . . . . . . . . . . 1 1Trade and other payables . . . . . . . . . (9) (9)Current tax liabilities . . . . . . . . . . . . (2) (2)Deferred tax liabilities . . . . . . . . . . . (9) -Revenue received in advance . . . . . . . (6) (6)Net assets . . . . . . . . . . . . . . . . . . . 47 18Adjustment to reflect minority interests acquired . . . . . . . . . . . . . . . . . . . . (21)Goodwill on acquisition. . . . . . . . . . 311
337
Profit from acquisition date until 31 December 2006. . . . . . . . . . . . . . . . 2
Telstra Corporation Limited and controlled entities
16
Notes to the Half-Year Financial Statements (continued)
6. Notes to the statement of cash flows (continued)
CSL New World Mobility Group
During fiscal 2006, we merged our 100% owned Hong Kong mobile operations (Telstra CSL Group) with the Hong Kong mobile operations of New World PCS Holdings Limited and its controlled entities (New World Mobility Group) to form the CSL New World Mobility Group.
Under the merger agreement, Telstra CSL Limited (Telstra CSL) issued new shares to New World Mobility Holdings Limited (NWMHL) in return for 100% of the issued capital of the New World Mobility Group and $44 million in cash. The share issue diluted Telstra’s ownership in the merged group to 76.4%.
Following finalisation of the subscription amount, we were required to make a cash payment of $21 million to NWMHL during fiscal 2007, which represented an adjustment to the $44 million cash received in fiscal 2006. In accordance with the terms of the merger, this adjustment was primarily based on the final working capital position of the New World Mobility Group at the completion date.
Disposals
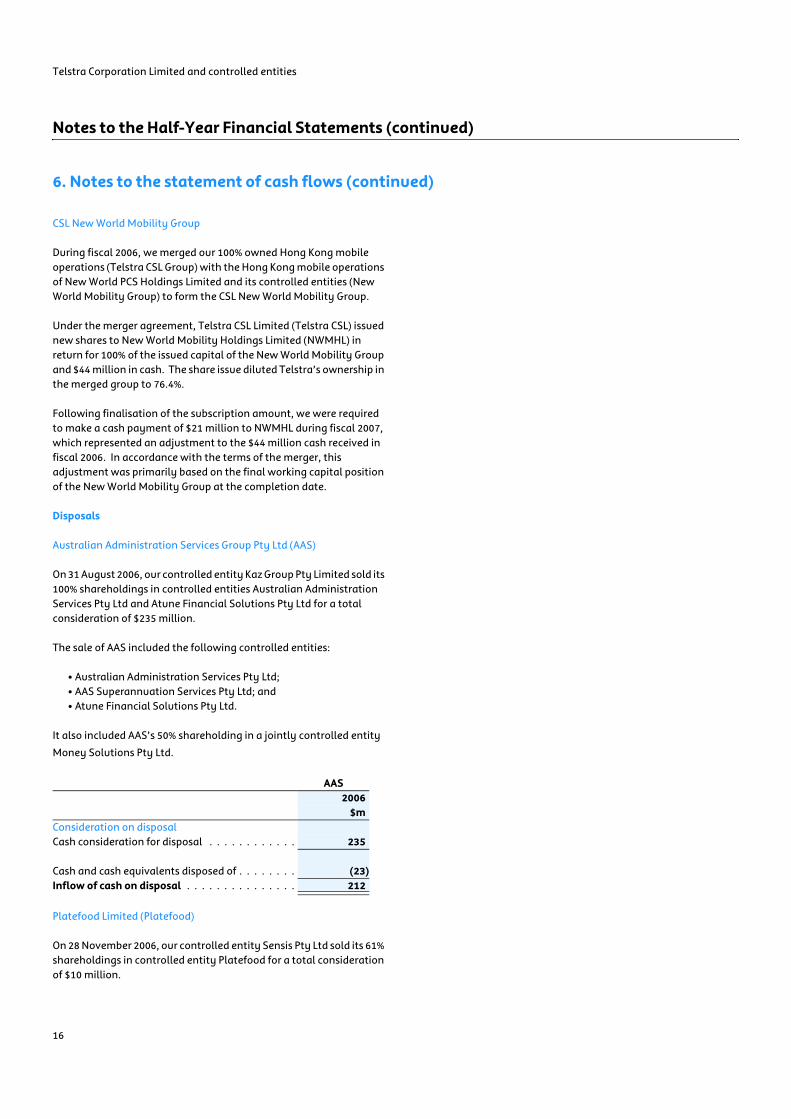
Australian Administration Services Group Pty Ltd (AAS)
On 31 August 2006, our controlled entity Kaz Group Pty Limited sold its 100% shareholdings in controlled entities Australian Administration Services Pty Ltd and Atune Financial Solutions Pty Ltd for a total consideration of $235 million.
The sale of AAS included the following controlled entities:
• Australian Administration Services Pty Ltd;• AAS Superannuation Services Pty Ltd; and• Atune Financial Solutions Pty Ltd.
It also included AAS’s 50% shareholding in a jointly controlled entity
Money Solutions Pty Ltd.
Platefood Limited (Platefood)
On 28 November 2006, our controlled entity Sensis Pty Ltd sold its 61% shareholdings in controlled entity Platefood for a total consideration of $10 million.
AAS2006
$mConsideration on disposalCash consideration for disposal . . . . . . . . . . . . 235
Cash and cash equivalents disposed of . . . . . . . . (23)Inflow of cash on disposal . . . . . . . . . . . . . . . 212
Telstra Corporation Limited and controlled entities
17
Notes to the Half-Year Financial Statements (continued)
7. Contingent liabilities, contingent assets and expenditure commitments
Contingent liabilities
There have been no significant changes from 30 June 2006 to guarantees, indemnities and support provided by us, or to legal actions we are involved in, apart from:
FOXTEL
On 31 July 2006, our 50% owned pay television joint venture FOXTEL entered into a new $600 million syndicated secured term loan facility to fund the refinancing of previous loan facilities (including the $550 million syndicated facility), and to enable it to meet future cash flow and expenditure requirements.
The equity contribution deed (ECD) entered into by us and FOXTEL's other ultimate shareholders, News Corporation Limited and Publishing and Broadcasting Limited has been terminated. As a result of the refinancing, we no longer have a contingent liability under the ECD, which amounted to $100 million as at 30 June 2006.
Unconditioned Local Loop Service (ULLS) and Line Sharing Service (LSS)
ULLS is a declared service by which competitors effectively rent the copper pairs or "loops" connecting Telstra exchanges to almost all residential and business premises in Australia. The ULLS is connected to Telstra's competitors' equipment in Telstra's exchanges allowing them to provide voice and broadband services to retail customers. Once connected, no Telstra services can be provided over the ULLS. The ACCC has indicated that Telstra should charge different prices in different areas for ULLS, despite the fact that it is required to charge the same residential and business retail prices for a basic line rental service throughout Australia.
In December 2005, Telstra submitted an ULLS access undertaking with a single (or averaged) price of $30 per month for all areas. In August 2006 the ACCC issued a final decision, rejecting the undertaking on the basis that it was not satisfied that Telstra's estimate of its costs and the averaging of those costs were reasonable. Telstra appealed that rejection to the Australian Competition Tribunal.
A number of Telstra's competitors have notified access disputes in relation to ULLS. In August 2006, the ACCC made binding interim decisions in several of these arbitrations that prices remain deaveraged and that the price in band 2 (the metropolitan area - where the greatest number of ULLS services will be provided) be reduced from $22 to $17.70 per month.
On 14 September 2006, Telstra lodged an appeal to the Australian Competition Tribunal. The Tribunal is required to make its decision by 14 March 2007, or if it extends the decision making period, by 14 June 2007. There is also a risk of the ACCC making final determinations in the access disputes at a lower price.
LSS is a service whereby the copper wire connecting our exchanges to almost all residential and business premises in Australia is shared with a Telstra competitor. Telstra will typically provide voice services to the customer while the competitor will provide broadband services over the same copper wire.
In December 2004, Telstra submitted a LSS access undertaking at $9 per month. This was rejected by the ACCC in December 2005, with the Australian Competition Tribunal upholding the ACCC’s rejection in June 2006.
A number of Telstra competitors have notified access disputes in relation to LSS. On 21 December 2006, the ACCC made an interim decision in these disputes that the access charge for LSS be set at $3.20 per month.
When the ACCC make their final determination on these ULLS and LSS access disputes, they may find that it is reasonable for Telstra to reimburse the access seekers for the difference in the access price charged from the date in which the various access seekers lodged their access dispute or from a point prior to that time when negotiations between Telstra and the access seeker commenced.
Telstra made submissions to the ACCC on the appropriate course of action going forward with the ULLS and LSS access disputes having regard to the Constitutional Challenge which Telstra has recently commenced. The ACCC has subsequently advised that it will be proceeding with the access disputes notwithstanding this challenge. Refer to note 8 for further details regarding the Constitutional Challenge.
Competition Notice
In December 2005, we increased our prices for line access provided to our competitors to prices closer to our average costs of providing that access. The ACCC appears to allege that these increases left insufficient margin for our competitors in respect of a "lower spend" segment of the retail market. The ACCC somehow considers that our conduct has or is likely to have the effect of substantially lessening competition across the retail market and therefore that we are in breach of the competition rule. On 12 April 2006, the ACCC issued a competition notice against us to this effect.
Telstra Corporation Limited and controlled entities
18
Notes to the Half-Year Financial Statements (continued)
7. Contingent liabilities, contingent assets and expenditure commitments (continued)
Contingent liabilities (continued)
Competition Notice (continued)
The ACCC has yet to commence enforcement proceedings against us but, should the ACCC elect to commence such proceedings and should they be successful, the maximum potential penalties which had accrued as at 31 December 2006 exceed $760 million (30 June 2006: exceeded $200 million) and continue to accrue at $3 million per day. Optus has issued proceedings against Telstra in the Federal Court which, in part, rely on the competition notice and seek damages, a refund and an injunction preventing us from charging the increased prices and recovering our costs. Telstra will vigorously defend the Optus proceedings and any future enforcement proceedings should they, be commenced by the ACCC.
Telstra has challenged the validity of the ACCC's decision to issue the competition notice (and the preceding consultation notice) in the Federal Court on administrative law grounds. Amongst other things, we allege that the competition notice (and the preceding consultation notice) should be set aside for uncertainty and that the ACCC did not accord us procedural fairness by failing to properly consult with us prior to the issue of the competition notice. The ACCC argues that it does not owe us any duty of procedural fairness or natural justice when issuing competition notices. This challenge was heard by the Federal Court in August 2006. Judgement was reserved.
Expenditure commitments
There have been no significant changes from 30 June 2006 to our expenditure commitments, apart from:
• FOXTEL no longer has commitments relating to digital set top box units, which reduced our share of the commitments by $141 million;
• we entered into a contract with IBM Australia Ltd for procurement, operational and accounts payable functions for $370 million expiring in August 2013. The commitment remaining at 31 December 2006 was $366 million;
• Sensis entered into a contract for IT services for $165 million with AMDOCS USA Inc. This commitment expires in June 2011. The amount of the commitment outstanding at 31 December 2006 was $138 million; and
• we have entered into a contract for fixed line transformation with Alcatel Australia Ltd for $461 million. This commitment expires in June 2007. The amount of this commitment remaining at 31 December 2006 was $265 million.
Telstra Corporation Limited and controlled entities
19
Notes to the Half-Year Financial Statements (continued)
8. Events after balance date
The directors are not aware of any matter or circumstance that has occurred since 31 December 2006 that, in their opinion, has significantly affected or may significantly affect in future years:
• our operations;• the results of those operations; or• the state of our affairs;
other than:
Dividends declaration
On 15 February 2007, the directors of Telstra Corporation Limited declared a fully franked interim dividend of 14 cents per ordinary share. The record date for the interim dividend is 2 March 2007 with payment to be made on 30 March 2007. Shares will trade excluding entitlement to the dividends on 26 February 2007.
A provision for dividend payable has been raised as at the date of declaration, amounting to $1,740 million. The interim dividend will be fully franked at a tax rate of 30%. The financial effect of the dividend declaration was not brought to account as at 31 December 2006.
Constitutional Challenge
On 24 January 2007, Telstra commenced proceedings in the High Court against the Commonwealth, the ACCC and eleven access seekers who had, prior to 24 January 2007, notified access disputes in respect of ULLS and/or LSS. Telstra is seeking declarations from the High Court that Part XIC of the Trade Practices Act is invalid as it applies to ULLS and LSS, together with administrative relief directed at each of the specific access disputes. The matter was heard (for first directions only) on 8 February 2007 and orders were made for the filing of pleadings and particulars. The matter has been relisted on 20 March 2007.
Telstra Corporation Limited and controlled entities
20
Directors’ Declaration
The directors of Telstra Corporation Limited have made a resolution that declared:
(a) the financial statements and notes, set out on pages 2 to 19, of the Telstra Group:
(i) comply with Accounting Standard AASB 134 Interim Financial Reporting and the Corporations Regulations 2001;
(ii) give a true and fair view of the financial position as at 31 December 2006 and performance, as represented by the results of the operations and cash flows, for the half-year ended 31 December 2006; and
(iii) in the directors’ opinion, have been made out in accordance with the Corporations Act 2001.
(b) at the date of this declaration, in the directors’ opinion, there are reasonable grounds to believe that Telstra Corporation Limited will be able to pay its debts as and when they become due and payable.
This declaration is made in accordance with a resolution of the Directors.
Donald G McGauchie AOChairman
15 February 2007Melbourne, Australia
Solomon D TrujilloChief Executive Officer
Telstra Corporation Limited and controlled entities
21
Independent Review Report
To the members of Telstra Corporation Limited
Report on the Half-Year Financial Report
We have reviewed the accompanying half-year financial report of the Telstra Group (Telstra Corporation Limited and the entities it controlled during the period), which comprises the balance sheet as at 31 December 2006, and the income statement, statement of recognised income and expense and cash flow statement for the half-year ended on that date, a summary of accounting policies, other selected explanatory notes and the directors' declaration.
Directors' Responsibility for the Half-Year Financial Report
The directors of the Telstra Group are responsible for the preparation and fair presentation of the half-year financial report in accordance with Australian Accounting Standards (including the Australian Accounting Interpretations) and the Corporations Act 2001. This responsibility includes designing, implementing and maintaining internal controls relevant to the preparation and fair presentation of the half-year financial report that is free from material misstatement, whether due to fraud or error; selecting and applying appropriate accounting policies; and making accounting estimates that are reasonable in the circumstances.
Auditor's Responsibility
Our responsibility is to express a conclusion on the half-year financial report based on our review. We conducted our review in accordance with Auditing Standard on Review Engagements ASRE 2410 Review of an Interim Financial Report Performed by the Independent Auditor of the Entity, in order to state whether, on the basis of the procedures described, we have become aware of any matter that makes us believe that the financial report is not in accordance with the Corporations Act 2001 including: giving a true and fair view of the Telstra Group's financial position as at 31 December 2006 and its performance for the half-year ended on that date; and complying with Accounting Standard AASB 134 Interim Financial Reporting and the Corporations Regulations 2001 and other mandatory financial reporting requirements in Australia. As the auditor of the Telstra Group, ASRE 2410 requires that we comply with the ethical requirements relevant to the audit of the annual financial report.
A review of a half-year financial report consists of making enquiries, primarily of persons responsible for financial and accounting matters, and applying analytical and other review procedures. A review is substantially less in scope than an audit conducted in accordance with Australian Auditing Standards and consequently does not enable us to obtain assurance that we would become aware of all significant matters that might be identified in an audit. Accordingly, we do not express an audit opinion.
Independence
In conducting our review, we have complied with the independence requirements of the Corporations Act 2001. We have given to the directors of the company a written Auditor's Independence Declaration, a copy of which is included in the Directors' Report.
Conclusion
Based on our review, which is not an audit, we have not become aware of any matter that makes us believe that the interim financial report of the Telstra Group is not in accordance with:
(a) the Corporations Act 2001, including:
(i) giving a true and fair view of the financial position of the Telstra Group at 31 December 2006 and of its performance for the half-year ended on that date; and
(ii) complying with Accounting Standard AASB 134 "Interim Financial Reporting" and the Corporations Regulations 2001; and
(b) other mandatory financial reporting requirements in Australia.
Ernst & Young
Mirco BardellaPartner
15 February 2007Melbourne, Australia