Embed Size (px)
Citation preview
TELUS CORPORATION
CONDENSED INTERIM CONSOLIDATED
FINANCIAL STATEMENTS
(UNAUDITED)
MARCH 31, 2016
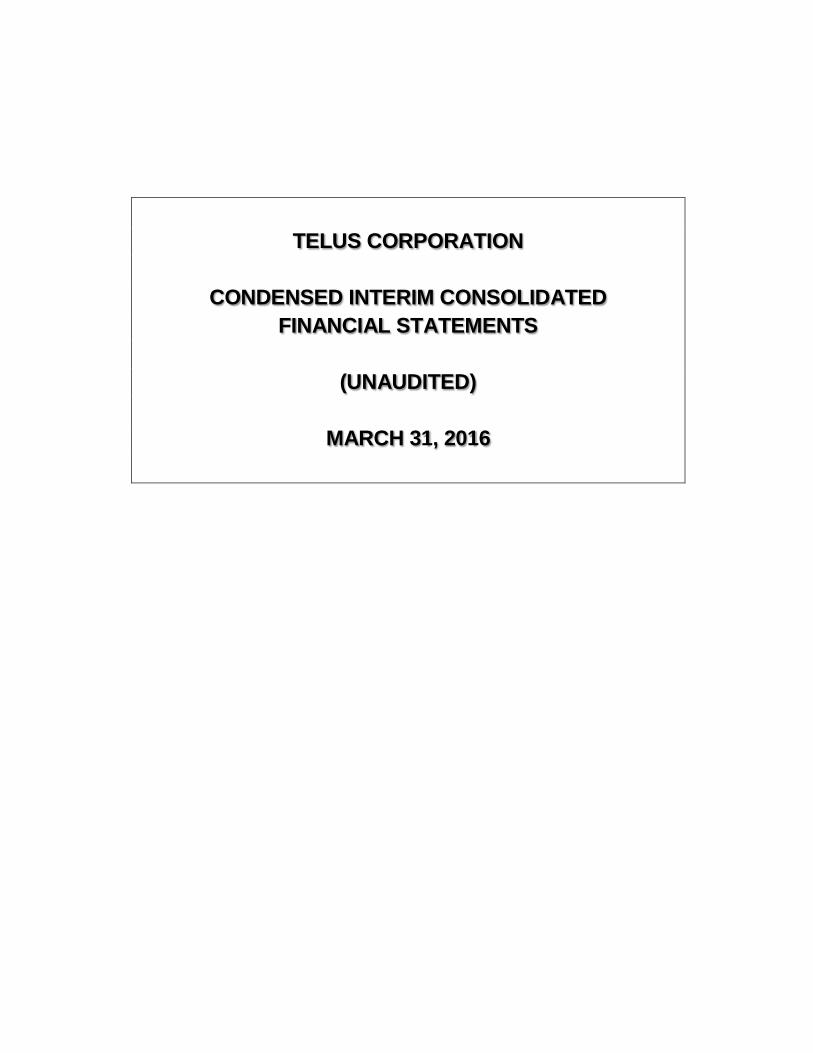
condensed interim consolidated statements of income and other comprehensive income (unaudited)
2 | March 31, 2016
Three months Periods ended March 31 (millions except per share amounts) Note 2016 2015 OPERATING REVENUES Service $ 2,924 $ 2,829 Equipment 172 182 Revenues arising from contracts with customers 3,096 3,011 Other operating income 6 12 17 3,108 3,028 OPERATING EXPENSES Goods and services purchased 1,300 1,284 Employee benefits expense 7 668 609 Depreciation 16 385 347 Amortization of intangible assets 17 115 109 2,468 2,349 OPERATING INCOME 640 679 Financing costs 8 123 117 INCOME BEFORE INCOME TAXES 517 562 Income taxes 9 139 147 NET INCOME 378 415
OTHER COMPREHENSIVE INCOME 10 Items that may subsequently be reclassified to income Change in unrealized fair value of derivatives designated as cash flow hedges (10) (4) Foreign currency translation adjustment arising from translating financial statements
of foreign operations (4) 10 Change in unrealized fair value of available-for-sale financial assets — (3) (14) 3 Item never subsequently reclassified to income Employee defined benefit plan re-measurements (77) 237 (91) 240 COMPREHENSIVE INCOME $ 287 $ 655 NET INCOME PER COMMON SHARE 11 Basic $ 0.64 $ 0.68 Diluted $ 0.64 $ 0.68 TOTAL WEIGHTED AVERAGE COMMON SHARES OUTSTANDING Basic 593 608 Diluted 594 610 The accompanying notes are an integral part of these condensed interim consolidated financial statements.
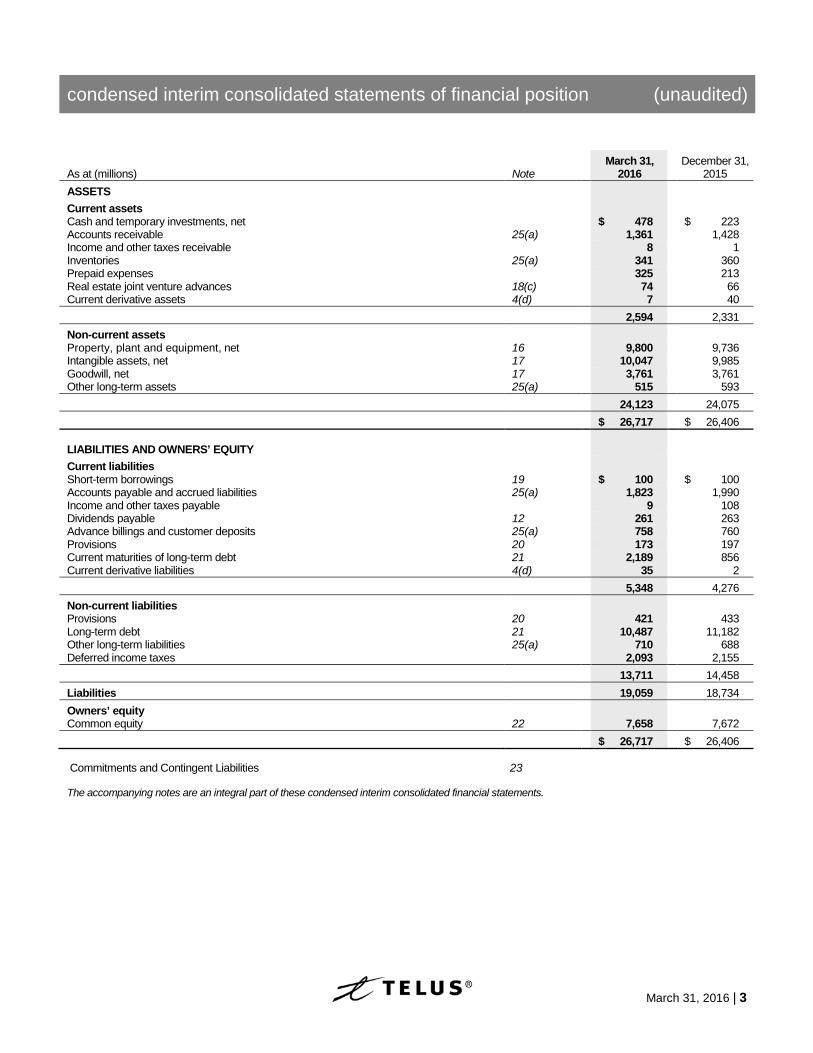
condensed interim consolidated statements of financial position (unaudited)
March 31, 2016 | 3
As at (millions) Note March 31,
2016 December 31,
2015 ASSETS Current assets Cash and temporary investments, net $ 478 $ 223 Accounts receivable 25(a) 1,361 1,428 Income and other taxes receivable 8 1 Inventories 25(a) 341 360 Prepaid expenses 325 213 Real estate joint venture advances 18(c) 74 66 Current derivative assets 4(d) 7 40 2,594 2,331 Non-current assets Property, plant and equipment, net 16 9,800 9,736 Intangible assets, net 17 10,047 9,985 Goodwill, net 17 3,761 3,761 Other long-term assets 25(a) 515 593 24,123 24,075 $ 26,717 $ 26,406 LIABILITIES AND OWNERS’ EQUITY Current liabilities Short-term borrowings 19 $ 100 $ 100 Accounts payable and accrued liabilities 25(a) 1,823 1,990 Income and other taxes payable 9 108 Dividends payable 12 261 263 Advance billings and customer deposits 25(a) 758 760 Provisions 20 173 197 Current maturities of long-term debt 21 2,189 856 Current derivative liabilities 4(d) 35 2 5,348 4,276 Non-current liabilities Provisions 20 421 433 Long-term debt 21 10,487 11,182 Other long-term liabilities 25(a) 710 688 Deferred income taxes 2,093 2,155 13,711 14,458 Liabilities 19,059 18,734 Owners’ equity Common equity 22 7,658 7,672 $ 26,717 $ 26,406 Commitments and Contingent Liabilities 23 The accompanying notes are an integral part of these condensed interim consolidated financial statements.
condensed interim consolidated statements of changes in owners’ equity (unaudited)
4 | March 31, 2016
Common equity Equity contributed
Accumulated other
comprehensive income
Common Shares
(Note 22)
(millions) Note Number of
shares Share capital
Contributed surplus
Retained earnings Total
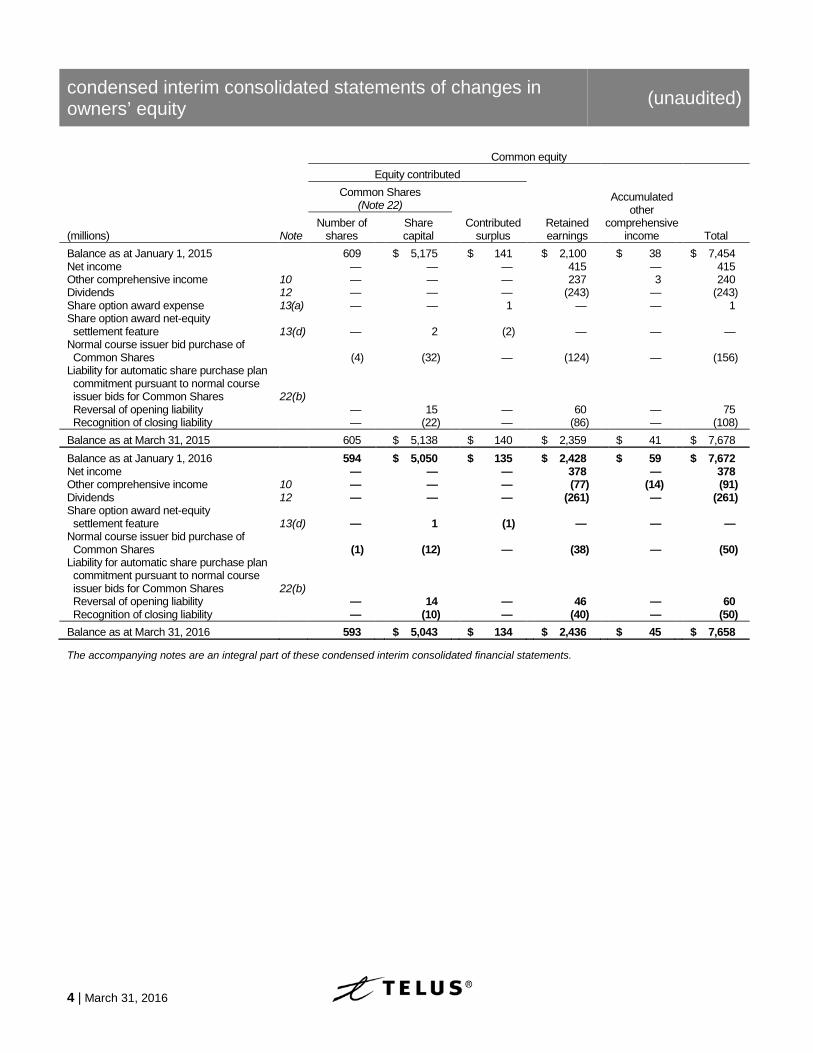
Balance as at January 1, 2015 609 $ 5,175 $ 141 $ 2,100 $ 38 $ 7,454 Net income — — — 415 — 415 Other comprehensive income 10 — — — 237 3 240 Dividends 12 — — — (243) — (243) Share option award expense 13(a) — — 1 — — 1 Share option award net-equity settlement feature 13(d) —
2
(2)
—
—
—
Normal course issuer bid purchase of Common Shares (4)
(32)
—
(124)
—
(156)
Liability for automatic share purchase plan commitment pursuant to normal course issuer bids for Common Shares 22(b)
Reversal of opening liability — 15 — 60 — 75 Recognition of closing liability — (22) — (86) — (108) Balance as at March 31, 2015 605 $ 5,138 $ 140 $ 2,359 $ 41 $ 7,678 Balance as at January 1, 2016 594 $ 5,050 $ 135 $ 2,428 $ 59 $ 7,672 Net income — — — 378 — 378 Other comprehensive income 10 — — — (77) (14) (91) Dividends 12 — — — (261) — (261) Share option award net-equity settlement feature 13(d) —
1
(1)
—
—
—
Normal course issuer bid purchase of Common Shares (1)
(12)
—
(38)
—
(50)
Liability for automatic share purchase plan commitment pursuant to normal course issuer bids for Common Shares 22(b)
Reversal of opening liability — 14 — 46 — 60 Recognition of closing liability — (10) — (40) — (50) Balance as at March 31, 2016 593 $ 5,043 $ 134 $ 2,436 $ 45 $ 7,658 The accompanying notes are an integral part of these condensed interim consolidated financial statements.
condensed interim consolidated statements of cash flows (unaudited)
March 31, 2016 | 5
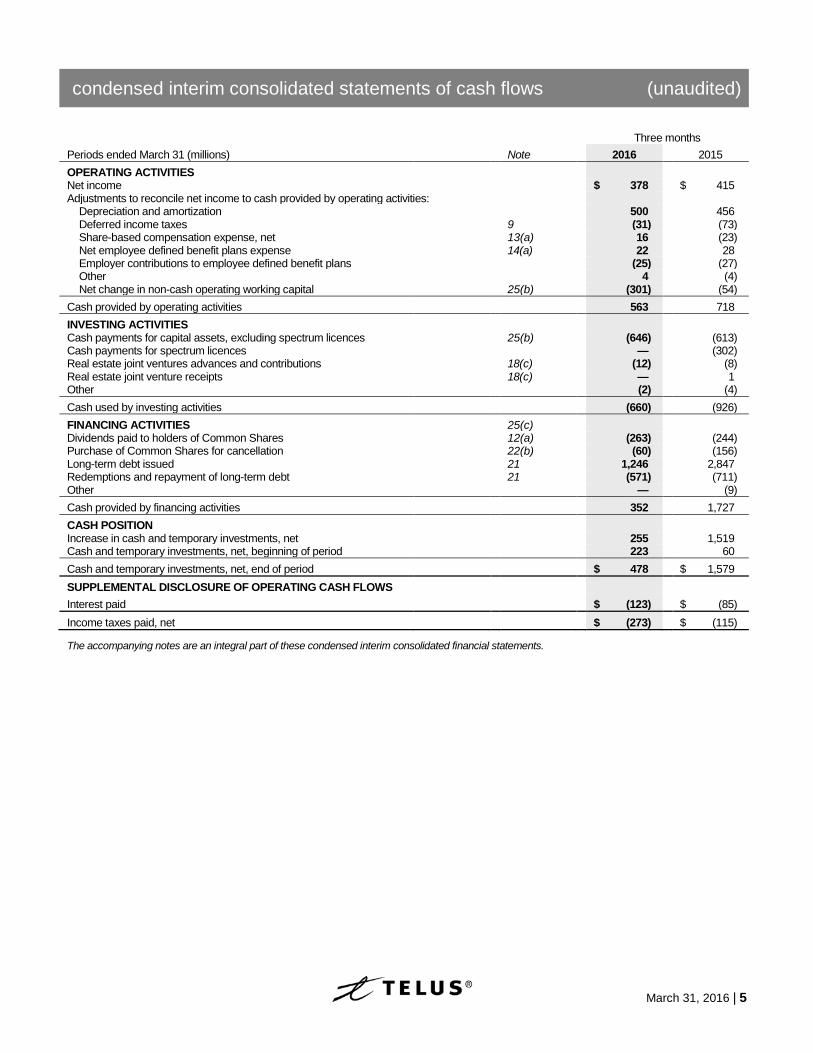
Three months Periods ended March 31 (millions) Note 2016 2015 OPERATING ACTIVITIES Net income $ 378 $ 415 Adjustments to reconcile net income to cash provided by operating activities: Depreciation and amortization 500 456 Deferred income taxes 9 (31) (73) Share-based compensation expense, net 13(a) 16 (23) Net employee defined benefit plans expense 14(a) 22 28 Employer contributions to employee defined benefit plans (25) (27) Other 4 (4)
Net change in non-cash operating working capital 25(b) (301) (54) Cash provided by operating activities 563 718 INVESTING ACTIVITIES Cash payments for capital assets, excluding spectrum licences 25(b) (646) (613) Cash payments for spectrum licences — (302) Real estate joint ventures advances and contributions 18(c) (12) (8) Real estate joint venture receipts 18(c) — 1 Other (2) (4) Cash used by investing activities (660) (926) FINANCING ACTIVITIES 25(c) Dividends paid to holders of Common Shares 12(a) (263) (244) Purchase of Common Shares for cancellation 22(b) (60) (156) Long-term debt issued 21 1,246 2,847 Redemptions and repayment of long-term debt 21 (571) (711) Other — (9) Cash provided by financing activities 352 1,727 CASH POSITION Increase in cash and temporary investments, net 255 1,519 Cash and temporary investments, net, beginning of period 223 60 Cash and temporary investments, net, end of period $ 478 $ 1,579 SUPPLEMENTAL DISCLOSURE OF OPERATING CASH FLOWS Interest paid $ (123) $ (85) Income taxes paid, net $ (273) $ (115) The accompanying notes are an integral part of these condensed interim consolidated financial statements.
notes to condensed interim consolidated financial statements (unaudited)
6 | March 31, 2016
MARCH 31, 2016
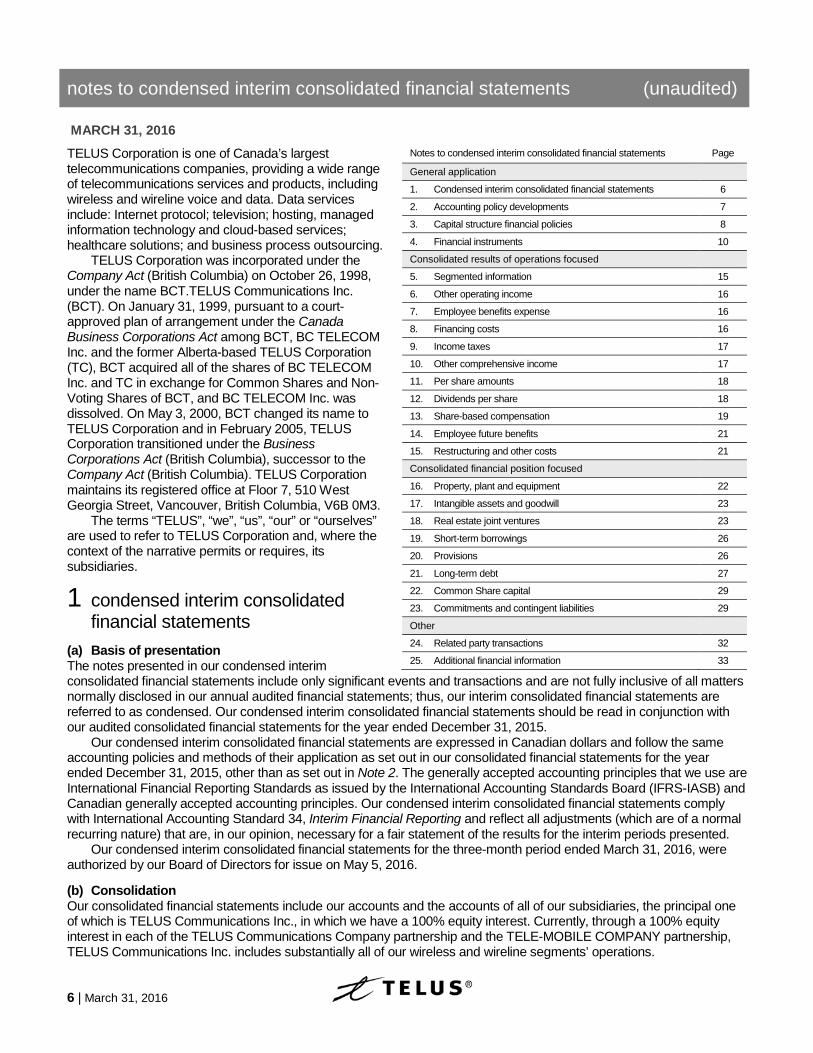
TELUS Corporation is one of Canada’s largest telecommunications companies, providing a wide range of telecommunications services and products, including wireless and wireline voice and data. Data services include: Internet protocol; television; hosting, managed information technology and cloud-based services; healthcare solutions; and business process outsourcing.
TELUS Corporation was incorporated under the Company Act (British Columbia) on October 26, 1998, under the name BCT.TELUS Communications Inc. (BCT). On January 31, 1999, pursuant to a court-approved plan of arrangement under the Canada Business Corporations Act among BCT, BC TELECOM Inc. and the former Alberta-based TELUS Corporation (TC), BCT acquired all of the shares of BC TELECOM Inc. and TC in exchange for Common Shares and Non-Voting Shares of BCT, and BC TELECOM Inc. was dissolved. On May 3, 2000, BCT changed its name to TELUS Corporation and in February 2005, TELUS Corporation transitioned under the Business Corporations Act (British Columbia), successor to the Company Act (British Columbia). TELUS Corporation maintains its registered office at Floor 7, 510 West Georgia Street, Vancouver, British Columbia, V6B 0M3.
The terms “TELUS”, “we”, “us”, “our” or “ourselves” are used to refer to TELUS Corporation and, where the context of the narrative permits or requires, its subsidiaries.
1 0Bcondensed interim consolidated financial statements
(a) Basis of presentation The notes presented in our condensed interim consolidated financial statements include only significant events and transactions and are not fully inclusive of all matters normally disclosed in our annual audited financial statements; thus, our interim consolidated financial statements are referred to as condensed. Our condensed interim consolidated financial statements should be read in conjunction with our audited consolidated financial statements for the year ended December 31, 2015.
Our condensed interim consolidated financial statements are expressed in Canadian dollars and follow the same accounting policies and methods of their application as set out in our consolidated financial statements for the year ended December 31, 2015, other than as set out in Note 2. The generally accepted accounting principles that we use are International Financial Reporting Standards as issued by the International Accounting Standards Board (IFRS-IASB) and Canadian generally accepted accounting principles. Our condensed interim consolidated financial statements comply with International Accounting Standard 34, Interim Financial Reporting and reflect all adjustments (which are of a normal recurring nature) that are, in our opinion, necessary for a fair statement of the results for the interim periods presented.
Our condensed interim consolidated financial statements for the three-month period ended March 31, 2016, were authorized by our Board of Directors for issue on May 5, 2016.
(b) Consolidation Our consolidated financial statements include our accounts and the accounts of all of our subsidiaries, the principal one of which is TELUS Communications Inc., in which we have a 100% equity interest. Currently, through a 100% equity interest in each of the TELUS Communications Company partnership and the TELE-MOBILE COMPANY partnership, TELUS Communications Inc. includes substantially all of our wireless and wireline segments’ operations.
Notes to condensed interim consolidated financial statements Page
General application
1. Condensed interim consolidated financial statements 6
2. Accounting policy developments 7
3. Capital structure financial policies 8
4. Financial instruments 10
Consolidated results of operations focused
5. Segmented information 15
6. Other operating income 16
7. Employee benefits expense 16
8. Financing costs 16
9. Income taxes 17
10. Other comprehensive income 17
11. Per share amounts 18
12. Dividends per share 18
13. Share-based compensation 19
14. Employee future benefits 21
15. Restructuring and other costs 21
Consolidated financial position focused
16. Property, plant and equipment 22
17. Intangible assets and goodwill 23
18. Real estate joint ventures 23
19. Short-term borrowings 26
20. Provisions 26
21. Long-term debt 27
22. Common Share capital 29
23. Commitments and contingent liabilities 29
Other
24. Related party transactions 32
25. Additional financial information 33
notes to condensed interim consolidated financial statements (unaudited)
March 31, 2016 | 7
Our financing arrangements and those of our subsidiaries do not impose restrictions on inter-corporate dividends. On a continuing basis, we review our corporate organization and effect changes as appropriate so as to enhance the
value of TELUS Corporation. This process can, and does, affect which of our subsidiaries are considered principal subsidiaries at any particular point in time.
Subsequent to March 31, 2016, we entered into an agreement which will result in a change in ownership interests of a subsidiary, which encompasses our TELUS International operations, due to it issuing shares to Baring Private Equity Asia. We will continue to control and consolidate the subsidiary and the shares to be issued will be accounted for as a 35% non-controlling interest. In connection with the transaction, we have also arranged an incremental $425 million in bank financing in the subsidiary company secured by assets of the TELUS International subsidiary, which expires in 2021 and is non-recourse to TELUS Corporation.
2 1Baccounting policy developments
(a) Initial application of standards, interpretations and amendments to standards and interpretations in the reporting period
In January 2016, the International Accounting Standards Board released Amendments to IAS 7, Statement of Cash Flows as a part of their Disclosure Initiative. The amendments are required to be applied for years beginning on or after January 1, 2017, however we have currently applied them, as set out in Note 25(c), and such application had no effect on our financial performance or disclosure.
Annual Improvements to IFRSs 2012-2014 Cycle are required to be applied for years beginning on or after January 1, 2016, and such application had no effect on our financial performance or disclosure.
(b) Standards, interpretations and amendments to standards not yet effective and not yet applied
• IFRS 9, Financial Instruments, is required to be applied for years beginning on or after January 1, 2018. The new standard includes a model for classification and measurement, a single forward-looking “expected loss” impairment model and a reformed approach to hedge accounting. Based upon current facts and circumstances, we do not expect to be materially affected by the application of the standard and we are currently determining which date we will select for initial compliance if earlier than the required compliance date.
• IFRS 15, Revenue from Contracts with Customers, is required to be applied for years beginning on or after January 1, 2018, such date reflecting the one-year deferral approved by the International Accounting Standards Board on July 22, 2015. The International Accounting Standards Board and the Financial Accounting Standards Board of the United States worked on this joint project to clarify the principles for the recognition of revenue. The new standard was released in May 2014 and supersedes existing standards and interpretations including IAS 18, Revenue. In April 2016, the International Accounting Standards Board issued Clarifications to IFRS 15, Revenue from Contracts with Customers, clarifying application of some of the more complex aspects of the standard. We are currently assessing the impacts and transition provisions of the new standard and its amendments.
The effects of the new standard and the materiality of those effects will vary by industry and entity. Like many other telecommunications companies, we currently expect to be materially affected by its application, primarily in respect of the timing of revenue recognition, the classification of revenue, the capitalization of costs of obtaining a contract with a customer and possibly the capitalization of the costs of contract fulfilment (as defined by the new standard). The timing of revenue recognition and the classification of our revenues as either service revenues or equipment revenues will be affected, since the allocation of consideration in multiple element arrangements (solutions for our customers that may involve deliveries of multiple services and products that occur at different points in time and/or over different periods of time) will no longer be affected by the current limitation cap methodology.
The effects of the timing of revenue recognition and the classification of revenue are expected to be most pronounced in our wireless segment. Although the measurement of the total revenue recognized over the life of a contract will be largely unaffected by the new standard, the prohibition of the use of the limitation cap methodology will accelerate the recognition of total contract revenue, relative to both the associated cash inflows from customers and our current practice (using the limitation cap methodology). The acceleration of the recognition of contract revenue relative to the associated cash inflows will also result in the recognition of an amount reflecting the resulting difference as an asset. Although the underlying transaction economics would not differ, during periods of sustained growth in the number of wireless subscriber connection additions, assuming comparable contract-lifetime per unit cash inflows, revenues would appear to be greater than under current practice (using the limitation cap
notes to condensed interim consolidated financial statements (unaudited)
8 | March 31, 2016
methodology). Wireline segment results arising from transactions that include the initial provision of subsidized hardware or promotional pricing plans will be similarly affected.
Similarly, the measurement of the total costs of contract acquisition and contract fulfilment over the life of a contract will be unaffected by the new standard. The new standard will result in our wireless and wireline segments’ costs of contract acquisition and contract fulfilment, to the extent that they are material, being capitalized and subsequently recognized as an expense over the life of a contract on a rational, systematic basis consistent with the pattern of the transfer of goods or services to which the asset relates. Although the underlying transaction economics would not differ, during periods of sustained growth in the number of customer connection additions, assuming comparable per unit costs of contract acquisition and contract fulfilment, absolute profitability measures would appear to be greater than under the current practice of immediately expensing such costs.
Our operations and associated systems are complex and our accounting for millions of multi-year contracts with our customers will be affected. Significantly, in order to effect the associated accounting, incremental compilation of historical data will be necessary for the millions of already existing multi-year contracts with our customers that are expected to be in-scope for purposes of transitioning to the new standard. Our current estimate of the time and effort necessary to develop and implement the accounting policies, estimates, judgments and processes (including incremental requirements of our information technology systems) we will need to have in place in order to comply with the new standard extends into mid-2017. As a result, at this time, it is not possible to make reasonable quantitative estimates of the effects of the new standard.
• In January 2016 the International Accounting Standards Board released IFRS 16, Leases, which is required to be applied for years beginning on or after January 1, 2019, and which supersedes IAS 17, Leases; earlier application is allowed, but not before the application of IFRS 15, Revenue from Contracts with Customers. The International Accounting Standards Board and the Financial Accounting Standards Board of the United States worked together to improve the accounting for leases, generally by eliminating lessees’ classification of leases as either operating leases or finance leases and, for IFRS-IASB, introducing a single lessee accounting model.
The most significant effect of the new standard will be the lessee’s recognition of the initial present value of unavoidable future lease payments as lease assets and lease liabilities on the statement of financial position, including for most leases which would be currently accounted for as operating leases. Leases with durations of 12 months or less and leases for low-value assets are both exempted.
The measurement of the total lease expense over the term of a lease will be unaffected by the new standard. However, the new standard will result in the timing of lease expense recognition being accelerated for leases which would be currently accounted for as operating leases; the International Accounting Standards Board expects that this effect may be muted by a lessee having a portfolio of leases with varying maturities and lengths of term. The presentation on the statement of income and other comprehensive income required by the new standard will result in most lease expenses being presented as amortization of lease assets and financing costs arising from lease liabilities rather than as being a part of goods and services purchased.
Relative to the results of applying the current standard, although the actual cash flows will be unaffected, the lessee’s statement of cash flows will reflect increased operating activity cash flows equally offset by decreased financing activity cash flows due to the payment of the “principal” component of leases, which would be currently accounted for as operating leases, being presented as a cash flow use within financing activities under the new standard.
We are currently assessing the impacts and transition provisions of the new standard, but we expect that our consolidated statement of financial position will be materially affected, as will be debt-related and operation-related financial metrics. At this time it is not possible to make reasonable quantitative estimates of the effects of the new standard.
3 2Bcapital structure financial policies Our objective when managing capital is to maintain a flexible capital structure that optimizes the cost and availability of capital at acceptable risk.
In the management of capital and in its definition, we include common equity (excluding accumulated other comprehensive income), long-term debt (including long-term credit facilities, commercial paper backstopped by long-term credit facilities and any hedging assets or liabilities associated with long-term debt items, net of amounts recognized in accumulated other comprehensive income), cash and temporary investments, and short-term borrowings arising from securitized trade receivables.
notes to condensed interim consolidated financial statements (unaudited)
March 31, 2016 | 9
We manage our capital structure and make adjustments to it in light of changes in economic conditions and the risk characteristics of our telecommunications infrastructure. In order to maintain or adjust our capital structure, we may adjust the amount of dividends paid to holders of Common Shares, purchase Common Shares for cancellation pursuant to normal course issuer bids, issue new shares, issue new debt, issue new debt to replace existing debt with different characteristics and/or increase or decrease the amount of trade receivables sold to an arm’s-length securitization trust.
We monitor capital utilizing a number of measures, including: net debt to earnings before interest, income taxes, depreciation and amortization (EBITDA∗) – excluding restructuring and other costs; and dividend payout ratios.
Net debt to EBITDA – excluding restructuring and other costs is calculated as net debt at the end of the period divided by 12-month trailing EBITDA – excluding restructuring and other costs. This measure, historically, is substantially similar to the leverage ratio covenant in our credit facilities. Net debt, EBITDA – excluding restructuring and other costs and adjusted net earnings are measures that do not have any standardized meanings prescribed by IFRS-IASB and are therefore unlikely to be comparable to similar measures presented by other companies. The calculation of these measures is as set out in the following table. Net debt is one component of a ratio used to determine compliance with debt covenants.
The dividend payout ratio presented is a historical measure calculated as the sum of the last four quarterly dividends declared per Common Share, as recorded in the financial statements, divided by the sum of basic earnings per share for the most recent four quarters for interim reporting periods (divided by annual basic earnings per share if the reported amount is in respect of a fiscal year). The dividend payout ratio of adjusted net earnings presented, also a historical measure, differs in that it excludes long-term debt prepayment premium and income tax-related adjustments.
During 2016, our financial objectives, which are reviewed annually and which were unchanged from 2015 other than for a revision to our debt ratio long-term objective, included maintaining the financial objectives set out in the following table. We believe that our financial objectives are supportive of our long-term strategy. As at, or 12-month periods ended, March 31 ($ in millions) Objective 2016 2015 Components of debt and coverage ratios Net debt 1 $ 12,374 $ 10,011 EBITDA – excluding restructuring and other costs 2 $ 4,524 $ 4,358 Net interest cost 3 $ 494 $ 462 Debt ratio Net debt to EBITDA – excluding restructuring and other costs 2.00 – 2.50 4 2.74 2.30 Coverage ratios Earnings coverage 5 4.6 5.2 EBITDA – excluding restructuring and other costs interest coverage 6 9.2 9.4 Other measures Dividend payout ratio of adjusted net earnings 7 76% 65% Dividend payout ratio 65%–75% 8 76% 65%
1 Net debt is calculated as follows:
As at March 31 Note 2016 2015 Long-term debt 21 $ 12,676 $ 11,439 Debt issuance costs netted against long-term debt 50 51 Derivative liabilities, net 26 — Cash and temporary investments, net (478) (1,579) Short-term borrowings 19 100 100 Net debt $ 12,374 $ 10,011
2 EBITDA – excluding restructuring and other costs is calculated as follows:
EBITDA (Note 5)
Restructuring and other
costs (Note 15)
EBITDA – excluding
restructuring and other costs
Add Three-month period ended March 31, 2016 $ 1,140 $ 48 $ 1,188 Year ended December 31, 2015 4,262 226 4,488 Deduct Three-month period ended March 31, 2015 (1,135) (17) (1,152) EBITDA – excluding restructuring and other costs $ 4,267 $ 257 $ 4,524
∗ EBITDA does not have any standardized meaning prescribed by IFRS-IASB and is therefore unlikely to be comparable to similar measures presented by other issuers; we define EBITDA as operating revenues less goods and services purchased and employee benefits expense. We have issued guidance on, and report, EBITDA because it is a key measure that management uses to evaluate the performance of our business, and it is also utilized in measuring compliance with certain debt covenants.
notes to condensed interim consolidated financial statements (unaudited)
10 | March 31, 2016
3 Net interest cost is defined as financing costs, excluding employee defined benefit plans net interest and recoveries on long-term debt prepayment premium and repayment of debt, calculated on a 12-month trailing basis (expenses recorded for long-term debt prepayment premium, if any, are included in net interest cost).
4 Our long-term objective range for this ratio is 2.00 – 2.50 times. The ratio as at March 31, 2016, is outside the long-term objective range. In the short term, we may permit this ratio to go outside the objective range (for long-term investment opportunities), but will endeavor to return this ratio to within the objective range in the medium term, as we believe that this range is supportive of our long-term strategy. We are well in compliance with our credit facilities leverage ratio covenant which states that we may not permit our net debt to operating cash flow ratio to exceed 4.00:1.00 (see Note 21(d)); the calculation of the debt ratio is substantially similar to the calculation of the leverage ratio covenant in our credit facilities.
5 Earnings coverage is defined as net income before borrowing costs and income tax expense, divided by borrowing costs (interest on long-term debt; interest on short-term borrowings and other; long-term debt prepayment premium); and adding back capitalized interest.
6 EBITDA – excluding restructuring and other costs interest coverage is defined as EBITDA – excluding restructuring and other costs divided by net interest cost. This measure is substantially similar to the coverage ratio covenant in our credit facilities.
7 Adjusted net earnings attributable to Common Shares is calculated as follows:
12-month periods ended March 31 2016 2015 Net income $ 1,345 $ 1,463 Long-term debt prepayment premium, after income tax — 10 Income tax-related adjustments 2 (6) Adjusted net earnings attributable to Common Shares $ 1,347 $ 1,467
8 Our target guideline for the dividend payout ratio is 65%–75% of earnings on a prospective basis. The ratio for the 12-month period ended March 31, 2016, was not within the objective range due to increased restructuring and other costs largely from a reduction of full-time equivalent positions announce in November 2015. Illustrating the effect of the increased restructuring and other costs, if such costs had been entirely excluded, the dividend payout ratio of adjusted net earnings would have been 67% (2015 – 62%).
Net debt to EBITDA – excluding restructuring and other costs was 2.74 times at March 31, 2016, up from 2.30 times one year earlier. The increase in net debt, primarily due to the purchase of spectrum licences, was partly offset by growth in EBITDA – excluding restructuring and other costs. The earnings coverage ratio for the twelve-month period ended March 31, 2016, was 4.6 times, down from 5.2 times one year earlier. Higher borrowing costs reduced the ratio by 0.5 and a decline in income before borrowing costs and income taxes reduced the ratio by 0.1. The EBITDA – excluding restructuring and other costs interest coverage ratio for the twelve-month period ended March 31, 2016, was 9.2 times, down from 9.4 times one year earlier. Growth in EBITDA – excluding restructuring and other costs increased the ratio by 0.4, while an increase in net interest costs reduced the ratio by 0.6.
4 3Bfinancial instruments (a) Credit risk Excluding credit risk, if any, arising from currency swaps settled on a gross basis, the best representation of our maximum exposure (excluding income tax effects) to credit risk, which is a worst-case scenario and does not reflect results we expect, is as set out in the following table:
As at (millions) March 31,
2016 December 31,
2015 Cash and temporary investments, net $ 478 $ 223 Accounts receivable 1,361 1,428 Derivative assets 12 40 $ 1,851 $ 1,691
Cash and temporary investments Credit risk associated with cash and temporary investments is managed by ensuring that these financial assets are placed with: governments; major financial institutions that have been accorded strong investment grade ratings by a primary rating agency; and/or other creditworthy counterparties. An ongoing review is performed to evaluate changes in the status of counterparties.
Accounts receivable Credit risk associated with accounts receivable is inherently managed by our large and diverse customer base, which includes substantially all consumer and business sectors in Canada. We follow a program of credit evaluations of customers and limit the amount of credit extended when deemed necessary.
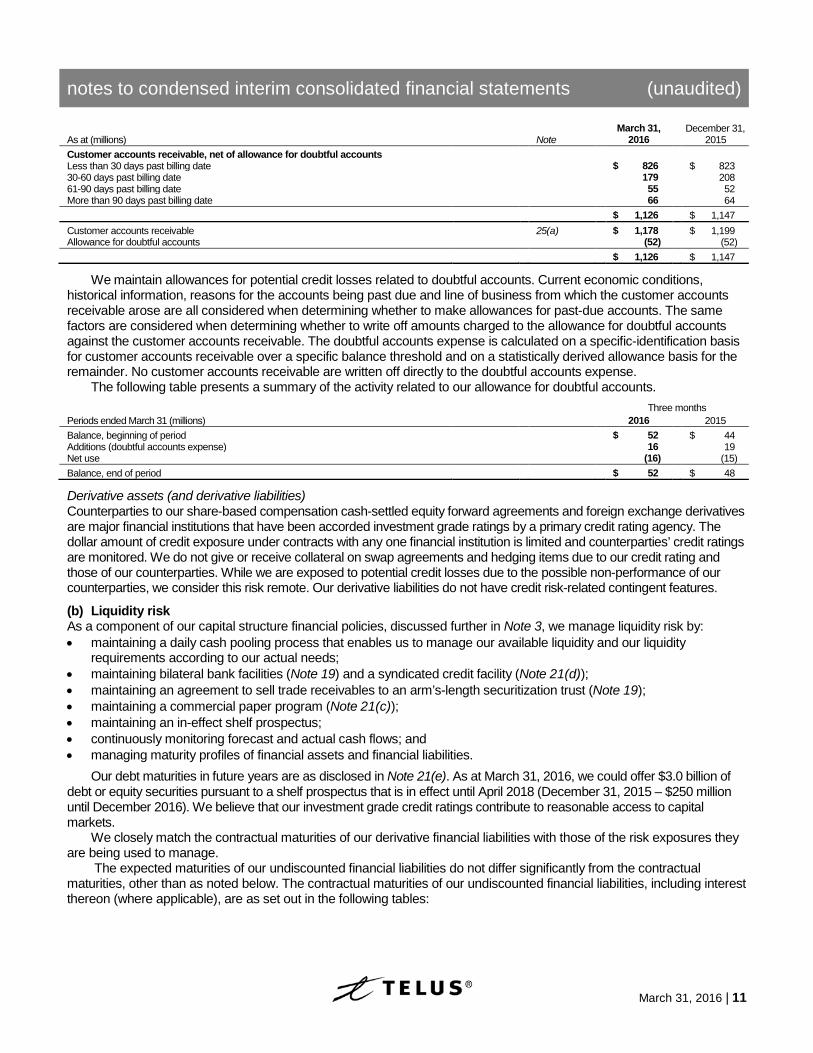
The following table presents an analysis of the age of customer accounts receivable for which an allowance has not been made as at the dates of the Condensed interim consolidated statements of financial position. As at March 31, 2016, the weighted average age of customer accounts receivable was 28 days (December 31, 2015 – 28 days) and the weighted average age of past-due customer accounts receivable was 64 days (December 31, 2015 – 62 days). Any late payment charges are levied, at an industry-based market or negotiated rate, on outstanding non-current customer account balances.
notes to condensed interim consolidated financial statements (unaudited)
March 31, 2016 | 11
As at (millions) Note March 31,
2016 December 31,
2015 Customer accounts receivable, net of allowance for doubtful accounts Less than 30 days past billing date $ 826 $ 823 30-60 days past billing date 179 208 61-90 days past billing date 55 52 More than 90 days past billing date 66 64 $ 1,126 $ 1,147 Customer accounts receivable 25(a) $ 1,178 $ 1,199 Allowance for doubtful accounts (52) (52) $ 1,126 $ 1,147
We maintain allowances for potential credit losses related to doubtful accounts. Current economic conditions, historical information, reasons for the accounts being past due and line of business from which the customer accounts receivable arose are all considered when determining whether to make allowances for past-due accounts. The same factors are considered when determining whether to write off amounts charged to the allowance for doubtful accounts against the customer accounts receivable. The doubtful accounts expense is calculated on a specific-identification basis for customer accounts receivable over a specific balance threshold and on a statistically derived allowance basis for the remainder. No customer accounts receivable are written off directly to the doubtful accounts expense.
The following table presents a summary of the activity related to our allowance for doubtful accounts.
Three months Periods ended March 31 (millions) 2016 2015 Balance, beginning of period $ 52 $ 44 Additions (doubtful accounts expense) 16 19 Net use (16) (15) Balance, end of period $ 52 $ 48
Derivative assets (and derivative liabilities) Counterparties to our share-based compensation cash-settled equity forward agreements and foreign exchange derivatives are major financial institutions that have been accorded investment grade ratings by a primary credit rating agency. The dollar amount of credit exposure under contracts with any one financial institution is limited and counterparties’ credit ratings are monitored. We do not give or receive collateral on swap agreements and hedging items due to our credit rating and those of our counterparties. While we are exposed to potential credit losses due to the possible non-performance of our counterparties, we consider this risk remote. Our derivative liabilities do not have credit risk-related contingent features.
(b) Liquidity risk As a component of our capital structure financial policies, discussed further in Note 3, we manage liquidity risk by: • maintaining a daily cash pooling process that enables us to manage our available liquidity and our liquidity
requirements according to our actual needs; • maintaining bilateral bank facilities (Note 19) and a syndicated credit facility (Note 21(d)); • maintaining an agreement to sell trade receivables to an arm’s-length securitization trust (Note 19); • maintaining a commercial paper program (Note 21(c)); • maintaining an in-effect shelf prospectus; • continuously monitoring forecast and actual cash flows; and • managing maturity profiles of financial assets and financial liabilities.
Our debt maturities in future years are as disclosed in Note 21(e). As at March 31, 2016, we could offer $3.0 billion of debt or equity securities pursuant to a shelf prospectus that is in effect until April 2018 (December 31, 2015 – $250 million until December 2016). We believe that our investment grade credit ratings contribute to reasonable access to capital markets.
We closely match the contractual maturities of our derivative financial liabilities with those of the risk exposures they are being used to manage.
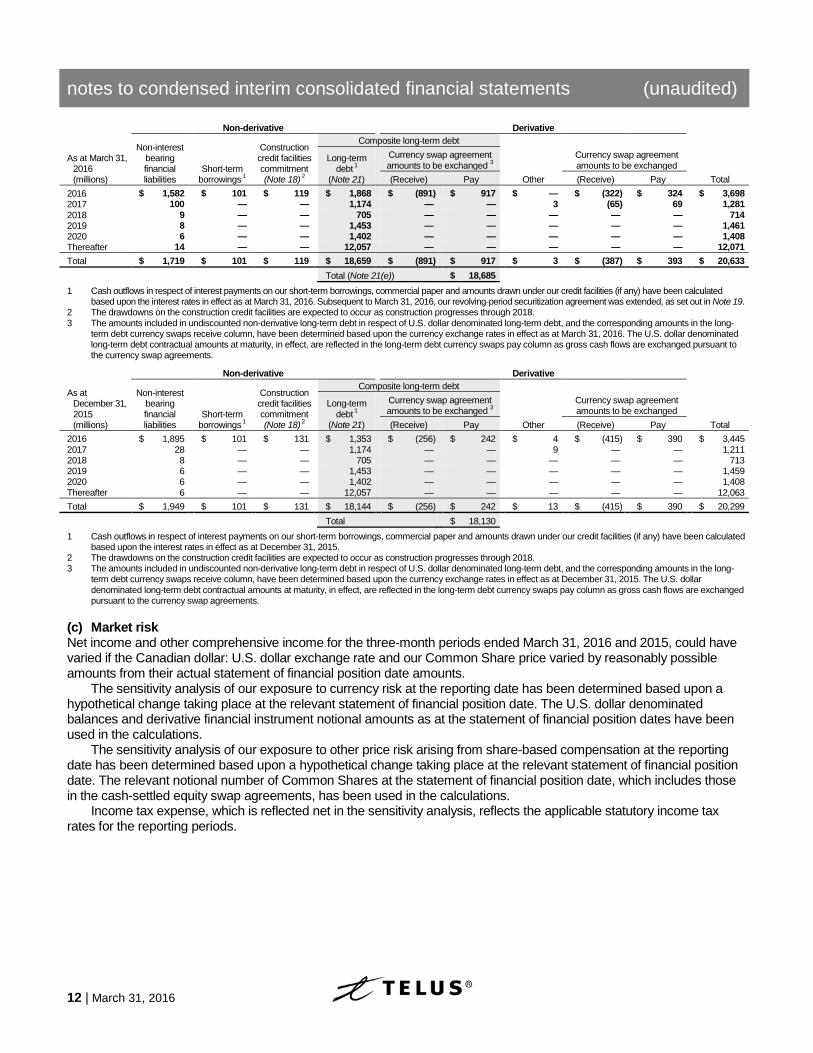
The expected maturities of our undiscounted financial liabilities do not differ significantly from the contractual maturities, other than as noted below. The contractual maturities of our undiscounted financial liabilities, including interest thereon (where applicable), are as set out in the following tables:
notes to condensed interim consolidated financial statements (unaudited)
12 | March 31, 2016
Non-derivative Derivative
As at March 31, 2016 (millions)
Non-interest bearing financial liabilities
Short-term borrowings 1
Construction credit facilities commitment (Note 18) 2
Composite long-term debt
Long-term
debt 1 (Note 21)
Currency swap agreement amounts to be exchanged 3
Currency swap agreement amounts to be exchanged
(Receive) Pay Other (Receive) Pay Total 2016 $ 1,582 $ 101 $ 119 $ 1,868 $ (891) $ 917 $ — $ (322) $ 324 $ 3,698 2017 100 — — 1,174 — — 3 (65) 69 1,281 2018 9 — — 705 — — — — — 714 2019 8 — — 1,453 — — — — — 1,461 2020 6 — — 1,402 — — — — — 1,408 Thereafter 14 — — 12,057 — — — — — 12,071 Total $ 1,719 $ 101 $ 119 $ 18,659 $ (891) $ 917 $ 3 $ (387) $ 393 $ 20,633 Total (Note 21(e)) $ 18,685
1 Cash outflows in respect of interest payments on our short-term borrowings, commercial paper and amounts drawn under our credit facilities (if any) have been calculated based upon the interest rates in effect as at March 31, 2016. Subsequent to March 31, 2016, our revolving-period securitization agreement was extended, as set out in Note 19.
2 The drawdowns on the construction credit facilities are expected to occur as construction progresses through 2018. 3 The amounts included in undiscounted non-derivative long-term debt in respect of U.S. dollar denominated long-term debt, and the corresponding amounts in the long-
term debt currency swaps receive column, have been determined based upon the currency exchange rates in effect as at March 31, 2016. The U.S. dollar denominated long-term debt contractual amounts at maturity, in effect, are reflected in the long-term debt currency swaps pay column as gross cash flows are exchanged pursuant to the currency swap agreements.
Non-derivative Derivative
As at December 31, 2015 (millions)
Non-interest bearing financial liabilities
Short-term borrowings 1
Construction credit facilities commitment (Note 18) 2
Composite long-term debt
Long-term
debt 1 (Note 21)
Currency swap agreement amounts to be exchanged 3
Currency swap agreement amounts to be exchanged
(Receive) Pay Other (Receive) Pay Total 2016 $ 1,895 $ 101 $ 131 $ 1,353 $ (256) $ 242 $ 4 $ (415) $ 390 $ 3,445 2017 28 — — 1,174 — — 9 — — 1,211 2018 8 — — 705 — — — — — 713 2019 6 — — 1,453 — — — — — 1,459 2020 6 — — 1,402 — — — — — 1,408 Thereafter 6 — — 12,057 — — — — — 12,063 Total $ 1,949 $ 101 $ 131 $ 18,144 $ (256) $ 242 $ 13 $ (415) $ 390 $ 20,299 Total $ 18,130
1 Cash outflows in respect of interest payments on our short-term borrowings, commercial paper and amounts drawn under our credit facilities (if any) have been calculated based upon the interest rates in effect as at December 31, 2015.
2 The drawdowns on the construction credit facilities are expected to occur as construction progresses through 2018. 3 The amounts included in undiscounted non-derivative long-term debt in respect of U.S. dollar denominated long-term debt, and the corresponding amounts in the long-
term debt currency swaps receive column, have been determined based upon the currency exchange rates in effect as at December 31, 2015. The U.S. dollar denominated long-term debt contractual amounts at maturity, in effect, are reflected in the long-term debt currency swaps pay column as gross cash flows are exchanged pursuant to the currency swap agreements.
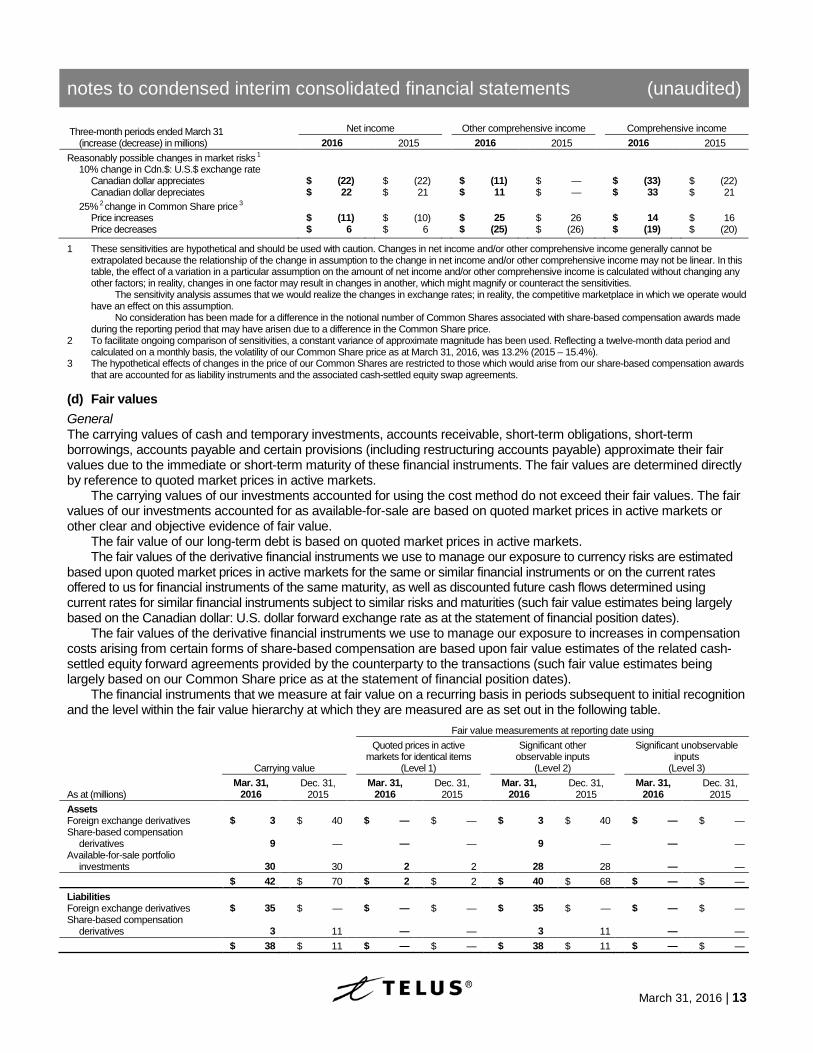
(c) Market risk Net income and other comprehensive income for the three-month periods ended March 31, 2016 and 2015, could have varied if the Canadian dollar: U.S. dollar exchange rate and our Common Share price varied by reasonably possible amounts from their actual statement of financial position date amounts.
The sensitivity analysis of our exposure to currency risk at the reporting date has been determined based upon a hypothetical change taking place at the relevant statement of financial position date. The U.S. dollar denominated balances and derivative financial instrument notional amounts as at the statement of financial position dates have been used in the calculations.
The sensitivity analysis of our exposure to other price risk arising from share-based compensation at the reporting date has been determined based upon a hypothetical change taking place at the relevant statement of financial position date. The relevant notional number of Common Shares at the statement of financial position date, which includes those in the cash-settled equity swap agreements, has been used in the calculations.
Income tax expense, which is reflected net in the sensitivity analysis, reflects the applicable statutory income tax rates for the reporting periods.
notes to condensed interim consolidated financial statements (unaudited)
March 31, 2016 | 13
Three-month periods ended March 31 (increase (decrease) in millions)
Net income Other comprehensive income Comprehensive income 2016 2015 2016 2015 2016 2015
Reasonably possible changes in market risks 1 10% change in Cdn.$: U.S.$ exchange rate Canadian dollar appreciates $ (22) $ (22) $ (11) $ — $ (33) $ (22) Canadian dollar depreciates $ 22 $ 21 $ 11 $ — $ 33 $ 21 25% 2 change in Common Share price 3 Price increases $ (11) $ (10) $ 25 $ 26 $ 14 $ 16 Price decreases $ 6 $ 6 $ (25) $ (26) $ (19) $ (20)
1 These sensitivities are hypothetical and should be used with caution. Changes in net income and/or other comprehensive income generally cannot be extrapolated because the relationship of the change in assumption to the change in net income and/or other comprehensive income may not be linear. In this table, the effect of a variation in a particular assumption on the amount of net income and/or other comprehensive income is calculated without changing any other factors; in reality, changes in one factor may result in changes in another, which might magnify or counteract the sensitivities.
The sensitivity analysis assumes that we would realize the changes in exchange rates; in reality, the competitive marketplace in which we operate would have an effect on this assumption.
No consideration has been made for a difference in the notional number of Common Shares associated with share-based compensation awards made during the reporting period that may have arisen due to a difference in the Common Share price.
2 To facilitate ongoing comparison of sensitivities, a constant variance of approximate magnitude has been used. Reflecting a twelve-month data period and calculated on a monthly basis, the volatility of our Common Share price as at March 31, 2016, was 13.2% (2015 – 15.4%).
3 The hypothetical effects of changes in the price of our Common Shares are restricted to those which would arise from our share-based compensation awards that are accounted for as liability instruments and the associated cash-settled equity swap agreements.
(d) Fair values
General The carrying values of cash and temporary investments, accounts receivable, short-term obligations, short-term borrowings, accounts payable and certain provisions (including restructuring accounts payable) approximate their fair values due to the immediate or short-term maturity of these financial instruments. The fair values are determined directly by reference to quoted market prices in active markets.
The carrying values of our investments accounted for using the cost method do not exceed their fair values. The fair values of our investments accounted for as available-for-sale are based on quoted market prices in active markets or other clear and objective evidence of fair value.
The fair value of our long-term debt is based on quoted market prices in active markets. The fair values of the derivative financial instruments we use to manage our exposure to currency risks are estimated
based upon quoted market prices in active markets for the same or similar financial instruments or on the current rates offered to us for financial instruments of the same maturity, as well as discounted future cash flows determined using current rates for similar financial instruments subject to similar risks and maturities (such fair value estimates being largely based on the Canadian dollar: U.S. dollar forward exchange rate as at the statement of financial position dates).
The fair values of the derivative financial instruments we use to manage our exposure to increases in compensation costs arising from certain forms of share-based compensation are based upon fair value estimates of the related cash-settled equity forward agreements provided by the counterparty to the transactions (such fair value estimates being largely based on our Common Share price as at the statement of financial position dates).
The financial instruments that we measure at fair value on a recurring basis in periods subsequent to initial recognition and the level within the fair value hierarchy at which they are measured are as set out in the following table.
Fair value measurements at reporting date using
Quoted prices in active
markets for identical items Significant other
observable inputs Significant unobservable
inputs Carrying value (Level 1) (Level 2) (Level 3)
As at (millions) Mar. 31,
2016 Dec. 31,
2015 Mar. 31,
2016 Dec. 31,
2015 Mar. 31,
2016 Dec. 31,
2015 Mar. 31,
2016 Dec. 31,
2015 Assets Foreign exchange derivatives $ 3 $ 40 $ — $ — $ 3 $ 40 $ — $ — Share-based compensation
derivatives 9 — — — 9 — — — Available-for-sale portfolio
investments 30 30 2 2 28 28 — — $ 42 $ 70 $ 2 $ 2 $ 40 $ 68 $ — $ — Liabilities Foreign exchange derivatives $ 35 $ — $ — $ — $ 35 $ — $ — $ — Share-based compensation
derivatives 3 11 — — 3 11 — — $ 38 $ 11 $ — $ — $ 38 $ 11 $ — $ —
notes to condensed interim consolidated financial statements (unaudited)
14 | March 31, 2016
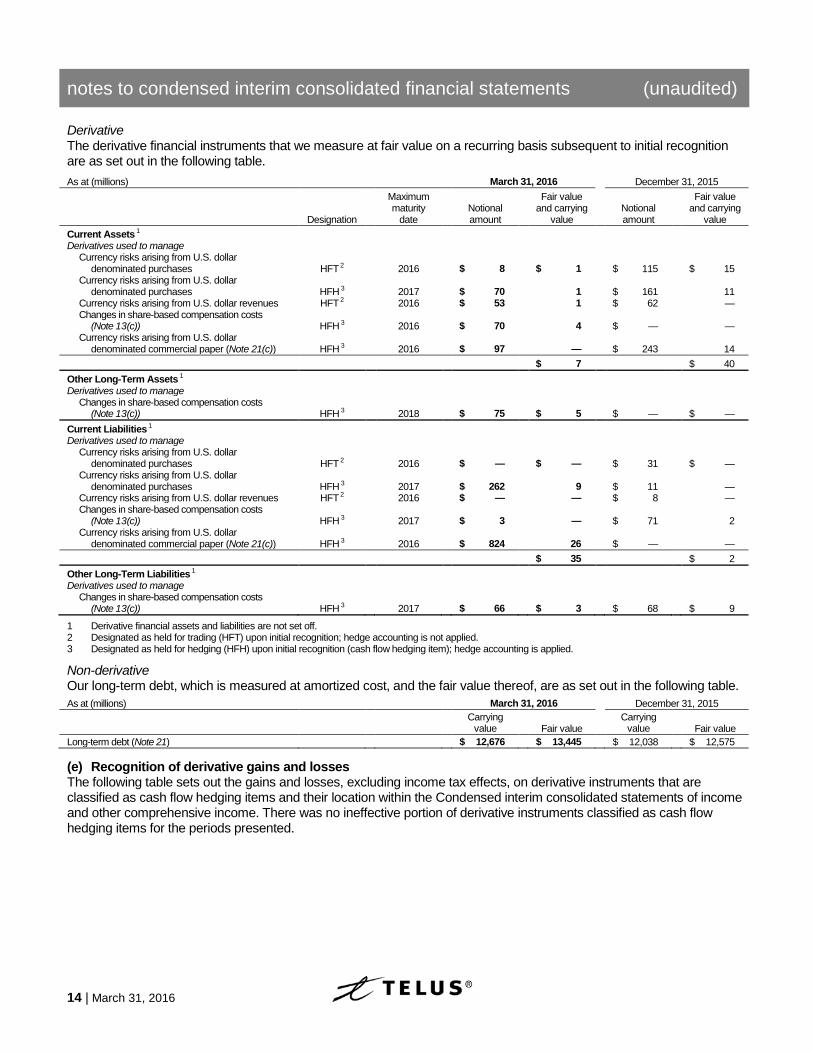
Derivative The derivative financial instruments that we measure at fair value on a recurring basis subsequent to initial recognition are as set out in the following table. As at (millions) March 31, 2016 December 31, 2015
Designation
Maximum maturity
date Notional amount
Fair value and carrying
value Notional amount
Fair value and carrying
value Current Assets 1 Derivatives used to manage Currency risks arising from U.S. dollar
denominated purchases HFT 2 2016 $ 8 $ 1 $ 115 $ 15 Currency risks arising from U.S. dollar
denominated purchases HFH 3 2017 $ 70 1 $ 161 11 Currency risks arising from U.S. dollar revenues HFT 2 2016 $ 53 1 $ 62 — Changes in share-based compensation costs
(Note 13(c)) HFH 3 2016 $ 70 4 $ — — Currency risks arising from U.S. dollar
denominated commercial paper (Note 21(c)) HFH 3 2016 $ 97 — $ 243 14 $ 7 $ 40 Other Long-Term Assets 1 Derivatives used to manage Changes in share-based compensation costs
(Note 13(c)) HFH 3 2018 $ 75 $ 5 $ — $ — Current Liabilities 1 Derivatives used to manage Currency risks arising from U.S. dollar
denominated purchases HFT 2 2016 $ — $ — $ 31 $ — Currency risks arising from U.S. dollar
denominated purchases HFH 3 2017 $ 262 9 $ 11 — Currency risks arising from U.S. dollar revenues HFT 2 2016 $ — — $ 8 — Changes in share-based compensation costs
(Note 13(c)) HFH 3 2017 $ 3 — $ 71 2 Currency risks arising from U.S. dollar
denominated commercial paper (Note 21(c)) HFH 3 2016 $ 824 26 $ — — $ 35 $ 2 Other Long-Term Liabilities 1 Derivatives used to manage Changes in share-based compensation costs
(Note 13(c)) HFH 3 2017 $ 66 $ 3 $ 68 $ 9
1 Derivative financial assets and liabilities are not set off. 2 Designated as held for trading (HFT) upon initial recognition; hedge accounting is not applied. 3 Designated as held for hedging (HFH) upon initial recognition (cash flow hedging item); hedge accounting is applied.
Non-derivative Our long-term debt, which is measured at amortized cost, and the fair value thereof, are as set out in the following table.
As at (millions) March 31, 2016 December 31, 2015
Carrying
value Fair value Carrying
value Fair value Long-term debt (Note 21) $ 12,676 $ 13,445 $ 12,038 $ 12,575
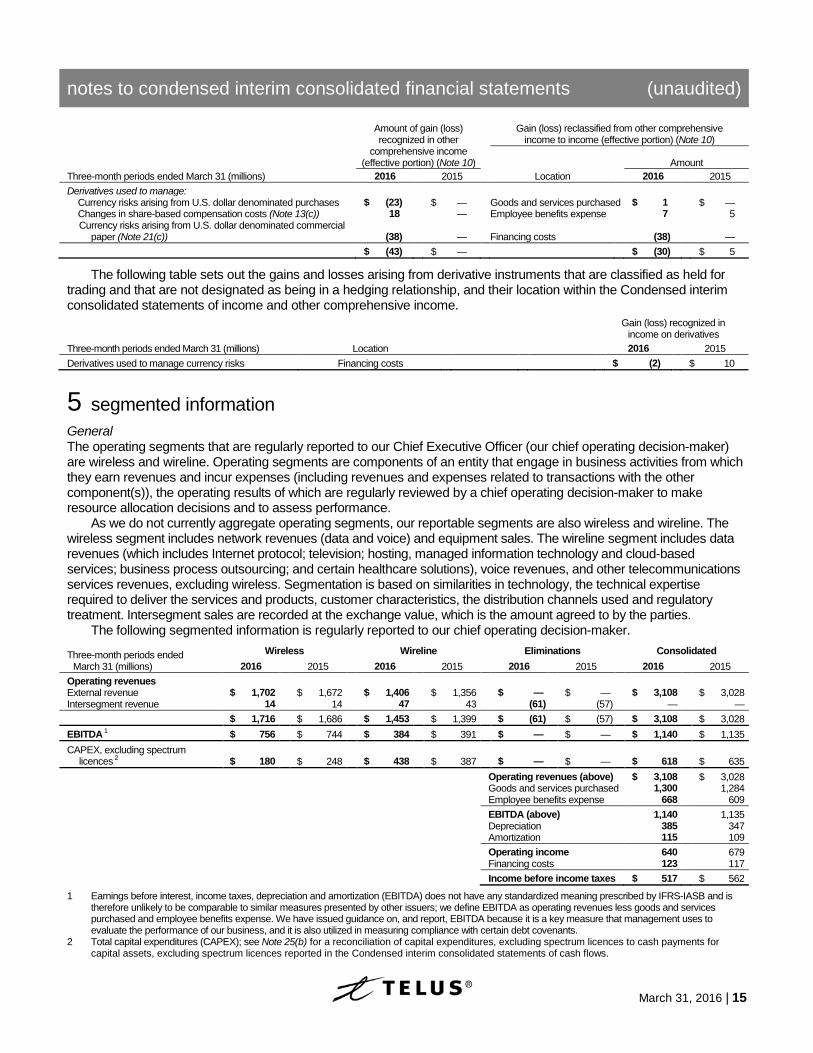
(e) Recognition of derivative gains and losses The following table sets out the gains and losses, excluding income tax effects, on derivative instruments that are classified as cash flow hedging items and their location within the Condensed interim consolidated statements of income and other comprehensive income. There was no ineffective portion of derivative instruments classified as cash flow hedging items for the periods presented.
notes to condensed interim consolidated financial statements (unaudited)
March 31, 2016 | 15
Amount of gain (loss) recognized in other
comprehensive income (effective portion) (Note 10)
Gain (loss) reclassified from other comprehensive
income to income (effective portion) (Note 10)
Three-month periods ended March 31 (millions) Amount
2016 2015 Location 2016 2015 Derivatives used to manage: Currency risks arising from U.S. dollar denominated purchases $ (23) $ — Goods and services purchased $ 1 $ — Changes in share-based compensation costs (Note 13(c)) 18 — Employee benefits expense 7 5 Currency risks arising from U.S. dollar denominated commercial
paper (Note 21(c)) (38)
— Financing costs (38)
— $ (43) $ — $ (30) $ 5
The following table sets out the gains and losses arising from derivative instruments that are classified as held for trading and that are not designated as being in a hedging relationship, and their location within the Condensed interim consolidated statements of income and other comprehensive income.
Gain (loss) recognized in
income on derivatives Three-month periods ended March 31 (millions) Location 2016 2015 Derivatives used to manage currency risks Financing costs $ (2) $ 10
5 4Bsegmented information
General The operating segments that are regularly reported to our Chief Executive Officer (our chief operating decision-maker) are wireless and wireline. Operating segments are components of an entity that engage in business activities from which they earn revenues and incur expenses (including revenues and expenses related to transactions with the other component(s)), the operating results of which are regularly reviewed by a chief operating decision-maker to make resource allocation decisions and to assess performance.
As we do not currently aggregate operating segments, our reportable segments are also wireless and wireline. The wireless segment includes network revenues (data and voice) and equipment sales. The wireline segment includes data revenues (which includes Internet protocol; television; hosting, managed information technology and cloud-based services; business process outsourcing; and certain healthcare solutions), voice revenues, and other telecommunications services revenues, excluding wireless. Segmentation is based on similarities in technology, the technical expertise required to deliver the services and products, customer characteristics, the distribution channels used and regulatory treatment. Intersegment sales are recorded at the exchange value, which is the amount agreed to by the parties.
The following segmented information is regularly reported to our chief operating decision-maker.
Three-month periods ended March 31 (millions)
Wireless Wireline Eliminations Consolidated 2016 2015 2016 2015 2016 2015 2016 2015
Operating revenues External revenue $ 1,702 $ 1,672 $ 1,406 $ 1,356 $ — $ — $ 3,108 $ 3,028 Intersegment revenue 14 14 47 43 (61) (57) — —
$ 1,716 $ 1,686 $ 1,453 $ 1,399 $ (61) $ (57) $ 3,108 $ 3,028 EBITDA 1 $ 756 $ 744 $ 384 $ 391 $ — $ — $ 1,140 $ 1,135 CAPEX, excluding spectrum
licences 2 $ 180 $ 248 $ 438 $ 387 $ — $ — $ 618 $ 635 Operating revenues (above) $ 3,108 $ 3,028 Goods and services purchased 1,300 1,284 Employee benefits expense 668 609 EBITDA (above) 1,140 1,135 Depreciation 385 347 Amortization 115 109 Operating income 640 679 Financing costs 123 117 Income before income taxes $ 517 $ 562
1 Earnings before interest, income taxes, depreciation and amortization (EBITDA) does not have any standardized meaning prescribed by IFRS-IASB and is therefore unlikely to be comparable to similar measures presented by other issuers; we define EBITDA as operating revenues less goods and services purchased and employee benefits expense. We have issued guidance on, and report, EBITDA because it is a key measure that management uses to evaluate the performance of our business, and it is also utilized in measuring compliance with certain debt covenants.
2 Total capital expenditures (CAPEX); see Note 25(b) for a reconciliation of capital expenditures, excluding spectrum licences to cash payments for capital assets, excluding spectrum licences reported in the Condensed interim consolidated statements of cash flows.
notes to condensed interim consolidated financial statements (unaudited)
16 | March 31, 2016
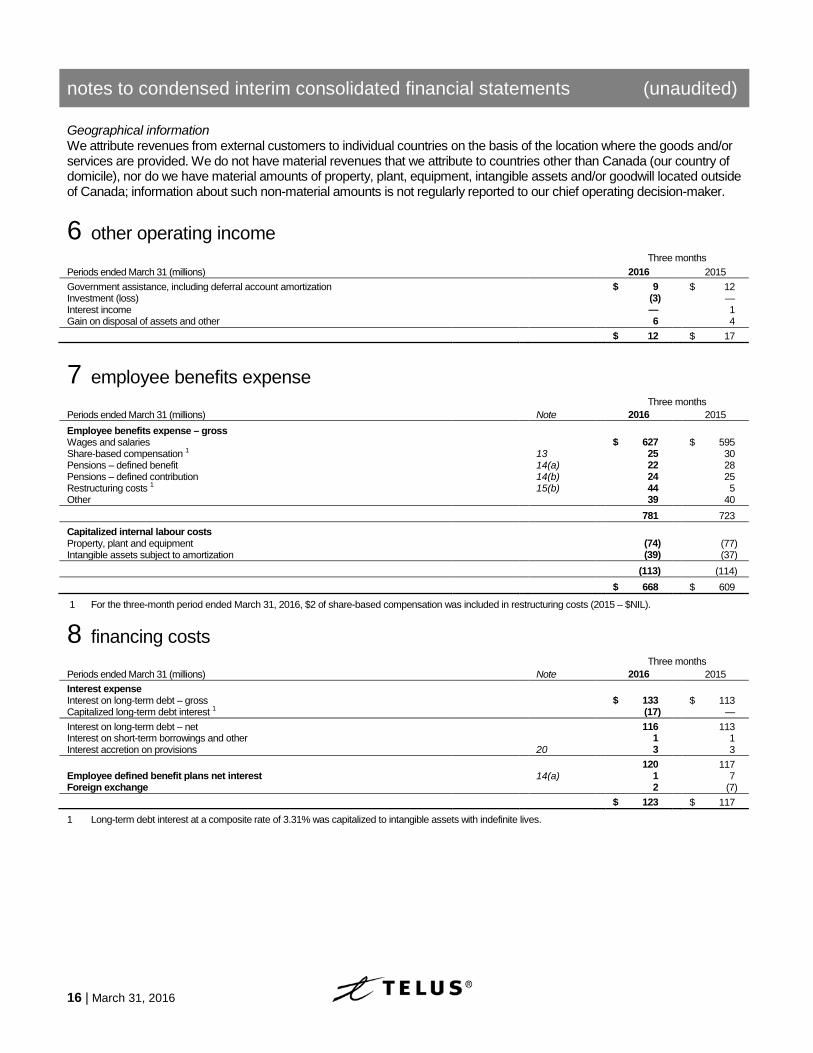
Geographical information We attribute revenues from external customers to individual countries on the basis of the location where the goods and/or services are provided. We do not have material revenues that we attribute to countries other than Canada (our country of domicile), nor do we have material amounts of property, plant, equipment, intangible assets and/or goodwill located outside of Canada; information about such non-material amounts is not regularly reported to our chief operating decision-maker.
6 5Bother operating income
Three months Periods ended March 31 (millions) 2016 2015 Government assistance, including deferral account amortization $ 9 $ 12 Investment (loss) (3) — Interest income — 1 Gain on disposal of assets and other 6 4 $ 12 $ 17
7 6Bemployee benefits expense
Three months Periods ended March 31 (millions) Note 2016 2015 Employee benefits expense – gross Wages and salaries $ 627 $ 595 Share-based compensation 1 13 25 30 Pensions – defined benefit 14(a) 22 28 Pensions – defined contribution 14(b) 24 25 Restructuring costs 1 15(b) 44 5 Other 39 40 781 723 Capitalized internal labour costs Property, plant and equipment (74) (77) Intangible assets subject to amortization (39) (37) (113) (114) $ 668 $ 609
1 For the three-month period ended March 31, 2016, $2 of share-based compensation was included in restructuring costs (2015 – $NIL).
8 7Bfinancing costs
Three months Periods ended March 31 (millions) Note 2016 2015 Interest expense Interest on long-term debt – gross $ 133 $ 113 Capitalized long-term debt interest 1 (17) — Interest on long-term debt – net 116 113 Interest on short-term borrowings and other 1 1 Interest accretion on provisions 20 3 3 120 117 Employee defined benefit plans net interest 14(a) 1 7 Foreign exchange 2 (7) $ 123 $ 117
1 Long-term debt interest at a composite rate of 3.31% was capitalized to intangible assets with indefinite lives.
notes to condensed interim consolidated financial statements (unaudited)
March 31, 2016 | 17
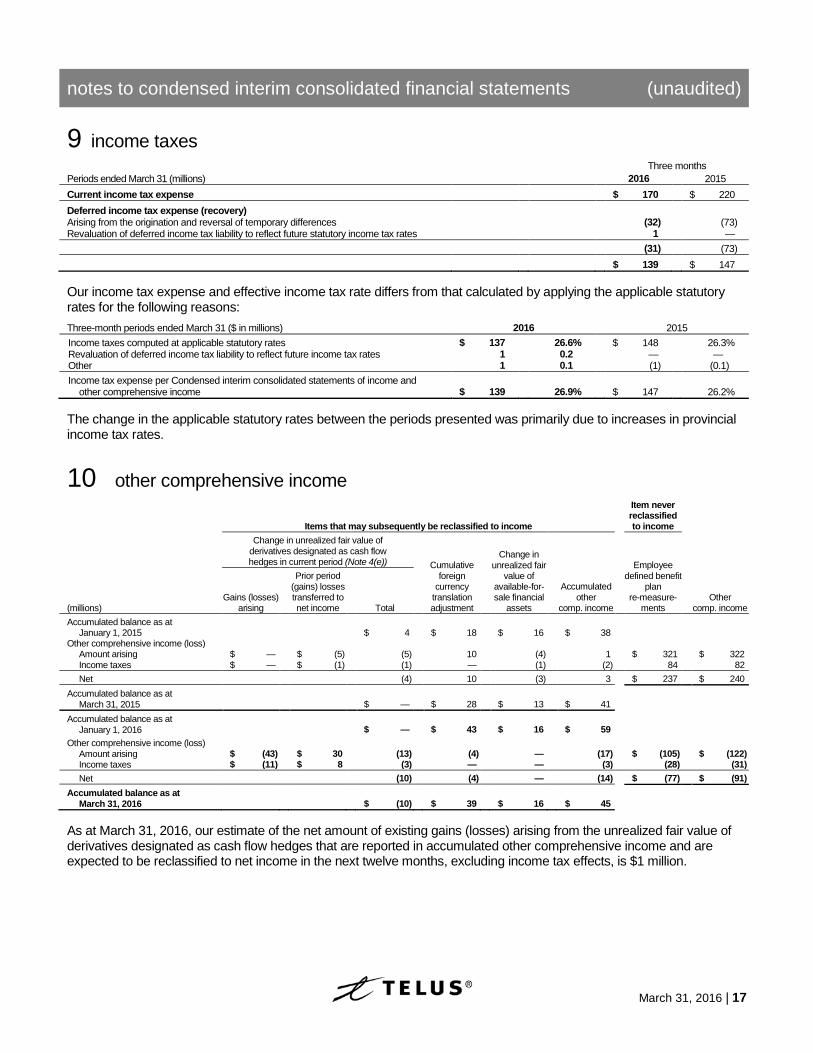
9 8Bincome taxes
Three months Periods ended March 31 (millions) 2016 2015 Current income tax expense $ 170 $ 220 Deferred income tax expense (recovery) Arising from the origination and reversal of temporary differences (32) (73) Revaluation of deferred income tax liability to reflect future statutory income tax rates 1 — (31) (73) $ 139 $ 147 Our income tax expense and effective income tax rate differs from that calculated by applying the applicable statutory rates for the following reasons: Three-month periods ended March 31 ($ in millions) 2016 2015 Income taxes computed at applicable statutory rates $ 137 26.6% $ 148 26.3% Revaluation of deferred income tax liability to reflect future income tax rates 1 0.2 — — Other 1 0.1 (1) (0.1) Income tax expense per Condensed interim consolidated statements of income and
other comprehensive income $ 139 26.9% $ 147 26.2% The change in the applicable statutory rates between the periods presented was primarily due to increases in provincial income tax rates.
10 9Bother comprehensive income
Items that may subsequently be reclassified to income
Item never reclassified to income
Change in unrealized fair value of derivatives designated as cash flow hedges in current period (Note 4(e)) Cumulative
foreign currency
translation adjustment
Change in
unrealized fair value of
available-for-sale financial
assets
Accumulated other
comp. income
Employee defined benefit
plan re-measure-
ments
(millions) Gains (losses)
arising
Prior period (gains) losses transferred to net income Total
Other comp. income
Accumulated balance as at January 1, 2015
$ 4
$ 18
$ 16 $ 38
Other comprehensive income (loss) Amount arising $ — $ (5) (5) 10 (4) 1 $ 321 $ 322 Income taxes $ — $ (1) (1) — (1) (2) 84 82 Net (4) 10 (3) 3 $ 237 $ 240 Accumulated balance as at
March 31, 2015
$ —
$ 28
$ 13 $ 41
Accumulated balance as at
January 1, 2016
$ —
$ 43
$ 16 $ 59
Other comprehensive income (loss) Amount arising $ (43) $ 30 (13) (4) — (17) $ (105) $ (122) Income taxes $ (11) $ 8 (3) — — (3) (28) (31) Net (10) (4) — (14) $ (77) $ (91) Accumulated balance as at
March 31, 2016
$ (10)
$ 39
$ 16 $ 45
As at March 31, 2016, our estimate of the net amount of existing gains (losses) arising from the unrealized fair value of derivatives designated as cash flow hedges that are reported in accumulated other comprehensive income and are expected to be reclassified to net income in the next twelve months, excluding income tax effects, is $1 million.
notes to condensed interim consolidated financial statements (unaudited)
18 | March 31, 2016
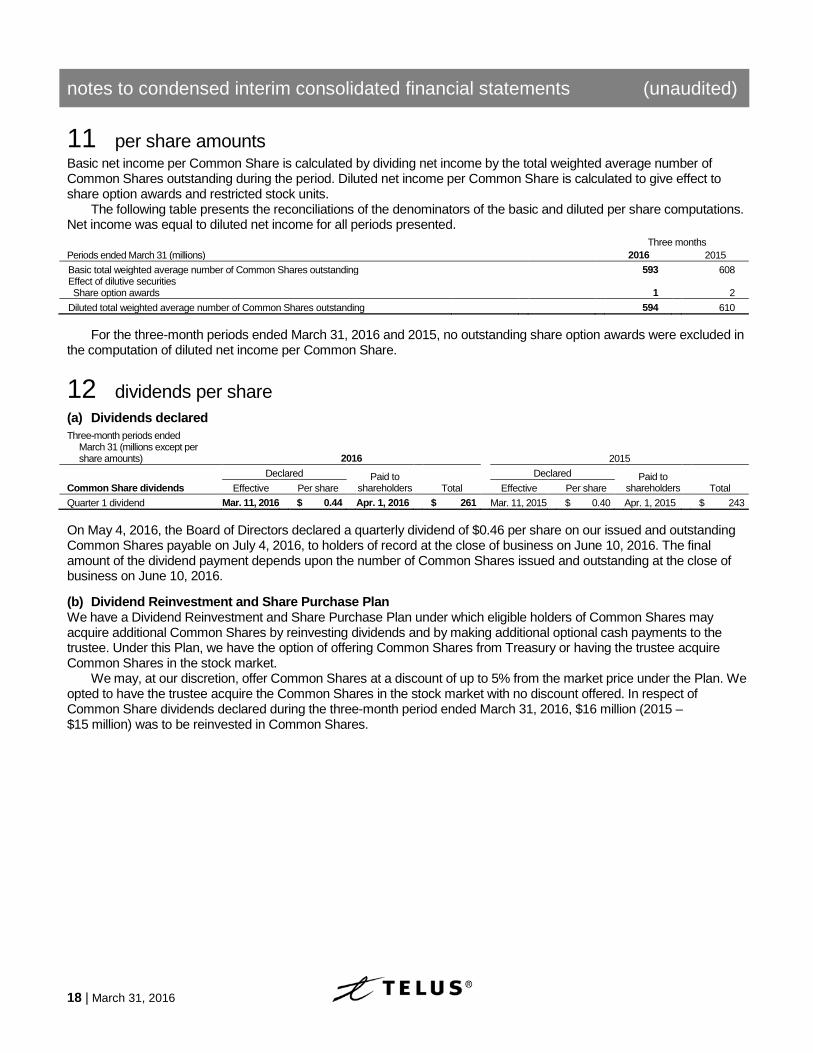
11 10Bper share amounts Basic net income per Common Share is calculated by dividing net income by the total weighted average number of Common Shares outstanding during the period. Diluted net income per Common Share is calculated to give effect to share option awards and restricted stock units.
The following table presents the reconciliations of the denominators of the basic and diluted per share computations. Net income was equal to diluted net income for all periods presented.
Three months Periods ended March 31 (millions) 2016 2015 Basic total weighted average number of Common Shares outstanding 593 608 Effect of dilutive securities Share option awards 1 2 Diluted total weighted average number of Common Shares outstanding 594 610
For the three-month periods ended March 31, 2016 and 2015, no outstanding share option awards were excluded in
the computation of diluted net income per Common Share.
12 11Bdividends per share (a) Dividends declared
Three-month periods ended March 31 (millions except per share amounts) 2016 2015
Common Share dividends Declared Paid to
shareholders Declared Paid to
shareholders
Effective Per share Total Effective Per share Total Quarter 1 dividend Mar. 11, 2016 $ 0.44 Apr. 1, 2016 $ 261 Mar. 11, 2015 $ 0.40 Apr. 1, 2015 $ 243
On May 4, 2016, the Board of Directors declared a quarterly dividend of $0.46 per share on our issued and outstanding Common Shares payable on July 4, 2016, to holders of record at the close of business on June 10, 2016. The final amount of the dividend payment depends upon the number of Common Shares issued and outstanding at the close of business on June 10, 2016.
(b) Dividend Reinvestment and Share Purchase Plan We have a Dividend Reinvestment and Share Purchase Plan under which eligible holders of Common Shares may acquire additional Common Shares by reinvesting dividends and by making additional optional cash payments to the trustee. Under this Plan, we have the option of offering Common Shares from Treasury or having the trustee acquire Common Shares in the stock market.
We may, at our discretion, offer Common Shares at a discount of up to 5% from the market price under the Plan. We opted to have the trustee acquire the Common Shares in the stock market with no discount offered. In respect of Common Share dividends declared during the three-month period ended March 31, 2016, $16 million (2015 – $15 million) was to be reinvested in Common Shares.
notes to condensed interim consolidated financial statements (unaudited)
March 31, 2016 | 19
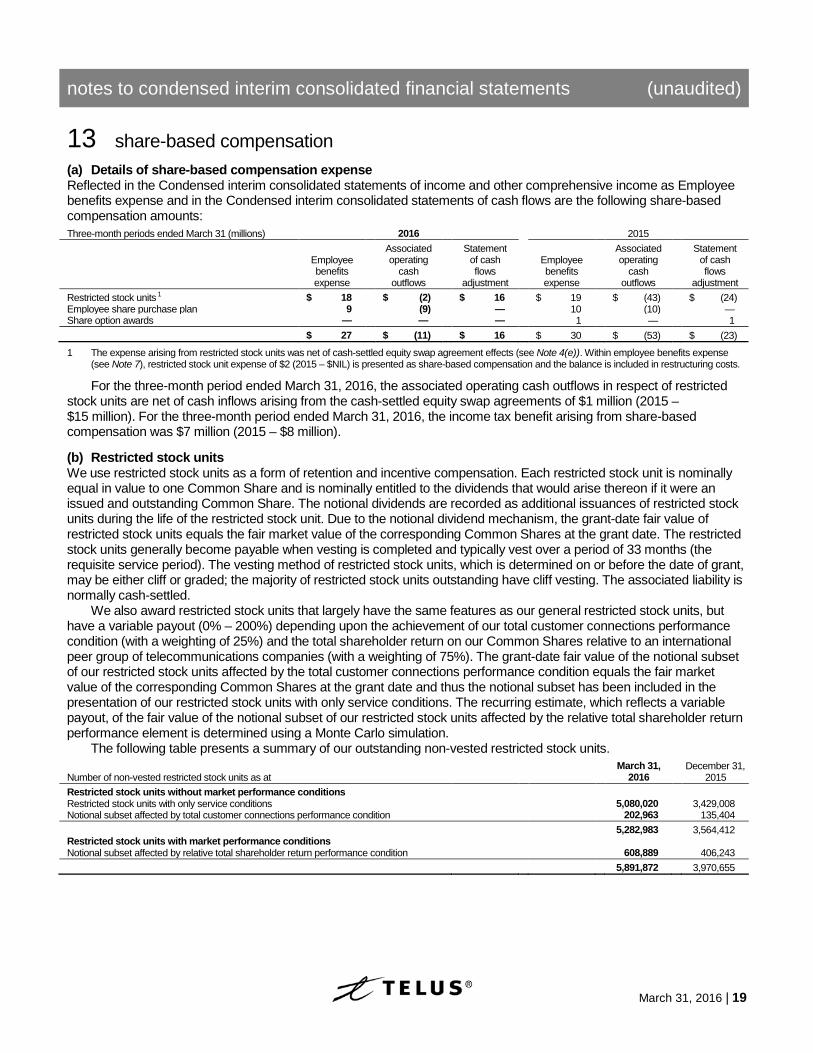
13 12Bshare-based compensation (a) Details of share-based compensation expense Reflected in the Condensed interim consolidated statements of income and other comprehensive income as Employee benefits expense and in the Condensed interim consolidated statements of cash flows are the following share-based compensation amounts:
Three-month periods ended March 31 (millions) 2016 2015
Employee benefits expense
Associated operating
cash outflows
Statement of cash flows
adjustment
Employee benefits expense
Associated operating
cash outflows
Statement of cash flows
adjustment Restricted stock units 1 $ 18 $ (2) $ 16 $ 19 $ (43) $ (24) Employee share purchase plan 9 (9) — 10 (10) — Share option awards — — — 1 — 1 $ 27 $ (11) $ 16 $ 30 $ (53) $ (23)
1 The expense arising from restricted stock units was net of cash-settled equity swap agreement effects (see Note 4(e)). Within employee benefits expense (see Note 7), restricted stock unit expense of $2 (2015 – $NIL) is presented as share-based compensation and the balance is included in restructuring costs.
For the three-month period ended March 31, 2016, the associated operating cash outflows in respect of restricted stock units are net of cash inflows arising from the cash-settled equity swap agreements of $1 million (2015 – $15 million). For the three-month period ended March 31, 2016, the income tax benefit arising from share-based compensation was $7 million (2015 – $8 million).
(b) Restricted stock units We use restricted stock units as a form of retention and incentive compensation. Each restricted stock unit is nominally equal in value to one Common Share and is nominally entitled to the dividends that would arise thereon if it were an issued and outstanding Common Share. The notional dividends are recorded as additional issuances of restricted stock units during the life of the restricted stock unit. Due to the notional dividend mechanism, the grant-date fair value of restricted stock units equals the fair market value of the corresponding Common Shares at the grant date. The restricted stock units generally become payable when vesting is completed and typically vest over a period of 33 months (the requisite service period). The vesting method of restricted stock units, which is determined on or before the date of grant, may be either cliff or graded; the majority of restricted stock units outstanding have cliff vesting. The associated liability is normally cash-settled.
We also award restricted stock units that largely have the same features as our general restricted stock units, but have a variable payout (0% – 200%) depending upon the achievement of our total customer connections performance condition (with a weighting of 25%) and the total shareholder return on our Common Shares relative to an international peer group of telecommunications companies (with a weighting of 75%). The grant-date fair value of the notional subset of our restricted stock units affected by the total customer connections performance condition equals the fair market value of the corresponding Common Shares at the grant date and thus the notional subset has been included in the presentation of our restricted stock units with only service conditions. The recurring estimate, which reflects a variable payout, of the fair value of the notional subset of our restricted stock units affected by the relative total shareholder return performance element is determined using a Monte Carlo simulation.
The following table presents a summary of our outstanding non-vested restricted stock units.
Number of non-vested restricted stock units as at March 31,
2016 December 31,
2015 Restricted stock units without market performance conditions Restricted stock units with only service conditions 5,080,020 3,429,008 Notional subset affected by total customer connections performance condition 202,963 135,404 5,282,983 3,564,412 Restricted stock units with market performance conditions Notional subset affected by relative total shareholder return performance condition 608,889 406,243 5,891,872 3,970,655
notes to condensed interim consolidated financial statements (unaudited)
20 | March 31, 2016
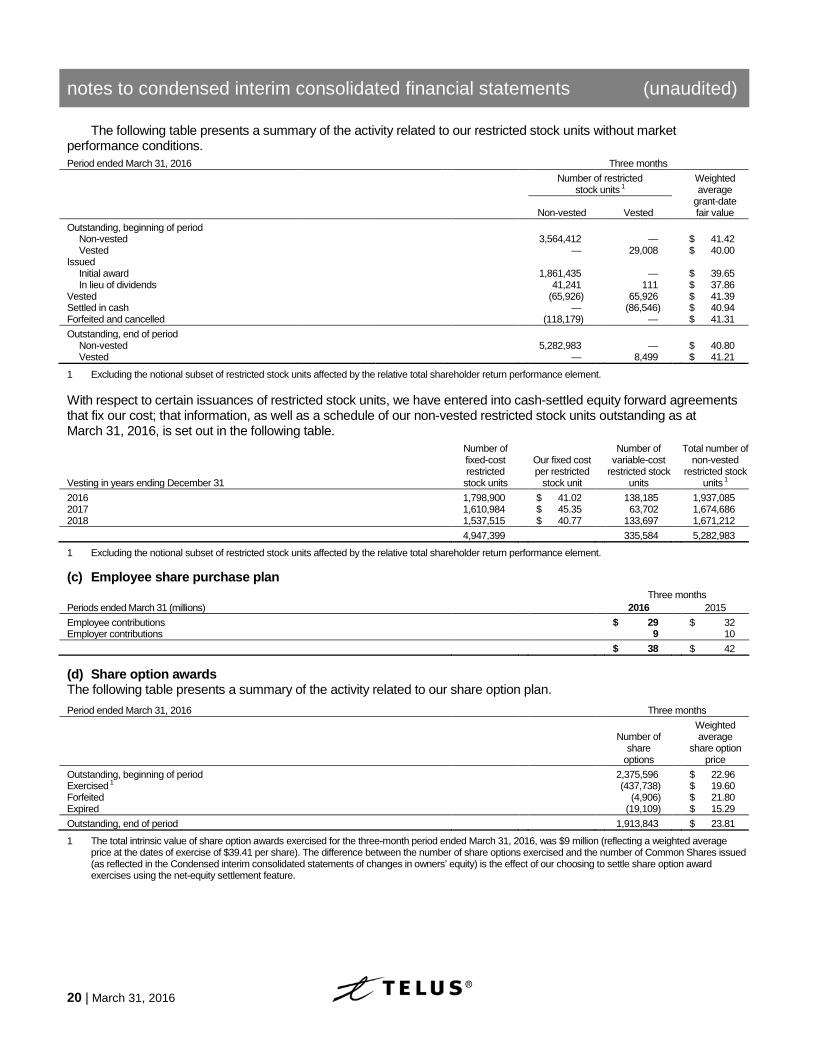
The following table presents a summary of the activity related to our restricted stock units without market performance conditions.
Period ended March 31, 2016 Three months
Number of restricted
stock units 1 Weighted average
grant-date fair value
Non-vested Vested
Outstanding, beginning of period Non-vested 3,564,412 — $ 41.42 Vested — 29,008 $ 40.00 Issued Initial award 1,861,435 — $ 39.65 In lieu of dividends 41,241 111 $ 37.86 Vested (65,926) 65,926 $ 41.39 Settled in cash — (86,546) $ 40.94 Forfeited and cancelled (118,179) — $ 41.31 Outstanding, end of period Non-vested 5,282,983 — $ 40.80 Vested — 8,499 $ 41.21
1 Excluding the notional subset of restricted stock units affected by the relative total shareholder return performance element. With respect to certain issuances of restricted stock units, we have entered into cash-settled equity forward agreements that fix our cost; that information, as well as a schedule of our non-vested restricted stock units outstanding as at March 31, 2016, is set out in the following table.
Vesting in years ending December 31
Number of fixed-cost restricted
stock units
Our fixed cost per restricted
stock unit
Number of variable-cost
restricted stock units
Total number of non-vested
restricted stock units 1
2016 1,798,900 $ 41.02 138,185 1,937,085 2017 1,610,984 $ 45.35 63,702 1,674,686 2018 1,537,515 $ 40.77 133,697 1,671,212 4,947,399 335,584 5,282,983
1 Excluding the notional subset of restricted stock units affected by the relative total shareholder return performance element.
(c) Employee share purchase plan
Three months Periods ended March 31 (millions) 2016 2015 Employee contributions $ 29 $ 32 Employer contributions 9 10 $ 38 $ 42
(d) Share option awards The following table presents a summary of the activity related to our share option plan.
Period ended March 31, 2016 Three months
Number of
share options
Weighted average
share option price
Outstanding, beginning of period 2,375,596 $ 22.96 Exercised 1 (437,738) $ 19.60 Forfeited (4,906) $ 21.80 Expired (19,109) $ 15.29 Outstanding, end of period 1,913,843 $ 23.81
1 The total intrinsic value of share option awards exercised for the three-month period ended March 31, 2016, was $9 million (reflecting a weighted average price at the dates of exercise of $39.41 per share). The difference between the number of share options exercised and the number of Common Shares issued (as reflected in the Condensed interim consolidated statements of changes in owners’ equity) is the effect of our choosing to settle share option award exercises using the net-equity settlement feature.
notes to condensed interim consolidated financial statements (unaudited)
March 31, 2016 | 21
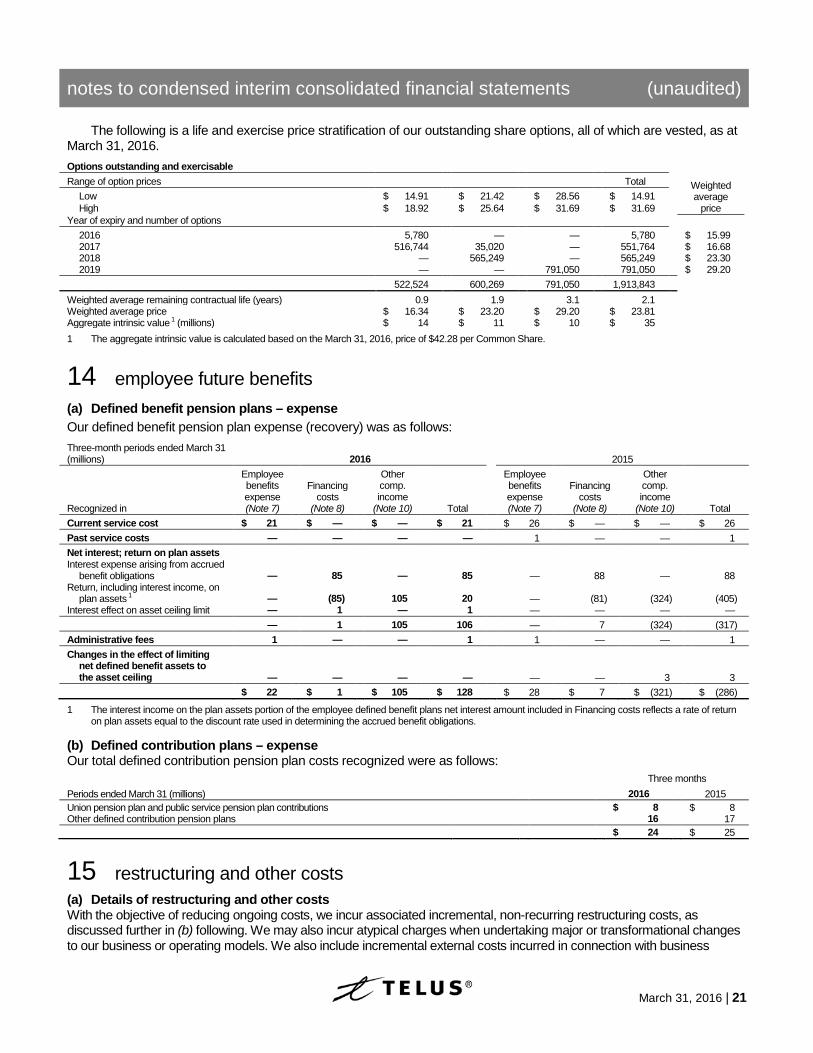
The following is a life and exercise price stratification of our outstanding share options, all of which are vested, as at March 31, 2016.
Options outstanding and exercisable Range of option prices Total Weighted
average price
Low $ 14.91 $ 21.42 $ 28.56 $ 14.91 High $ 18.92 $ 25.64 $ 31.69 $ 31.69 Year of expiry and number of options 2016 5,780 — — 5,780 $ 15.99 2017 516,744 35,020 — 551,764 $ 16.68 2018 — 565,249 — 565,249 $ 23.30 2019 — — 791,050 791,050 $ 29.20 522,524 600,269 791,050 1,913,843 Weighted average remaining contractual life (years) 0.9 1.9 3.1 2.1 Weighted average price $ 16.34 $ 23.20 $ 29.20 $ 23.81 Aggregate intrinsic value 1 (millions) $ 14 $ 11 $ 10 $ 35
1 The aggregate intrinsic value is calculated based on the March 31, 2016, price of $42.28 per Common Share.
14 13Bemployee future benefits
(a) Defined benefit pension plans – expense
Our defined benefit pension plan expense (recovery) was as follows: Three-month periods ended March 31 (millions) 2016 2015
Recognized in
Employee benefits expense (Note 7)
Financing costs
(Note 8)
Other comp. income
(Note 10) Total
Employee benefits expense (Note 7)
Financing costs
(Note 8)
Other comp. income
(Note 10) Total Current service cost $ 21 $ — $ — $ 21 $ 26 $ — $ — $ 26 Past service costs — — — — 1 — — 1 Net interest; return on plan assets Interest expense arising from accrued
benefit obligations — 85 — 85 — 88 — 88 Return, including interest income, on
plan assets 1 — (85) 105 20 — (81) (324) (405) Interest effect on asset ceiling limit — 1 — 1 — — — — — 1 105 106 — 7 (324) (317) Administrative fees 1 — — 1 1 — — 1 Changes in the effect of limiting
net defined benefit assets to the asset ceiling — — — — — — 3 3
$ 22 $ 1 $ 105 $ 128 $ 28 $ 7 $ (321) $ (286)
1 The interest income on the plan assets portion of the employee defined benefit plans net interest amount included in Financing costs reflects a rate of return on plan assets equal to the discount rate used in determining the accrued benefit obligations.
(b) Defined contribution plans – expense Our total defined contribution pension plan costs recognized were as follows:
Three months Periods ended March 31 (millions) 2016 2015 Union pension plan and public service pension plan contributions $ 8 $ 8 Other defined contribution pension plans 16 17 $ 24 $ 25
15 14Brestructuring and other costs (a) Details of restructuring and other costs With the objective of reducing ongoing costs, we incur associated incremental, non-recurring restructuring costs, as discussed further in (b) following. We may also incur atypical charges when undertaking major or transformational changes to our business or operating models. We also include incremental external costs incurred in connection with business
notes to condensed interim consolidated financial statements (unaudited)
22 | March 31, 2016
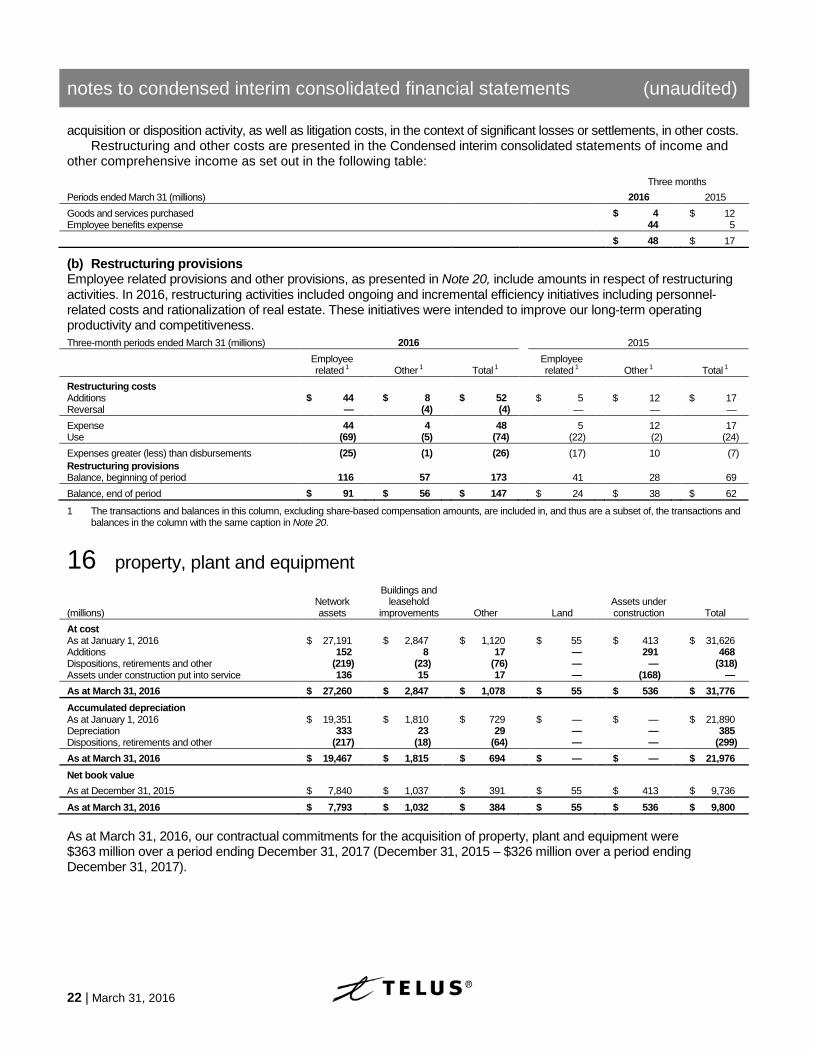
acquisition or disposition activity, as well as litigation costs, in the context of significant losses or settlements, in other costs. Restructuring and other costs are presented in the Condensed interim consolidated statements of income and
other comprehensive income as set out in the following table:
Three months Periods ended March 31 (millions) 2016 2015 Goods and services purchased $ 4 $ 12 Employee benefits expense 44 5 $ 48 $ 17
(b) Restructuring provisions Employee related provisions and other provisions, as presented in Note 20, include amounts in respect of restructuring activities. In 2016, restructuring activities included ongoing and incremental efficiency initiatives including personnel-related costs and rationalization of real estate. These initiatives were intended to improve our long-term operating productivity and competitiveness.
Three-month periods ended March 31 (millions) 2016 2015 Employee
related 1 Other 1 Total 1 Employee related 1 Other 1 Total 1
Restructuring costs Additions $ 44 $ 8 $ 52 $ 5 $ 12 $ 17 Reversal — (4) (4) — — — Expense 44 4 48 5 12 17 Use (69) (5) (74) (22) (2) (24) Expenses greater (less) than disbursements (25) (1) (26) (17) 10 (7) Restructuring provisions Balance, beginning of period 116 57 173 41 28 69 Balance, end of period $ 91 $ 56 $ 147 $ 24 $ 38 $ 62
1 The transactions and balances in this column, excluding share-based compensation amounts, are included in, and thus are a subset of, the transactions and balances in the column with the same caption in Note 20.
16 15Bproperty, plant and equipment
(millions) Network assets
Buildings and leasehold
improvements Other Land Assets under construction Total
At cost As at January 1, 2016 $ 27,191 $ 2,847 $ 1,120 $ 55 $ 413 $ 31,626 Additions 152 8 17 — 291 468 Dispositions, retirements and other (219) (23) (76) — — (318) Assets under construction put into service 136 15 17 — (168) — As at March 31, 2016 $ 27,260 $ 2,847 $ 1,078 $ 55 $ 536 $ 31,776 Accumulated depreciation As at January 1, 2016 $ 19,351 $ 1,810 $ 729 $ — $ — $ 21,890 Depreciation 333 23 29 — — 385 Dispositions, retirements and other (217) (18) (64) — — (299) As at March 31, 2016 $ 19,467 $ 1,815 $ 694 $ — $ — $ 21,976 Net book value As at December 31, 2015 $ 7,840 $ 1,037 $ 391 $ 55 $ 413 $ 9,736 As at March 31, 2016 $ 7,793 $ 1,032 $ 384 $ 55 $ 536 $ 9,800
As at March 31, 2016, our contractual commitments for the acquisition of property, plant and equipment were $363 million over a period ending December 31, 2017 (December 31, 2015 – $326 million over a period ending December 31, 2017).
notes to condensed interim consolidated financial statements (unaudited)
March 31, 2016 | 23
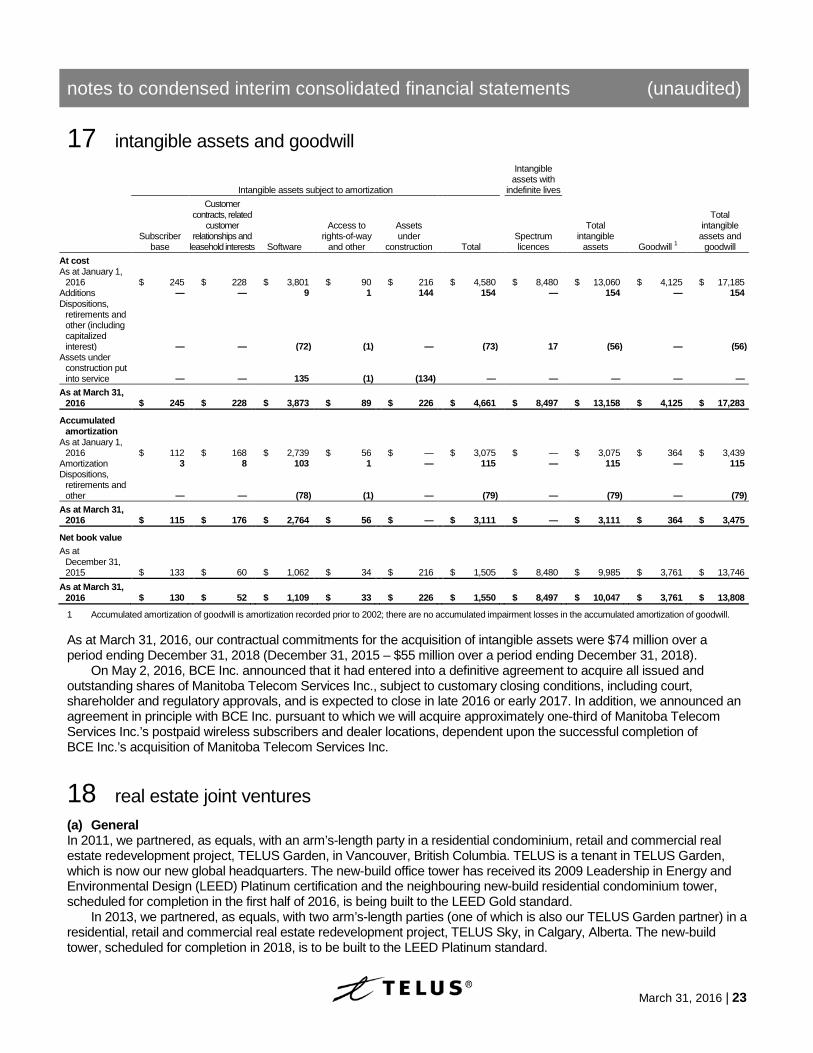
17 16Bintangible assets and goodwill
Intangible assets subject to amortization
Intangible assets with
indefinite lives
Total intangible assets and
goodwill Subscriber
base
Customer contracts, related
customer relationships and
leasehold interests Software
Access to rights-of-way
and other
Assets under
construction Total Spectrum licences
Total intangible
assets Goodwill 1 At cost As at January 1,
2016 $ 245 $ 228 $ 3,801 $ 90 $ 216 $ 4,580
$ 8,480
$ 13,060
$ 4,125
$ 17,185 Additions — — 9 1 144 154 — 154 — 154 Dispositions,
retirements and other (including capitalized interest) — — (72) (1) — (73)
17
(56)
—
(56) Assets under
construction put into service — — 135 (1) (134) —
—
—
—
— As at March 31,
2016 $ 245 $ 228 $ 3,873 $ 89 $ 226 $ 4,661
$ 8,497
$ 13,158
$ 4,125
$ 17,283
Accumulated amortization
As at January 1, 2016 $ 112 $ 168 $ 2,739 $ 56 $ — $ 3,075
$ —
$ 3,075
$ 364
$ 3,439
Amortization 3 8 103 1 — 115 — 115 — 115 Dispositions,
retirements and other — — (78) (1) — (79) — (79) — (79)
As at March 31, 2016 $ 115 $ 176 $ 2,764 $ 56 $ — $ 3,111
$ —
$ 3,111
$ 364
$ 3,475
Net book value As at
December 31, 2015 $ 133 $ 60 $ 1,062 $ 34 $ 216 $ 1,505
$ 8,480
$ 9,985
$ 3,761
$ 13,746 As at March 31,
2016 $ 130 $ 52 $ 1,109 $ 33 $ 226 $ 1,550
$ 8,497
$ 10,047
$ 3,761
$ 13,808
1 Accumulated amortization of goodwill is amortization recorded prior to 2002; there are no accumulated impairment losses in the accumulated amortization of goodwill. As at March 31, 2016, our contractual commitments for the acquisition of intangible assets were $74 million over a period ending December 31, 2018 (December 31, 2015 – $55 million over a period ending December 31, 2018).
On May 2, 2016, BCE Inc. announced that it had entered into a definitive agreement to acquire all issued and outstanding shares of Manitoba Telecom Services Inc., subject to customary closing conditions, including court, shareholder and regulatory approvals, and is expected to close in late 2016 or early 2017. In addition, we announced an agreement in principle with BCE Inc. pursuant to which we will acquire approximately one-third of Manitoba Telecom Services Inc.’s postpaid wireless subscribers and dealer locations, dependent upon the successful completion of BCE Inc.’s acquisition of Manitoba Telecom Services Inc.
18 17Breal estate joint ventures (a) General In 2011, we partnered, as equals, with an arm’s-length party in a residential condominium, retail and commercial real estate redevelopment project, TELUS Garden, in Vancouver, British Columbia. TELUS is a tenant in TELUS Garden, which is now our new global headquarters. The new-build office tower has received its 2009 Leadership in Energy and Environmental Design (LEED) Platinum certification and the neighbouring new-build residential condominium tower, scheduled for completion in the first half of 2016, is being built to the LEED Gold standard.
In 2013, we partnered, as equals, with two arm’s-length parties (one of which is also our TELUS Garden partner) in a residential, retail and commercial real estate redevelopment project, TELUS Sky, in Calgary, Alberta. The new-build tower, scheduled for completion in 2018, is to be built to the LEED Platinum standard.
notes to condensed interim consolidated financial statements (unaudited)
24 | March 31, 2016
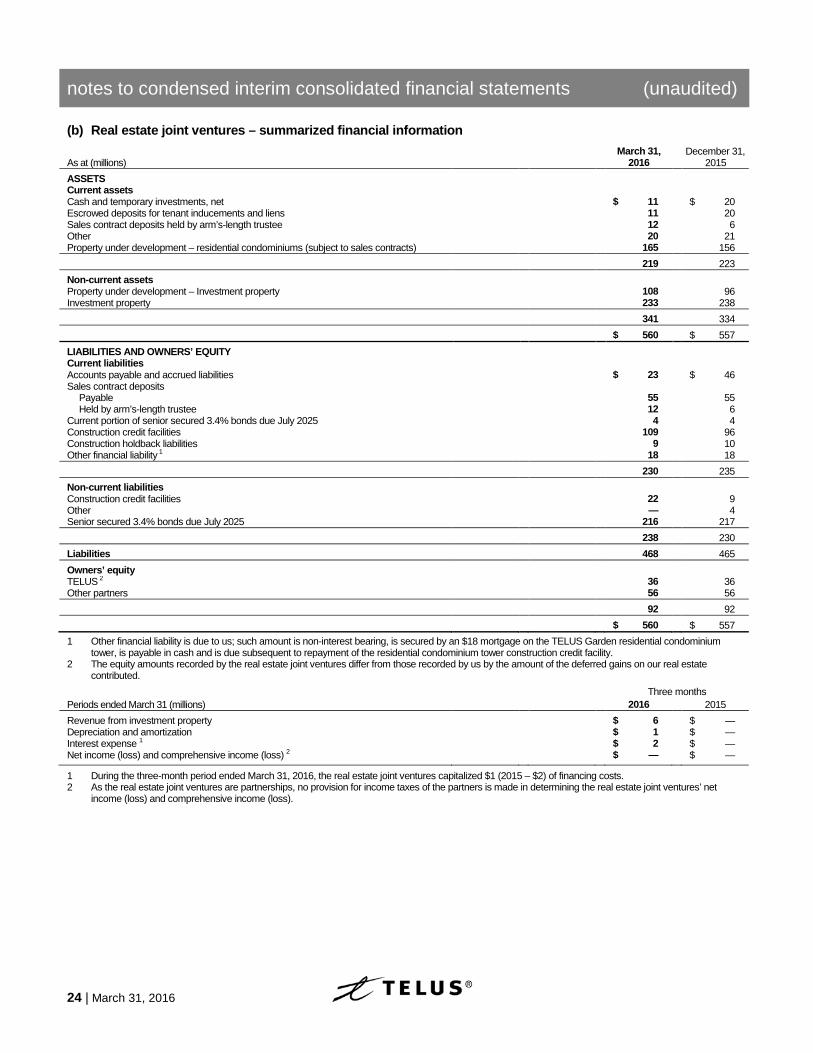
(b) Real estate joint ventures – summarized financial information
As at (millions) March 31,
2016 December 31,
2015 ASSETS Current assets Cash and temporary investments, net $ 11 $ 20 Escrowed deposits for tenant inducements and liens 11 20 Sales contract deposits held by arm’s-length trustee 12 6 Other 20 21 Property under development – residential condominiums (subject to sales contracts) 165 156 219 223 Non-current assets Property under development – Investment property 108 96 Investment property 233 238 341 334 $ 560 $ 557 LIABILITIES AND OWNERS’ EQUITY Current liabilities Accounts payable and accrued liabilities $ 23 $ 46 Sales contract deposits Payable 55 55 Held by arm’s-length trustee 12 6 Current portion of senior secured 3.4% bonds due July 2025 4 4 Construction credit facilities 109 96 Construction holdback liabilities 9 10 Other financial liability 1 18 18 230 235 Non-current liabilities Construction credit facilities 22 9 Other — 4 Senior secured 3.4% bonds due July 2025 216 217 238 230 Liabilities 468 465 Owners’ equity TELUS 2 36 36 Other partners 56 56 92 92 $ 560 $ 557
1 Other financial liability is due to us; such amount is non-interest bearing, is secured by an $18 mortgage on the TELUS Garden residential condominium tower, is payable in cash and is due subsequent to repayment of the residential condominium tower construction credit facility.
2 The equity amounts recorded by the real estate joint ventures differ from those recorded by us by the amount of the deferred gains on our real estate contributed.
Three months Periods ended March 31 (millions) 2016 2015 Revenue from investment property $ 6 $ — Depreciation and amortization $ 1 $ — Interest expense 1 $ 2 $ — Net income (loss) and comprehensive income (loss) 2 $ — $ —
1 During the three-month period ended March 31, 2016, the real estate joint ventures capitalized $1 (2015 – $2) of financing costs. 2 As the real estate joint ventures are partnerships, no provision for income taxes of the partners is made in determining the real estate joint ventures’ net
income (loss) and comprehensive income (loss).
notes to condensed interim consolidated financial statements (unaudited)
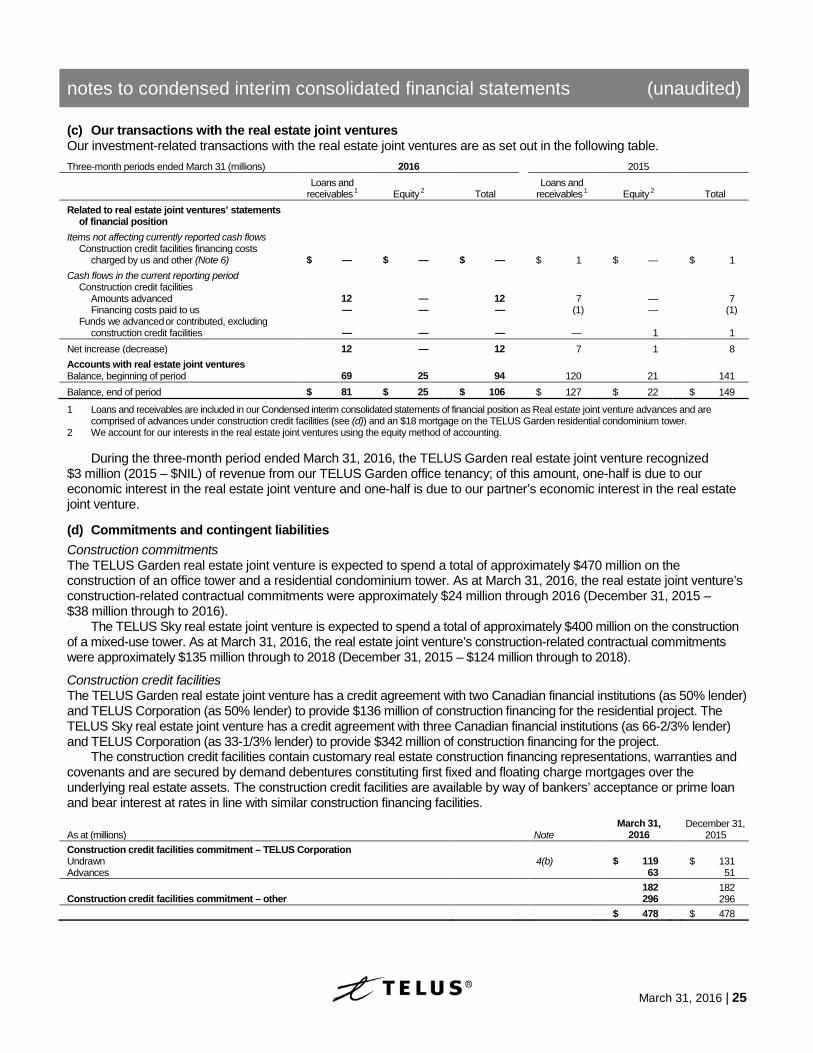
March 31, 2016 | 25
(c) Our transactions with the real estate joint ventures Our investment-related transactions with the real estate joint ventures are as set out in the following table. Three-month periods ended March 31 (millions) 2016 2015
Loans and
receivables 1 Equity 2 Total Loans and
receivables 1 Equity 2 Total Related to real estate joint ventures’ statements
of financial position Items not affecting currently reported cash flows Construction credit facilities financing costs
charged by us and other (Note 6) $ — $ — $ — $ 1 $ — $ 1 Cash flows in the current reporting period Construction credit facilities Amounts advanced 12 — 12 7 — 7 Financing costs paid to us — — — (1) — (1) Funds we advanced or contributed, excluding
construction credit facilities — — — — 1 1 Net increase (decrease) 12 — 12 7 1 8 Accounts with real estate joint ventures Balance, beginning of period 69 25 94 120 21 141 Balance, end of period $ 81 $ 25 $ 106 $ 127 $ 22 $ 149
1 Loans and receivables are included in our Condensed interim consolidated statements of financial position as Real estate joint venture advances and are comprised of advances under construction credit facilities (see (d)) and an $18 mortgage on the TELUS Garden residential condominium tower.
2 We account for our interests in the real estate joint ventures using the equity method of accounting.
During the three-month period ended March 31, 2016, the TELUS Garden real estate joint venture recognized $3 million (2015 – $NIL) of revenue from our TELUS Garden office tenancy; of this amount, one-half is due to our economic interest in the real estate joint venture and one-half is due to our partner’s economic interest in the real estate joint venture.
(d) Commitments and contingent liabilities
Construction commitments The TELUS Garden real estate joint venture is expected to spend a total of approximately $470 million on the construction of an office tower and a residential condominium tower. As at March 31, 2016, the real estate joint venture’s construction-related contractual commitments were approximately $24 million through 2016 (December 31, 2015 – $38 million through to 2016).
The TELUS Sky real estate joint venture is expected to spend a total of approximately $400 million on the construction of a mixed-use tower. As at March 31, 2016, the real estate joint venture’s construction-related contractual commitments were approximately $135 million through to 2018 (December 31, 2015 – $124 million through to 2018).
Construction credit facilities The TELUS Garden real estate joint venture has a credit agreement with two Canadian financial institutions (as 50% lender) and TELUS Corporation (as 50% lender) to provide $136 million of construction financing for the residential project. The TELUS Sky real estate joint venture has a credit agreement with three Canadian financial institutions (as 66-2/3% lender) and TELUS Corporation (as 33-1/3% lender) to provide $342 million of construction financing for the project.
The construction credit facilities contain customary real estate construction financing representations, warranties and covenants and are secured by demand debentures constituting first fixed and floating charge mortgages over the underlying real estate assets. The construction credit facilities are available by way of bankers’ acceptance or prime loan and bear interest at rates in line with similar construction financing facilities.
As at (millions) Note March 31,
2016 December 31,
2015 Construction credit facilities commitment – TELUS Corporation Undrawn 4(b) $ 119 $ 131 Advances 63 51 182 182 Construction credit facilities commitment – other 296 296 $ 478 $ 478
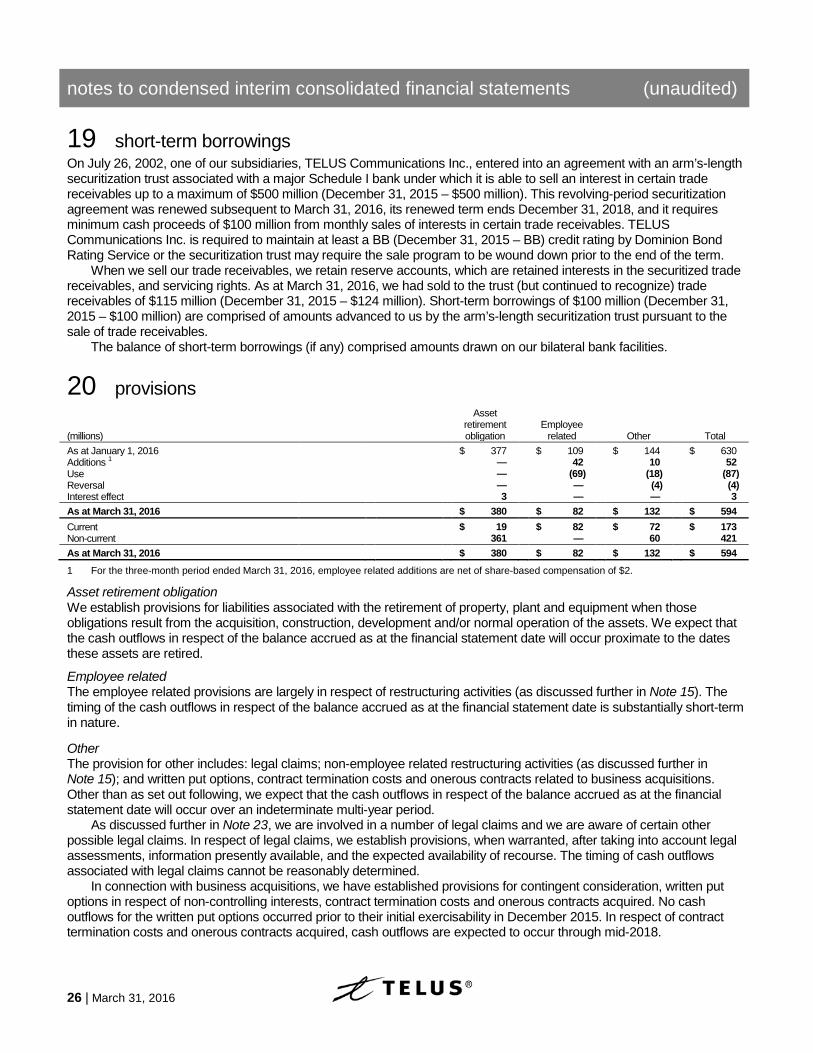
notes to condensed interim consolidated financial statements (unaudited)
26 | March 31, 2016
19 18Bshort-term borrowings On July 26, 2002, one of our subsidiaries, TELUS Communications Inc., entered into an agreement with an arm’s-length securitization trust associated with a major Schedule I bank under which it is able to sell an interest in certain trade receivables up to a maximum of $500 million (December 31, 2015 – $500 million). This revolving-period securitization agreement was renewed subsequent to March 31, 2016, its renewed term ends December 31, 2018, and it requires minimum cash proceeds of $100 million from monthly sales of interests in certain trade receivables. TELUS Communications Inc. is required to maintain at least a BB (December 31, 2015 – BB) credit rating by Dominion Bond Rating Service or the securitization trust may require the sale program to be wound down prior to the end of the term.
When we sell our trade receivables, we retain reserve accounts, which are retained interests in the securitized trade receivables, and servicing rights. As at March 31, 2016, we had sold to the trust (but continued to recognize) trade receivables of $115 million (December 31, 2015 – $124 million). Short-term borrowings of $100 million (December 31, 2015 – $100 million) are comprised of amounts advanced to us by the arm’s-length securitization trust pursuant to the sale of trade receivables.
The balance of short-term borrowings (if any) comprised amounts drawn on our bilateral bank facilities.
20 19Bprovisions
(millions)
Asset retirement obligation
Employee related Other Total
As at January 1, 2016 $ 377 $ 109 $ 144 $ 630 Additions 1 — 42 10 52 Use — (69) (18) (87) Reversal — — (4) (4) Interest effect 3 — — 3 As at March 31, 2016 $ 380 $ 82 $ 132 $ 594 Current $ 19 $ 82 $ 72 $ 173 Non-current 361 — 60 421 As at March 31, 2016 $ 380 $ 82 $ 132 $ 594
1 For the three-month period ended March 31, 2016, employee related additions are net of share-based compensation of $2.
Asset retirement obligation We establish provisions for liabilities associated with the retirement of property, plant and equipment when those obligations result from the acquisition, construction, development and/or normal operation of the assets. We expect that the cash outflows in respect of the balance accrued as at the financial statement date will occur proximate to the dates these assets are retired.
Employee related The employee related provisions are largely in respect of restructuring activities (as discussed further in Note 15). The timing of the cash outflows in respect of the balance accrued as at the financial statement date is substantially short-term in nature.
Other The provision for other includes: legal claims; non-employee related restructuring activities (as discussed further in Note 15); and written put options, contract termination costs and onerous contracts related to business acquisitions. Other than as set out following, we expect that the cash outflows in respect of the balance accrued as at the financial statement date will occur over an indeterminate multi-year period.
As discussed further in Note 23, we are involved in a number of legal claims and we are aware of certain other possible legal claims. In respect of legal claims, we establish provisions, when warranted, after taking into account legal assessments, information presently available, and the expected availability of recourse. The timing of cash outflows associated with legal claims cannot be reasonably determined.
In connection with business acquisitions, we have established provisions for contingent consideration, written put options in respect of non-controlling interests, contract termination costs and onerous contracts acquired. No cash outflows for the written put options occurred prior to their initial exercisability in December 2015. In respect of contract termination costs and onerous contracts acquired, cash outflows are expected to occur through mid-2018.
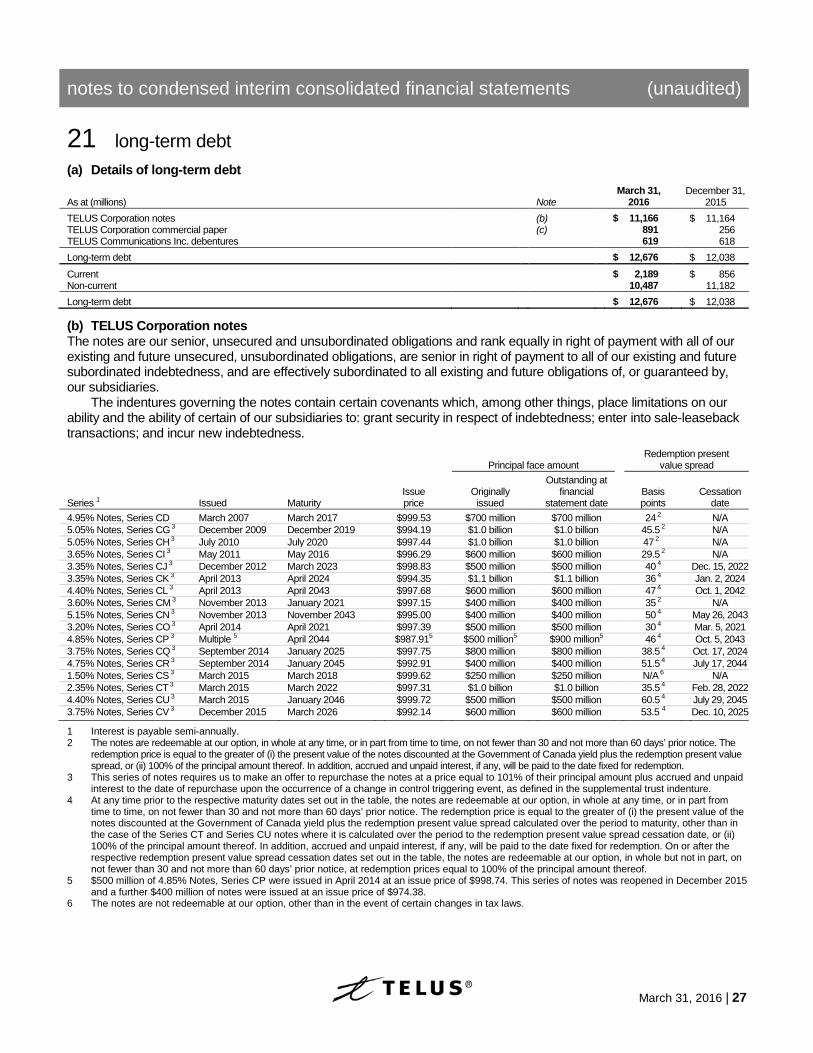
notes to condensed interim consolidated financial statements (unaudited)
March 31, 2016 | 27
21 20Blong-term debt (a) Details of long-term debt
As at (millions) Note March 31,
2016 December 31,
2015 TELUS Corporation notes (b) $ 11,166 $ 11,164 TELUS Corporation commercial paper (c) 891 256 TELUS Communications Inc. debentures 619 618 Long-term debt $ 12,676 $ 12,038
Current $ 2,189 $ 856 Non-current 10,487 11,182 Long-term debt $ 12,676 $ 12,038
(b) TELUS Corporation notes The notes are our senior, unsecured and unsubordinated obligations and rank equally in right of payment with all of our existing and future unsecured, unsubordinated obligations, are senior in right of payment to all of our existing and future subordinated indebtedness, and are effectively subordinated to all existing and future obligations of, or guaranteed by, our subsidiaries.
The indentures governing the notes contain certain covenants which, among other things, place limitations on our ability and the ability of certain of our subsidiaries to: grant security in respect of indebtedness; enter into sale-leaseback transactions; and incur new indebtedness.
Principal face amount Redemption present
value spread
Series 1 Issued Maturity Issue price
Originally issued
Outstanding at financial
statement date Basis points
Cessation
date 4.95% Notes, Series CD March 2007 March 2017 $999.53 $700 million $700 million 24 2 N/A 5.05% Notes, Series CG 3 December 2009 December 2019 $994.19 $1.0 billion $1.0 billion 45.5 2 N/A 5.05% Notes, Series CH 3 July 2010 July 2020 $997.44 $1.0 billion $1.0 billion 47 2 N/A 3.65% Notes, Series CI 3 May 2011 May 2016 $996.29 $600 million $600 million 29.5 2 N/A 3.35% Notes, Series CJ 3 December 2012 March 2023 $998.83 $500 million $500 million 40 4 Dec. 15, 2022 3.35% Notes, Series CK 3 April 2013 April 2024 $994.35 $1.1 billion $1.1 billion 36 4 Jan. 2, 2024 4.40% Notes, Series CL 3 April 2013 April 2043 $997.68 $600 million $600 million 47 4 Oct. 1, 2042 3.60% Notes, Series CM 3 November 2013 January 2021 $997.15 $400 million $400 million 35 2 N/A 5.15% Notes, Series CN 3 November 2013 November 2043 $995.00 $400 million $400 million 50 4 May 26, 2043 3.20% Notes, Series CO 3 April 2014 April 2021 $997.39 $500 million $500 million 30 4 Mar. 5, 2021 4.85% Notes, Series CP 3 Multiple 5 April 2044 $987.915 $500 million5 $900 million5 46 4 Oct. 5, 2043 3.75% Notes, Series CQ 3 September 2014 January 2025 $997.75 $800 million $800 million 38.5 4 Oct. 17, 2024 4.75% Notes, Series CR 3 September 2014 January 2045 $992.91 $400 million $400 million 51.5 4 July 17, 2044 1.50% Notes, Series CS 3 March 2015 March 2018 $999.62 $250 million $250 million N/A 6 N/A 2.35% Notes, Series CT 3 March 2015 March 2022 $997.31 $1.0 billion $1.0 billion 35.5 4 Feb. 28, 2022 4.40% Notes, Series CU 3 March 2015 January 2046 $999.72 $500 million $500 million 60.5 4 July 29, 2045 3.75% Notes, Series CV 3 December 2015 March 2026 $992.14 $600 million $600 million 53.5 4 Dec. 10, 2025
1 Interest is payable semi-annually. 2 The notes are redeemable at our option, in whole at any time, or in part from time to time, on not fewer than 30 and not more than 60 days’ prior notice. The
redemption price is equal to the greater of (i) the present value of the notes discounted at the Government of Canada yield plus the redemption present value spread, or (ii) 100% of the principal amount thereof. In addition, accrued and unpaid interest, if any, will be paid to the date fixed for redemption.
3 This series of notes requires us to make an offer to repurchase the notes at a price equal to 101% of their principal amount plus accrued and unpaid interest to the date of repurchase upon the occurrence of a change in control triggering event, as defined in the supplemental trust indenture.
4 At any time prior to the respective maturity dates set out in the table, the notes are redeemable at our option, in whole at any time, or in part from time to time, on not fewer than 30 and not more than 60 days’ prior notice. The redemption price is equal to the greater of (i) the present value of the notes discounted at the Government of Canada yield plus the redemption present value spread calculated over the period to maturity, other than in the case of the Series CT and Series CU notes where it is calculated over the period to the redemption present value spread cessation date, or (ii) 100% of the principal amount thereof. In addition, accrued and unpaid interest, if any, will be paid to the date fixed for redemption. On or after the respective redemption present value spread cessation dates set out in the table, the notes are redeemable at our option, in whole but not in part, on not fewer than 30 and not more than 60 days’ prior notice, at redemption prices equal to 100% of the principal amount thereof.
5 $500 million of 4.85% Notes, Series CP were issued in April 2014 at an issue price of $998.74. This series of notes was reopened in December 2015 and a further $400 million of notes were issued at an issue price of $974.38.
6 The notes are not redeemable at our option, other than in the event of certain changes in tax laws.
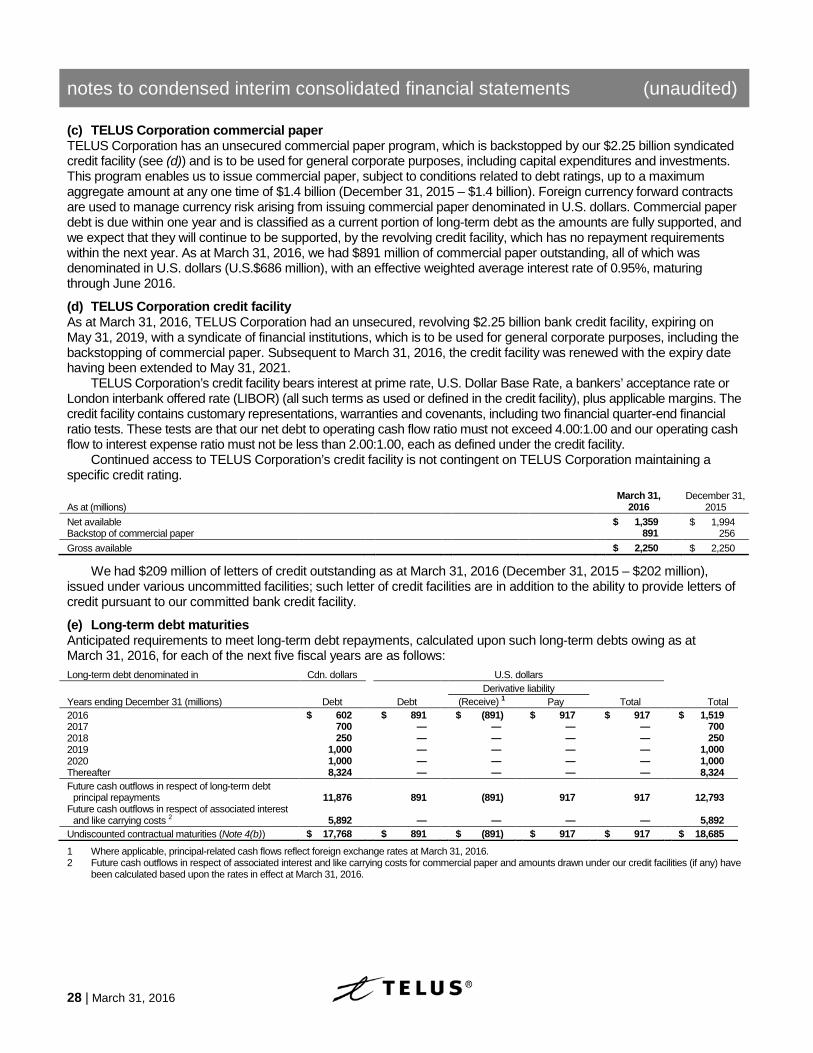
notes to condensed interim consolidated financial statements (unaudited)
28 | March 31, 2016
(c) TELUS Corporation commercial paper TELUS Corporation has an unsecured commercial paper program, which is backstopped by our $2.25 billion syndicated credit facility (see (d)) and is to be used for general corporate purposes, including capital expenditures and investments. This program enables us to issue commercial paper, subject to conditions related to debt ratings, up to a maximum aggregate amount at any one time of $1.4 billion (December 31, 2015 – $1.4 billion). Foreign currency forward contracts are used to manage currency risk arising from issuing commercial paper denominated in U.S. dollars. Commercial paper debt is due within one year and is classified as a current portion of long-term debt as the amounts are fully supported, and we expect that they will continue to be supported, by the revolving credit facility, which has no repayment requirements within the next year. As at March 31, 2016, we had $891 million of commercial paper outstanding, all of which was denominated in U.S. dollars (U.S.$686 million), with an effective weighted average interest rate of 0.95%, maturing through June 2016.
(d) TELUS Corporation credit facility As at March 31, 2016, TELUS Corporation had an unsecured, revolving $2.25 billion bank credit facility, expiring on May 31, 2019, with a syndicate of financial institutions, which is to be used for general corporate purposes, including the backstopping of commercial paper. Subsequent to March 31, 2016, the credit facility was renewed with the expiry date having been extended to May 31, 2021.
TELUS Corporation’s credit facility bears interest at prime rate, U.S. Dollar Base Rate, a bankers’ acceptance rate or London interbank offered rate (LIBOR) (all such terms as used or defined in the credit facility), plus applicable margins. The credit facility contains customary representations, warranties and covenants, including two financial quarter-end financial ratio tests. These tests are that our net debt to operating cash flow ratio must not exceed 4.00:1.00 and our operating cash flow to interest expense ratio must not be less than 2.00:1.00, each as defined under the credit facility.
Continued access to TELUS Corporation’s credit facility is not contingent on TELUS Corporation maintaining a specific credit rating.
As at (millions) March 31,
2016 December 31,
2015 Net available $ 1,359 $ 1,994 Backstop of commercial paper 891 256 Gross available $ 2,250 $ 2,250
We had $209 million of letters of credit outstanding as at March 31, 2016 (December 31, 2015 – $202 million), issued under various uncommitted facilities; such letter of credit facilities are in addition to the ability to provide letters of credit pursuant to our committed bank credit facility.
(e) Long-term debt maturities Anticipated requirements to meet long-term debt repayments, calculated upon such long-term debts owing as at March 31, 2016, for each of the next five fiscal years are as follows:
Long-term debt denominated in Cdn. dollars U.S. dollars Derivative liability Years ending December 31 (millions) Debt Debt (Receive) 1 Pay Total Total 2016 $ 602 $ 891 $ (891) $ 917 $ 917 $ 1,519 2017 700 — — — — 700 2018 250 — — — — 250 2019 1,000 — — — — 1,000 2020 1,000 — — — — 1,000 Thereafter 8,324 — — — — 8,324 Future cash outflows in respect of long-term debt
principal repayments 11,876 891 (891) 917 917 12,793 Future cash outflows in respect of associated interest
and like carrying costs 2 5,892 — — — — 5,892 Undiscounted contractual maturities (Note 4(b)) $ 17,768 $ 891 $ (891) $ 917 $ 917 $ 18,685
1 Where applicable, principal-related cash flows reflect foreign exchange rates at March 31, 2016. 2 Future cash outflows in respect of associated interest and like carrying costs for commercial paper and amounts drawn under our credit facilities (if any) have
been calculated based upon the rates in effect at March 31, 2016.
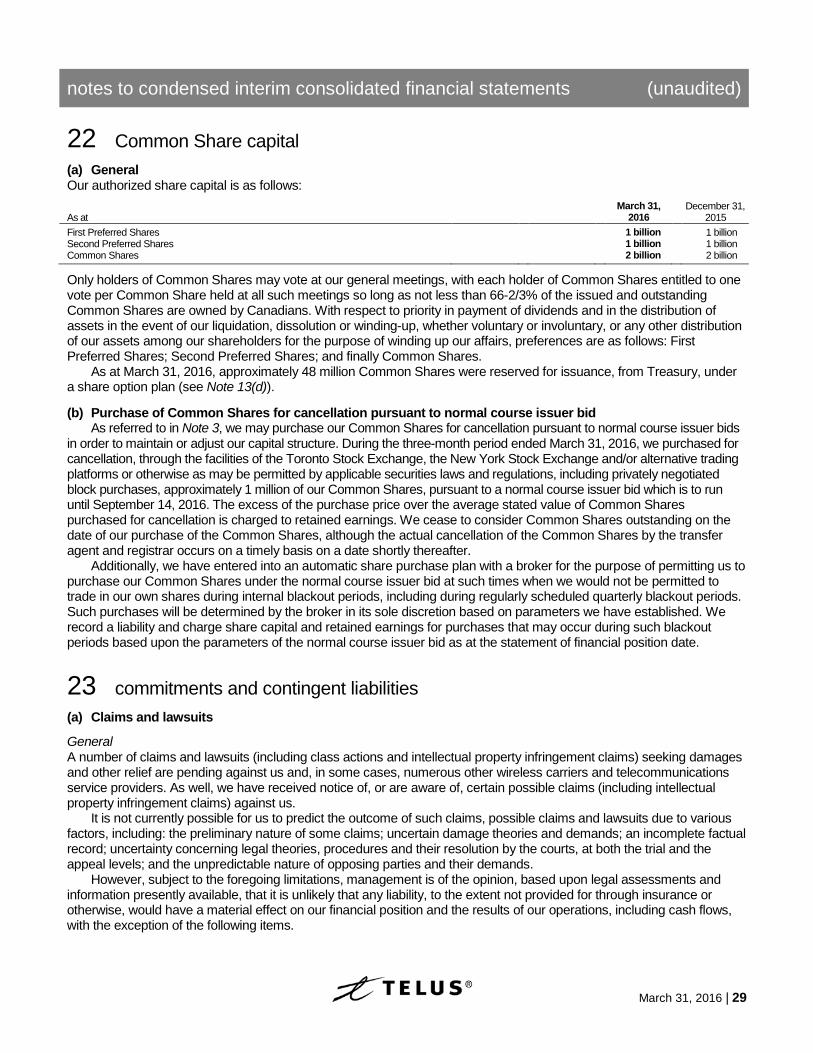
notes to condensed interim consolidated financial statements (unaudited)
March 31, 2016 | 29
22 21BCommon Share capital (a) General Our authorized share capital is as follows:
As at March 31,
2016 December 31,
2015 First Preferred Shares 1 billion 1 billion Second Preferred Shares 1 billion 1 billion Common Shares 2 billion 2 billion
Only holders of Common Shares may vote at our general meetings, with each holder of Common Shares entitled to one vote per Common Share held at all such meetings so long as not less than 66-2/3% of the issued and outstanding Common Shares are owned by Canadians. With respect to priority in payment of dividends and in the distribution of assets in the event of our liquidation, dissolution or winding-up, whether voluntary or involuntary, or any other distribution of our assets among our shareholders for the purpose of winding up our affairs, preferences are as follows: First Preferred Shares; Second Preferred Shares; and finally Common Shares.
As at March 31, 2016, approximately 48 million Common Shares were reserved for issuance, from Treasury, under a share option plan (see Note 13(d)).
(b) Purchase of Common Shares for cancellation pursuant to normal course issuer bid As referred to in Note 3, we may purchase our Common Shares for cancellation pursuant to normal course issuer bids
in order to maintain or adjust our capital structure. During the three-month period ended March 31, 2016, we purchased for cancellation, through the facilities of the Toronto Stock Exchange, the New York Stock Exchange and/or alternative trading platforms or otherwise as may be permitted by applicable securities laws and regulations, including privately negotiated block purchases, approximately 1 million of our Common Shares, pursuant to a normal course issuer bid which is to run until September 14, 2016. The excess of the purchase price over the average stated value of Common Shares purchased for cancellation is charged to retained earnings. We cease to consider Common Shares outstanding on the date of our purchase of the Common Shares, although the actual cancellation of the Common Shares by the transfer agent and registrar occurs on a timely basis on a date shortly thereafter.
Additionally, we have entered into an automatic share purchase plan with a broker for the purpose of permitting us to purchase our Common Shares under the normal course issuer bid at such times when we would not be permitted to trade in our own shares during internal blackout periods, including during regularly scheduled quarterly blackout periods. Such purchases will be determined by the broker in its sole discretion based on parameters we have established. We record a liability and charge share capital and retained earnings for purchases that may occur during such blackout periods based upon the parameters of the normal course issuer bid as at the statement of financial position date.
23 22Bcommitments and contingent liabilities (a) Claims and lawsuits
General A number of claims and lawsuits (including class actions and intellectual property infringement claims) seeking damages and other relief are pending against us and, in some cases, numerous other wireless carriers and telecommunications service providers. As well, we have received notice of, or are aware of, certain possible claims (including intellectual property infringement claims) against us.
It is not currently possible for us to predict the outcome of such claims, possible claims and lawsuits due to various factors, including: the preliminary nature of some claims; uncertain damage theories and demands; an incomplete factual record; uncertainty concerning legal theories, procedures and their resolution by the courts, at both the trial and the appeal levels; and the unpredictable nature of opposing parties and their demands.
However, subject to the foregoing limitations, management is of the opinion, based upon legal assessments and information presently available, that it is unlikely that any liability, to the extent not provided for through insurance or otherwise, would have a material effect on our financial position and the results of our operations, including cash flows, with the exception of the following items.
notes to condensed interim consolidated financial statements (unaudited)
30 | March 31, 2016
Certified class actions Certified class actions against us include: • A 2004 class action brought in Saskatchewan against a number of past and present wireless service providers,
including us, which alleged breach of contract, misrepresentation, unjust enrichment and violation of competition, trade practices and consumer protection legislation across Canada in connection with the collection of system access fees. In September 2007, a national class was certified by the Saskatchewan Court of Queen’s Bench in relation to the unjust enrichment claim only; all appeals of this certification decision have now been exhausted.
• A 2008 class action brought in Ontario which alleged breach of contract, breach of the Ontario Consumer Protection Act, breach of the Competition Act and unjust enrichment, in connection with our practice of “rounding up” wireless airtime to the nearest minute and charging for the full minute. In November 2014, an Ontario class was certified by the Ontario Superior Court of Justice in relation to the breach of contract, breach of Consumer Protection Act, and unjust enrichment claims; all appeals of this decision have now been exhausted.
• A 2012 class action brought in Quebec alleging that we improperly unilaterally amended customer contracts to increase various wireless rates for optional services, contrary to the Quebec Consumer Protection Act and the Civil Code of Quebec. On June 13, 2013, the Superior Court of Quebec authorized this matter as a class action. This class action follows on a non-material 2008 class action brought in Quebec alleging that we improperly unilaterally amended customer contracts to charge for incoming SMS messages. On April 8, 2014, judgment was granted in part against TELUS in the 2008 class action. We had appealed that judgment, but have now settled both the 2008 and 2012 class actions. This settlement is subject to court approval.
• A 2005 class action brought against us in British Columbia alleging that we have engaged in deceptive trade practices in charging for incoming calls from the moment the caller connects to the network, and not from the moment the incoming call is connected to the recipient. We have appealed the certification decision.
We believe that we have good defences to these actions. Should the ultimate resolution of these actions differ from management’s assessments and assumptions, a material adjustment to our financial position and the results of our operations, including cash flows, could result. Management’s assessments and assumptions include that a reliable estimate of any such exposure cannot be made considering the continued uncertainty about the causes of action and the nature of the damages that may be sought by the plaintiffs.
Uncertified class actions Uncertified class actions against us include: • A 2005 class action brought against us in Alberta alleging that we have engaged in deceptive trade practices in
charging for incoming calls from the moment the caller connects to the network, and not from the moment the incoming call is connected to the recipient. This is a companion class action to the certified 2005 British Columbia claim referenced above;
• A 2008 class action brought in Saskatchewan against us and other Canadian telecommunications carriers alleging that, among other matters, we failed to provide proper notice of 9-1-1 charges to the public and have been deceitfully passing them off as government charges. A virtually identical class action was filed in Alberta at the same time, but the Alberta Court of Queen’s Bench declared that class action expired as of 2009;
• A 2013 class action brought in British Columbia against us, other telecommunications carriers, and cellular telephone manufacturers alleging that prolonged usage of cellular telephones causes adverse health effects;
• A 2015 class action brought in Quebec against us, other telecommunications carriers, and various other defendants alleging that electromagnetic field radiation causes adverse health effects, creates a nuisance, and constitutes an abuse of right pursuant to Quebec laws;
• Class actions brought in 2014 against us in Quebec and Ontario on behalf of Public Mobile’s customers, alleging that changes to the technology, services and rate plans made by us contravene our statutory and common law obligations;
• A number of class actions against Canadian telecommunications carriers alleging various causes of action in connection with the collection of system access fees, including: • Companion class actions to the certified 2004 Saskatchewan class action, filed in eight of the nine other
Canadian provinces, the status of which is as follows: • British Columbia – dismissed; • Alberta – an application for an order that this claim has expired was dismissed in July 2015 but that decision
is under appeal;
notes to condensed interim consolidated financial statements (unaudited)
March 31, 2016 | 31
• Manitoba – stayed by the Court of Queen’s Bench, with the Court of Appeal upholding the stay on March 14, 2016; plaintiff’s counsel has advised that the plaintiff intends to seek leave to appeal this decision to the Supreme Court of Canada;
• Ontario, Quebec, New Brunswick and Newfoundland and Labrador – dormant; and • Nova Scotia – an application by other defendants to stay the class action was initially unsuccessful, but on
April 9, 2015, the Nova Scotia Court of Appeal ordered that the claim be permanently and unconditionally stayed against those defendants. The plaintiff has sought leave to appeal this decision to the Supreme Court of Canada;
• A second class action filed in 2009 in Saskatchewan by plaintiff’s counsel acting in the certified 2004 Saskatchewan class action, following the enactment of opt-out class action legislation in that province. This claim makes substantially the same allegations as the certified 2004 Saskatchewan class action, and was stayed by the court in December 2009 upon an application by the defendants to dismiss it for abuse of process, conditional on possible future changes in circumstance. The plaintiff’s separate applications to appeal and lift the stay were denied in 2013;
• A class action filed in 2011 in British Columbia alleging misrepresentation and unjust enrichment. On June 5, 2014, the B.C. Supreme Court dismissed the plaintiff’s application for certification of this class action. The plaintiff’s appeal of that decision was dismissed by the B.C. Court of Appeal on June 9, 2015. On February 11, 2016, the Supreme Court of Canada dismissed the plaintiff’s application for leave to appeal, bringing this matter to an end; and
• A class action filed in 2013 in Alberta by plaintiff’s counsel acting in the certified 2004 Saskatchewan class action. This class action appears to be a nullity, and plaintiff’s counsel filed a replacement class action in 2014. On March 10, 2015, the Alberta Court of Queen’s Bench stayed the 2014 class action on an interim basis. On October 7, 2015, the Alberta Court of Appeal allowed an appeal of this decision and stayed the 2014 class action on a permanent basis. The plaintiff has sought leave to appeal this decision to the Supreme Court of Canada.
We believe that we have good defences to these actions. Should the ultimate resolution of these actions differ from management’s assessments and assumptions, a material adjustment to our financial position and the results of our operations could result. Management’s assessments and assumptions include that reliable estimates of any such exposure cannot be made for the majority of these class actions considering continued uncertainty relating to the causes of action that may ultimately be pursued by the plaintiffs and certified by the courts and the nature of the damages that will be sought by the plaintiffs.
Intellectual property infringement claims Claims and possible claims received by us include:
• Notice of one potential claim received in 2007 and 2011 alleging that certain wireless products used on our network infringe two third-party patents.
• A patent infringement claim filed in Ontario in 2014 alleging that TELUS’ IPTV products infringe two third-party patents; and
• A patent infringement claim filed in Ontario in 2016 alleging that communications between devices, including cellular telephones, and base stations on TELUS’ 4G LTE network infringe three third-party patents.
We believe that we have good defences to these actions and possible claim. Should the ultimate resolution of these actions and possible claim differ from management’s assessments and assumptions, a material adjustment to our financial position and the results of our operations, including cash flows, could result. Management’s assessments and assumptions include that a reliable estimate of any such exposure cannot be made considering the continued uncertainty about the causes of action and the nature of the damages that will be sought by the plaintiffs.
(b) Concentration of labour In 2015, we commenced collective bargaining with the Telecommunications Workers Union, United Steel Workers Local Union 1944, to renew a collective agreement that expired on December 31, 2015; the expired contract covered approximately 40% of our Canadian workforce as at March 31, 2016.
notes to condensed interim consolidated financial statements (unaudited)
32 | March 31, 2016
24 23Brelated party transactions (a) Transactions with key management personnel Our key management personnel have authority and responsibility for overseeing, planning, directing and controlling our activities and consist of our Board of Directors and our Executive Leadership Team.
Total compensation expense for key management personnel, and the composition thereof, is as follows:
Three months Periods ended March 31 (millions) 2016 2015 Short-term benefits $ 3 $ 3 Post-employment pension 1 and other benefits 1 2 Share-based compensation 2 12 6 $ 16 $ 11
1 Our Executive Leadership Team members are either: members of our Pension Plan for Management and Professional Employees of TELUS Corporation and non-registered, non-contributory supplementary defined benefit pension plans; or members of one of our defined contribution pension plans.
2 For the three-month period ended March 31, 2016, share-based compensation is net of $1 (2015 – $2) of the effects of derivatives used to manage share-based compensation costs (Note 13(c)). For the three-month period ended March 31, 2016, $5 (2015 – $(1)) is included in share-based compensation representing restricted stock unit and deferred share unit expense arising from changes in the fair market value of the corresponding Common Shares, which is not affected by derivatives used to manage share-based compensation costs. For the three-month period ended March 31, 2016, share-based compensation of $2 (2015 – $NIL) was included in restructuring costs (Note 15).
As disclosed in Note 13, we made awards of share-based compensation in 2016 and 2015, including, as set out in the table following, to our key management personnel. As most of these awards are cliff-vesting or graded-vesting and have multi-year requisite service periods, the expense will be recognized ratably over a period of years and thus only a portion of the 2016 and 2015 awards are included in the amounts in the table above.
Three-month periods ended March 31 2016 2015
($ in millions)
Number of restricted
stock units Notional value 1
Grant-date fair value 1
Number of restricted
stock units Notional value 1
Grant-date fair value 1
Awarded in period 575,871 $ 23 $ 15 529,563 $ 23 $ 27
1 Notional value is determined by multiplying the Common Share price at the time of award by the number of units awarded. The grant-date fair value differs from the notional value due to the effect of some awards having fair values determined using a Monte Carlo simulation.
During the three-month period ended March 31, 2016, key management personnel (including retirees) exercised 22,491 share options (2015 – NIL share options) that had an intrinsic value of $1 million (2015 – $NIL) at the time of exercise, reflecting a weighted average price at the date of exercise of $39.29 (2015 – not applicable).
The liability amounts accrued for share-based compensation awards to key management personnel are as follows:
As at (millions) March 31,
2016 December 31,
2015 Restricted stock units $ 29 $ 21 Deferred share units 1 30 29 $ 59 $ 50
1 Our Directors’ Deferred Share Unit Plan provides that, in addition to his or her annual equity grant of deferred share units, a director may elect to receive his or her annual retainer and meeting fees in deferred share units, Common Shares or cash. Deferred share units entitle directors to a specified number of, or a cash payment based on the value of, our Common Shares. Deferred share units are paid out when a director ceases to be a director, for any reason, at a time elected by the director in accordance with the Directors’ Deferred Share Unit Plan; during the three-month period ended March 31, 2016, $3 (2015 – $NIL) was paid out.
Employment agreements with members of the Executive Leadership Team typically provide for severance payments if an executive’s employment is terminated without cause: generally 18–24 months of base salary, benefits and accrual of pension service in lieu of notice and 50% of base salary in lieu of an annual cash bonus. In the event of a change in control, the Executive Leadership Team members are not entitled to treatment any different than that given to our other employees with respect to non-vested share-based compensation.
(b) Transactions with defined benefit pension plans During the three-month period ended March 31, 2016, we provided management and administrative services to our defined benefit pension plans; the charges for these services were on a cost recovery basis and amounted to $2 million (2015 – $2 million).
notes to condensed interim consolidated financial statements (unaudited)
March 31, 2016 | 33
(c) Transactions with real estate joint ventures During the three-month periods ended March 31, 2016 and 2015, we had transactions with the real estate joint ventures, which are related parties, as set out in Note 18.
25 24Badditional financial information (a) Statements of financial position
As at (millions) Note March 31,
2016 December 31,
2015 Accounts receivable Customer accounts receivable 4(a) $ 1,178 $ 1,199 Accrued receivables – customer 129 128 Allowance for doubtful accounts 4(a) (52) (52) 1,255 1,275 Accrued receivables – other 106 153 $ 1,361 $ 1,428 Inventories 1 Wireless handsets, parts and accessories $ 298 $ 319 Other 43 41 $ 341 $ 360 Other long-term assets Pension assets $ 263 $ 356 Investments 70 69 Real estate joint ventures 18(c) 25 25 Real estate joint venture advances 18(c) 7 3 Other 150 140 $ 515 $ 593 Accounts payable and accrued liabilities Accrued liabilities $ 844 $ 843 Payroll and other employee related liabilities 235 410 Restricted stock units liability 67 58 1,146 1,311 Trade accounts payable 454 476 Interest payable 139 134 Other 84 69 $ 1,823 $ 1,990 Advance billings and customer deposits Advance billings $ 698 $ 706 Regulatory deferral accounts 13 16 Deferred customer activation and connection fees 18 19 Customer deposits 29 19 $ 758 $ 760 Other long-term liabilities Pension and other post-retirement liabilities $ 461 $ 451 Other 150 150 Restricted stock units and deferred share units liabilities 71 57 682 658 Deferred customer activation and connection fees 28 30 $ 710 $ 688
1 Cost of goods sold for the three-month period ended March 31, 2016, was $403 (2015 – $388).
notes to condensed interim consolidated financial statements (unaudited)
34 | March 31, 2016
(b) Statements of cash flows – operating activities and investing activities
Three months Periods ended March 31 (millions) Note 2016 2015 Net change in non-cash operating working capital Accounts receivable $ 67 $ 96 Inventories 19 5 Prepaid expenses (112) (135) Accounts payable and accrued liabilities (145) (99) Income and other taxes receivable and payable, net (106) 103 Advance billings and customer deposits (2) (12) Provisions (22) (12) $ (301) $ (54) Cash payments for capital assets, excluding spectrum licences Capital asset additions, excluding spectrum licences Gross capital expenditures Property, plant and equipment 16 $ (468) $ (510) Intangible assets 17 (154) (125) (622) (635) Additions arising from non-monetary transactions 4 — Capital expenditures (618) (635) Change in associated non-cash investing working capital (28) 22 $ (646) $ (613)
(c) Changes in liabilities arising from financing activities
Statement of cash flows Non-cash changes
(millions) Beginning of period
Issued or received
Redemptions, repayments or
payments
Foreign exchange movement (Note 4(e)) Other
End of period
THREE-MONTH PERIOD ENDED MARCH 31, 2015 Dividends paid to holders of Common Shares $ 244 $ — $ (244) $ — $ 243 $ 243 Purchase of Common Shares for cancellation
(excluding changes in liability for automatic share purchase plan) $ 3 $ — $ (156) $ — $ 156 $ 3
Long-term debt TELUS Corporation notes $ 8,437 $ 1,747 $ — $ — $ (7) $ 10,177 TELUS Corporation commercial paper 130 990 (601) — — 519 TELUS Corporation credit facility — 110 (110) — — — $ 8,567 $ 2,847 $ (711) $ — $ (7) $ 10,696
THREE-MONTH PERIOD ENDED MARCH 31, 2016 Dividends paid to holders of Common Shares $ 263 $ — $ (263) $ — $ 261 $ 261 Purchase of Common Shares for cancellation
(excluding changes in liability for automatic share purchase plan) $ 10 $ — $ (60) $ — $ 50 $ —
Long-term debt TELUS Corporation notes $ 11,164 $ — $ — $ — $ 2 $ 11,166 TELUS Corporation commercial paper 256 1,246 (573) (38) — 891 Derivatives used to manage currency risks arising
from U.S. dollar denominated commercial paper – liability (asset) (14) 573 (571) 38 — 26
TELUS Communications Inc. debentures 618 — — — 1 619 12,024 1,819 (1,144) — 3 12,702 To eliminate effect of gross settlement of derivatives
used to manage currency risks arising from U.S. dollar denominated commercial paper — (573) 573 — — —
$ 12,024 $ 1,246 $ (571) $ — $ 3 $ 12,702