Embed Size (px)
Citation preview
Global Change UnitDpt. of Earth Physics and ThermodynamicsFaculty of PhysicsUniversity of Valencia
Temperature and Emissivity from AHS data in the framework of the
AGRISAR and EAGLE campaigns
J. A. Sobrino, J. A. Sobrino, J.CJ.C. . JimJimééneznez--MuMuññoz, V. Hidalgo, A. Barellaoz, V. Hidalgo, A. Barella--Ortiz, Ortiz, G. Sòria, M. Romaguera and B. FranchG. Sòria, M. Romaguera and B. Franch
AGRISAR and EAGLE Campaigns Final Workshop15-16 October 2007 (ESA/ESTEC, Noordwijk, The Netherlands)
PRESENTATION SCHEMEPRESENTATION SCHEME
1. OBJECTIVES1. OBJECTIVES
2. METHODOLOGY2. METHODOLOGY
3. ON3. ON--GROUND CALIBRATION OF AHS TIR BANDSGROUND CALIBRATION OF AHS TIR BANDS
4. LAND SURFACE TEMPERATURE/EMISSIVITY RETRIEVAL4. LAND SURFACE TEMPERATURE/EMISSIVITY RETRIEVAL
5. SIMPLIFIED METHOD FOR ET RETRIEVAL5. SIMPLIFIED METHOD FOR ET RETRIEVAL
6. EFFECTS OF CLOUDS/SHADOWS: BRIEF ANALYSIS6. EFFECTS OF CLOUDS/SHADOWS: BRIEF ANALYSIS
7. CONCLUSIONS7. CONCLUSIONS
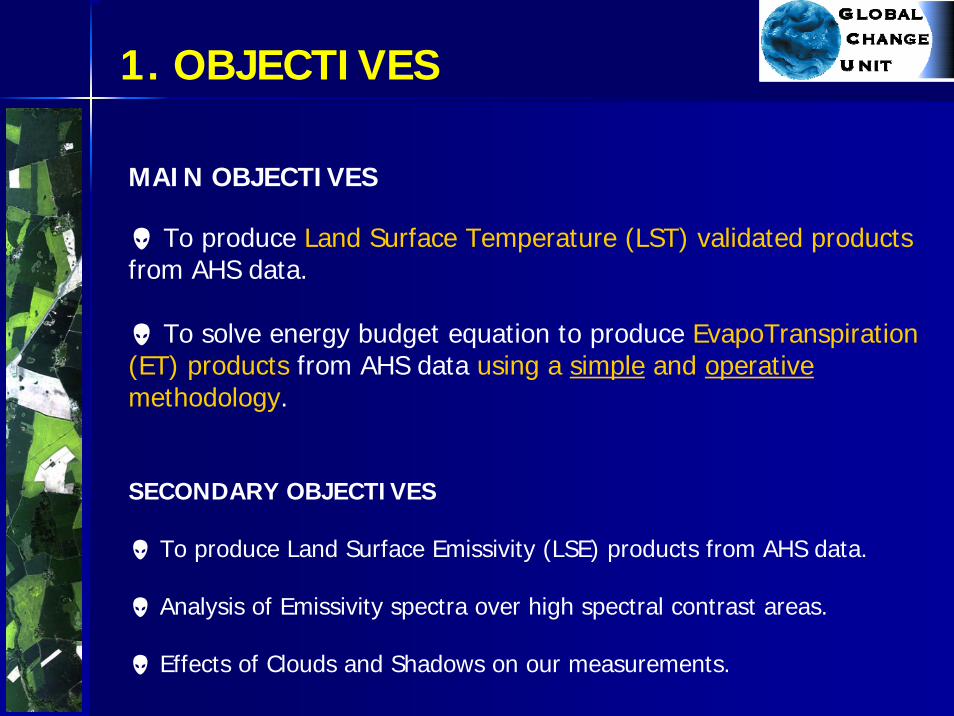
1. OBJECTIVES
MAIN OBJECTIVES
To produce Land Surface Temperature (LST) validated productsfrom AHS data.
To solve energy budget equation to produce EvapoTranspiration (ET) products from AHS data using a simple and operativemethodology.
SECONDARY OBJECTIVES
To produce Land Surface Emissivity (LSE) products from AHS data.
Analysis of Emissivity spectra over high spectral contrast areas.
Effects of Clouds and Shadows on our measurements.
1. OBJECTIVES1. OBJECTIVES
2. METHODOLOGY2. METHODOLOGY
3. ON3. ON--GROUND CALIBRATION OF AHS TIR BANDSGROUND CALIBRATION OF AHS TIR BANDS
4. LAND SURFACE TEMPERATURE/EMISSIVITY RETRIEVAL4. LAND SURFACE TEMPERATURE/EMISSIVITY RETRIEVAL
5. SIMPLIFIED METHOD FOR ET RETRIEVAL5. SIMPLIFIED METHOD FOR ET RETRIEVAL
6. EFFECTS OF CLOUDS/SHADOWS: BRIEF ANALYSIS6. EFFECTS OF CLOUDS/SHADOWS: BRIEF ANALYSIS
7. CONCLUSIONS7. CONCLUSIONS
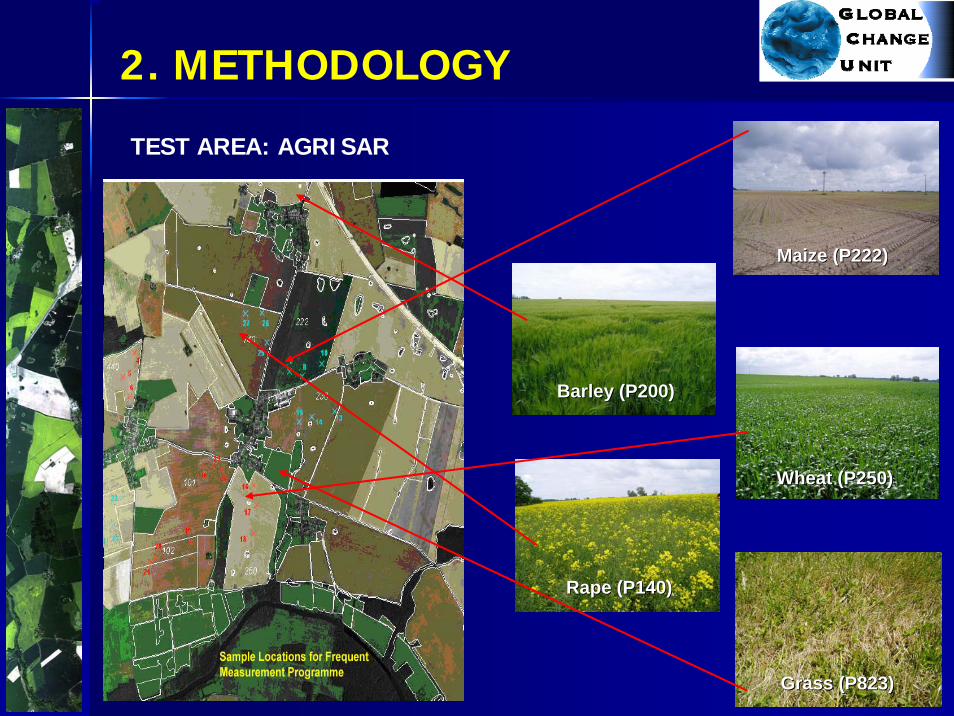
2. METHODOLOGY
TEST AREA: AGRISAR
RapeRape (P140)(P140)
MaizeMaize (P222)(P222)
WheatWheat (P250(P250))
BarleyBarley (P200)(P200)
GrassGrass (P823)(P823)
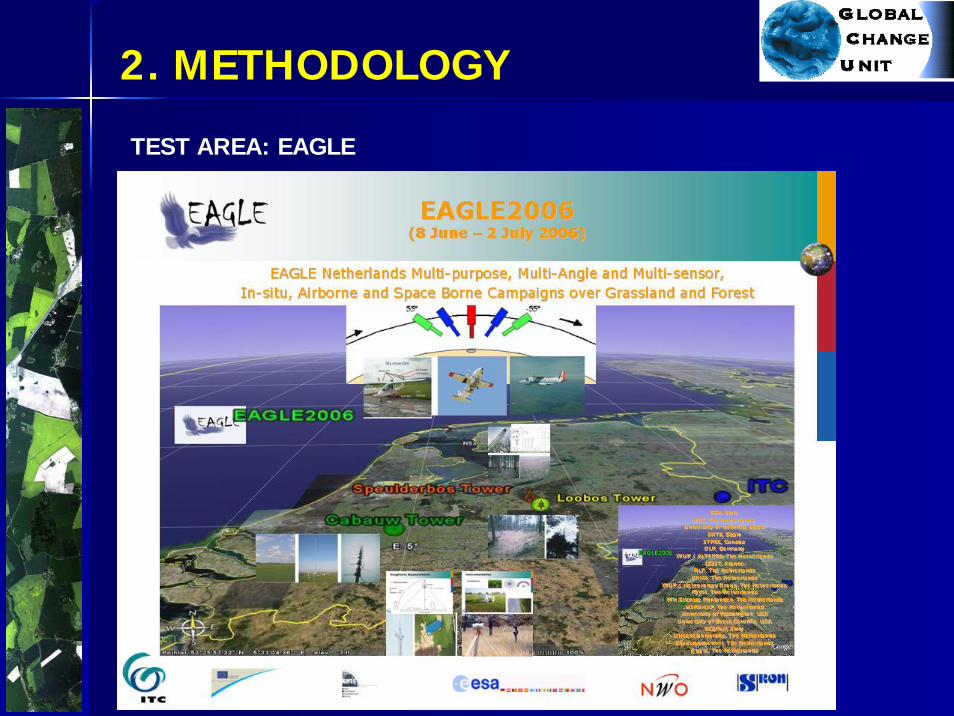
2. METHODOLOGY
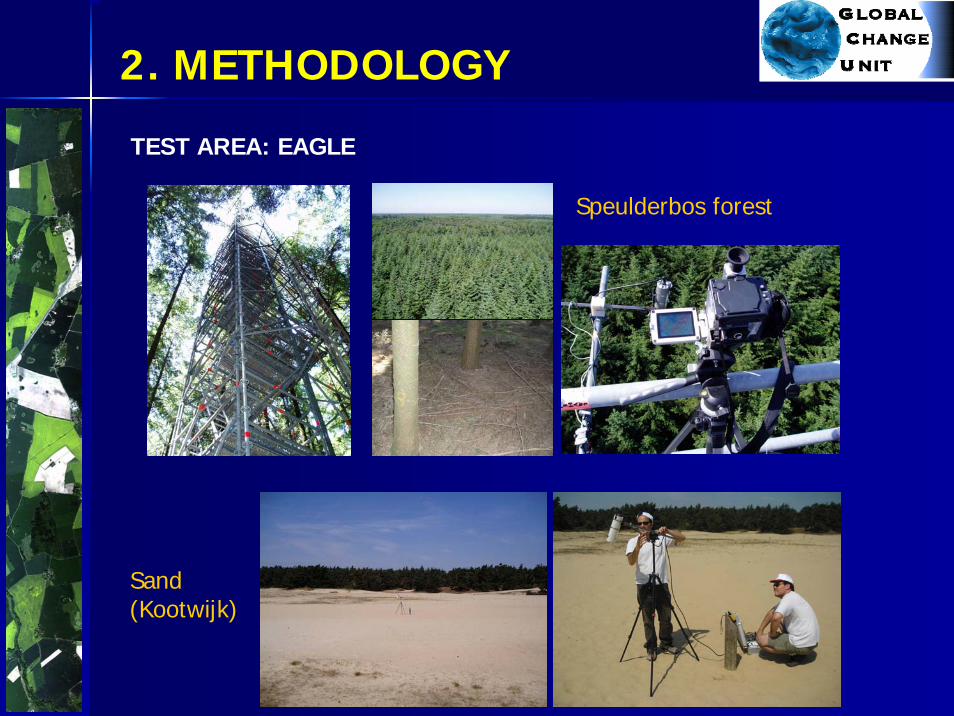
TEST AREA: EAGLE
2. METHODOLOGY
TEST AREA: EAGLE
Speulderbos forest
Sand(Kootwijk)
2. METHODOLOGY
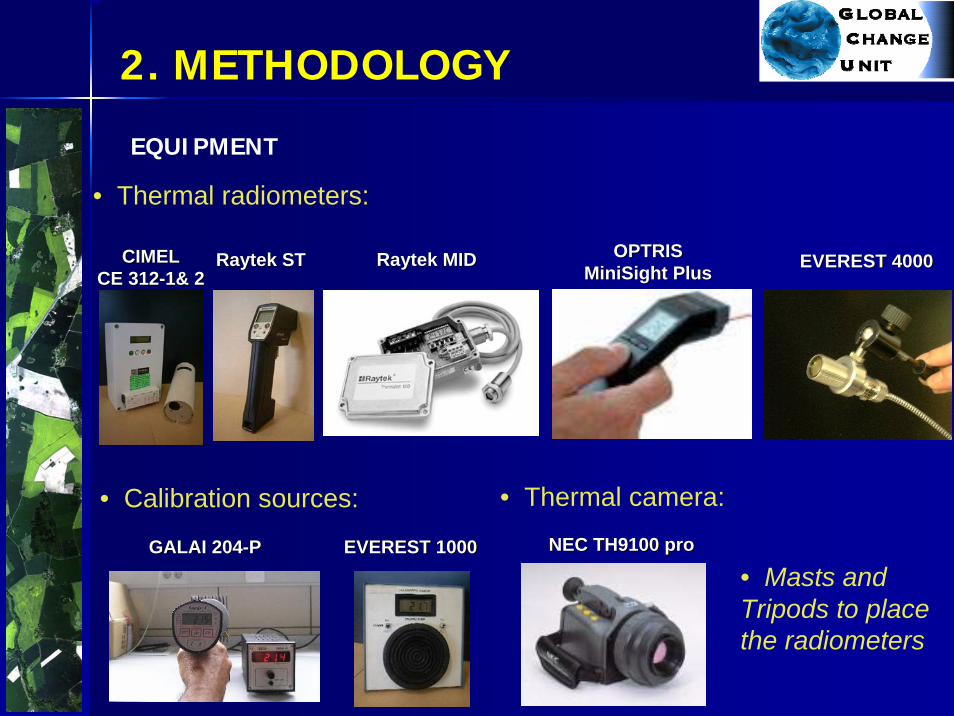
EQUIPMENT
• Thermal radiometers:
• Calibration sources:
GALAI 204GALAI 204--PP EVEREST 1000EVEREST 1000
EVEREST 4000EVEREST 4000RaytekRaytek STST RaytekRaytek MIDMID OPTRIS OPTRIS MiniSightMiniSight PlusPlus
CIMEL CIMEL CE 312CE 312--1& 21& 2
• Thermal camera:
NEC TH9100 proNEC TH9100 pro
• Masts and Tripods to place the radiometers
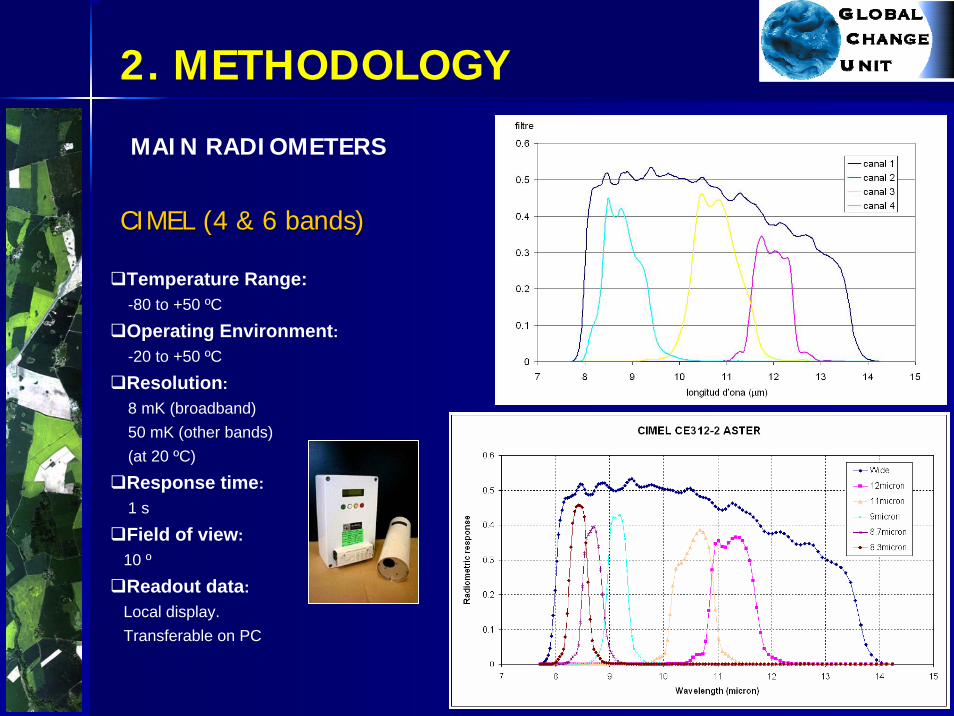
CIMEL (4 & 6 bands)CIMEL (4 & 6 bands)
Temperature Range:-80 to +50 ºC
Operating Environment:-20 to +50 ºC
Resolution:8 mK (broadband)50 mK (other bands)(at 20 ºC)
Response time:1 s
Field of view:10 º
Readout data:Local display. Transferable on PC
2. METHODOLOGY
MAIN RADIOMETERS
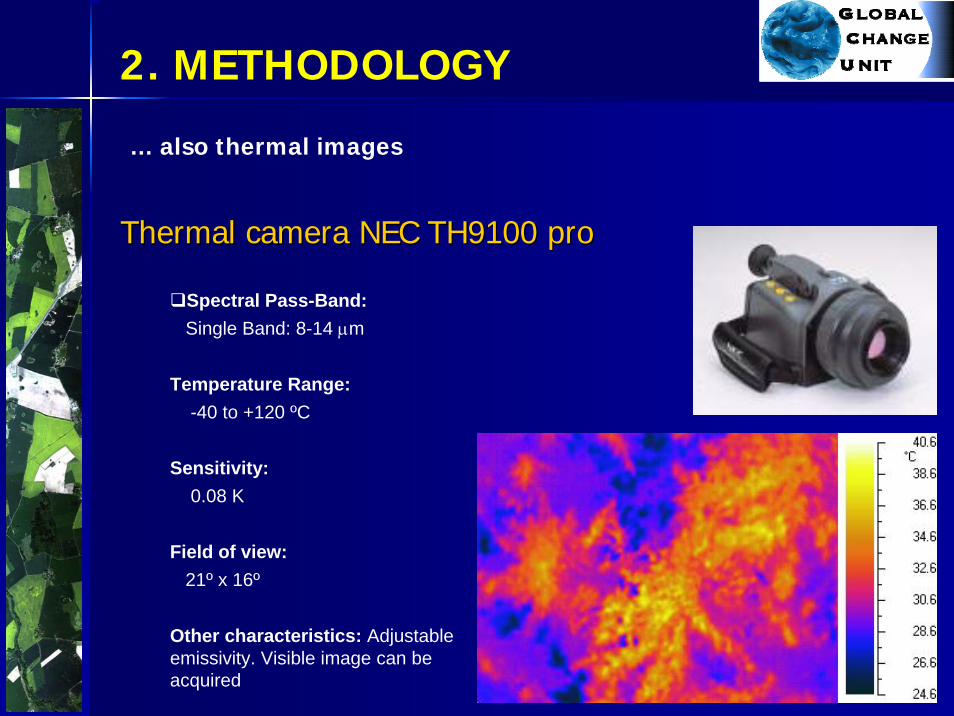
ThermalThermal camera NEC TH9100 procamera NEC TH9100 pro
Spectral Pass-Band:Single Band: 8-14 μm
Temperature Range:-40 to +120 ºC
Sensitivity:0.08 K
Field of view:21º x 16º
Other characteristics: Adjustableemissivity. Visible image can be acquired
2. METHODOLOGY
... also thermal images
2. METHODOLOGY
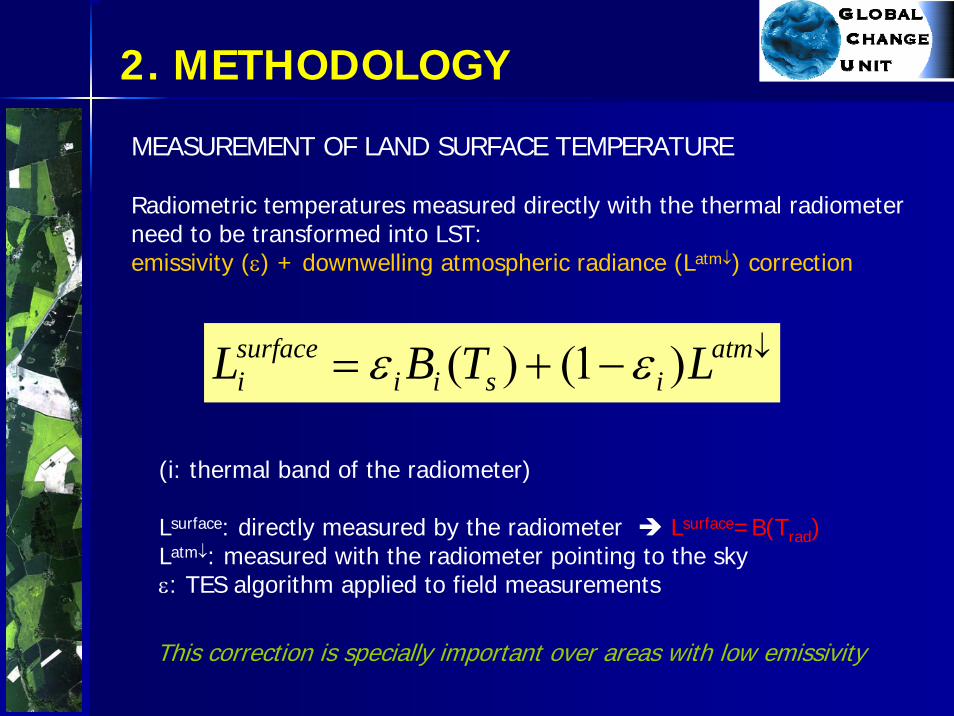
MEASUREMENT OF LAND SURFACE TEMPERATURE
Radiometric temperatures measured directly with the thermal radiometerneed to be transformed into LST: emissivity (ε) + downwelling atmospheric radiance (Latm↓) correction
↓−+= atmisii
surfacei LTBL )1()( εε
(i: thermal band of the radiometer)
Lsurface: directly measured by the radiometer Lsurface=B(Trad)Latm↓: measured with the radiometer pointing to the skyε: TES algorithm applied to field measurements
This correction is specially important over areas with low emissivity
2. METHODOLOGY
15
20
25
30
11:06 12:07 13:07 14:08 15:08 16:09 17:09 18:10Local Time
Tem
pera
ture
(ºC
)
RadiometricCorrected (LST)
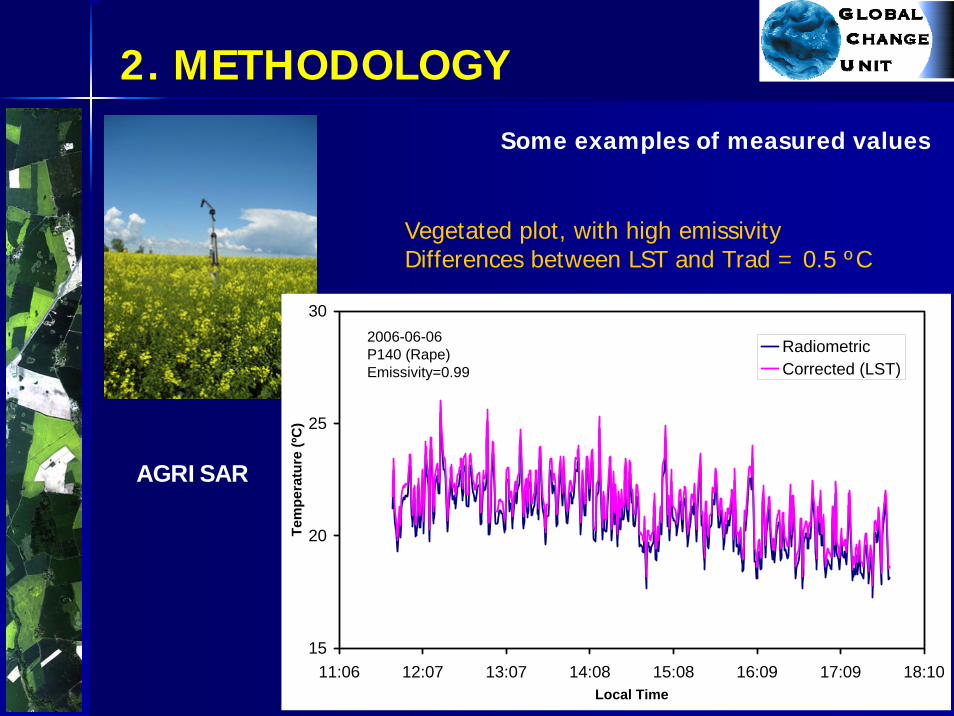
2006-06-06P140 (Rape)Emissivity=0.99
Vegetated plot, with high emissivityDifferences between LST and Trad = 0.5 ºC
Some examples of measured values
AGRISAR
2. METHODOLOGY
15
20
25
30
35
40
45
9:50 10:04 10:19 10:33 10:48 11:02 11:16 11:31 11:45 12:00Local Time
Tem
pera
ture
(ºC
)
RadiometricCorrected (LST)
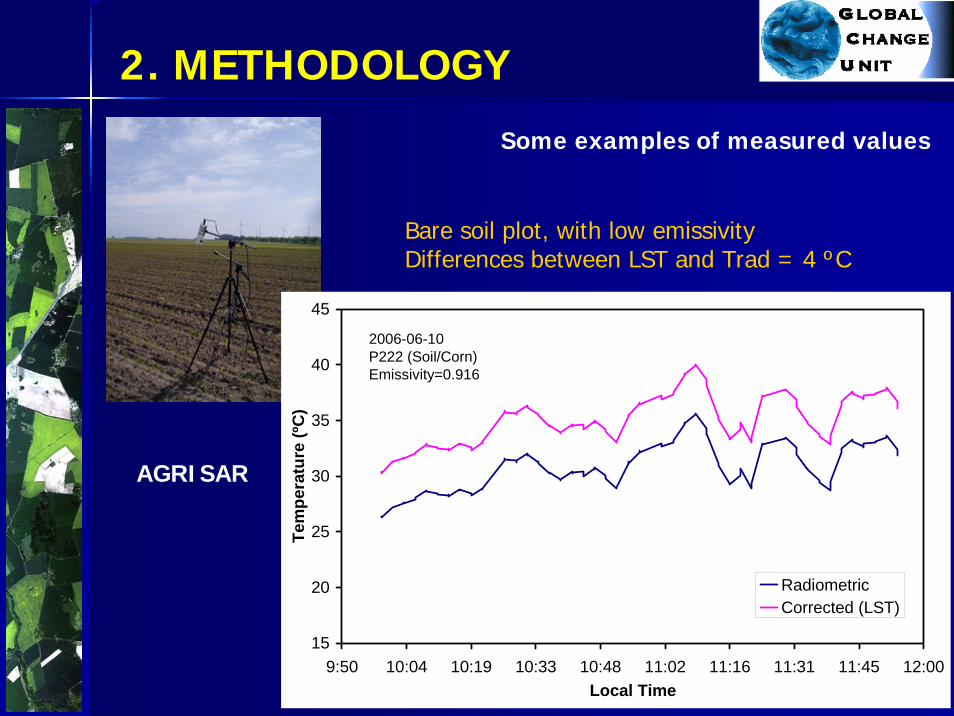
2006-06-10P222 (Soil/Corn)Emissivity=0.916
Bare soil plot, with low emissivityDifferences between LST and Trad = 4 ºC
Some examples of measured values
AGRISAR
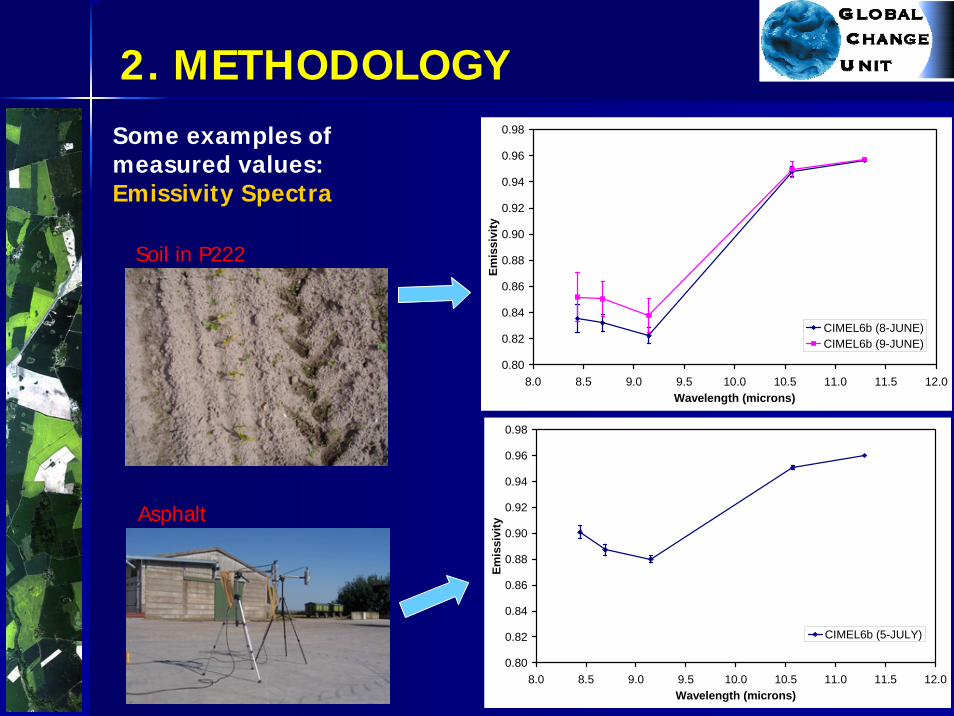
2. METHODOLOGYSome examples ofmeasured values:Emissivity Spectra
0.80
0.82
0.84
0.86
0.88
0.90
0.92
0.94
0.96
0.98
8.0 8.5 9.0 9.5 10.0 10.5 11.0 11.5 12.0Wavelength (microns)
Emis
sivi
ty
CIMEL6b (8-JUNE)CIMEL6b (9-JUNE)
0.80
0.82
0.84
0.86
0.88
0.90
0.92
0.94
0.96
0.98
8.0 8.5 9.0 9.5 10.0 10.5 11.0 11.5 12.0Wavelength (microns)
Emis
sivi
ty
CIMEL6b (5-JULY)
Asphalt
Soil in P222
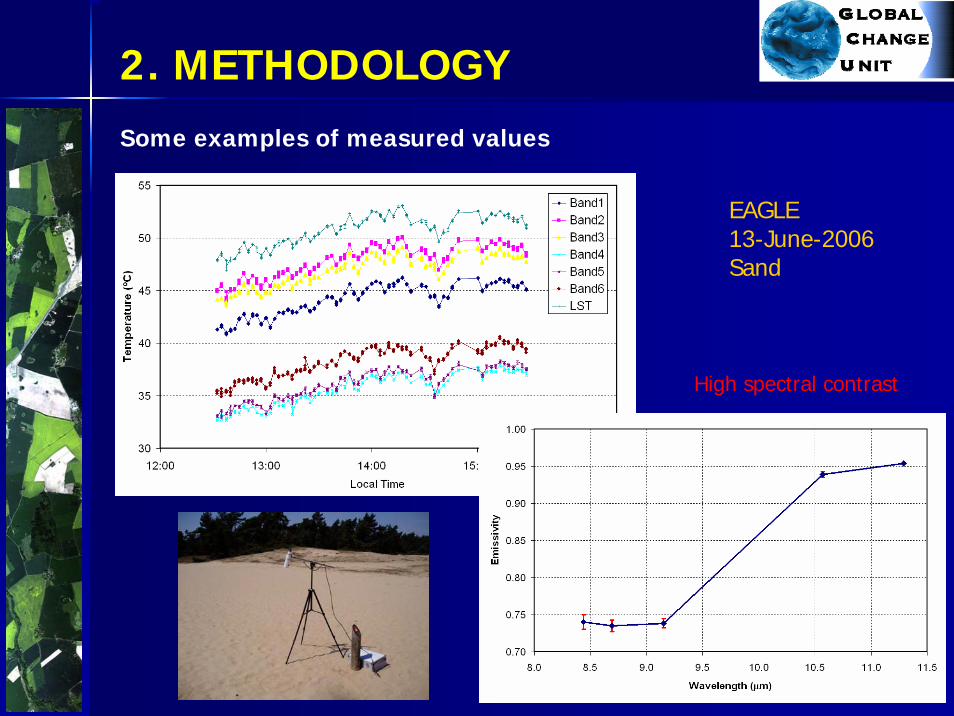
2. METHODOLOGYSome examples of measured values
EAGLE13-June-2006Sand
High spectral contrast
2. METHODOLOGY
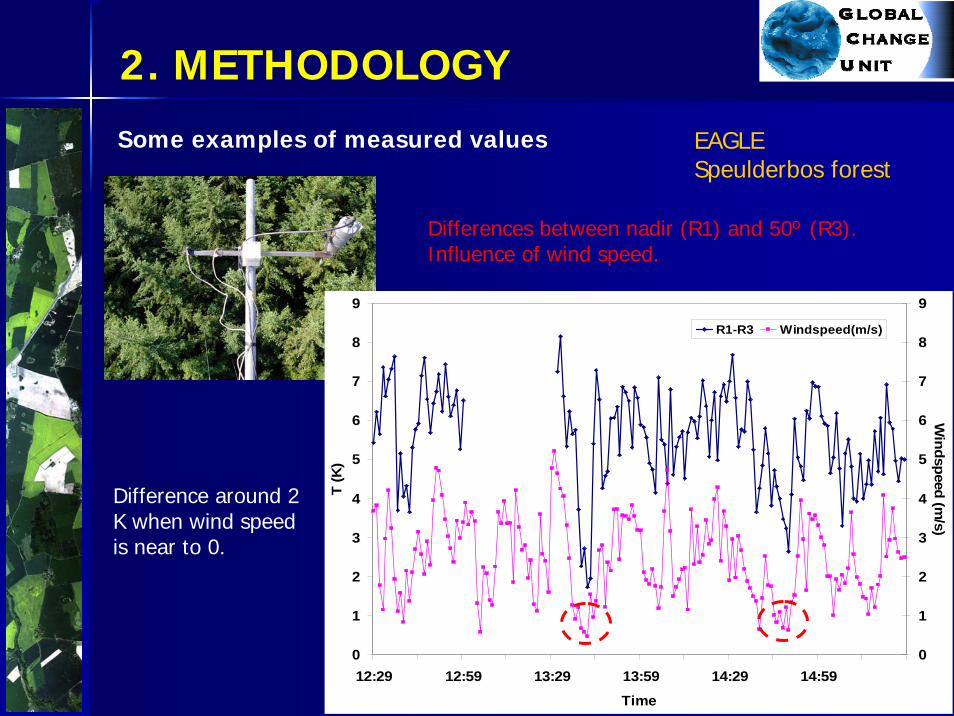
Some examples of measured values EAGLESpeulderbos forest
Differences between nadir (R1) and 50º (R3). Influence of wind speed.
Difference around 2 K when wind speedis near to 0.
0
1
2
3
4
5
6
7
8
9
12:29 12:59 13:29 13:59 14:29 14:59
Time
T (K
)
0
1
2
3
4
5
6
7
8
9
Windspeed (m
/s)
R1-R3 Windspeed(m/s)
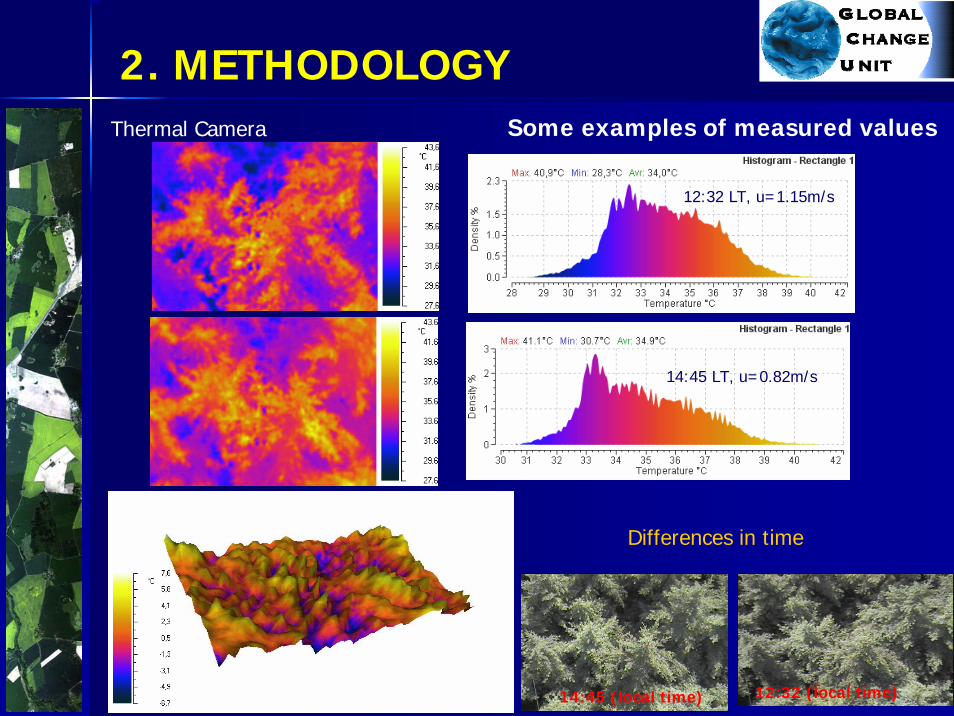
2. METHODOLOGY
12:32 LT, u=1.15m/s
14:45 LT, u=0.82m/s
12:32 (local time)14:45 (local time)
Differences in time
Some examples of measured valuesThermal Camera
2. METHODOLOGY
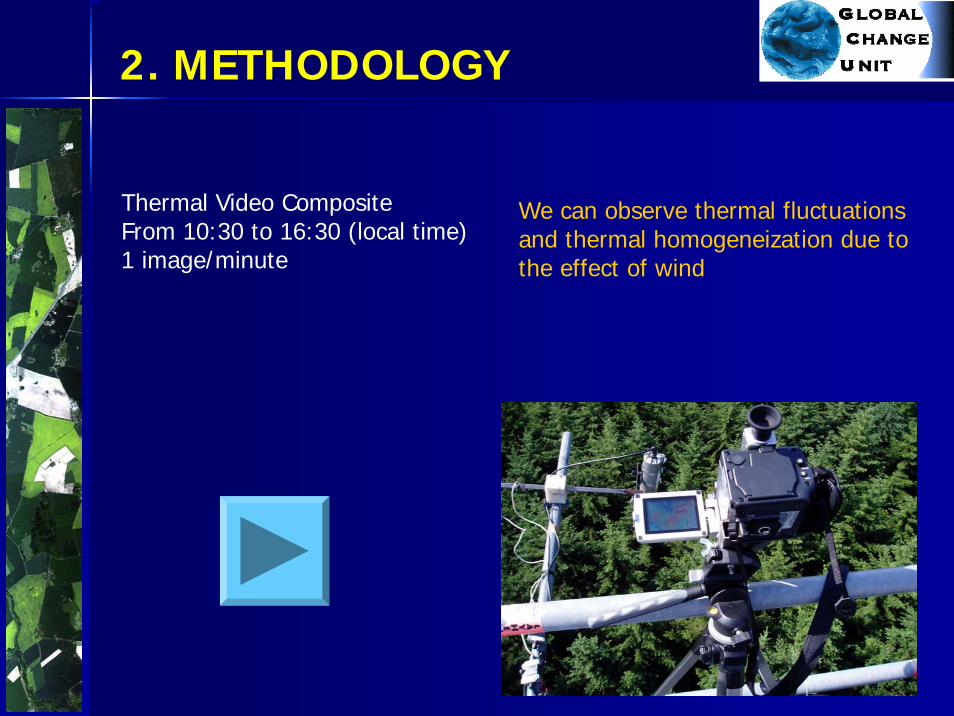
Thermal Video CompositeFrom 10:30 to 16:30 (local time)1 image/minute
We can observe thermal fluctuationsand thermal homogeneization due tothe effect of wind
2. METHODOLOGY
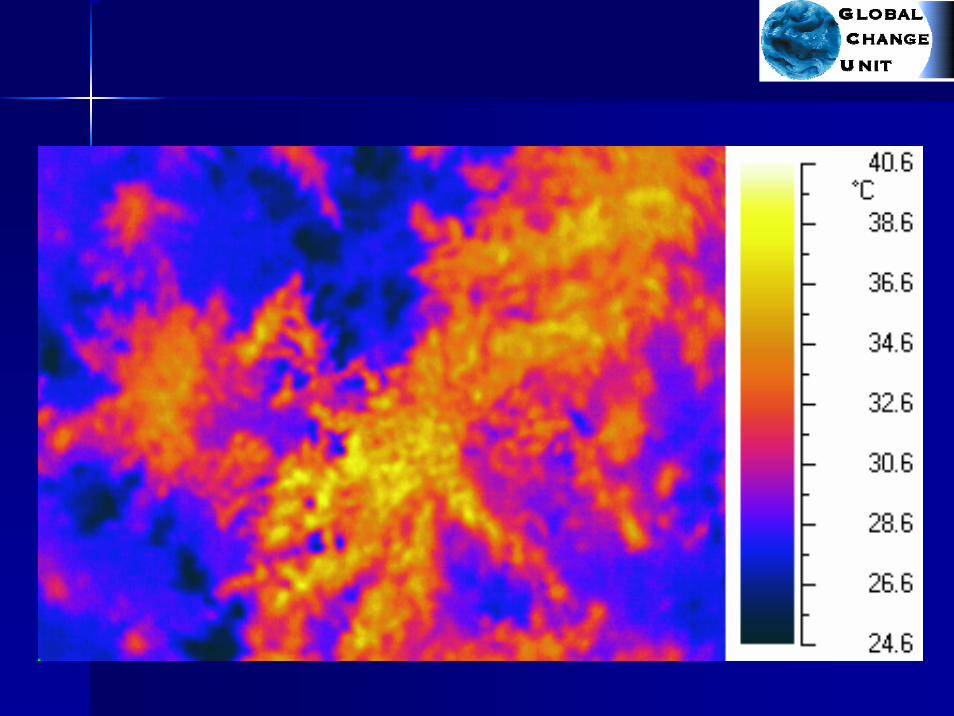
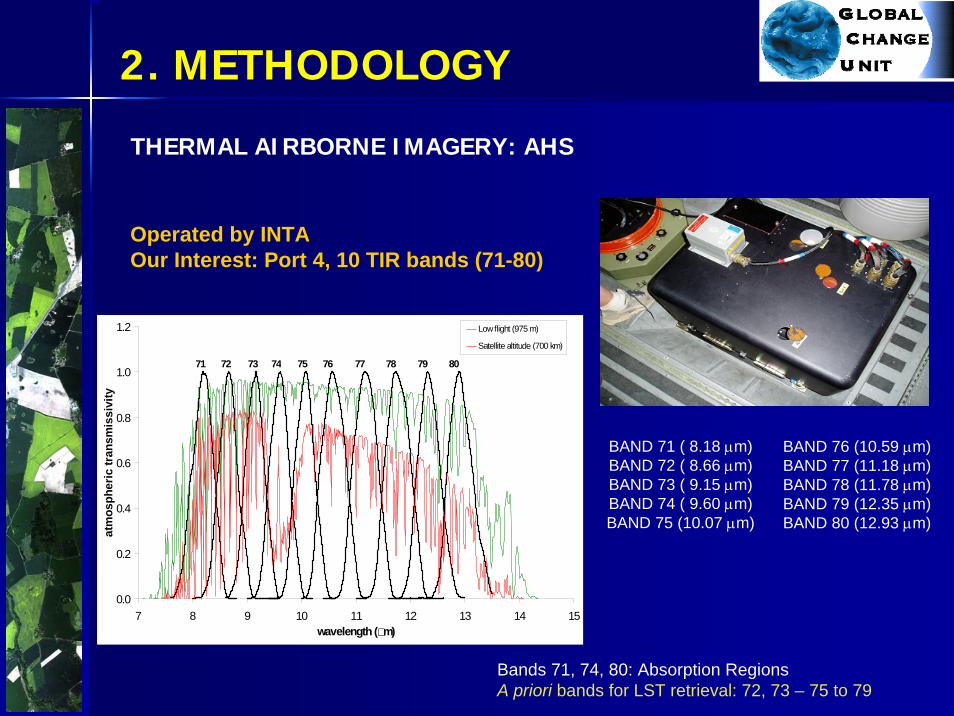
THERMAL AIRBORNE IMAGERY: AHS
0.0
0.2
0.4
0.6
0.8
1.0
1.2
7 8 9 10 11 12 13 14 15wavelength ( m)
atm
osph
eric
tran
smis
sivi
ty
Low flight (975 m)
Satellite altitude (700 km)
71 72 7473 75 76 77 7978 80
Operated by INTA Our Interest: Port 4, 10 TIR bands (71-80)
BAND 71 ( 8.18 μm)BAND 72 ( 8.66 μm)BAND 73 ( 9.15 μm)BAND 74 ( 9.60 μm)BAND 75 (10.07 μm)
Bands 71, 74, 80: Absorption RegionsA priori bands for LST retrieval: 72, 73 – 75 to 79
BAND 76 (10.59 μm)BAND 77 (11.18 μm)BAND 78 (11.78 μm)BAND 79 (12.35 μm)BAND 80 (12.93 μm)
2. METHODOLOGY
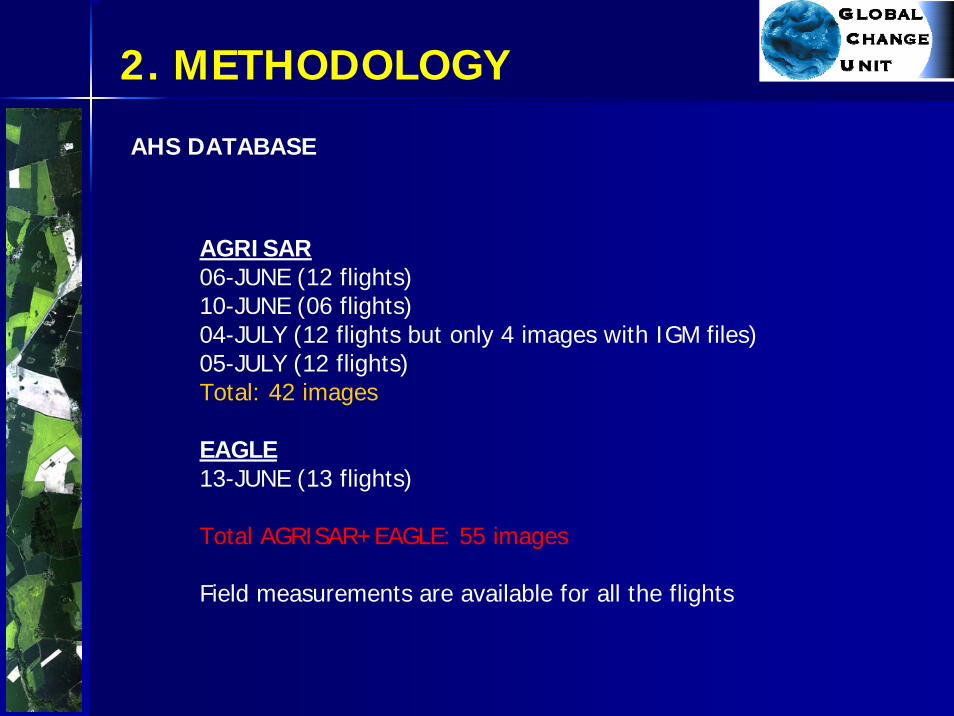
AHS DATABASE
AGRISAR06-JUNE (12 flights)10-JUNE (06 flights)04-JULY (12 flights but only 4 images with IGM files)05-JULY (12 flights)Total: 42 images
EAGLE13-JUNE (13 flights)
Total AGRISAR+EAGLE: 55 images
Field measurements are available for all the flights
1. OBJECTIVES1. OBJECTIVES
2. METHODOLOGY2. METHODOLOGY
3. ON3. ON--GROUND CALIBRATION OF AHS TIR BANDSGROUND CALIBRATION OF AHS TIR BANDS
4. LAND SURFACE TEMPERATURE/EMISSIVITY RETRIEVAL4. LAND SURFACE TEMPERATURE/EMISSIVITY RETRIEVAL
5. SIMPLIFIED METHOD FOR ET RETRIEVAL5. SIMPLIFIED METHOD FOR ET RETRIEVAL
6. EFFECTS OF CLOUDS/SHADOWS: BRIEF ANALYSIS6. EFFECTS OF CLOUDS/SHADOWS: BRIEF ANALYSIS
7. CONCLUSIONS7. CONCLUSIONS
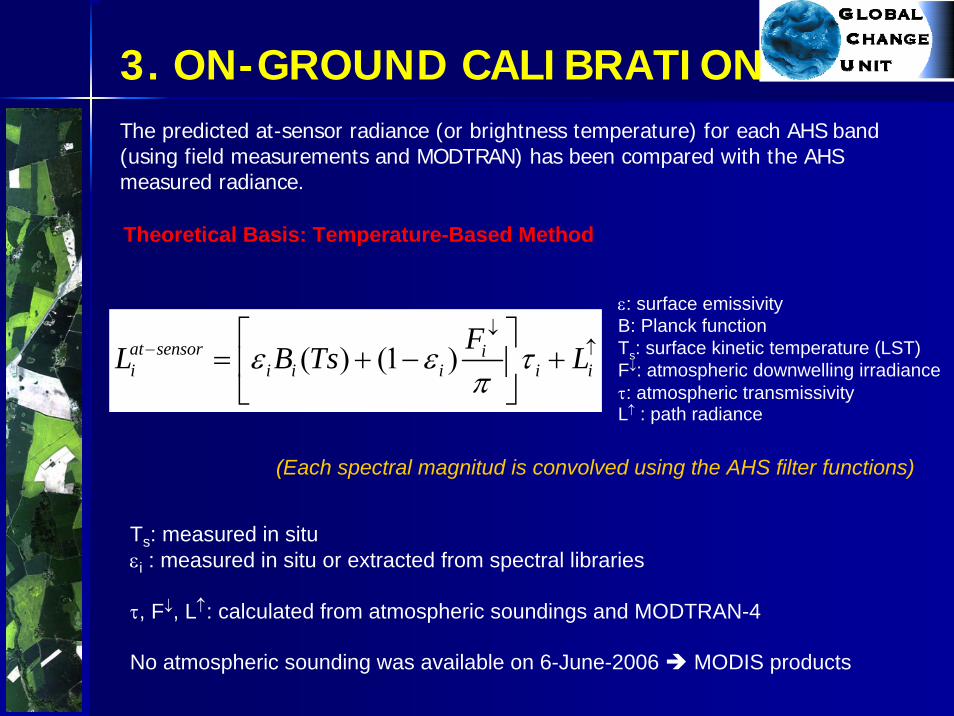
3. ON-GROUND CALIBRATIONThe predicted at-sensor radiance (or brightness temperature) for each AHS band(using field measurements and MODTRAN) has been compared with the AHS measured radiance.
Theoretical Basis: Temperature-Based Method
( ) (1 )at sensor ii i i i i
FL B Tsε ε τπ
↓
iL− ↑⎡ ⎤= + −⎢ ⎥⎣ ⎦
+ Ts: surface kinetic temperature (LST)
Ts: measured in situεi : measured in situ or extracted from spectral libraries
τ, F↓, L↑: calculated from atmospheric soundings and MODTRAN-4
No atmospheric sounding was available on 6-June-2006 MODIS products
ε: surface emissivityB: Planck function
F↓: atmospheric downwelling irradianceτ: atmospheric transmissivityL↑ : path radiance
(Each spectral magnitud is convolved using the AHS filter functions)
3. ON-GROUND CALIBRATION
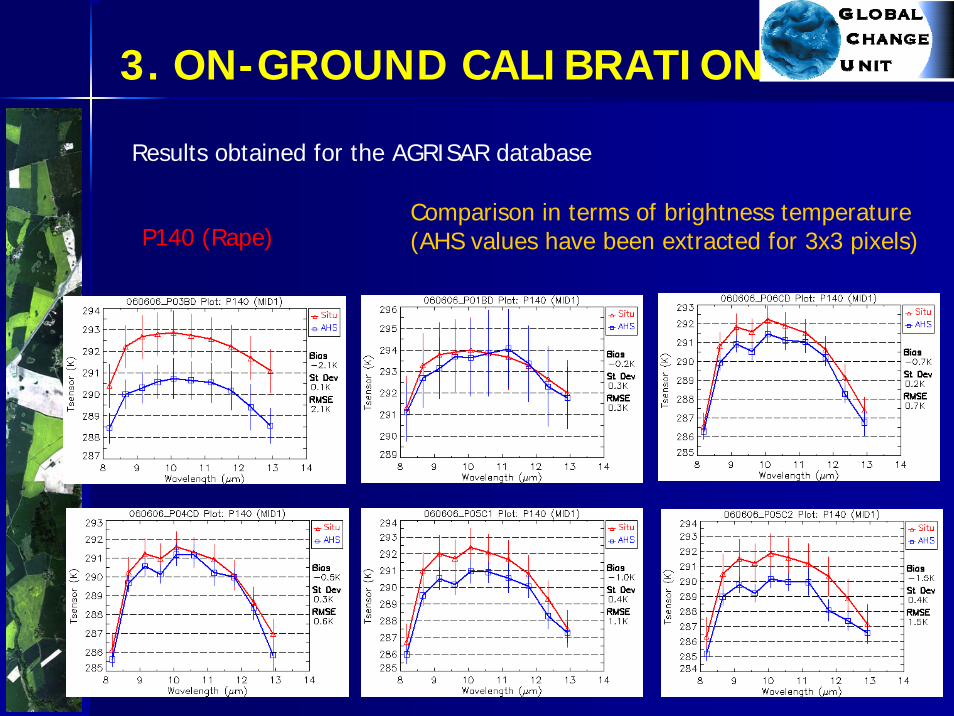
Results obtained for the AGRISAR database
P140 (Rape)Comparison in terms of brightness temperature(AHS values have been extracted for 3x3 pixels)
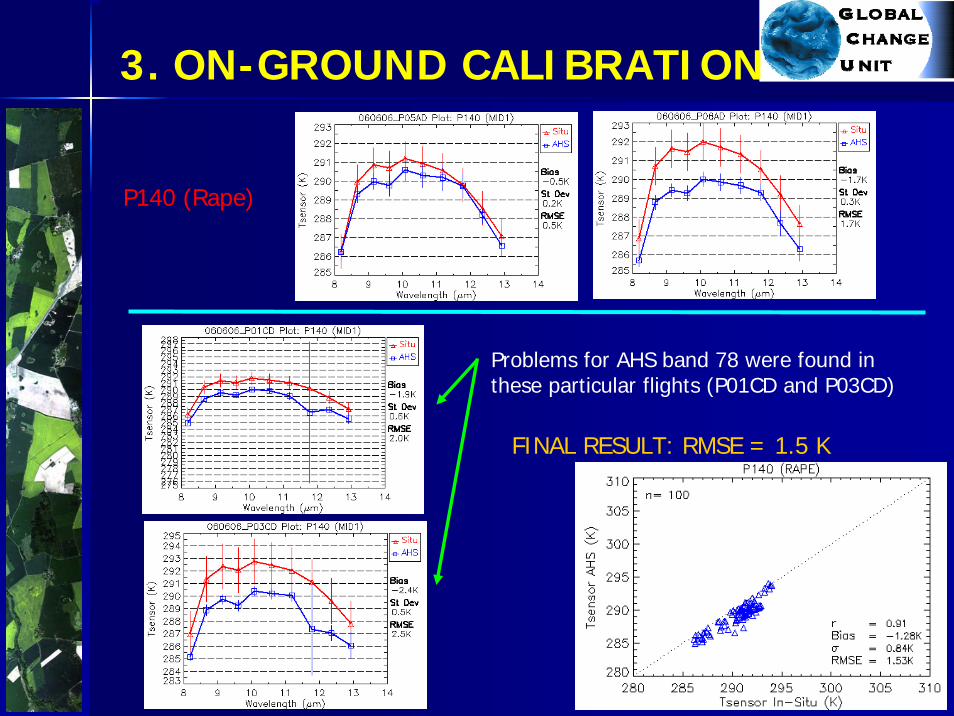
Problems for AHS band 78 were found in these particular flights (P01CD and P03CD)
3. ON-GROUND CALIBRATION
P140 (Rape)
FINAL RESULT: RMSE = 1.5 K
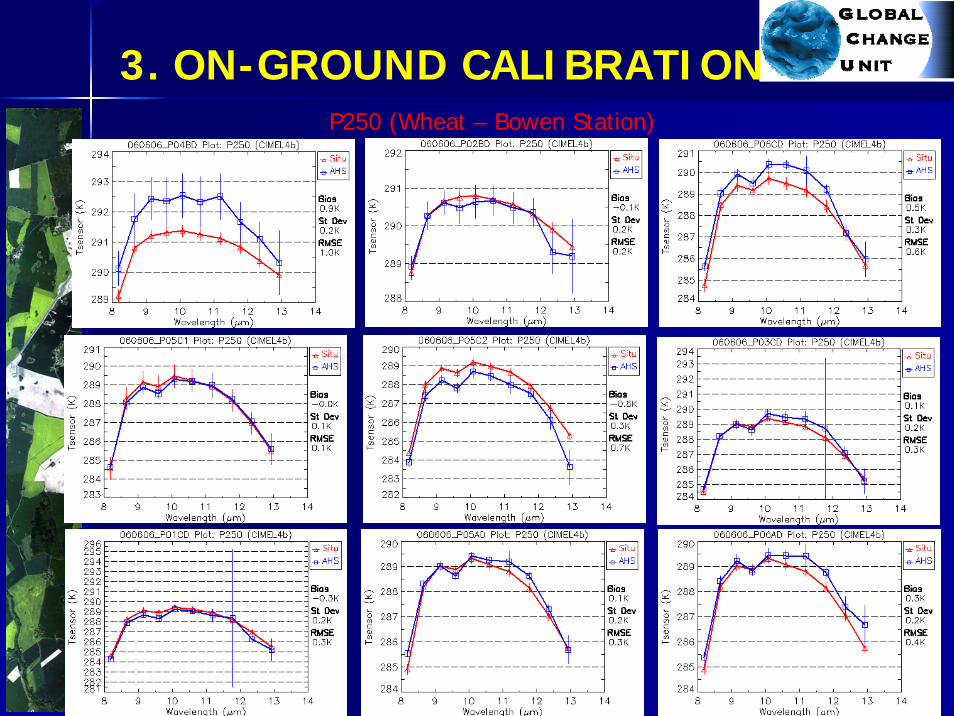
3. ON-GROUND CALIBRATIONP250 (Wheat – Bowen Station)
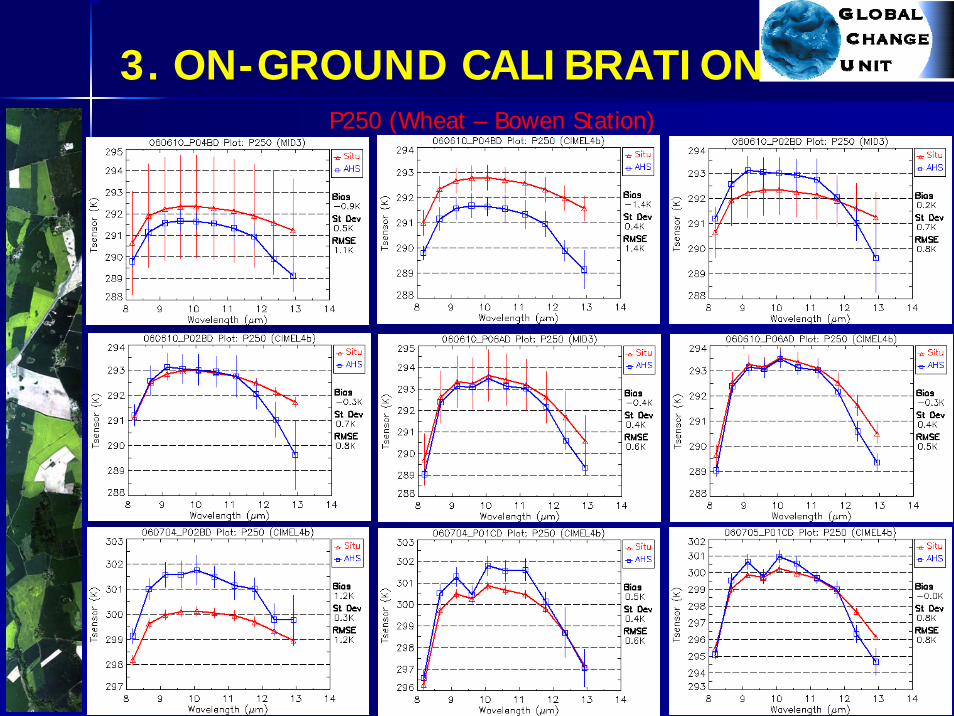
3. ON-GROUND CALIBRATIONP250 (Wheat – Bowen Station)
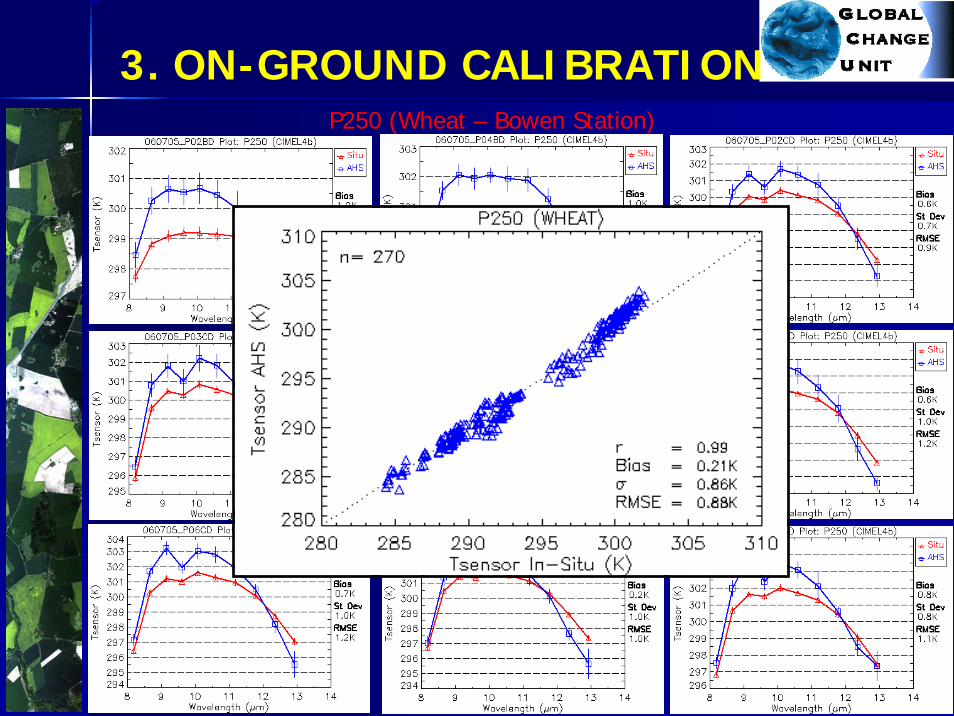
3. ON-GROUND CALIBRATIONP250 (Wheat – Bowen Station)
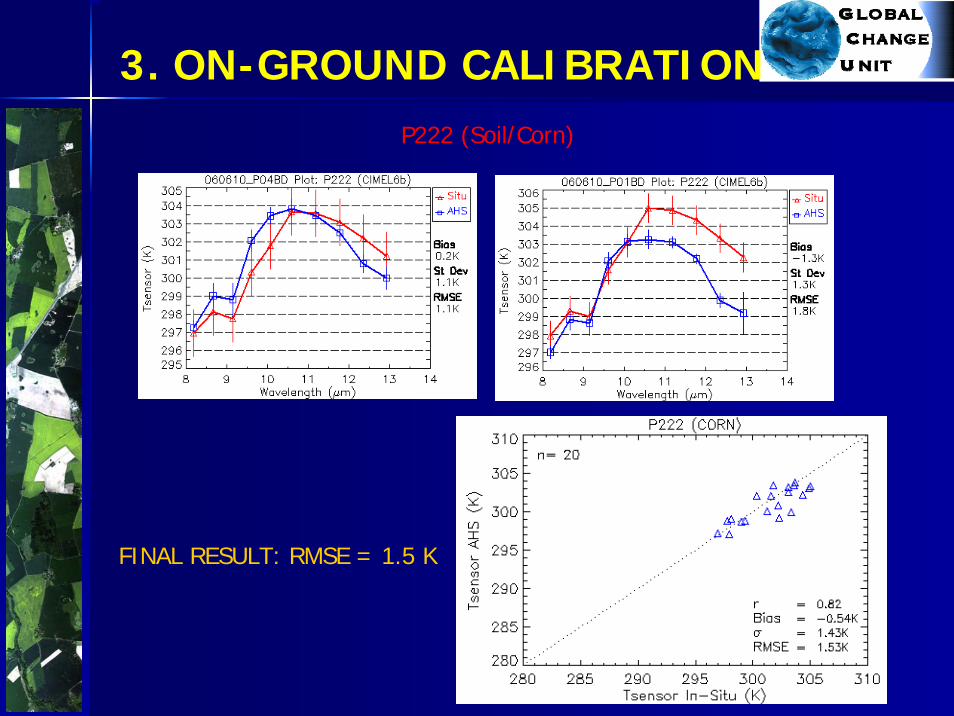
3. ON-GROUND CALIBRATIONP222 (Soil/Corn)
FINAL RESULT: RMSE = 1.5 K
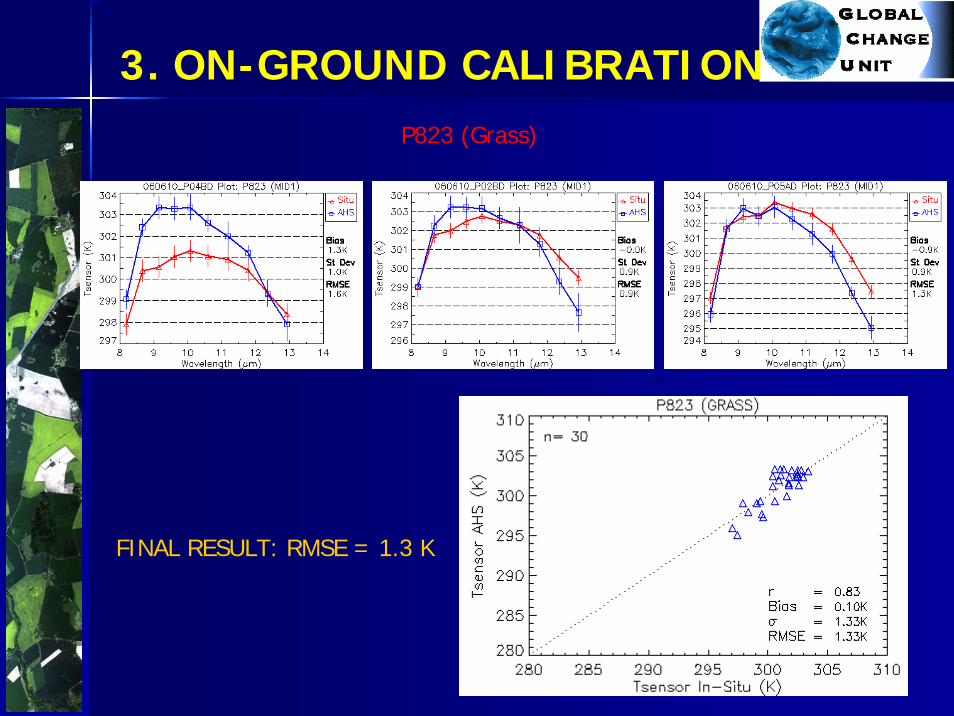
3. ON-GROUND CALIBRATION
FINAL RESULT: RMSE = 1.3 K
P823 (Grass)
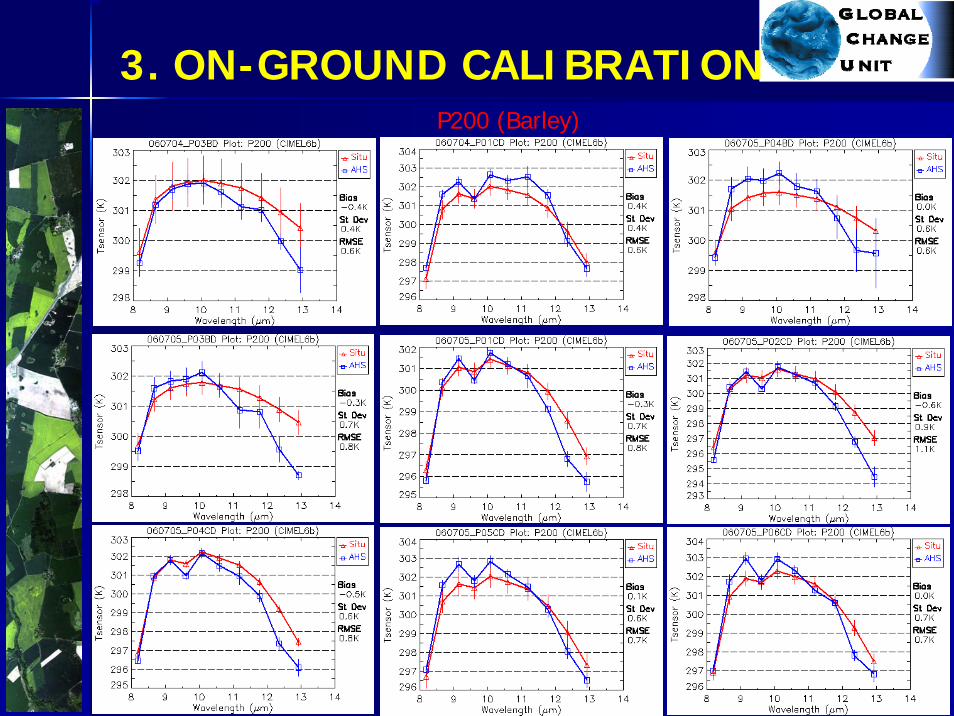
3. ON-GROUND CALIBRATIONP200 (Barley)
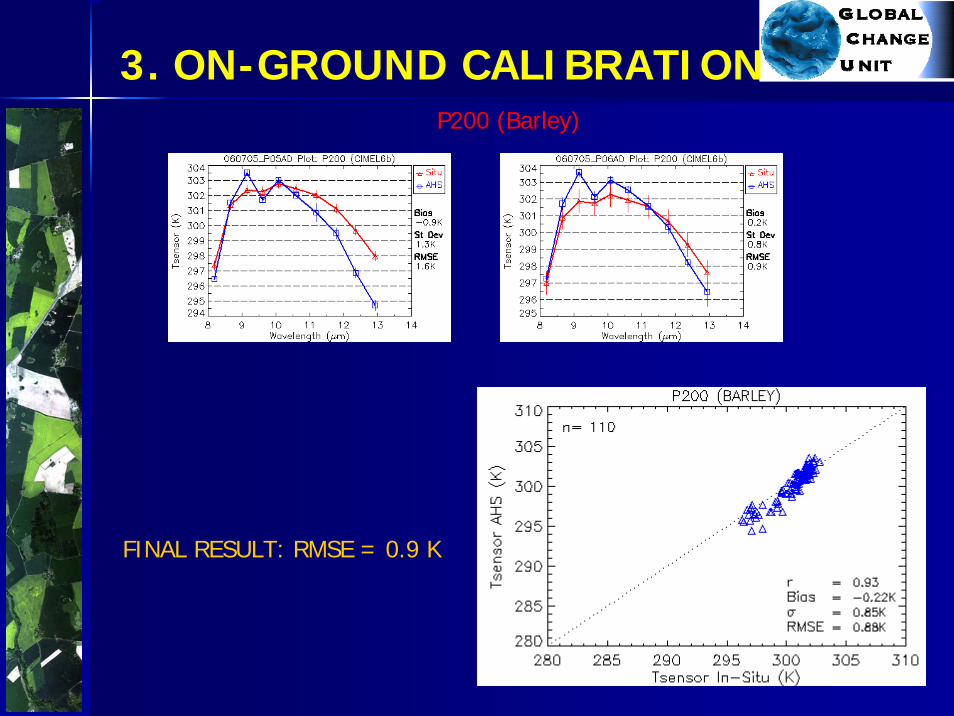
FINAL RESULT: RMSE = 0.9 K
3. ON-GROUND CALIBRATIONP200 (Barley)
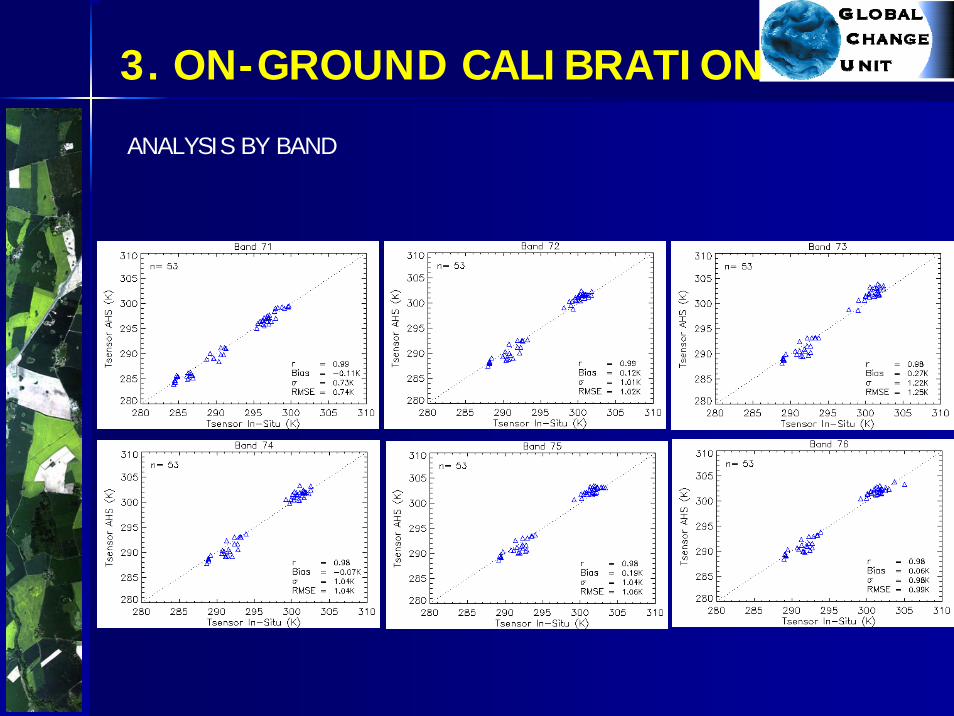
3. ON-GROUND CALIBRATION
ANALYSIS BY BAND
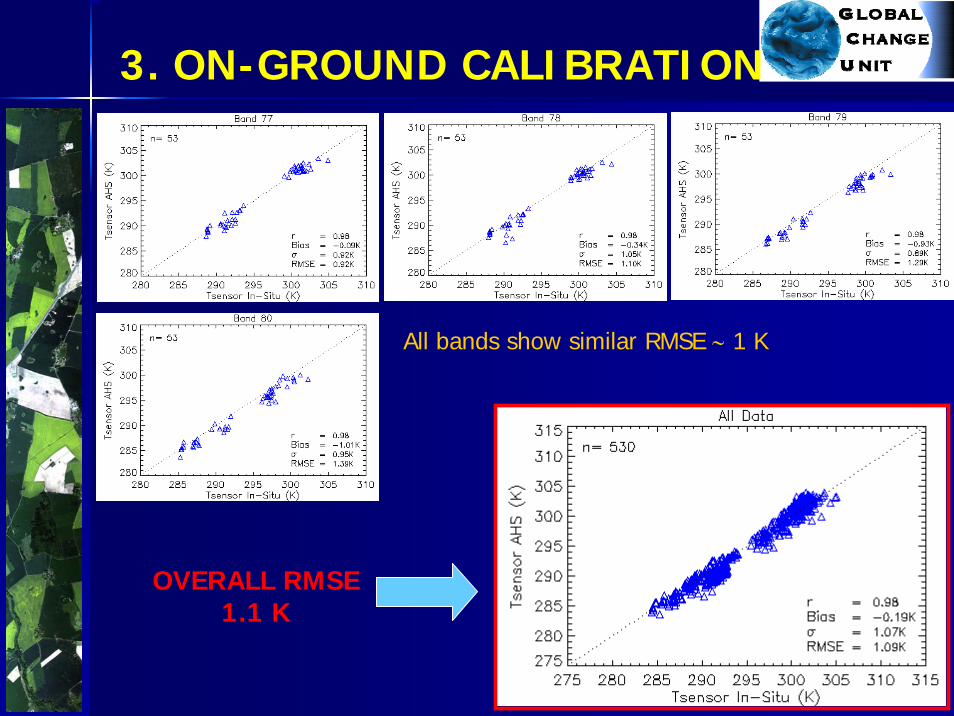
3. ON-GROUND CALIBRATION
All bands show similar RMSE ∼ 1 K
OVERALL RMSE1.1 K
1. OBJECTIVES1. OBJECTIVES
2. METHODOLOGY2. METHODOLOGY
3. ON3. ON--GROUND CALIBRATION OF AHS TIR BANDSGROUND CALIBRATION OF AHS TIR BANDS
4. LAND SURFACE TEMPERATURE/EMISSIVITY RETRIEVAL4. LAND SURFACE TEMPERATURE/EMISSIVITY RETRIEVAL
5. SIMPLIFIED METHOD FOR ET RETRIEVAL5. SIMPLIFIED METHOD FOR ET RETRIEVAL
6. EFFECTS OF CLOUDS/SHADOWS: BRIEF ANALYSIS6. EFFECTS OF CLOUDS/SHADOWS: BRIEF ANALYSIS
7. CONCLUSIONS7. CONCLUSIONS
4. LST/LSE RETRIEVAL
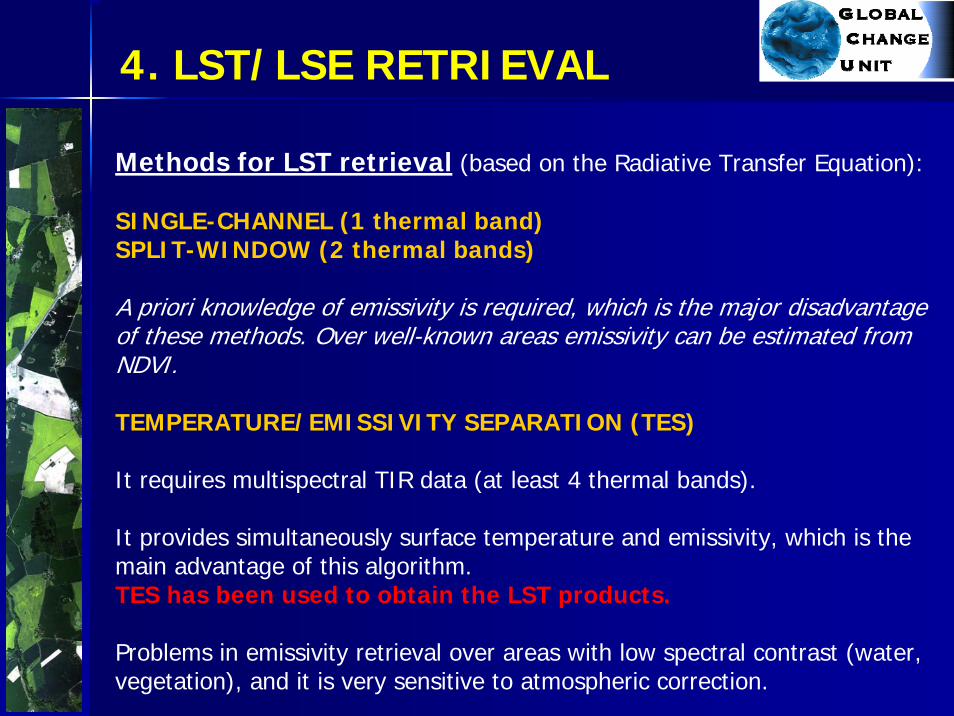
Methods for LST retrieval (based on the Radiative Transfer Equation):
SINGLE-CHANNEL (1 thermal band)SPLIT-WINDOW (2 thermal bands)
A priori knowledge of emissivity is required, which is the major disadvantageof these methods. Over well-known areas emissivity can be estimated fromNDVI.
TEMPERATURE/EMISSIVITY SEPARATION (TES)
It requires multispectral TIR data (at least 4 thermal bands).
It provides simultaneously surface temperature and emissivity, which is themain advantage of this algorithm. TES has been used to obtain the LST products.
Problems in emissivity retrieval over areas with low spectral contrast (water, vegetation), and it is very sensitive to atmospheric correction.
4. LST/LSE RETRIEVAL
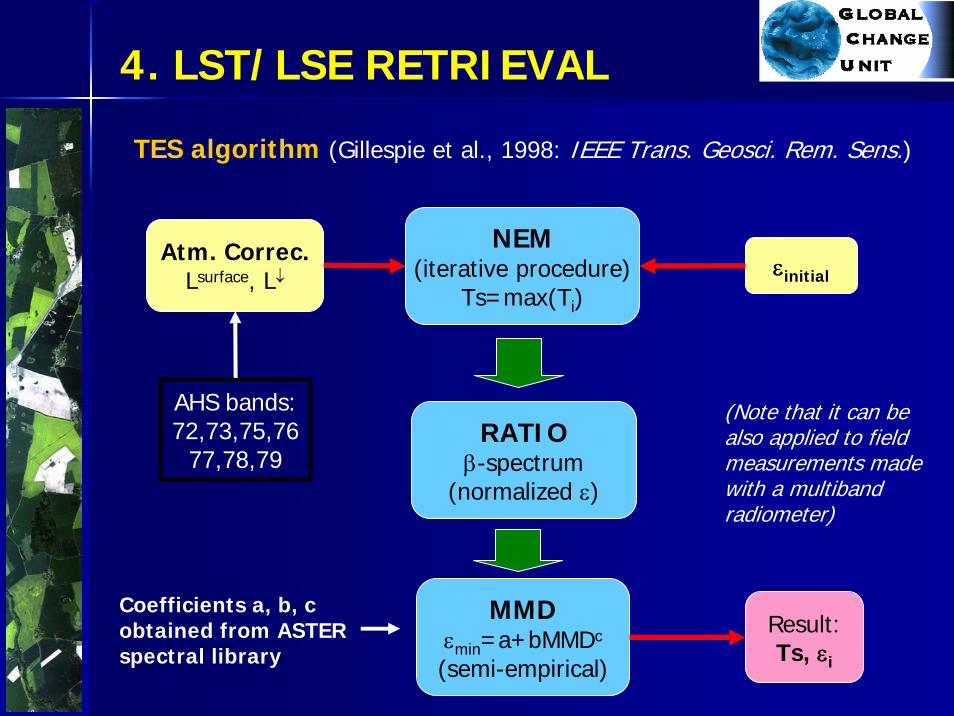
TES algorithm (Gillespie et al., 1998: IEEE Trans. Geosci. Rem. Sens.)
NEM(iterative procedure)
Ts=max(Ti)
RATIOβ-spectrum
(normalized ε)
MMDεmin=a+bMMDc
(semi-empirical)
Atm. Correc.Lsurface, L↓ εinitial
Result:Ts, εi
(Note that it can be also applied to fieldmeasurements made with a multibandradiometer)
AHS bands:72,73,75,76
77,78,79
Coefficients a, b, c obtained from ASTER spectral library
4. LST/LSE RETRIEVAL
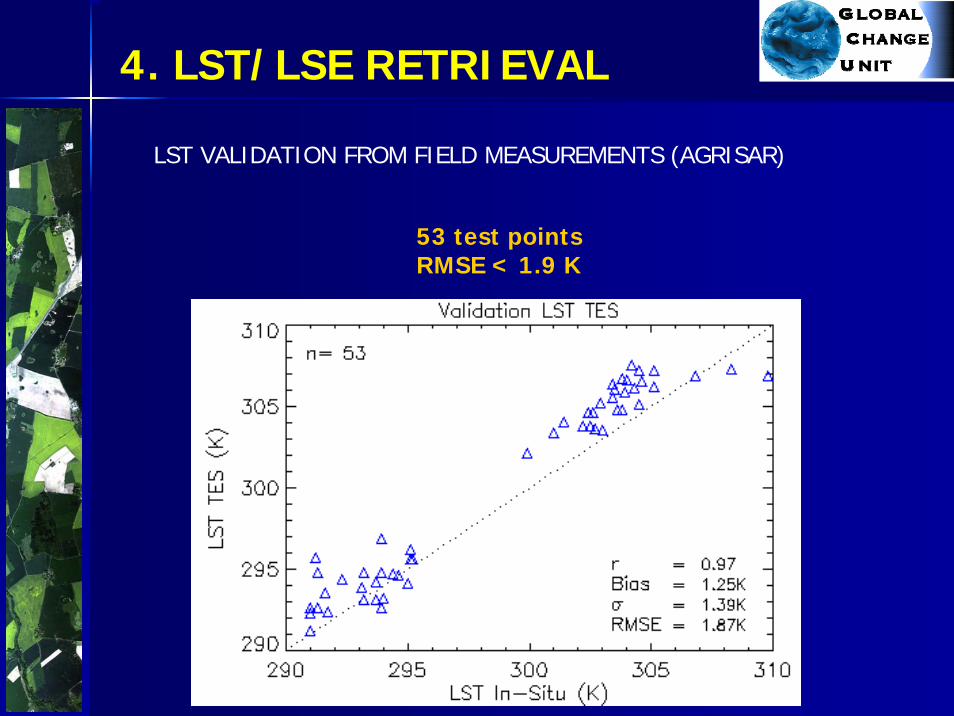
LST VALIDATION FROM FIELD MEASUREMENTS (AGRISAR)
53 test pointsRMSE < 1.9 K
4. LST/LSE RETRIEVAL
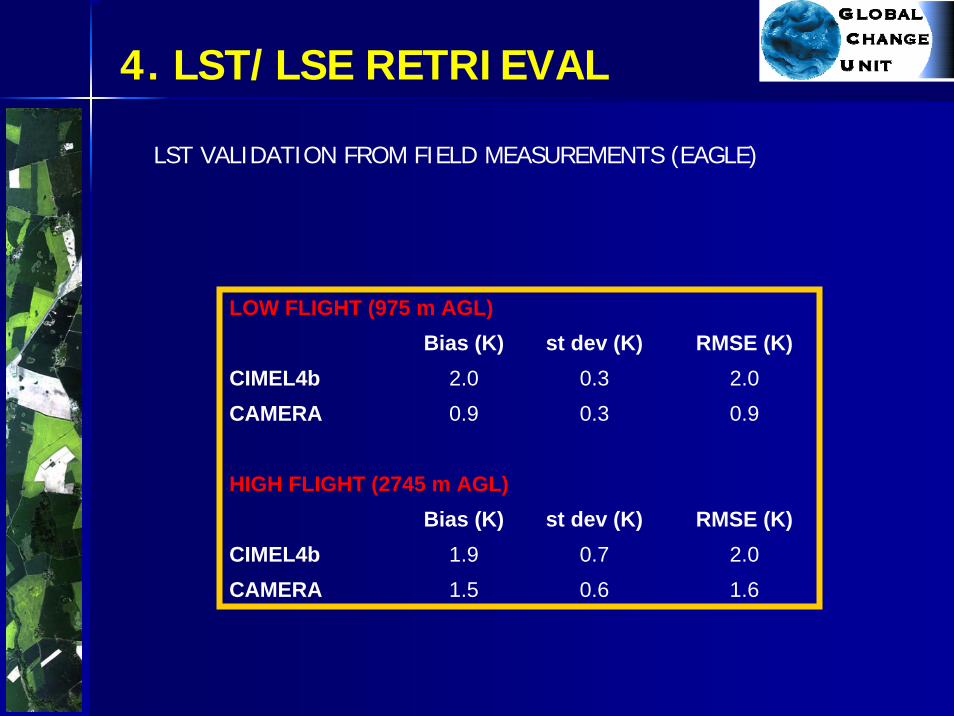
LOW FLIGHT (975 m AGL)Bias (K) st dev (K) RMSE (K)
CIMEL4b 2.0 0.3 2.0CAMERA 0.9 0.3 0.9
HIGH FLIGHT (2745 m AGL)Bias (K) st dev (K) RMSE (K)
CIMEL4b 1.9 0.7 2.0CAMERA 1.5 0.6 1.6
LST VALIDATION FROM FIELD MEASUREMENTS (EAGLE)
4. LST/LSE RETRIEVAL
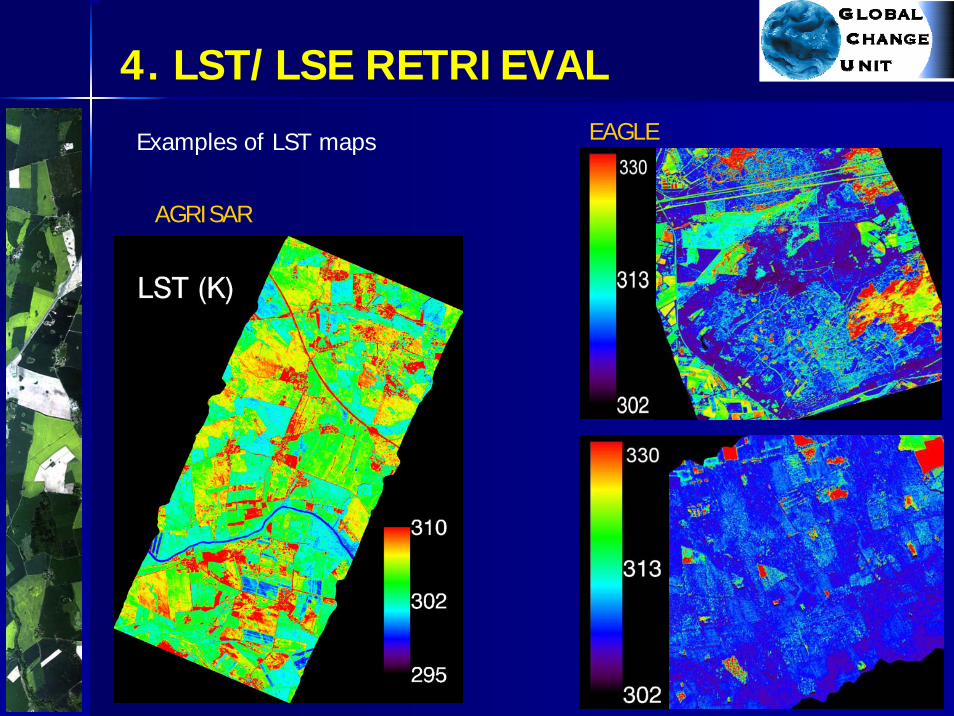
Examples of LST maps
AGRISAR
EAGLE
4. LST/LSE RETRIEVAL
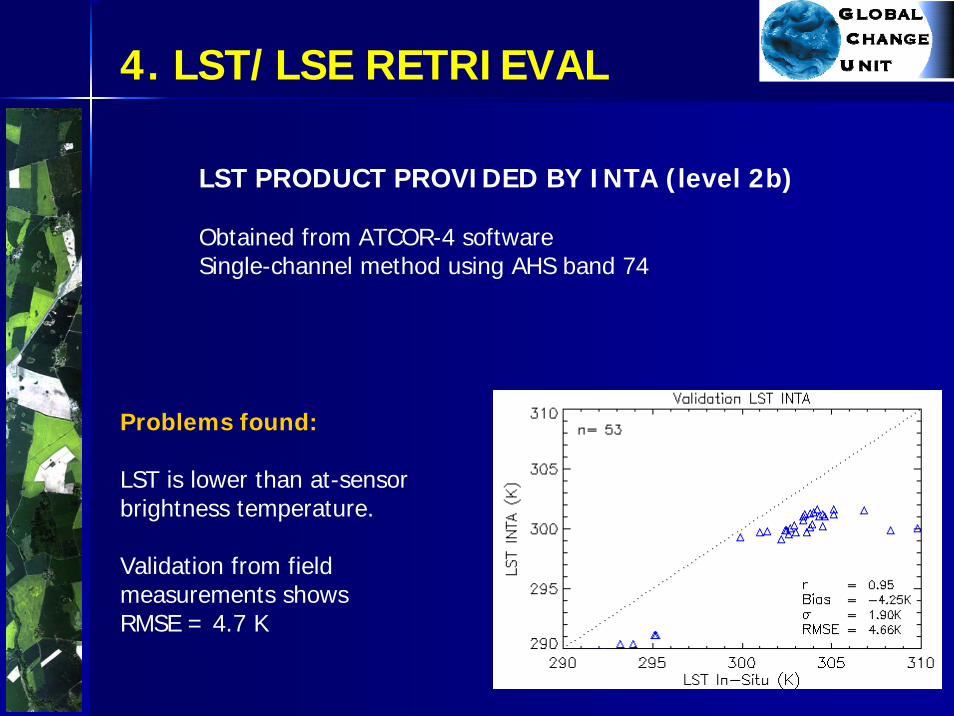
LST PRODUCT PROVIDED BY INTA (level 2b)
Obtained from ATCOR-4 softwareSingle-channel method using AHS band 74
Problems found:
LST is lower than at-sensorbrightness temperature.
Validation from fieldmeasurements showsRMSE = 4.7 K
4. LST/LSE RETRIEVAL
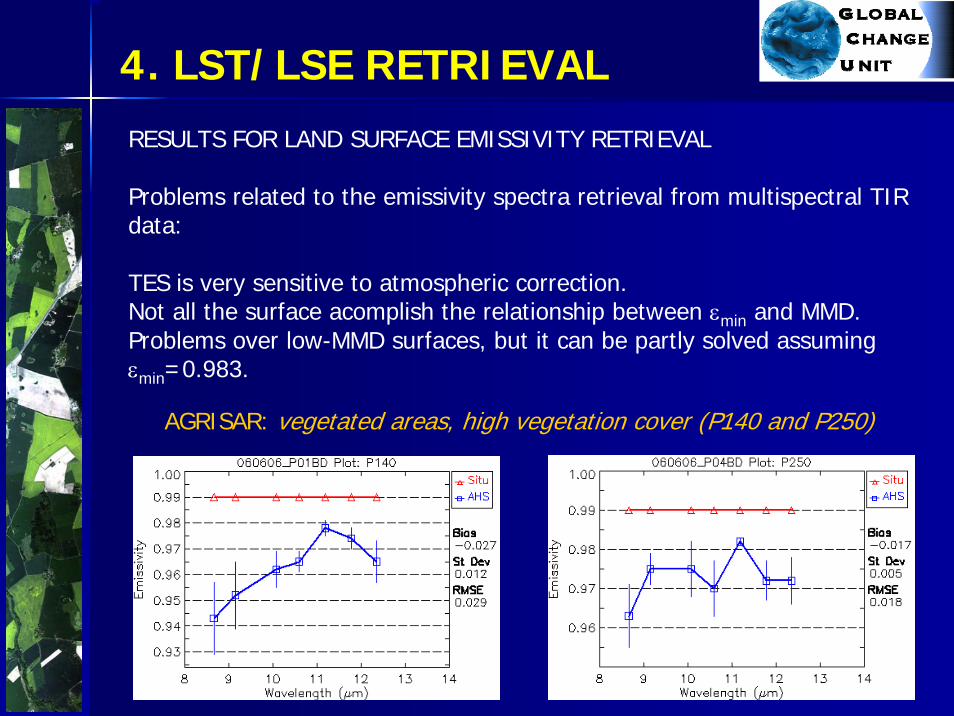
RESULTS FOR LAND SURFACE EMISSIVITY RETRIEVAL
Problems related to the emissivity spectra retrieval from multispectral TIR data:
TES is very sensitive to atmospheric correction.Not all the surface acomplish the relationship between εmin and MMD.Problems over low-MMD surfaces, but it can be partly solved assumingεmin=0.983.
AGRISAR: vegetated areas, high vegetation cover (P140 and P250)
4. LST/LSE RETRIEVAL
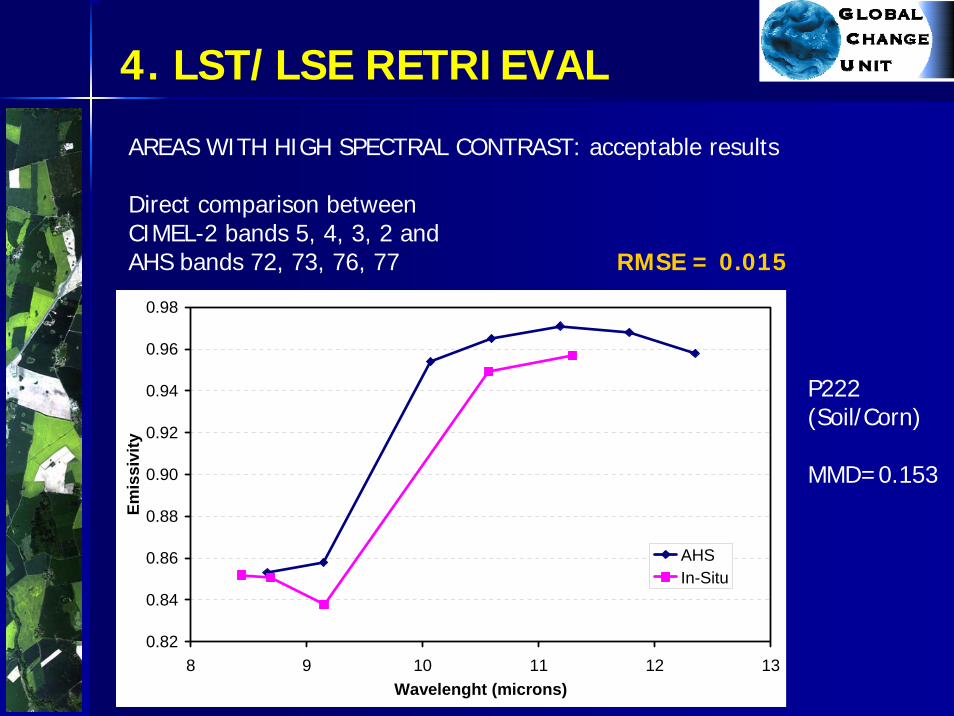
AREAS WITH HIGH SPECTRAL CONTRAST: acceptable results
Direct comparison betweenCIMEL-2 bands 5, 4, 3, 2 andAHS bands 72, 73, 76, 77 RMSE = 0.015
0.82
0.84
0.86
0.88
0.90
0.92
0.94
0.96
0.98
8 9 10 11 12 13Wavelenght (microns)
Emis
sivi
ty
AHSIn-Situ
P222(Soil/Corn)
MMD=0.153
0.70
0.74
0.78
0.82
0.86
0.90
0.94
0.98
8.0 8.5 9.0 9.5 10.0 10.5 11.0 11.5 12.0 12.5 13.0
Wavelength (μm)Em
issi
vity
In-SituAHS-TES
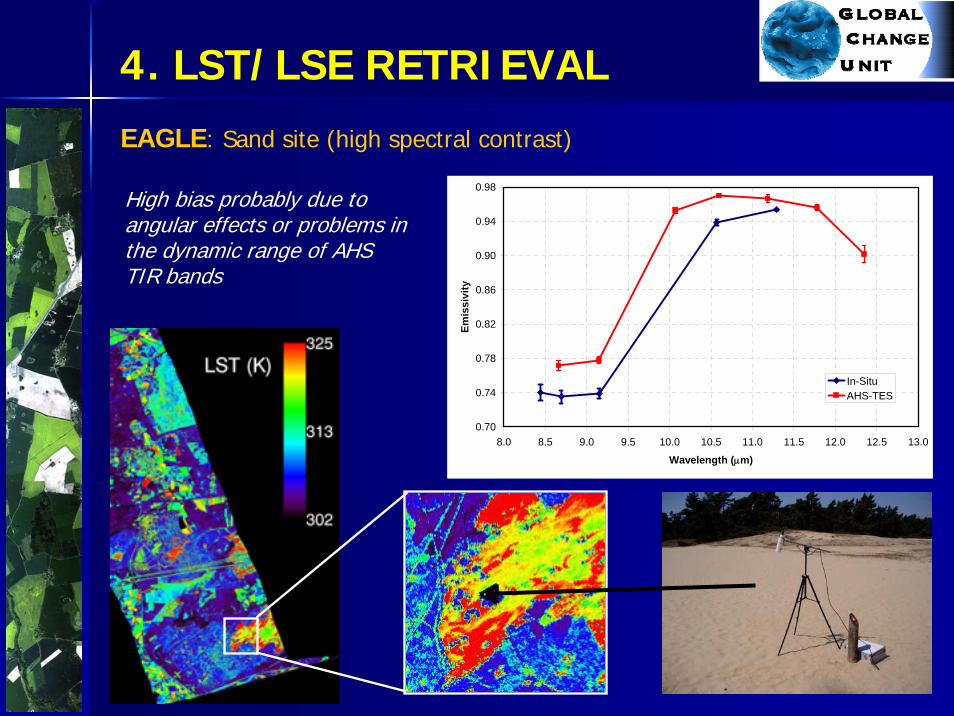
EAGLE: Sand site (high spectral contrast)
4. LST/LSE RETRIEVAL
High bias probably due toangular effects or problems in the dynamic range of AHS TIR bands
1. OBJECTIVES1. OBJECTIVES
2. METHODOLOGY2. METHODOLOGY
3. ON3. ON--GROUND CALIBRATION OF AHS TIR BANDSGROUND CALIBRATION OF AHS TIR BANDS
4. LAND SURFACE TEMPERATURE/EMISSIVITY RETRIEVAL4. LAND SURFACE TEMPERATURE/EMISSIVITY RETRIEVAL
5. SIMPLIFIED METHOD FOR ET RETRIEVAL5. SIMPLIFIED METHOD FOR ET RETRIEVAL
6. EFFECTS OF CLOUDS/SHADOWS: BRIEF ANALYSIS6. EFFECTS OF CLOUDS/SHADOWS: BRIEF ANALYSIS
7. CONCLUSIONS7. CONCLUSIONS
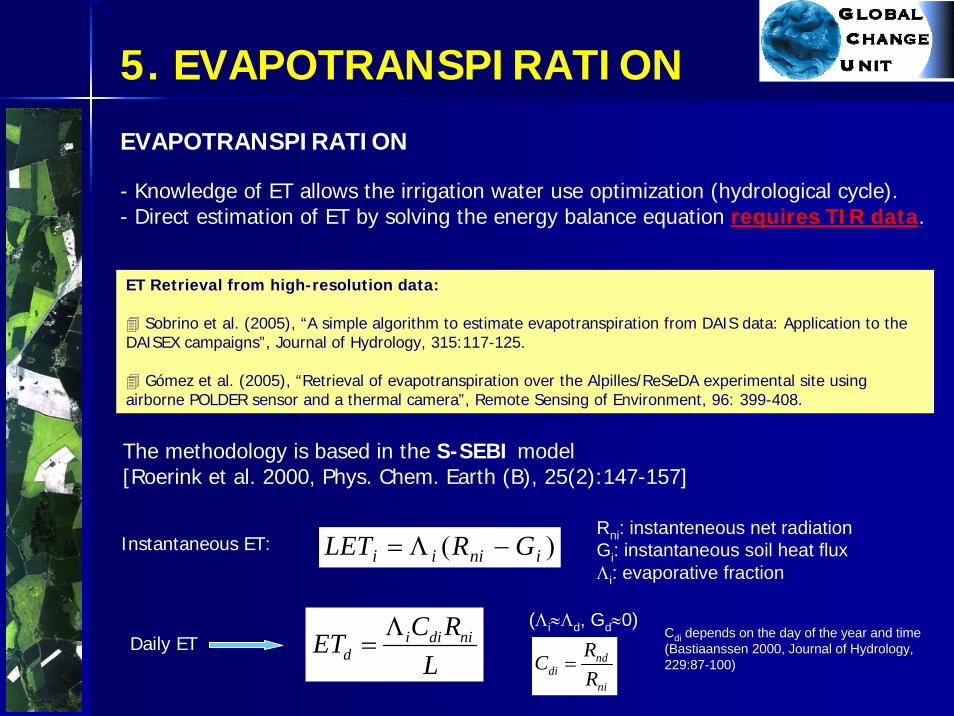
EVAPOTRANSPIRATION
- Knowledge of ET allows the irrigation water use optimization (hydrological cycle).- Direct estimation of ET by solving the energy balance equation requires TIR data.
ET Retrieval from high-resolution data:
Sobrino et al. (2005), “A simple algorithm to estimate evapotranspiration from DAIS data: Application to the DAISEX campaigns”, Journal of Hydrology, 315:117-125.
Gómez et al. (2005), “Retrieval of evapotranspiration over the Alpilles/ReSeDA experimental site using airborne POLDER sensor and a thermal camera”, Remote Sensing of Environment, 96: 399-408.
The methodology is based in the S-SEBI model[Roerink et al. 2000, Phys. Chem. Earth (B), 25(2):147-157]
)( iniii GRLET −Λ=Instantaneous ET:Rni: instanteneous net radiationGi: instantaneous soil heat fluxΛi: evaporative fraction
i di nid
C RETL
Λ=Daily ET
(Λi≈Λd, Gd≈0)
nddi
ni
RCR
=
Cdi depends on the day of the year and time (Bastiaanssen 2000, Journal of Hydrology, 229:87-100)
5. EVAPOTRANSPIRATION
5. EVAPOTRANSPIRATION
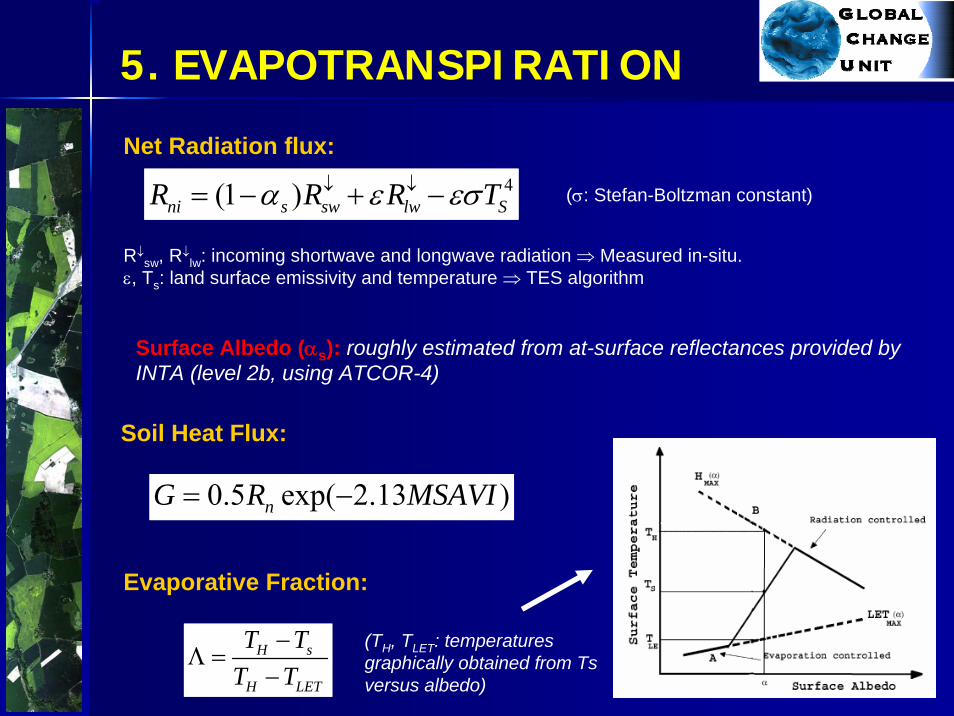
4(1 )ni s sw lw SR R R Tα ε εσ↓ ↓= − + −
Net Radiation flux:
R↓sw, R↓
lw: incoming shortwave and longwave radiation ⇒ Measured in-situ.ε, Ts: land surface emissivity and temperature ⇒ TES algorithm
(σ: Stefan-Boltzman constant)
Surface Albedo (αs): roughly estimated from at-surface reflectances provided by INTA (level 2b, using ATCOR-4)
Evaporative Fraction:
H s
H LET
T TT T
−Λ =
−(TH, TLET: temperaturesgraphically obtained from Tsversus albedo)
)13.2exp(5.0 MSAVIRG n −=
Soil Heat Flux:
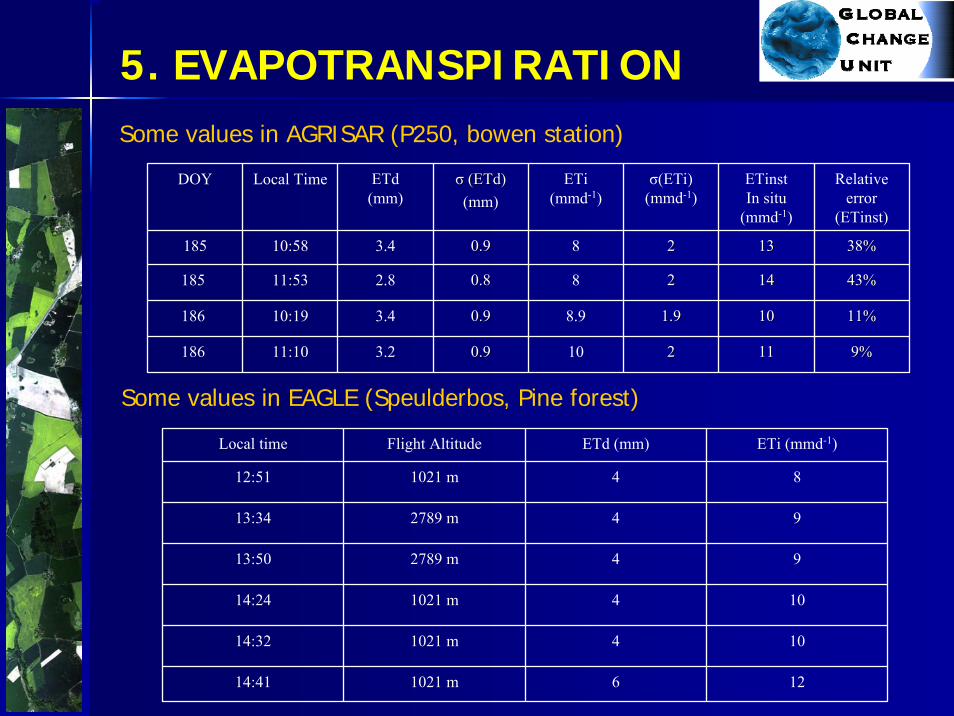
5. EVAPOTRANSPIRATION
DOY Local Time ETd(mm)
σσ ((ETdETd) ) (mm)
ETi(mmd-1)
σ(ETi)(mmd-1)
ETinstIn situ
(mmd-1)
Relativeerror
(ETinst)
185 10:58 3.4 0.90.9 8 22
22
1.91.9
22
38%38%
185 11:53 2.8 0.80.8 8
1313
1414
1010
43%43%
186 10:19 3.4 0.90.9 8.9 11%11%
186 11:10 3.2 0.90.9 10 1111 9%9%
Some values in AGRISAR (P250, bowen station)
Local time Flight Altitude ETd (mm) ETi (mmd-1)
12:51 1021 m 4 8
13:34 2789 m 4 9
13:50 2789 m 4 9
14:24 1021 m 4 10
14:32 1021 m 4 10
14:41 1021 m 6 12
Some values in EAGLE (Speulderbos, Pine forest)
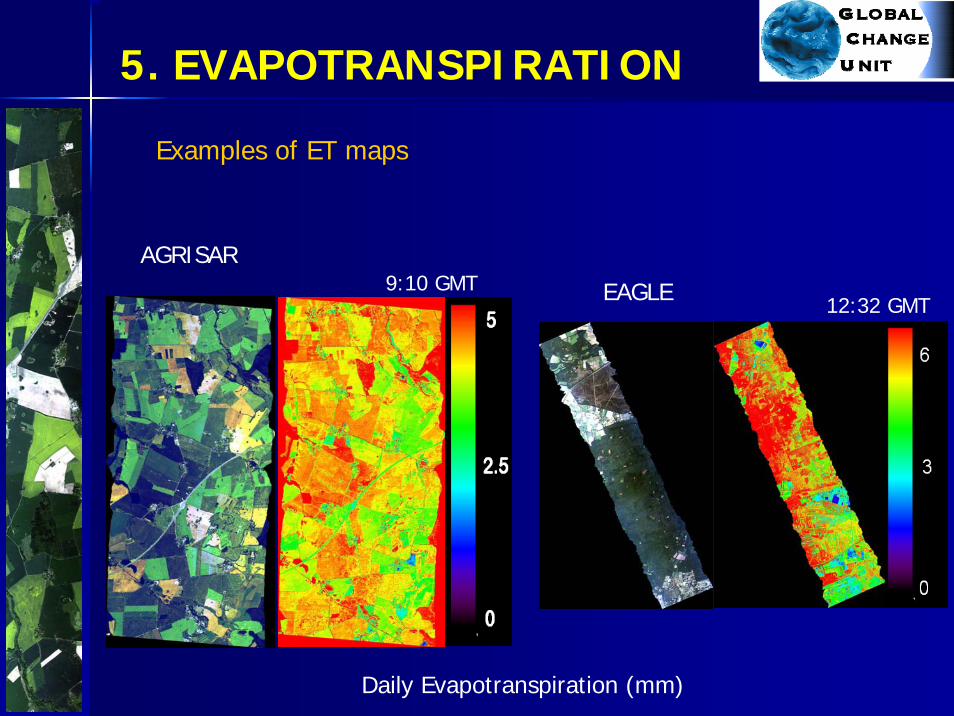
5. EVAPOTRANSPIRATION
Daily Evapotranspiration (mm)
Examples of ET maps
12:32 GMT9:10 GMT
AGRISAR
EAGLE
1. OBJECTIVES1. OBJECTIVES
2. METHODOLOGY2. METHODOLOGY
3. ON3. ON--GROUND CALIBRATION OF AHS TIR BANDSGROUND CALIBRATION OF AHS TIR BANDS
4. LAND SURFACE TEMPERATURE/EMISSIVITY RETRIEVAL4. LAND SURFACE TEMPERATURE/EMISSIVITY RETRIEVAL
5. SIMPLIFIED METHOD FOR ET RETRIEVAL5. SIMPLIFIED METHOD FOR ET RETRIEVAL
6. EFFECTS OF CLOUDS/SHADOWS: BRIEF ANALYSIS6. EFFECTS OF CLOUDS/SHADOWS: BRIEF ANALYSIS
7. CONCLUSIONS7. CONCLUSIONS
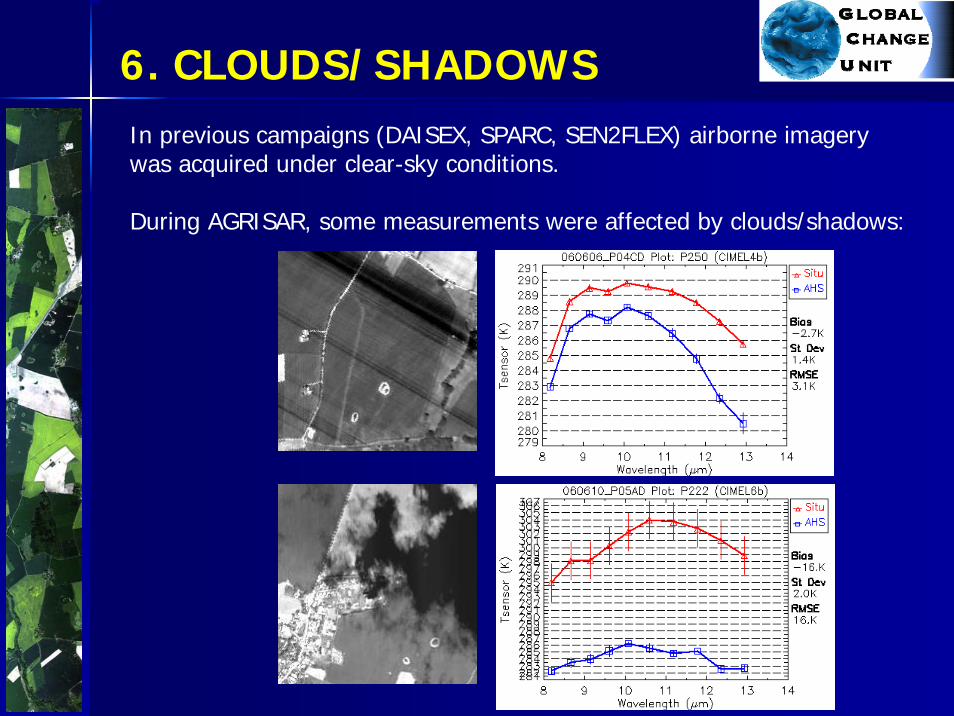
6. CLOUDS/SHADOWSIn previous campaigns (DAISEX, SPARC, SEN2FLEX) airborne imagerywas acquired under clear-sky conditions.
During AGRISAR, some measurements were affected by clouds/shadows:
6. CLOUDS/SHADOWS
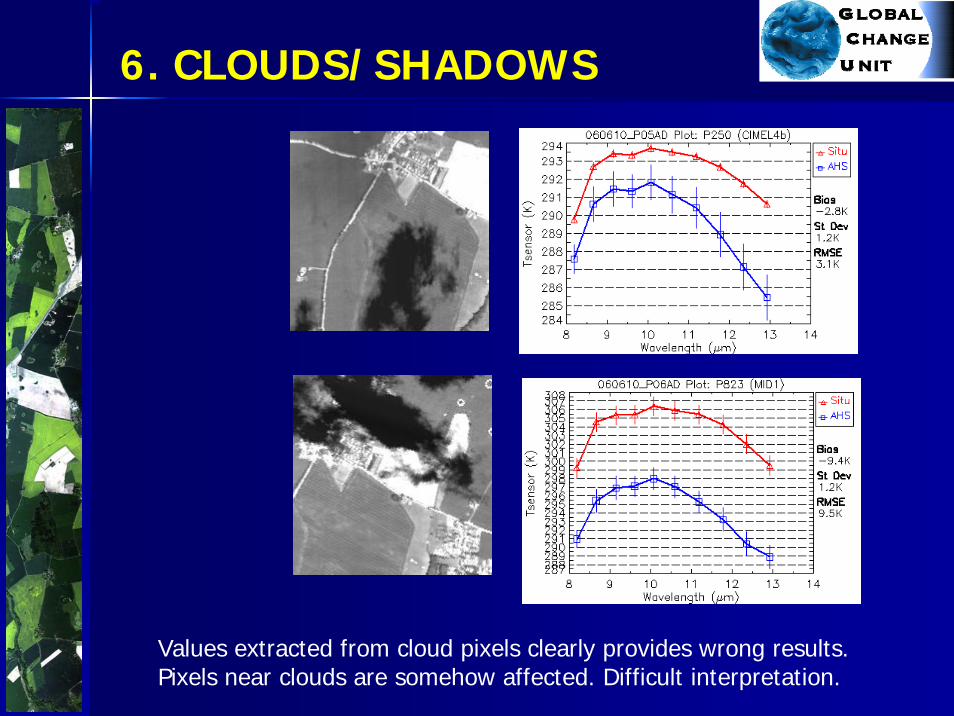
Values extracted from cloud pixels clearly provides wrong results.Pixels near clouds are somehow affected. Difficult interpretation.
6. CLOUDS/SHADOWS
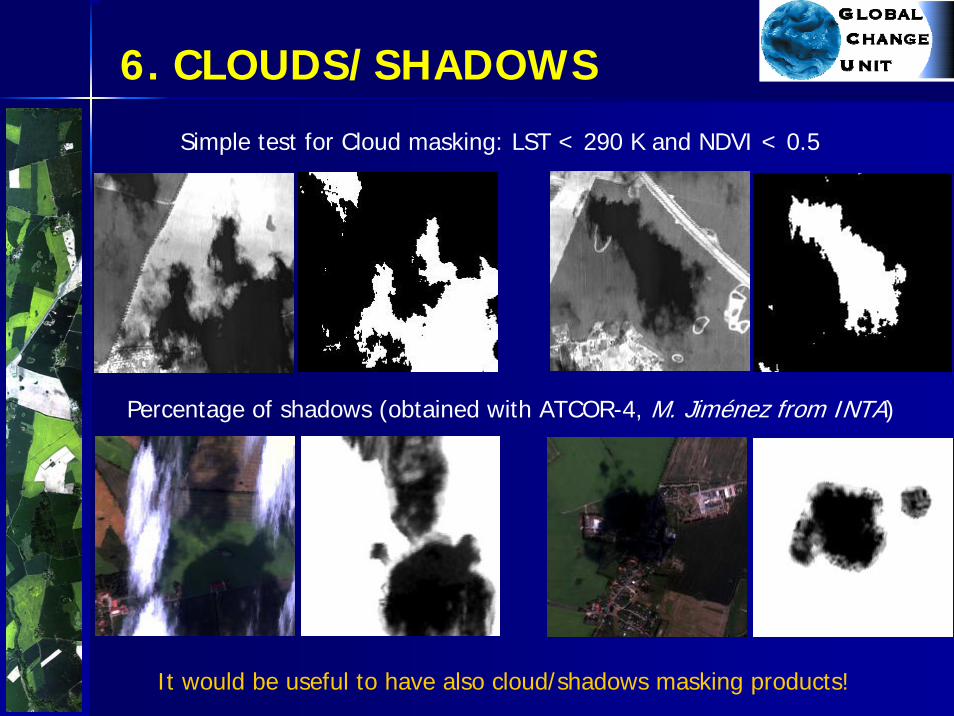
Simple test for Cloud masking: LST < 290 K and NDVI < 0.5
Percentage of shadows (obtained with ATCOR-4, M. Jiménez from INTA)
It would be useful to have also cloud/shadows masking products!
1. OBJECTIVES1. OBJECTIVES
2. METHODOLOGY2. METHODOLOGY
3. ON3. ON--GROUND CALIBRATION OF AHS TIR BANDSGROUND CALIBRATION OF AHS TIR BANDS
4. LAND SURFACE TEMPERATURE/EMISSIVITY RETRIEVAL4. LAND SURFACE TEMPERATURE/EMISSIVITY RETRIEVAL
5. SIMPLIFIED METHOD FOR ET RETRIEVAL5. SIMPLIFIED METHOD FOR ET RETRIEVAL
6. EFFECTS OF CLOUDS/SHADOWS: BRIEF ANALYSIS6. EFFECTS OF CLOUDS/SHADOWS: BRIEF ANALYSIS
7. CONCLUSIONS7. CONCLUSIONS
7. CONCLUSIONS
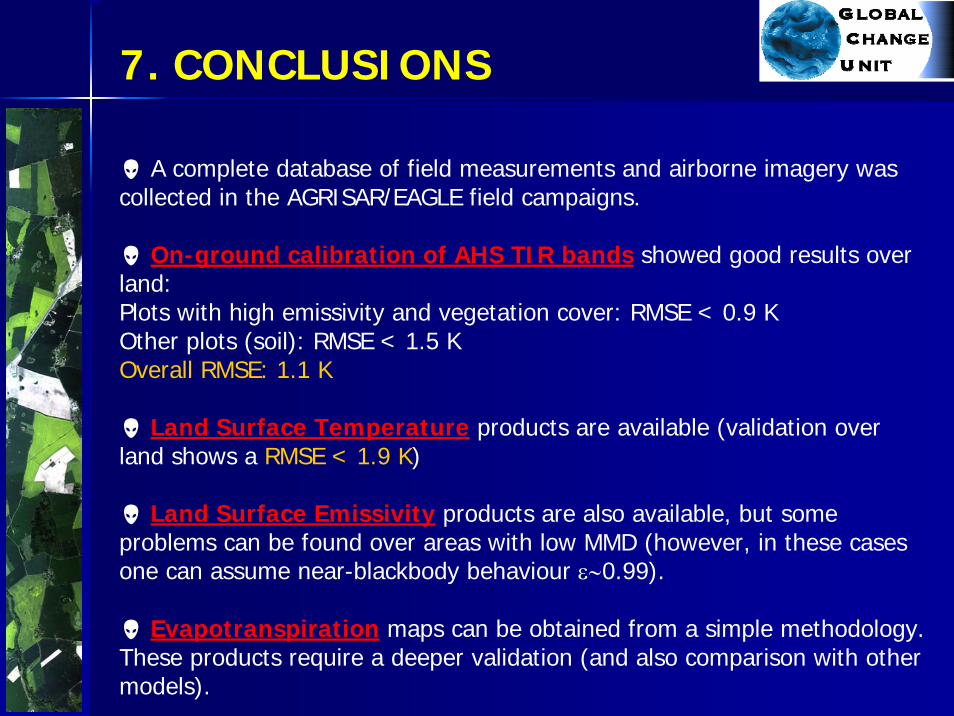
A complete database of field measurements and airborne imagery was collected in the AGRISAR/EAGLE field campaigns.
On-ground calibration of AHS TIR bands showed good results over land:Plots with high emissivity and vegetation cover: RMSE < 0.9 KOther plots (soil): RMSE < 1.5 KOverall RMSE: 1.1 K
Land Surface Temperature products are available (validation over land shows a RMSE < 1.9 K)
Land Surface Emissivity products are also available, but some problems can be found over areas with low MMD (however, in these cases one can assume near-blackbody behaviour ε∼0.99).
Evapotranspiration maps can be obtained from a simple methodology. These products require a deeper validation (and also comparison with other models).
![SELECTION OF LIGHT SOURCE AND …Figure 2.3: The emissivity of tungsten filament as a function of wavelength and temperature (after De Vos)[4] With the known absolute emissivity of](https://img.pdfslide.net/doc/110x75/5e3949d15da9c62a1535bf1c/selection-of-light-source-and-figure-23-the-emissivity-of-tungsten-filament-as.jpg)