Embed Size (px)
Citation preview

JOURNAL OF kESEARCH of the Notional Bureau of Standards-·C. Engineering and Instrumentation
Vol. 64C, No. 1, January-March 1960
Temperature Stratification in a Nonventing Liquid Helium Dewar l
L. E. Scott, R. F. Robbins, D. B. Mann, and B. W. Birmingham
(August 25, 1959)
The prese nce of a large temperature gradien t in D ewars used for transporting heliu m is undesirable because it m ay be accompa nied by unnecessar ily h i'?;h intern al pressures when the co ntents a re sealed. In a study of t he problems, such gradients were obse rved in experiments conducted wi th a 39.7-liter stainless steel D ewar. A method is shown for calcu lat in g the pressure ri se in t he absence of te mperature grad ients and the results a re compared with the obsen 'ed pressure rise. In some cases cu n 'es representint!; calculated and obse rved preSRure rise in tersect. A possible ex planation of t his situation is given. The destratifying effect of a co ncen t rated heat inp ut and of copper wds is shown .
1. Introduction
For mall Y applicat,ions, a g:reaLer econo my of transportation ca n be ac hievrd by shipping Ilolium aL mod erate pressures at or n ear th e liquid density rather t.han as a warm compressed gas [1].2 Savll1gs can be realized evon though the end usc of th e product i s in gaseous form. Th e transportation and sLorage, how ever , should b e accompli shed with no loss of helium to k eep (,otaI costs minimal. AD ideal method if' on e in which Lhe hca,t input to the Dewar increases the pressure and temperature of t he conteDts rather Lban cauf' ing loss of h elium by evaporation.
Temperature gradients may exist in conLain ers of ver~- small b eat :flux as a consequonce of tile low thermal conductivity of helium n eal' i ts normal boiling poinL, app roximatel ~' 6.3 X 10- 5 cal/cm 0 K sec foJ' t he liquid [2] and 5.3 X 10- 5 eal/cm 0 K soc [or Lhe vapo r [3]. A layer of warm fluid at the top of the contain er has no tendell cy to mix. In addition , warm helium anywhere in the container will tend to rise to the top of the container a nd increase t he temperature gradient. For example, at 3 atm, 5.5 0 Ie fluid is over twice as den se as fluid at 6.5 0 Ie [4]. The practical signifi.cance of a temper ature gradient in a self-pressurizing system is the difference in the rate of pressure rise as compared to a s~Tstom in thermal equilibrium.
The object of the experiment to be described was to verify the existence of temperature gradien ts in a nonventing D ewar and to determine the approximate magnitude of these gradients by experimental m easurements .
2 . Theoretical Pressure Rise at Thermal Equilibrium
From t be firsL law of thermodynamics, eq (1) , and the definition of en t halpy, eq (2), we have:
I This wOlk was supported by t ile Bureau of Aeronautics, Department of the Nav'v
2 Figm es in brackets ind icate t he literature references at the end of tbis paper.
19
tJ. U= Q- H'
H = U+ pv
where Q= h ea t added to Lh e sys Lem , U= internal ellergy fun ction, H = enthalpy fun ction , n T= work don e by the sys tem ,
co nla i n er vol ume
(1)
(2)
p = pressure,
v=speeific volum e total m ass o f liquid and
vapo r.
Si nce th e process is one of constant volume a nd th e exLernal work betwee n Lhe s \'s tem and i ts SLl rroLlnd ~ ings is Z01'O we have: -
or
/:, U= Q
MI= Q+vtJ.p
Q= /:, U= M-l- v/:,p (3)
A convenient method of expressing eq (3) is a plot of pressure versus in ternal en ergy for various specific vol umes [4] as shown in figure 1. Th is process can b e illustrated by following a n isochor (line of constant volume) for th e horizontal distance cOl'l'esponding to tJ. U or Q.
3. Previous Experiments
Previous experimen ts conducted by W'ilson and Robbins of this laborator~\r with a 2.3-li ter capacity D ewar constructed of high thermal conductivity copper, have ~iven pressure rise r esults which agr ee with predicted values obtain ed from figure 1. The copper construction assured that the con ten ts were in thermal equilibrium. The range of specific volumes covered in the experiments were 7.8 to 13.0 li ter/kg. The pressure was allowed to rise to 5 atm .

100
(/)
a.
96
92
88
84
80
7 6
7 2
6 8
6 4
6 0
6
w 5 a::: ::> (J)4 (J) W a::: a.. 4
2
8
4
4 0
3 6
3 2
2 8
2 4
0
16
12
8
4
4°K
,
I \
\
i \
/
j V I 1\ f, I
I , 1,1 , \ \
\ 1\ Ii I \
I Ii \
Ii \ I \ \ i.,., 0 ,<Xl crf I :c ({ 0
:;f I\2 f- ==r '" '" ~ crl \
\ ,.:
\ \ I \ I f II \ 1
\ I II 1\ , , \ \ 11\
I \ 17 I
\ I 1\ I il
\ \ \ I Ii i II 1\ 1 7
\ II ~L I
~" , \ I
'\ I I \ , 17/
lL, .L
\ if/I I 'I//.
,VII V V \ Ifl f/I/VV ,/
f7' Vi/V ,/V l7
~VI '/ V V ,/
IIWV,V V V ~~!Y' /
w / /'
I
' I II 1/\
':::'
I I
II
'\
I'~ II
I I
II I -- J
II
/
r7 V
I \ / \ II IT I I
\ 11 \ \
\ I \ 7 / I l/ I II , )'\ , I I , 1;1,
i l I
1'1 / r , J \
II 1\ I I \ I \
, II II I
1 ,
f-- 7f1: 7 ' 0. X \ I I .... I
/ , ~/ \
\ I , t:"'j , \ II " I I II ". \
'It I J\ 1\ :!:' /
II \ \ II ' f. 1\/ 1\ \
I II \ If, \ "''<>; \
I I , " I \ II \ ,
" II II \ 1\ I f" / 1\ , I \ \
I / \ \ I \ I 1\ if \
11\ , / \
1\ \ ,
\ \
if / \ VI I I
"- \ / I I , \ \ I
II " V \ \ I 7'" ,/
~ IJl' -
'" I rx., \ \ \ --1
V ~ V 1\ , \ \/ \ j , ,
~ / 1\ \ \ 7 8°K
V \ \ , IX 6.5
t-- V 6
I I~ 5.5
'I V 5
4.5°K
I I
o 2 4 6 8 10 12 14 16 18 20 22 24 26 28 30 32 34 36 38 40
U,j/g
FIG U R E l. Pressure-internal ene1'gy diagram Jar helium, a to 100 psia .
The D ewar used in these experimen ts had a fill t ube with a temperature gradien t from 4° to 76° K . One migh t erroneously speculate that if a con tainer is filled wi th liquid hr jium to a greater level than that corresponding to the cri tical density , the liquid m eniscus migh t expand in to the fill tube. This phenomenon did not OCCllr, undoub tedly as a resul t
20
of the high compressibili ty of liquid helium (O.0025g/ cm3/atm at 2.5 atm and 4° K [5]).
It was concluded from t he expErimen tal resul ts t hat t he heat input was no t aftected by a ris ing liquid meniscus in the D ewar , and that pressure ri se as a function of total heat inpu t may be accura tcl~r predicted if the contents are in tha mal equilibrium.

4. Experimental Details
4.1. Description of Apparatus
For th e present experimen ts a D ewar of 39.7-1 iter capacity (excluding volume in the supporting neck) was constructed from type 304 stainless steel as shown in figure 2. Stainless stecl was selected , because of its low thermal conductivity, to reduce vessel wall conduction and thereby minimize effects of t he wall on the temperature gradient in th e contents. The en t ire assembly with the excep t ion of the upper 12 in . of supporting tu bes was submerged in liquid nitrogen during the measllI'emen ts. Twelve difference thermocouples (gold plus 2.1 at. percen t cobalt ve rsus copper) were installed on th e outside of a micarta t u be at the vertical cen te rline and spaced as shown in figu re 2. Thermocouple 12 was placed on the sensing bulb of a h elium vapor pressure thermometer and was used as the reference for the 11 remaining thermocouples. The t hermoelectric emf was measured with a precision \~ enner potentiometer. The thermocouples and temperatu re measuring equipmen t were capable of an accuracy of better than ± 0.1 ° K in the range of absolu te temperatu res measured. A res istance wire heater wa s spiraled a round the top and bottom hemispheres to allow a known and concen trated heat flux to be applied .
In experiments 4,5 , and 6, four rod s of electrolytictough-pi tch copper 25-in. long having a combined cross-sectional a rea of 0.258 sq in . were placed ver tically in the D ewar to redu ce the temperature gradient.
f Kova r seal
I Pumping line, vacuu m gage, and seal-of f valve
691/4"
Enti re outer su rface of inner shell covered With aluminum foil
I
f 3/4" coupl;ng
Vent
3/4" c.d . • . 020" wal l ~ 304 5.S.lube
6 ·
- 2 1/8" c.d. x 1/8" wall Cu lube
- 12" o. d. x .072" wall #304 5.S.
hemispherical heads
" t-2:':"'-- __ Thermocouple spacing - No's I thr u 12
," , ,"
12"0.d . ~ .072" wall x 14" long '"30 4 5.5 shell
3/8" o.d. Micarta lube -Ift"l---~I High vacuum
I 44 Oh m Nichrome heater
Vapor pressure thermometer bulb
14" o. d . x 1/4" wall "30 4 5.5.
ASME heads
FIGURE 2. Dewar schematic showing thermocouple positions.
21
4.2. Experimental Procedure
Th e Dewar was filled to various IC\Tcls wilh liquid helium . Th e liquid level was then measured by means of an electrical resistance probe [6] inserted through th e neck. The liquid evaporat ion rate wa measured prior to closing the vent to determine the heat input. A correction was calcula ted for the increased heat input down the neck in th e 110nventing condition . The system was then sealed and periodic pressure and temperature readings were obtained.
5. Data and Discussion
Six experimen ts were performed as shown in table 1. In each experim ent, the starting conditions were saturated liquid and vapor at 12.2 psia.
Experiment 1'\[0.
T ABLE :I
Tota l lVfcasurcd 'J1hcorct-Liquid SpeCifi c heat time to iea l time volume volume input 50 pSia to 50
psia
l':O LCS
----------------1-----%f uU l / ky w hr hr 1 ______ ___ 99 7.8 0. 10 15. '1 23.2
2 . ________ 82 9. 23 . 10 27.5 00.8 3 ___ _ . _. __ 71 10.5 .54 .1 2.5 13.2 Coneen Ira led heat
in pu L at bottom. L ____ _ ._. 97.5 7.93 .10 24 . 6 29.4 Copper rods
insta lled. 5 ___ __ . ____ 78 9. 65 . 10 63. '1 65.7 Do. (,--- ------ 81 9. 32 . 10 55. r. 54.8 Do.
Experim ents 1 through 5 were terminated afte r a pressure buildup to approximately 70 psia. Experiment 6 was continued until the pressure r eached 160 psia .
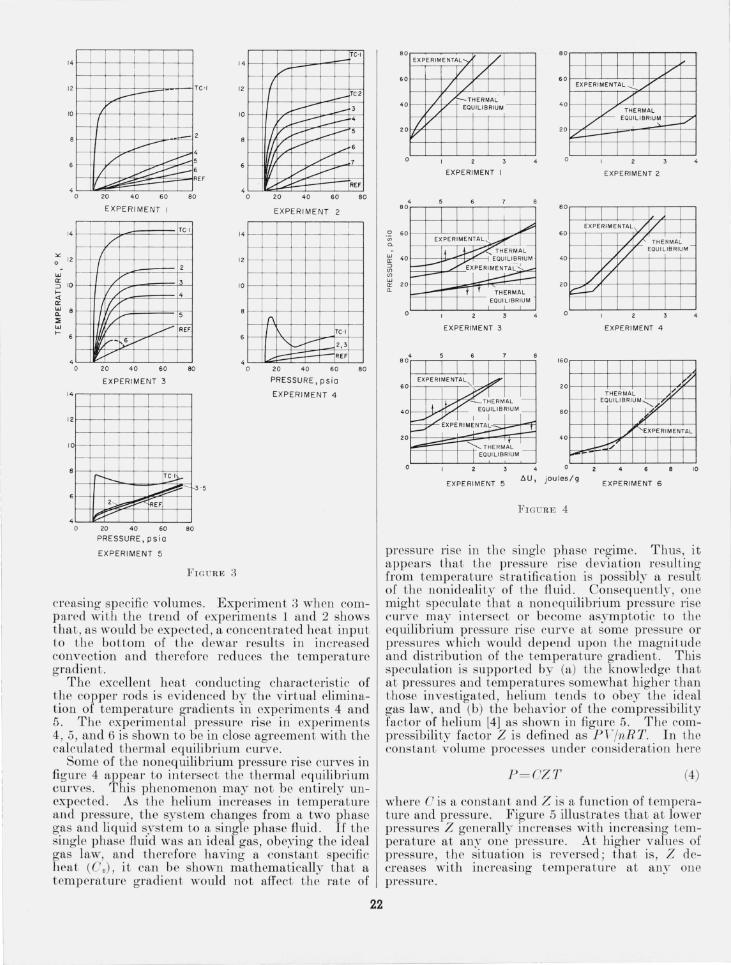
Figure 3 show a bsolu te temperature as a fun ct ion of ve rtical posit ion in the D ewar and Dewar pressure for experiments 1 through 5. Temperature read i.ng , tak en after Lite vapor press ure thennometer reference reach ed t he critical temperature (app rox 5.20 Ie) such as shown for experinlents 3 and 5, a rc less accurate because t he a bsolute value of th e reference has been extrapolated for values above 5.20 K. Since the majority of data in experiment 6 is above the critical poin t, tern perature read iu gs a rc no t shown.
In each case, essentially all of the temperature gradien t existed in the upper one third of the test D ewar. Those t hermocouples not plo tted were essen tially a,t the reference tempera ture throughout the tes t. Thermoco uple No. 1 is probably greatly influenced bY the h eat transferred down the fill tube and is 'therefore of questionable value.
Dewar pressure as a function of change in internal cnerg~r (6 U ) is shown in figure 4 for all six experimell ts. Th e calcula ted thermal equilibrium pressure versus 6 U is also shown for comparison .
T empera t ure stratification was quite pronounced in all of the experimen ts performed withou t the copper rods (see figs. 3 and 4). Comparison of experiments 1 and 2 indicate an increasing temperature gradient and pressure rise deviation from the calculated thermal equilibrium pressure with in-
'" w a:
14
12
10
4 o
14
12
:::> 10 >--
" a: w "-::;; w >--
4 o
14
12
10
4 o
i
T -~ C-I
I
....-I-'
/ ....-f-4 5
I ...-:: r--:: -:::.. i--- 6 R EF
20 40 60 80
EXPERIMENT I
Te ·1
i/ /
2
il V 4
if f/ 5
....... f- REF
,,---~
20 40 60 80
EXPERIMENT 3
r-t-- KI~ -~ 2->-~ ~ REF
~V
20 40 60
PRESSURE, psi a
EXPERIMENT 5
80
FIG URE 3
14
12
10
4 o
14
12
10
4 o
Te-I
./ f-
I I -Tc-2
I--- =3 I--:: f- ......-_4
I, V ....-,..-5
If/, V 6
III /" 7
VI y ~ ...-:: REF
20 40 60
EXPERIMENT 2
(\
Te ·1
"---....- 2,3
- - REF
20 40 60
PRESSURE, psio
EXPERIMENT 4
80
80
creasing specific volumes. Experiment 3 when compared with the trend of experiments 1 and 2 shows that, as would be expected, a concentrated heat input to the bottom of tbe dewar resul ts in increased convection and therefore reduces the temperature gradient. .
The excellent heat conducting characteristic of the copper rods is evidenced by the virtual elimination of temperature gradients in experiments 4 and 5. The experimental pressure rise in experiments 4,5, and 6 is shown to be in close agreement with the calculated thermal equilibrium curve.
Some of the nonequilibrium pressure rise curves in figure 4 appear to intersect the thermal equilibrium curves. This phenomenon may not be entirely unexpected. As the helium increases in temperature and pressure, the system changes from a two phase gas and liquid system to a single phase fluid. If the single phase fluid was an ideal gas, obeying the ideal gas law, and therefore having a constant specific heat (0.), it can be shown mathematically that a temperature gradient would not affect the rate of
22
0 .;;; 0-
w" a: :::> <f) <f)
w 0: "-
.0 EXPERIMENTALy /
V / / /
60
0 ~~~I~~:I~M ~ r------
// Or
EXPERIMENT I
4 60
60
40
20
EXPERIMENT 3
8 0
1 1 ,/
60 EXPERIMENTAL ......: ./
1./'1 / THERMAL
- 7 V EQUILlBRI~ -? f---r
40
20
1
EXPERIMENT 2
60 j
60 EXPERIMENTAL ~/
~/I THERMAL
40 / EOUILIBRIUM
/ 20 / /
c::. V
EXPERIMENT 4
160
1
20 1 ~ f--- f-
THERMAL I f/ EQUILIBRIUM ............ V
.0
40
I-"" o
jOules/g
.A" ./ ""EXPER IMENTAL
~ ~ 1 1
10
EXPERIME NT 6
FIGURE 4
pressure rise in the single phase regime. Thus, it appears that the pressure rise deviation resulting from temperature stratification is possibly a result of the nonideality of the fluid. Consequently , one might specula,te that a nonequilibrium pressure rise curve may intersect 01' become asymptotic to the eq uilibrium pressure rise curve at some pressure or pressures which would depend upon the magnitude and distribution of the temperature gradient. This speculation is supported by (a) the knowledge that at pressures and temperaturE's somewhat higher than those investigated, helium tends to obey the ideal gas law, and (b) the behavior of the compressibility factor of helium [4] as shown in figure 5. The compressibility factor Z is defined as PF/nRT. In Lhe constant volume processes under consideration here
P=OZT (4)
where 0 is a cons tan t and Z is a function of temperature and pressure. Figure 5 illustrates that at lower pressures Z generally increases with increasing temperature at anyone pressure. At higher values of pressure, the situation is reversed; that is, Z decreases wi th increasing temperature at anyone pressure.

I I -3.5 I I
I I I i /." K I II .. ~ I h 6
T I / 7
/ ~ .y//9 J I / 7: /// / / ~~ '~ /' ..----" .12
~-tY// /:::-T ~4 _-:r--/ I /y.-t::,/ /' .----~ I~'-IB //~~I --:::::::;
~=- 20 'K~
/ ~~~ ' ~---+-.
2.5
Z 2
1.5
I - .. + - i ,\'b tp' I I I Y I I
~ ~
I
.5
10 20 30 40 50 60 70 80 90 100 PRESSURE> atm
FI GUR E 5. Compressibili ty Jacl or Z Jar heliwn gas.
The point of intersection may also depend to a lesser exten t upon the variation of ((Iv) with temperature and pressure. Even though th e necessary thermodynamic data arc now available, a suitable method of computation of the nonequilibrium pressure rise that would be expected in a container which will suppor t temperature gradients has noL yet been attempted.
23
------_.- -_ ..
6. Conclusion
The presence of a good hea t conciuct ing ma terial appears to be the most satisfacto ry meLhod of eliminating temperature gradients and unnecessarily high pressures as well as allowing a pressure rise prediction to be made with the aid of figure 1. It is to be expected that both geometry and the distribution of heat input will influence the stratification tel1clel1cies of a D ewar. The use of high condu ctivity construction materials such as ahmlinum and copper will greatly reduce this tendency . V cry large D ewars may require additional material to conduct h eat into the center of the helium mass .
7. References
[1) R . E. Brown, Economic and other aspects of t he distrit ribu tion of Navy helium in liqu id form, Proc. of Cryogenic Eng. Co nf. , Bould er, Colo. (Aug. 1957) .
[2) G ,·enier, Phys. R ev. 83, 598 (1951). [:3) Ubbihm, Ph ysica l3, 629 (1947). [4) D . B. Ma nn a nd R . B. Stewarl, Th erm ody na mi c prop
e rt ies of h elium at low t emperatures a lld high pressures, N BS T ech . Note 8 (PB1 51:367) (19.59).
l5) W. H . Keeso m, 11eliu l1l , p . 2:36 (E lse vier, ~ew York , K. Y., 1942) .
[6) R. B. Scott, Cryogeni c engin eerin g, p. 246 (D . Van Nost ra nd Co., In c., Xe \\· York, ~.Y. , 1959) .
BOU LDEH, COL O. (P aper 64C l - 20)