Embed Size (px)
Citation preview
Colorimetric Detection of Small Molecules in
Complex Matrices via Target-Mediated Growth of
Aptamer-Functionalized Gold Nanoparticles
Jun Hui Soh,†,‡ Yiyang Lin,† Subinoy Rana,† Jackie Y. Ying,‡ and Molly M. Stevens*,†
† Department of Materials, Department of Bioengineering, and Institute of Biomedical
Engineering, Imperial College London, London SW7 2AZ, London, U.K.
‡ Institute of Bioengineering and Nanotechnology, 31 Biopolis Way, The Nanos, Singapore
138669, Singapore
* Corresponding author (M.M.S):
Email: [email protected]
Tel: +44 (0)207 594 6804
Fax: +44 (0)207 594 6757
1

ABSTRACT: A versatile and sensitive colorimetric assay that allows the rapid detection of
small molecule targets using the naked eye is demonstrated. The working principle of the assay
integrates aptamer-target recognition, and the aptamer-controlled growth of gold nanoparticles
(Au NPs). Aptamer-target interactions modulate the amount of aptamer strands adsorbed on the
surface of aptamer-functionalized Au NPs via desorption of the aptamer strands when target
molecules bind with the aptamer. Depending on the resulting aptamer coverage, Au NPs grow
into morphologically varied nanostructures, which give rise to different colored solutions. Au
NPs with low aptamer coverage grow into spherical NPs, which produce red-colored solutions,
whereas Au NPs with high aptamer coverage grow into branched NPs, which produce blue-
colored solutions. We achieved visible colorimetric response and nanomolar detection limits for
the detection of ochratoxin A (1 nM) in red wine samples, as well as cocaine (1 nM) and 17β-
estradiol (0.2 nM) in spiked synthetic urine and saliva, respectively. The detection limits were
well within clinically and physiologically relevant ranges, and below the maximum food safety
limits. The assay is highly sensitive, specific, and able to detect an array of analytes rapidly
without requiring sophisticated equipment, making it relevant for many applications, such as
high-throughput drug and clinical screening, food sampling and diagnostics. Furthermore, the
assay is easily adapted as a chip-based platform for rapid and portable target detection.
KEYWORDS: Small molecules, aptamer, gold nanoparticle growth, visual/colorimetric
biosensor, complex matrices
2
INTRODUCTION
Simple, versatile and sensitive colorimetric detection assays, which do not require costly
analytical equipment, are of high importance in the accurate detection of biomarkers in point-of-
care diagnostics, and drug screening and development.1-3 In particular, small molecules are
important targets as they possess an assortment of biological functions, as well as having clinical
and commercial applications. The detection of small molecules, such as mycotoxins,
pharmaceutical drugs, metabolites, neurotransmitters, drugs of abuse and hormones, is important
for food sampling, screening of drugs, environmental analysis and clinical diagnostics.4-6
Traditional small molecule detection involves spectroscopic or chromatographic methods such as
high-performance liquid chromatography (HPLC) and gas chromatography coupled with mass
spectrometry (GC-MS),7, 8 which are tedious and require complex sample preparations, long
testing cycles, slow result turnover, expensive equipment and trained operators.9 Hence,
alternative methods that are simple, inexpensive and equally or more sensitive are needed.
Recently, aptamer-based biosensors for small molecule detection have been developed.10-12
Aptamers are single-stranded nucleic acid sequences that are selected via a process known as
systematic evolution of ligands by exponential enrichment (SELEX). They are utilized as
molecular recognition elements that can bind various targets, such as cells,13, 14 proteins,15-17 in
vivo therapeutic agents18 and small molecules,1, 19 with high affinity and specificity.20 Compared
to antibodies, aptamers are chemically synthesized at low cost and display greater stability
against denaturation,21 allowing them to be used in many applications and settings.22-24 Aptamer-
based electrochemical and fluorescence detection methods for small molecule have been
developed with good sensitivity and detection limits,25-27 however, they still require specialized
instruments, such as an electrochemical workstation or fluorimeter, for signal transduction.
3
During the past decade, novel colorimetric biosensors based on aptamer-Au NP probes have
been developed as Au NPs exhibit unique optical and electronic properties and high molar
extinction coefficient, which allow them to serve as sensitive probes for colorimetric assays.28-33
However, such sensing platforms are mostly based on Au NP aggregation,34, 35 and are not
applicable in biological and complex fluids, as the presence of additional salt, DNA, proteins and
small molecules in complex fluids (such as serum, urine and saliva) would significantly affect
the aggregation of Au NPs.
In this Article, we demonstrate a sensitive colorimetric assay for the naked eye detection of
various small molecules in complex matrices using aptamer-Au NP probes. The core strategy of
our solution-based assay utilizes aptamer-target recognition to mediate the growth of aptamer-
functionalized Au NPs, whereby depending on the target concentration, and hence the amount of
aptamer adsorbed on the Au NP surface, we generate morphologically varied Au nanostructures,
which consequently produce solutions of different colors that can be observed visually. The
advantages of this assay are high sensitivity, specificity and applicability in various complex
matrices. Our model targets include: (i) ochratoxin A (OTA), which is a mycotoxin that
contaminates grains, coffee and wine worldwide, (ii) cocaine, which is a commonly abused drug
that causes serious medical complications, such as myocardial infarction and strokes,36 and (iii)
17β-estradiol (estradiol), which is a steroid hormone that regulates various brain functions and
the female reproductive system.37 In particular, we demonstrate target detection in real wine
samples as well as physiologically relevant matrices using our assay, which only required simple
sample preparation steps.
EXPERIMENTAL SECTION
4
Materials. Aptamers were custom synthesized by Integrated DNA Technologies, Inc. (Belgium),
(see sequences in Table 1). Gold nanoparticles (Au NPs) were obtained from BBI Solutions
(Cardiff, UK). Ochratoxin A (OTA) and Ochratoxin B (OTB) were obtained from Enzo Life
Sciences (UK) Ltd. and Santa Cruz Biotechnology, Inc., respectively. Cocaine hydrochloride,
17β-estradiol, L-phenylalanine, hydroxylamine, hydrogen tetrachloroaurate (III) (HAuCl4.3H2O)
and polyethylene glycol (PEG, 8 kDa) were obtained from Sigma-Aldrich (UK). Synthetic urine
(SurineTM) and saliva (OraFlx), and red wine reference material were obtained from LGC
Standards (Middlesex, UK). Commercial red wine was purchased from local Sainsbury’s
Supermarket (London, UK). OTA immuno-affinity column (RIDA® OTA) was obtained from
R-Biopharm AG (Darmstadt, Germany). Sodium dodecyl sulfate (SDS) solution (10% w/v) was
obtained from Promega (UK). Nuclease-free water was obtained from Life Technologies (UK).
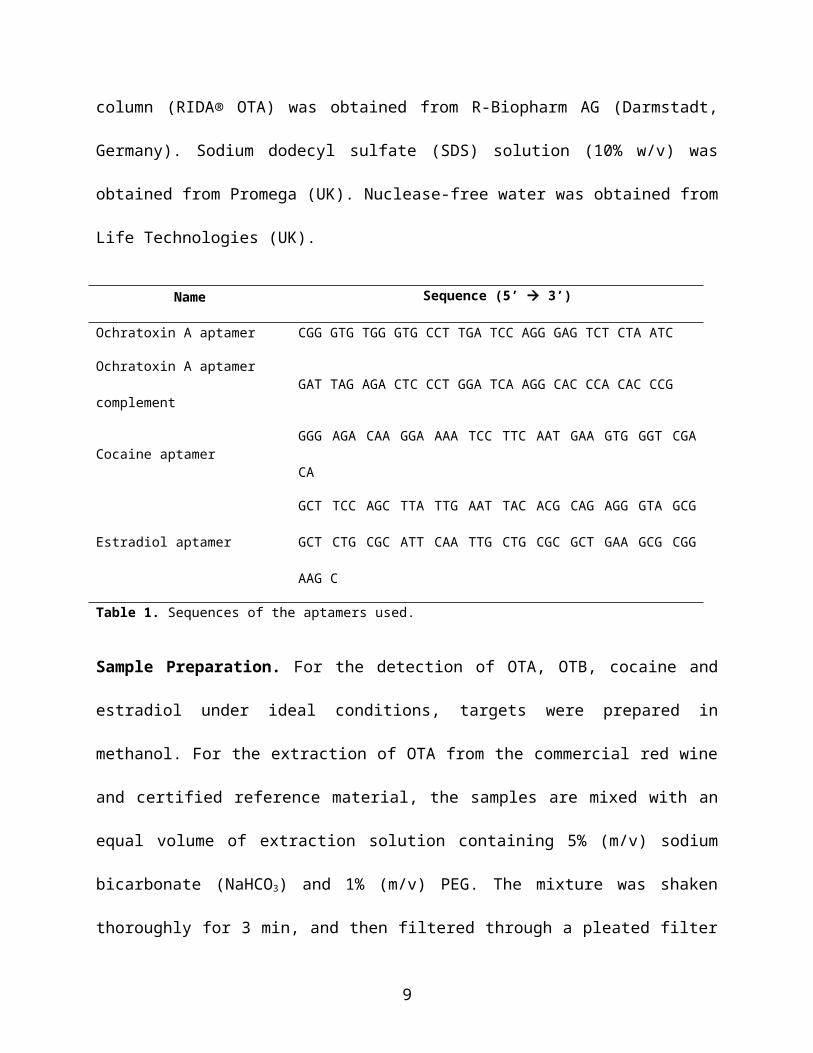
Name Sequence (5’ 3’)
Ochratoxin A aptamer CGG GTG TGG GTG CCT TGA TCC AGG GAG TCT CTA ATC
Ochratoxin A aptamer
complementGAT TAG AGA CTC CCT GGA TCA AGG CAC CCA CAC CCG
Cocaine aptamer GGG AGA CAA GGA AAA TCC TTC AAT GAA GTG GGT CGA CA
Estradiol aptamerGCT TCC AGC TTA TTG AAT TAC ACG CAG AGG GTA GCG GCT
CTG CGC ATT CAA TTG CTG CGC GCT GAA GCG CGG AAG C
Table 1. Sequences of the aptamers used.
Sample Preparation. For the detection of OTA, OTB, cocaine and estradiol under ideal
conditions, targets were prepared in methanol. For the extraction of OTA from the commercial
red wine and certified reference material, the samples are mixed with an equal volume of
extraction solution containing 5% (m/v) sodium bicarbonate (NaHCO3) and 1% (m/v) PEG. The
5
mixture was shaken thoroughly for 3 min, and then filtered through a pleated filter paper (Grade
595 1/2). The pH was brought to ~ 7 using PBS, and passed through a syringe filter (0.2 µm)
before applying the mixture to the immuno-affinity column (IAC), following manufacturer’s
protocol. Captured OTA was eluted using methanol.
For spiking cocaine in synthetic urine, desired concentrations were obtained by 10× dilution of
prepared cocaine solutions in undiluted synthetic urine. The spiked solution was then diluted 36×
before addition to the aptamer-Au NP probe.
For spiking estradiol in synthetic saliva, desired concentrations were obtained by 10× dilution of
prepared estradiol solutions in undiluted synthetic saliva. Next, methanol (4× the volume of
synthetic saliva) was added for the precipitation of protein, which was incubated overnight at
4°C. Then the solutions were centrifuged at 20,800 rcf for 30 min (room temperature). The
supernatant was collected and added directly to the aptamer-Au NP probe.
Aptamer-Gold Nanoparticle Adsorption. The amount of aptamers required for Au NP growth
was determined by a calibration experiment so that the peak wavelength of grown Au NPs was
about 615 nm (see Figure 2c, which depicts such a calibration curve). Adsorption reactions were
conducted overnight at room temperature. The amounts of aptamer and MgCl2 used for each
targets were optimized to produce the largest peak shift at the limits of detection.
The volumes stated here refer to the preparation of aptamer-Au NP probes in a single well
(volume of 180 µL), and can be scaled up depending on the number of wells required. For OTA
detection (both in aqueous and in red wine samples), 7.5 µL of OTA aptamer (2 µM) was added
to 0.5 µL of 5-nm Au NP (83 nM), 20 µL of MgCl2 (1 mM) and 152 µL of water. In the study of
6
probe size effect, 11 µL of OTA aptamer (2 µM) was added to 4.4 µL of 10-nm Au NP (9.5 nM),
20 µL of MgCl2 (1 mM) and 144.6 µL of water.
For cocaine detection (ideal conditions), 18.2 µL of cocaine aptamer (2 µM) was added to 2 µL
of 5-nm Au NP (83 nM), 20 µL of MgCl2 (100 µM) and 139.8 µL of water. For the detection of
spiked cocaine in synthetic urine, 16.6 µL of cocaine aptamer (2 µM) was added to 10 µL of 5-
nm Au NP (83 nM), 20 µL of MgCl2 (100 µM), 8 µL of SDS (10%) and 125.4 µL of water.
For estradiol detection (ideal condition), 16 µL of estradiol aptamer (2 µM) was added to 0.5 µL
of 5-nm Au NPs (83 nM), 20 µL of MgCl2 (100 µM) and 143.5 µL of water, and for the
detection of spiked estradiol in synthetic saliva, 45 µL of estradiol aptamer (2 µM) was added to
0.5 µL of 5-nm Au NPs (83 nM), 20 µL of MgCl2 (100 µM) and 114.5 µL of water.
Target Detection and Au NP growth (Signal Generation). The assays were carried out in clear
96-well plates (tissue culture treated, Corning) at room temperature. Target solutions (20 µL)
were added to the aptamer-Au NP probe solution (180 µL, pH 6.5). This was followed by
incubation for 30 min. The presence of divalent cations such as Mg2+ mediated aptamer-target
binding by bridging the interaction between the target and aptamer.38 Next, 5 µL of
hydroxylamine (130 mM for OTA detection and 400 mM for cocaine and estradiol detection)
and 10 µL of HAuCl4 (1.9 mM) were sequentially added to the target-probe solution (final pH =
3.0). Another 3 aliquots of HAuCl4 (10 µL, 1.9 mM) were then added with a 5-min incubation
between each addition. The solutions were mixed thoroughly using the pipette while adding to
each well. We found that less aptamer was required for the growth of branched Au NPs using a
stepwise addition of HAuCl4, compared to a single addition. This enabled the use of low
quantities of aptamers when preparing the aptamer-Au NP probes, and helped improved the
7
sensitivity of the assay. Photographs showing the color changes were taken after the last HAuCl4
addition. Ultraviolet-visible (UV-vis) spectra were measured with a SpectraMax M5 plate reader
(Molecular Devices, USA).
TEM Imaging. Samples were prepared on copper-supported carbon films by depositing a drop
of solution (5 µL) on the film and allowing it to dry overnight. TEM images were acquired with
a JEOL 2000FX, using 200 kV acceleration voltage.
Dynamic Light Scattering (DLS). Dynamic light scattering measurements were performed at
25ºC on a Malvern Zetasizer Nano ZS (Malvern, UK) with a backscattering detection at 173º and
a He-Ne laser (λ = 632.8 nm). Each sample was incubated at 25ºC for 2 min to reach equilibrium
before measurement.
Aptamer Desorption Analysis. The assay for OTA detection was carried out as described
above, and the zeta potential measurement was conducted using a Zetasizer Nano ZS (Malvern,
UK). For fluorescence study, 1 µL of FAM-modified OTA aptamer (2 µM) was added to 50 µL
of 40-nm Au NP (0.15 nM), 20 µL of MgCl2 (1 mM) and 109 µL of water, and then incubated
overnight. 40-nm Au NPs were used so as to attain sufficient quenching of FAM-modified OTA
aptamers. OTA solutions at desired concentrations were added and incubated at room
temperature for 30 min. The solution was centrifuged at 2,300 rcf for 10 min, and fluorescence
of the supernatant was measured using a SpectraMax M5 plate reader (excitation and emission
wavelengths: 495 nm and 530 nm, respectively).
Circularity Analysis. ImageJ v1.48 (http://imagej.nih.gov/ij/) was used for the circularity
analysis. TEM images were loaded and converted to binary with ‘Watershed’ applied. Next, the
8
‘Analyze Particle’ function was used to obtain the values for circularity. Circularity values for
particles with 2D projection area less than 1000 were omitted.
Aptamer-Au NP Probes Immobilization on Aminosilane-Coated Glass Slide. A 7-µL
solution containing 10-nm Au NPs (2.4 nM), OTA aptamers (0.6 µM) and MgCl 2 (100 µM) was
applied onto the glass slide, and left to dry overnight at room temperature. The glass slide was
then washed with water and dried with N2 to remove unbound aptamer-Au NP probes.
Target Detection on Aminosilane-Coated Glass Slide. Target solutions (6 µL) with desired
OTA concentrations were added to the immobilized probes on the glass slide, and incubated for
30 min at room temperature. Hydroxylamine (2 µL, 50 mM) and HAuCl4 (4 µL, 1.2 mM) were
added for Au NP growth. Another aliquot of HAuCl4 (4 µL, 1.2 mM) was added after a 5-min
incubation. Photographs showing the color changes were taken after the last HAuCl4 addition.
Red, Green, Blue (RGB) Analysis. ImageJ v1.48 was used for the RGB analysis of the glass
slide photographs. A circular region outlining each color spots was selected, and the ‘Histogram’
function was used to obtain the mean red and blue intensities within the region.
RESULTS AND DISCUSSION
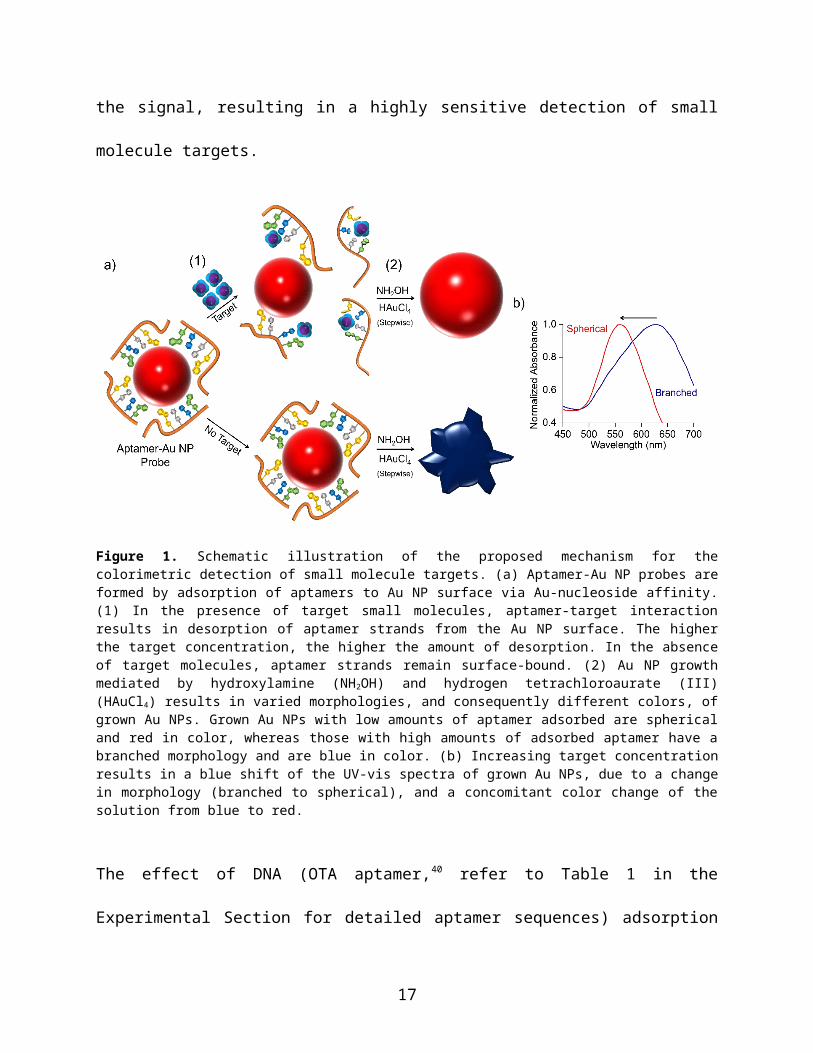
Detecting Small Molecules using Aptamer-Au NP Probes. Figure 1 shows a schematic
illustration of our assay. Citrate-stabilized Au NPs (5 nm) are initially functionalized with
aptamers, via physical adsorption. In the presence of target molecules, specific aptamer-target
interaction triggers desorption of aptamers from the Au NPs surface. The amount of adsorbed
aptamer remaining on the Au NP surface is dependent on the target concentration, i.e. the higher
the target concentration, the lower the amount of adsorbed aptamer. Thereafter, Au NP growth
9
reaction is conducted by adding NH2OH and HAuCl4. Au NPs with low aptamer coverage grow
into spherical NPs, with resultant red-colored solutions. For Au NPs with high aptamer coverage,
the presence of aptamer strands disrupt the homogeneous growth of the Au NPs, causing grown
NPs to exhibit a branched morphology, with resultant blue-colored solutions.39 Consequently, an
increase in target concentration causes a change in the morphology of grown Au NPs (branched
to spherical), and a color change of the solution from blue to red. Such morphological and color
changes can be characterized by a blue shift in the UV-vis spectrum of grown Au NPs. Notably,
the stepwise addition of Au3+ amplified the signal, resulting in a highly sensitive detection of
small molecule targets.
Figure 1. Schematic illustration of the proposed mechanism for the colorimetric detection of small molecule targets. (a) Aptamer-Au NP probes are formed by adsorption of aptamers to Au NP surface via Au-nucleoside affinity. (1) In the presence of target small molecules, aptamer-target interaction results in desorption of aptamer strands from the Au NP surface. The higher the target concentration, the higher the amount of desorption. In the absence of target molecules, aptamer strands remain surface-bound. (2) Au NP growth mediated by hydroxylamine (NH 2OH) and hydrogen tetrachloroaurate (III) (HAuCl4) results in varied morphologies, and consequently different colors, of grown Au NPs. Grown Au NPs with low amounts of aptamer adsorbed are spherical and red in color, whereas those with high amounts of adsorbed aptamer have a branched morphology and are blue in color. (b) Increasing target concentration results in a blue shift of the UV-vis spectra of grown Au NPs, due to a change in morphology (branched to spherical), and a concomitant color change of the solution from blue to red.
10
The effect of DNA (OTA aptamer,40 refer to Table 1 in the Experimental Section for detailed
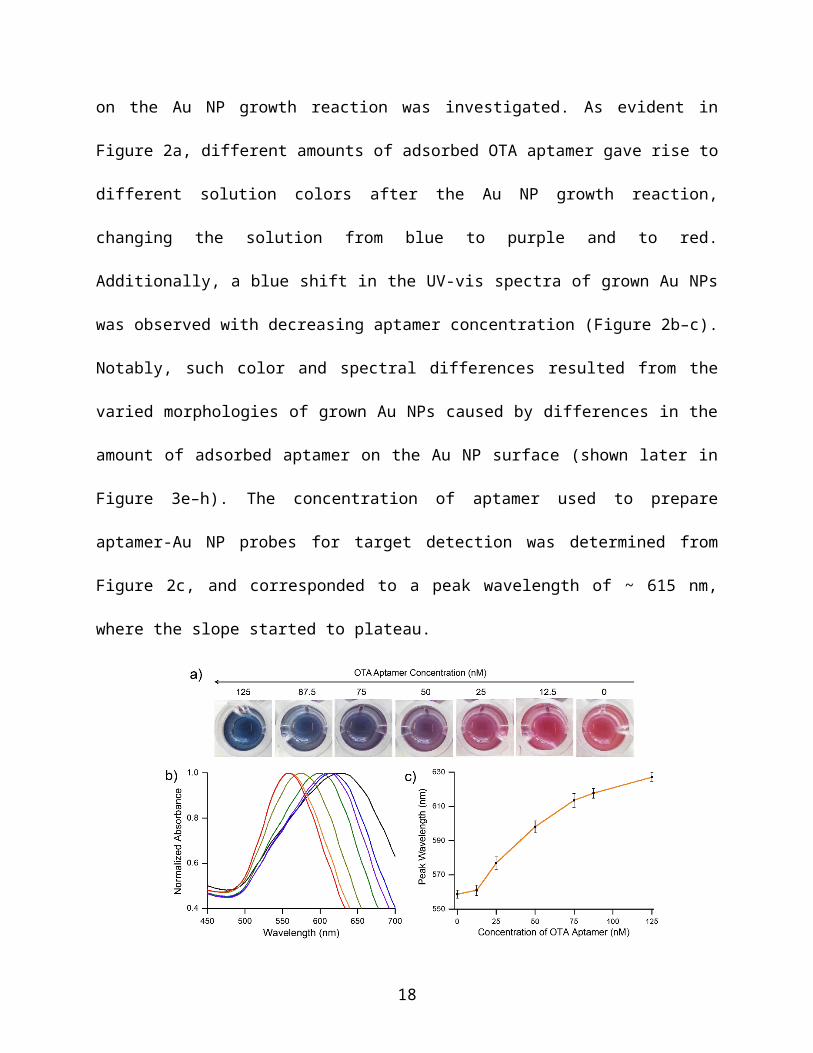
aptamer sequences) adsorption on the Au NP growth reaction was investigated. As evident in
Figure 2a, different amounts of adsorbed OTA aptamer gave rise to different solution colors after
the Au NP growth reaction, changing the solution from blue to purple and to red. Additionally, a
blue shift in the UV-vis spectra of grown Au NPs was observed with decreasing aptamer
concentration (Figure 2b–c). Notably, such color and spectral differences resulted from the
varied morphologies of grown Au NPs caused by differences in the amount of adsorbed aptamer
on the Au NP surface (shown later in Figure 3e–h). The concentration of aptamer used to prepare
aptamer-Au NP probes for target detection was determined from Figure 2c, and corresponded to
a peak wavelength of ~ 615 nm, where the slope started to plateau.
Figure 2. (a) Photographs showing the different colors generated after the growth of 5-nm Au NPs with different concentrations of aptamers added. The tonality of the solutions changed from blue to purple and then to red, with a decreasing concentration of aptamer. (b) UV-vis spectra of Au NP grown with the addition of 125 nM (black), 87.5 nM (blue), 75 nM (purple), 50 nM (green), 25 nM (gold), 12.5 nM (orange) and 0 nM (red) of OTA aptamer. A blue shift of the LSPR spectra was observed as the concentration of aptamers decreased. (c) Corresponding peak shifts in the grown Au NP solution with an increasing concentration of aptamers. Error bars indicate the standard deviation (SD) of 5 independent experiments.
Detection of OTA. As a proof-of-concept demonstration, we adapted the assay to detect our first
11
model target, OTA. Briefly, OTA aptamers were adsorbed onto 5-nm Au NPs. The aptamer-Au
NP probes were then incubated with OTA (30 min at room temperature), and Au NP growth was
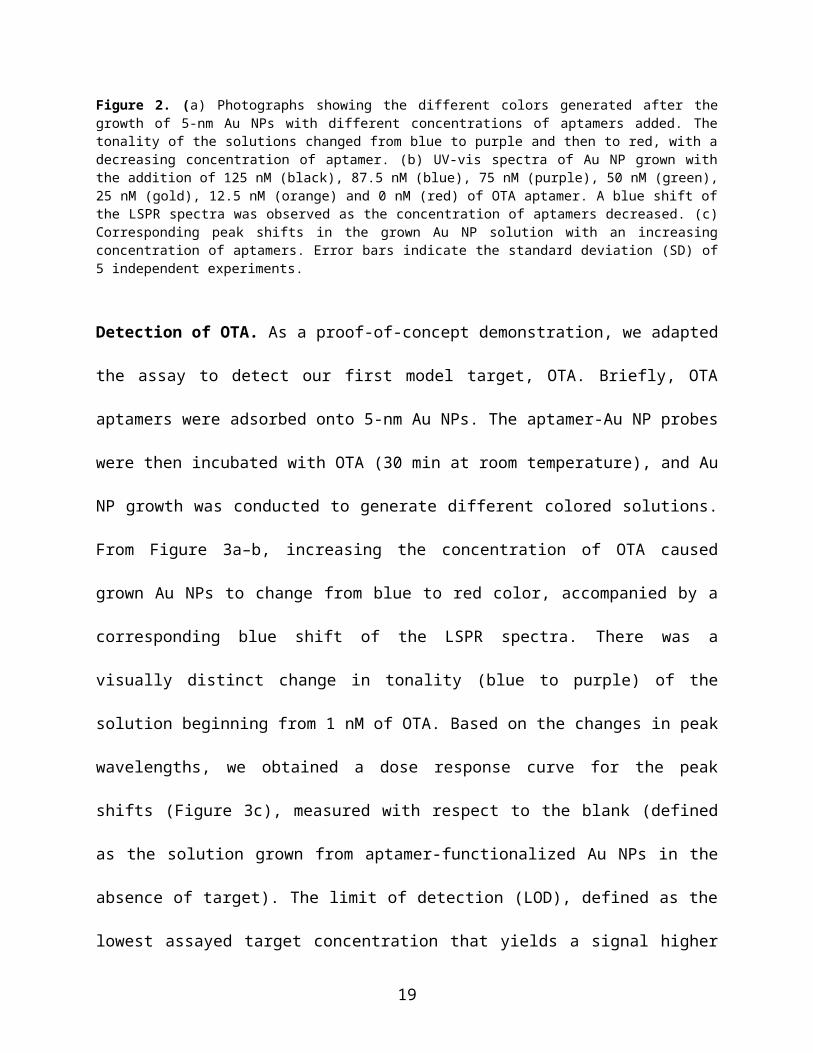
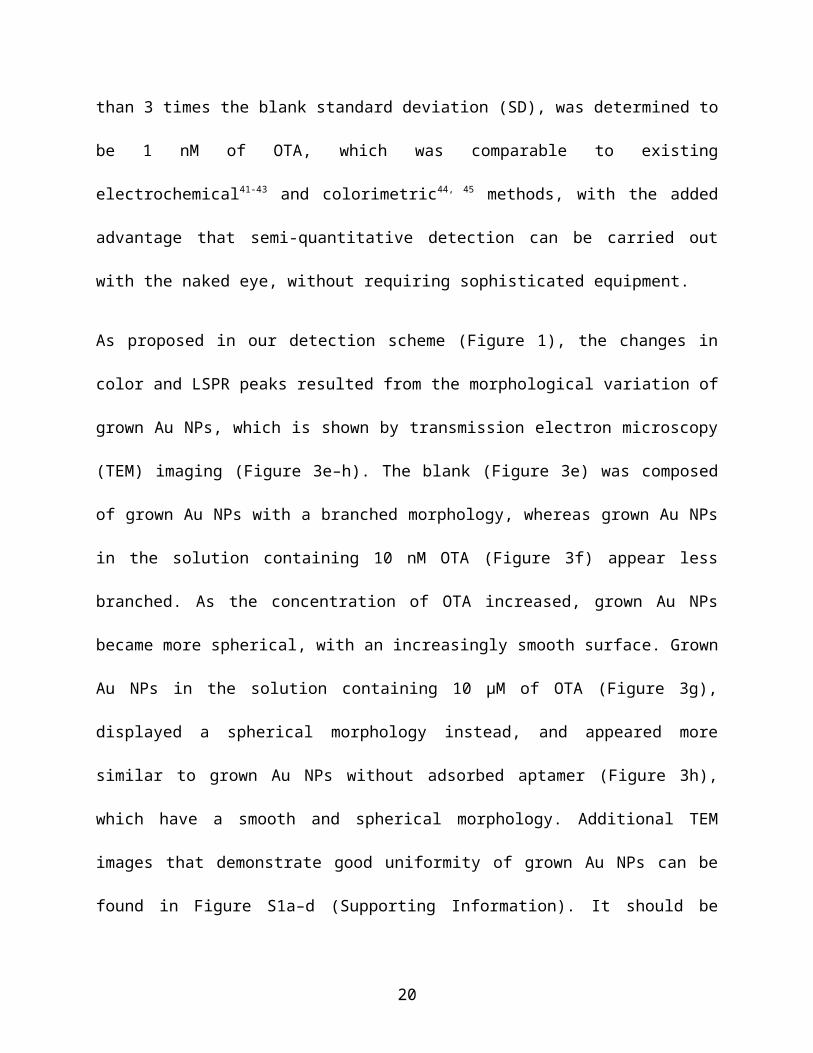
conducted to generate different colored solutions. From Figure 3a–b, increasing the
concentration of OTA caused grown Au NPs to change from blue to red color, accompanied by a
corresponding blue shift of the LSPR spectra. There was a visually distinct change in tonality
(blue to purple) of the solution beginning from 1 nM of OTA. Based on the changes in peak
wavelengths, we obtained a dose response curve for the peak shifts (Figure 3c), measured with
respect to the blank (defined as the solution grown from aptamer-functionalized Au NPs in the
absence of target). The limit of detection (LOD), defined as the lowest assayed target
concentration that yields a signal higher than 3 times the blank standard deviation (SD), was
determined to be 1 nM of OTA, which was comparable to existing electrochemical41-43 and
colorimetric44, 45 methods, with the added advantage that semi-quantitative detection can be
carried out with the naked eye, without requiring sophisticated equipment.
As proposed in our detection scheme (Figure 1), the changes in color and LSPR peaks resulted
from the morphological variation of grown Au NPs, which is shown by transmission electron
microscopy (TEM) imaging (Figure 3e–h). The blank (Figure 3e) was composed of grown Au
NPs with a branched morphology, whereas grown Au NPs in the solution containing 10 nM
OTA (Figure 3f) appear less branched. As the concentration of OTA increased, grown Au NPs
became more spherical, with an increasingly smooth surface. Grown Au NPs in the solution
containing 10 µM of OTA (Figure 3g), displayed a spherical morphology instead, and appeared
more similar to grown Au NPs without adsorbed aptamer (Figure 3h), which have a smooth and
spherical morphology. Additional TEM images that demonstrate good uniformity of grown Au
NPs can be found in Figure S1a–d (Supporting Information). It should be noted that the red shift
12
of the LSPR spectrum of the blank solution was due to localized low-energy plasmon at the tips
of the branches as opposed to aggregation. Indeed, dynamic light scattering (Figure S2,
Supporting Information) showed no aggregation of Au NPs. Furthermore, particle analysis using
ImageJ showed a significant increase in particle circularity, as their morphology evolved from
branched to spherical NPs, with an increasing concentration of OTA (Figure 3d).
Figure 3. (a) Photographs showing the colorimetric detection of OTA with the naked eye, whereby grown Au NPs changed from blue to red with an increasing concentration of OTA. “Au NP only” refers to Au NPs without OTA aptamer adsorption. (b) UV-vis spectra of grown Au NPs corresponding to blank (black), 0.01 nM (blue), 1 nM (purple), 100 nM (green), 1 µM (gold), 10 µM (orange) of OTA, and Au NPs without OTA aptamer adsorption (red). (c) Peak shifts of various OTA concentrations measured with respect to the peak wavelength of the blank. Error bars indicate the SD of 5 independent experiments. (d) Mean circularity of grown Au NPs, where circularity increased as grown Au NPs became more spherical morphologically. Error bars represent the standard error for n ≥ 250 NPs. Analysis of variance (ANOVA) using the Bonferroni test with pairwise comparison; *P < 0.01. TEM images of grown Au NPs for (e) blank, (f) 10 nM of OTA, (g) 10 µM of OTA and (h) Au NPs without OTA aptamer adsorption. Scale bars = 100 nm.
Zeta potential and fluorescence analysis showed that the addition of OTA to the aptamer-Au NP
probe caused aptamer desorption from the Au NP surface. Figure S3a (Supporting Information)
shows that the addition of OTA aptamer caused the zeta potential of Au NPs to change from -13
13
mV (Au NPs only, without OTA aptamer adsorption) to -22 mV (blank), indicating the
adsorption of negatively charged nucleic acid strands onto the surface of Au NPs. Increasing the
concentration of OTA caused the zeta potential to become less negative, suggesting aptamer
desorption from the Au NP surface. The same conclusion was achieved from fluorescence
analysis. FAM-labeled OTA aptamer were adsorbed onto Au NPs, where the fluorescence of
FAM was quenched by the Au NPs via fluorescence resonance energy transfer. When incubated
with OTA, the presence of OTA restored the fluorescence of FAM, leading to an increase in
fluorescence with increasing OTA concentration (Figure S3b, Supporting Information). This
demonstrates that the addition of OTA caused the desorption of FAM-labeled aptamers from the
surface of Au NPs via aptamer-target binding.
In order to exclude the possibility non-specific interactions between OTA and bare Au NP
(without aptamer adsorbed), the Au NP growth reaction was conducted after incubating bare Au
NPs with OTA. There was minimal red shift (Figure S4a, Supporting Information) even at the
highest OTA concentration (10 µM), indicating that OTA did not affect the growth reaction in
the absence of OTA aptamer. Further control experiments were performed to confirm that the
color and spectral changes of grown Au NP were the results of specific aptamer-target
interactions. Firstly, instead of adsorbing the OTA aptamer onto Au NPs, the complementary
sequence of the OTA aptamer was adsorbed. The resulting grown Au NPs showed negligible
color change and peak shift (Figure S4b–c, Supporting Information), suggesting that OTA
specifically recognizes and binds to the OTA aptamer. Therefore, the assay is expected to be also
applicable for the fast-screening of DNA binding to a particular target, in aptamer selection and
binding assays. Next, cross-reactivity of the OTA aptamer with ochratoxin B (OTB) and L-
phenylalanine, which have similar structures to OTA (Figure S5, Supporting Information), was
14
tested. There was virtually no color change when L-phenylalanine and a low concentration of
OTB (10 nM) were added to the aptamer-Au NP probes, although a color change and peak shift
were observed at higher OTB concentrations (> 100 nM) (Figure S4b–c, Supporting
Information). Since OTB is found at lower levels (< 0.3 to 4.9 nM) in various food products
compared to OTA,46-49 the presence of OTB should not result in significant interference in the
detection of OTA in food samples.
It is worth noting that the assay works even when the ratio of aptamer to target is in excess. Since
free aptamer does not influence the branched particle growth as observed in our control
experiment (Figure S6, Supporting Information) and elsewhere in the literature,39 the absorbance
change should be arising from aptamer-target binding, and then amplified by the stepwise Au NP
growth. Nevertheless, the exact mechanism of nanoscale growth under the present conditions
could well consist of other molecular level interactions, which will require further detailed
investigations to elucidate.
Detection of OTA in Red Wine Samples. The European Commission has set a maximum limit
of 2.0 µg/kg (5.0 nM) for OTA in wine (EC No. 1881/2006). Since our assay has demonstrated a
lower LOD than this limit, and to test the applicability of the assay in screening contaminated
wine samples, we applied our assay to commercially purchased red wine from the local
supermarket and red wine reference material that was certified to contain 0.52 µg/L (1.3 nM) of
OTA. Briefly, red wine samples were passed through an immuno-affinity column (IAC), which
has been reported to improve sample extraction and purification, and has been widely used in
conjunction with many HPLC methods for OTA detection.50, 51 The eluted solution was then
added to the aptamer-Au NP probe for testing. The commercial red wine experienced a slight
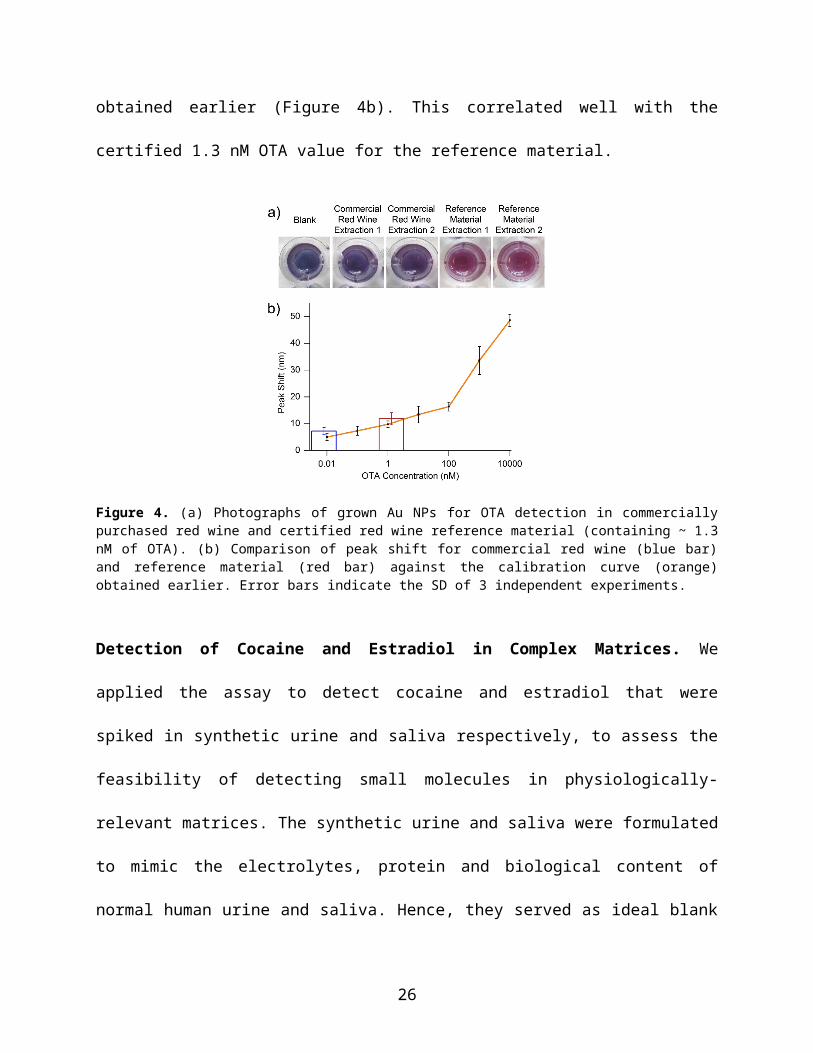
color change and a small peak shift (Figure 4), whereas the certified reference material caused a
15
color change, blue to red (Figure 4a), and a peak shift that corresponded to an OTA
concentration of ~ 3 nM, when compared to the calibration curve obtained earlier (Figure 4b).
This correlated well with the certified 1.3 nM OTA value for the reference material.
Figure 4. (a) Photographs of grown Au NPs for OTA detection in commercially purchased red wine and certified red wine reference material (containing ~ 1.3 nM of OTA). (b) Comparison of peak shift for commercial red wine (blue bar) and reference material (red bar) against the calibration curve (orange) obtained earlier. Error bars indicate the SD of 3 independent experiments.
Detection of Cocaine and Estradiol in Complex Matrices. We applied the assay to detect
cocaine and estradiol that were spiked in synthetic urine and saliva respectively, to assess the
feasibility of detecting small molecules in physiologically-relevant matrices. The synthetic urine
and saliva were formulated to mimic the electrolytes, protein and biological content of normal
human urine and saliva. Hence, they served as ideal blank matrices for developing assays to test
urine or saliva samples. Cocaine is an important target due to mounting demands for its rapid
detection in law enforcement and clinical settings.9 Using a reported cocaine aptamer,26 we
obtained a LOD of 0.1 nM for cocaine detection under ideal conditions (Figure S7a, Supporting
Information). We then proceeded to test spiked synthetic urine samples. By coating the aptamer-
16
Au NP probes with SDS (0.4%), we could conduct the assay after a simple dilution step (36×) of
the sample, prior to addition to the aptamer-Au NP probes (Figure S7b, Supporting Information).
We observed an obvious color change from blue to purple with 1 nM of cocaine in synthetic
urine, and then to reddish purple with increasing cocaine concentration (Figure 5a). The LOD
obtained from peak shift measurements was 1 nM (Figure 5b). Note that the concentrations
stated referred to spiked cocaine concentration before dilution. Cocaine levels in the urine of
individuals who have consumed cocaine typically range from 11.8 nM to 118.1 µM;36, 52 hence,
the assay would be well-suited for screening cocaine consumption. Additionally, the LOD of this
assay is comparable to that of GC-MS or HPLC methods (2.9 nM),53, 54 making our assay a
powerful and more cost-efficient alternative, especially in clinical or toxicological settings where
the testing of multiple samples is needed, as the assay can be performed in a well-plate format
for high-throughput sample detection.
The estradiol aptamer developed by Kim et al.55 has mostly been used to detect estradiol in water
samples.6 However, aptameric detection of estradiol in physiologically-relevant fluids for clinical
screening and diagnostics has yet to be studied, and can be used to assess ovarian function56 and
risks of breast cancer.57 Detection of salivary estradiol is advantageous as salivary steroid
hormones are found in their free/active form,58 and there is a good correlation between salivary
and serum levels of hormones such as cortisol and estradiol.59, 60 For estradiol detection
performed under ideal conditions, we obtained a LOD of 0.1 nM (Figure S8, Supporting
Information). As saliva contains a higher protein concentration compared to urine,61 a simple
protein precipitation step using methanol was conducted for spiked synthetic saliva samples, to
remove protein interferences. The solution changed from blue to purple for synthetic saliva
spiked with 0.2 nM of estradiol (Figure 5c), which was also the LOD (Figure 5d). This LOD was
17
comparable to the higher physiological range (18 pM to 0.13 nM)62-64 of salivary estradiol in
women. The ability to detect salivary targets would be ideal for diagnostics and the detection of
other hormones such as cortisol, which has a salivary concentration of 3.2 nM in healthy people
and 44.1 nM in people with Cushing’s syndrome.65, 66 There are further applications in sports
medicine, such as monitoring hormonal fluctuations and detection of performance-enhancing
drugs or androgens.67
Figure 5. (a) Photographs of grown Au NPs for cocaine detection in spiked synthetic urine. (b) Peak shifts of various cocaine concentrations measured with respect to the peak wavelength of the blank. Concentrations stated are before dilution of spiked synthetic urine samples. Error bars indicate the SD of 3 independent experiments. (c) Photographs of grown Au NPs for estradiol detection in spiked synthetic saliva. (d) Peak shifts of various estradiol concentrations measured with respect to the peak wavelength of the blank. Concentrations stated are spiked synthetic saliva samples before protein precipitation using methanol. Error bars indicate the SD of 3 independent experiments.
18
In principle, the amplitude of the LSPR peak shift of grown Au NPs depends on the extent of
aptamer desorption from the Au NP surface, and this is mainly governed by two factors: (i)
aptamer-target binding, which is dependent on the dissociation constant (Kd) of the aptamer,
where a lower Kd promotes aptamer-target binding and aptamer desorption, and (ii) the aptamer-
Au NP affinity, which depends on the aptamer length, where a longer length leads to stronger
aptamer-Au NP binding, and hence hinders aptamer desorption. Therefore, a low Kd and a short
aptamer length are expected to generate a large peak shift. For instance, a large peak shift of 35
nm was observed with 1 µM of OTA (Figure 3c) due to the strong aptamer-OTA affinity (Kd ~
96 nM)40 and a short aptamer length of 36 nucleotides (nt). In contrast, the peak shift was
relatively small (~ 11 nm) with 1 µM of cocaine (Figure S7a, Supporting Information) as the
aptamer-cocaine interaction is weaker (Kd ~ 400 nM)26, although the aptamer is similar in length
(38 nt). In the case of estradiol detection, the aptamer-estradiol binding has a K d of 130 nM,55
however, due to its length of 76 nt, we observed only a 9-nm shift at 1 µM of estradiol (Figure
S8, Supporting Information). These observations on the relationship between aptamer-target
binding and aptamer-Au NP affinity, and their effect on the LSPR peak shift should be useful in
the design of small molecule sensors with high signal-to-noise ratio.
Effects of Probe Size and Salt Concentration on Target Detection. To investigate the effect
of probe size on the sensitivity of our assay, 10-nm Au NPs were used to prepare the aptamer-Au
NP probes. Using 10-nm NPs in the assay resulted in lower signals compared to 5-nm probes
(Figure S9a, Supporting Information) since there are more aptamers present on the 10-nm NPs
due to their larger surface area. Therefore, more target molecules are required to desorb aptamers
from the 10-nm Au NP surface, and to generate a comparable peak shift as that obtained from 5-
19
nm Au NPs. Salt from complex matrices and residual salt after sample preparation may affect the
growth of Au NPs and target detection. To study the effect of salt on the assay, the target
solution was supplemented with various concentrations of NaCl. When the target solution
contained an additional 10 mM of NaCl, peak shifts remained relatively unchanged (Figure S9b,
Supporting Information), whereas peak shifts were reduced when the target solution contained an
additional 50 mM of NaCl. The presence of more salt may have strengthened the aptamer-Au NP
affinity due to charge screening by NaCl; therefore, the ability of the target molecules to desorb
the aptamers from the surface of the Au NPs is weakened, resulting in smaller blue shifts.
Target Detection on a Solid Substrate. Finally, to demonstrate the versatility of our detection
mechanism, the solution-based assay was translated onto an aminosilane-coated glass slide for
chip-based biosensing applications. The mechanism for target detection is illustrated in Figure
6a. Briefly, aptamer-Au NP probes were first immobilized on the glass slide surface. After
removing the unbound probes, OTA target molecules were incubated with the probes and then
the Au NP growth reaction was directly conducted without requiring any washing step. Similar
to target detection in solution (Figure 3a), a high target concentration led to the growth of red-
colored Au NPs, whereas a low target concentration resulted in blue-colored NPs. Notably, target
detection could be transduced semi-quantitatively using the naked eye (Figure 6b), and further
quantified using RGB analysis (Figure 6c) of glass slide photographs via image processing
software such as ImageJ. The use of glass slide miniaturized the solution-based assay, allowing
low sample consumption, and provided a ready-to-use platform that enabled rapid, highly
portable and sensitive target detection in the field or in resource-limited settings.
20
Figure 6. (a) Schematic illustration of the detection of small molecules on glass slide coated with an (3-aminopropyl)triethoxysilane (APTES) layer. (b) Photograph of grown Au NPs for OTA detection on an aminosilane-coated glass slide. (c) Enlarged view of grown Au NPs on the glass slide, with various OTA target concentrations. Hydrophobic boundaries were created using a black permanent marker for simple patterning of the glass slide. (d) RGB analysis of grown Au NPs, whereby the red vs. blue ratio increased as target concentration increased, indicating a blue-to-red color change. Error bars indicate the SD of 3 independent experiments.
CONCLUSIONS
In this work, we have demonstrated a novel colorimetric assay that couples aptamer-target
recognition and aptamer-mediated control of Au NP morphology, for the sensitive and naked eye
21
detection of three small molecule targets in various complex and physiologically relevant
matrices. We could visually detect as low as 1 nM of OTA in red wine samples, and 1 nM of
cocaine and 0.2 nM of estradiol in synthetic urine and saliva, respectively, with minimal sample
preparation steps. These LODs were lower than the maximum food safety and physiological
limits, and were achieved without expensive equipment or highly qualified personnel, thus
providing a new rapid and cost-efficient method for food/drug screening and diagnostics. The
high sensitivity was made possible through the unique assay mechanism, whereby even small
differences in the amount of adsorbed aptamer could result in morphologically significant
variations in grown Au NPs, enabling visible color changes. Furthermore, the assay was shown
to be equally viable on a solid substrate with good sensitivity and discernible color changes by
the naked eye. The methodology presented here could potentially be adapted for the detection of
any analyte, so long as aptamers directed against it are available. Given the widespread
availability of target-specific aptamers, our assay is well-poised as a versatile tool for the naked
eye detection of a wide array of analytes across various platforms.
22
ASSOCIATED CONTENT
Supporting Information Available. Additional TEM images of grown Au NPs. Dynamic light
scattering, zeta potential and fluorescence measurements of grown Au NPs with various OTA
concentrations. Determination of assay specificity using OTB and L-phenylalanine. Detection of
cocaine and estradiol in ideal conditions. Effects of probe size and salt concentration on target
detection. This material is available free of charge via the Internet at http://pubs.acs.org.
Note: The authors declare no competing financial interest.
AUTHOR INFORMATION
Corresponding Author
*E-mail: [email protected]
ACKNOWLEDGMENT
M.M.S. thanks the Engineering and Physical Sciences Research Council (EPSRC) grant
EP/K020641/1 and the EPSRC Interdisciplinary Research Centre (IRC) “Early-Warning Sensing
Systems” (EP/K031953/1) for funding. J.H.S. is grateful to the Agency for Science, Technology
and Research (A*STAR), Singapore, for provision of the A*STAR Graduate Scholarship.
ABBREVIATIONS
Au NP, gold nanoparticle; SELEX, systematic evolution of ligands by exponential enrichment;
HPLC, high-performance liquid chromatography; GC-MS, gas chromatography coupled with
mass spectrometry; OTA, ochratoxin A; OTB, ochratoxin B; UV-vis, ultraviolet-visible; LOD,
limit of detection; SD, standard deviation; IAC, immuno-affinity column.
REFERENCES
(1) Liu, J. W.; Lu, Y. Angew. Chem. Int. Ed. 2006, 45, 90-94.
23
(2) de la Rica, R.; Stevens, M. M. Nat. Nanotechnol. 2012, 7, 821-824.
(3) Aili, D.; Mager, M.; Roche, D.; Stevens, M. M. Nano Lett. 2011, 11, 1401-1405.
(4) Rhouati, A.; Yang, C.; Hayat, A.; Marty, J. L. Toxins 2013, 5, 1988-2008.
(5) Strehlitz, B.; Reinemann, C.; Linkorn, S.; Stoltenburg, R. Bioanal. Rev. 2012, 4, 1-30.
(6) Yildirim, N.; Long, F.; Gao, C.; He, M.; Shi, H.-C.; Gu, A. Z. Environ. Sci. Technol.
2012, 46, 3288-3294.
(7) Trachta, G.; Schwarze, B.; Sägmüller, B.; Brehm, G.; Schneider, S. J. Mol. Struct. 2004,
693, 175-185.
(8) Buryakov, I. A. J. Chromatogr. B Analyt. Technol. Biomed. Life Sci. 2004, 800, 75-82.
(9) Baker, B. R.; Lai, R. Y.; Wood, M. S.; Doctor, E. H.; Heeger, A. J.; Plaxco, K. W. J. Am.
Chem. Soc. 2006, 128, 3138-3139.
(10) Cheng, A. K.; Sen, D.; Yu, H. Z. Bioelectrochemistry 2009, 77, 1-12.
(11) Wang, R. E.; Zhang, Y.; Cai, J.; Cai, W.; Gao, T. Curr. Med. Chem. 2011, 18, 4175-
4184.
(12) Liu, X.; Wang, F.; Aizen, R.; Yehezkeli, O.; Willner, I. J. Am. Chem. Soc. 2013, 135,
11832-11839.
(13) Kang, D.; Wang, J.; Zhang, W.; Song, Y.; Li, X.; Zou, Y.; Zhu, M.; Zhu, Z.; Chen, F.;
Yang, C. J. PLoS One 2012, 7, e42731.
(14) Xiong, X.; Liu, H.; Zhao, Z.; Altman, M. B.; Lopez-Colon, D.; Yang, C. J.; Chang, L. J.;
Liu, C.; Tan, W. Angew. Chem. Int. Ed. 2013, 52, 1472-1476.
(15) Zhang, H.; Song, Y.; Zou, Y.; Ge, Y.; An, Y.; Ma, Y.; Zhu, Z.; Yang, C. J. Chem.
Commun. 2014, 50, 4891-4894.
(16) Lee, J. H.; Yigit, M. V.; Mazumdar, D.; Lu, Y. Adv. Drug Deliv. Rev. 2010, 62, 592-605.
24
(17) Liu, X. Q.; Aizen, R.; Freeman, R.; Yehezkeli, O.; Willner, I. ACS Nano 2012, 6, 3553-
3563.
(18) Ferguson, B. S.; Hoggarth, D. A.; Maliniak, D.; Ploense, K.; White, R. J.; Woodward, N.;
Hsieh, K.; Bonham, A. J.; Eisenstein, M.; Kippin, T. E.; Plaxco, K. W.; Soh, H. T. Sci. Transl.
Med. 2013, 5, 213ra165.
(19) Wu, C.; Chen, T.; Han, D.; You, M.; Peng, L.; Cansiz, S.; Zhu, G.; Li, C.; Xiong, X.;
Jimenez, E.; Yang, C. J.; Tan, W. ACS Nano 2013, 7, 5724-5731.
(20) Cho, M.; Soo Oh, S.; Nie, J.; Stewart, R.; Eisenstein, M.; Chambers, J.; Marth, J. D.;
Walker, F.; Thomson, J. A.; Soh, H. T. Proc. Natl. Acad. Sci. U.S.A. 2013, 110, 18460-18465.
(21) Wang, J. P.; Gong, Q.; Maheshwari, N.; Eisenstein, M.; Arcila, M. L.; Kosik, K. S.; Soh,
H. T. Angew. Chem. Int. Ed. 2014, 53, 4796-4801.
(22) Zhou, W.; Huang, P. J.; Ding, J.; Liu, J. Analyst 2014, 139, 2627-2640.
(23) Wang, R.; Zhu, G.; Mei, L.; Xie, Y.; Ma, H.; Ye, M.; Qing, F. L.; Tan, W. J. Am. Chem.
Soc. 2014, 136, 2731-4.
(24) Zhu, G.; Zheng, J.; Song, E.; Donovan, M.; Zhang, K.; Liu, C.; Tan, W. Proc. Natl. Acad.
Sci. U.S.A. 2013, 110, 7998-8003.
(25) Tong, P.; Zhang, L.; Xu, J. J.; Chen, H. Y. Biosens. Bioelectron. 2011, 29, 97-101.
(26) Stojanovic, M. N.; de Prada, P.; Landry, D. W. J. Am. Chem. Soc. 2001, 123, 4928-4931.
(27) Lu, C.-H.; Wang, F.; Willner, I. Chem. Sci. 2012, 3, 2616-2622.
(28) Rosi, N. L.; Mirkin, C. A. Chem. Rev. 2005, 105, 1547-1562.
(29) Soh, J. H.; Gao, Z., Metal Nanoparticles in Biomedical Applications. In Complex-Shaped
Metal Nanoparticles, Wiley-VCH Verlag GmbH & Co. KGaA: 2012; pp 477-519.
25
(30) Elghanian, R.; Storhoff, J. J.; Mucic, R. C.; Letsinger, R. L.; Mirkin, C. A. Science 1997,
277, 1078-1081.
(31) Roy, S.; Soh, J. H.; Gao, Z. Q. Lab Chip 2011, 11, 1886-1894.
(32) Laromaine, A.; Koh, L. L.; Murugesan, M.; Ulijn, R. V.; Stevens, M. M. J. Am. Chem.
Soc. 2007, 129, 4156-4157.
(33) Aili, D.; Enander, K.; Rydberg, J.; Nesterenko, I.; Bjorefors, F.; Baltzer, L.; Liedberg, B.
J. Am. Chem. Soc. 2008, 130, 5780-5788.
(34) Chen, S.-J.; Huang, Y.-F.; Huang, C.-C.; Lee, K.-H.; Lin, Z.-H.; Chang, H.-T. Biosens.
Bioelectron. 2008, 23, 1749-1753.
(35) Xia, F.; Zuo, X.; Yang, R.; Xiao, Y.; Kang, D.; Vallee-Belisle, A.; Gong, X.; Yuen, J. D.;
Hsu, B. B.; Heeger, A. J.; Plaxco, K. W. Proc. Natl. Acad. Sci. U.S.A. 2010, 107, 10837-10841.
(36) Williams, R. H.; Maggiore, J. A.; Shah, S. M.; Erickson, T. B.; Negrusz, A. J. Anal.
Toxicol. 2000, 24, 478-481.
(37) Boulware, M. I.; Mermelstein, P. G. Drug News Perspect. 2005, 18, 631-637.
(38) Cruz-Aguado, J. A.; Penner, G. J. Agric. Food Chem. 2008, 56, 10456-61.
(39) Wang, Z. D.; Zhang, J. Q.; Ekman, J. M.; Kenis, P. J. A.; Lu, Y. Nano Lett. 2010, 10,
1886-1891.
(40) Barthelmebs, L.; Jonca, J.; Hayat, A.; Prieto-Simon, B.; Marty, J. L. Food Control 2011,
22, 737-743.
(41) Kuang, H.; Chen, W.; Xu, D. H.; Xu, L. G.; Zhu, Y. Y.; Liu, L. Q.; Chu, H. Q.; Peng, C.
F.; Xu, C. L.; Zhu, S. F. Biosens. Bioelectron. 2010, 26, 710-716.
(42) Bonel, L.; Vidal, J. C.; Duato, P.; Castillo, J. R. Biosens. Bioelectron. 2011, 26, 3254-
3259.
26
(43) Barthelmebs, L.; Hayat, A.; Limiadi, A. W.; Marty, J. L.; Noguer, T. Sens. Actuators B
Chem. 2011, 156, 932-937.
(44) Yang, C.; Wang, Y.; Marty, J. L.; Yang, X. R. Biosens. Bioelectron. 2011, 26, 2724-
2727.
(45) Lee, J.; Jeon, C. H.; Ahn, S. J.; Ha, T. H. Analyst 2014, 139, 1622-1627.
(46) Gupta, R. C., Chapter 91 - Ochratoxins and citrinin. In Veterinary Toxicology (Second
Edition), Gupta, R. C., Ed. Academic Press: Boston, 2012; pp 1220-1226.
(47) Visconti, A.; Bottalico, A. J. Agric. Food Chem. 1983, 31, 1122-1123.
(48) Scheuer, R.; Gareis, M. Mycotox. Res. 2002, 18, 62-66.
(49) Tabata, S.; Iida, K.; Kimura, K.; Iwasaki, Y.; Nakazato, M.; Kamata, K.; Hirokado, M.
Food Hyg. Safe. Sci. 2008, 49, 111-115.
(50) Visconti, A.; Pascale, M.; Centonze, G. J. Chromatogr. A 1999, 864, 89-101.
(51) Prieto-Simon, B.; Campas, M.; Marty, J. L.; Noguer, T. Biosens. Bioelectron. 2008, 23,
995-1002.
(52) Fernandez, P.; Lafuente, N.; Bermejo, A. M.; Lopez-Rivadulla, M.; Cruz, A. J. Anal.
Toxicol. 1996, 20, 224-228.
(53) Phillips, D. L.; Tebbett, I. R.; Bertholf, R. L. J. Anal. Toxicol. 1996, 20, 305-308.
(54) Verstraete, A. G. Ther. Drug Monit. 2004, 26, 200-205.
(55) Kim, Y. S.; Jung, H. S.; Matsuura, T.; Lee, H. Y.; Kawai, T.; Gu, M. B. Biosens.
Bioelectron. 2007, 22, 2525-2531.
(56) Lewis, J. G. Clin. Biochem. Rev. 2006, 27, 139-146.
(57) Colditz, G. A. J. Natl. Cancer. I. 1998, 90, 814-823.
27
(58) Yeh, C. K.; Christodoulides, N. J.; Floriano, P. N.; Miller, C. S.; Ebersole, J. L.; Weigum,
S. E.; McDevitt, J.; Redding, S. W. Tex. Dent. J. 2010, 127, 651-661.
(59) Peters, J. R.; Walker, R. F.; Riad-Fahmy, D.; Hall, R. Clin. Endocrinol. 1982, 17, 583–
592.
(60) Wang, D. Y.; Fantl, V. E.; Habibollahi, F.; Clark, G. M.; Fentiman, I. S.; Hayward, J. L.;
Bulbrook, R. D. Eur. J. Cancer Clin. Oncol. 1986, 22, 427-433.
(61) Crosley, L. K.; Duthie, S. J.; Polley, A. C.; Bouwman, F. G.; Heim, C.; Mulholland, F.;
Horgan, G.; Johnson, I. T.; Mariman, E. C.; Elliott, R. M.; Daniel, H.; de Roos, B. Genes Nutr.
2009, 4, 95-102.
(62) Choe, J. K.; Khandawood, F. S.; Dawood, M. Y. Am. J. Obstet. Gynecol. 1983, 147, 557–
562.
(63) Tamate, K.; Charleton, M.; Gosling, J. P.; Egan, D.; Ishikawa, M.; Fottrell, P. F.; Kane,
M. M. Clin. Chem. 1997, 43, 1159-1164.
(64) Lu, Y. C.; Bentley, G. R.; Gann, P. H.; Hodges, K. R.; Chatterton, R. T. Fertil. Steril.
1999, 71, 863-868.
(65) Gatti, R.; Antonelli, G.; Prearo, M.; Spinella, P.; Cappellin, E.; De Palo, E. F. Clin.
Biochem. 2009, 42, 1205-1217.
(66) Papanicolaou, D. A.; Mullen, N.; Kyrou, I.; Nieman, L. K. J. Clin. Endocr. Metab. 2002,
87, 4515-4521.
(67) Groschl, M. Clin. Chem. 2008, 54, 1759-1769.
28
For TOC Only
29