Embed Size (px)
Citation preview
Climate Security and Sustainable Development
MONITORING REPORT
PUBLICATION DATE 14.10.2020
VERSION v. 1.1
RELATED SUPPORT - TEMPLATE GUIDE Monitoring Report v. 1.1
This document contains the following Sections
Key Project Information
SECTION A - Description of project
SECTION B - Implementation of project
SECTION C - Description of monitoring system applied by the project
SECTION D - Data and parameters
SECTION E - Calculation of SDG Impacts
SECTION F - Safeguards Reporting
SECTION G - Stakeholder inputs and legal disputes
TEMPLATE- Monitoring Report
2
KEY PROJECT INFORMATION
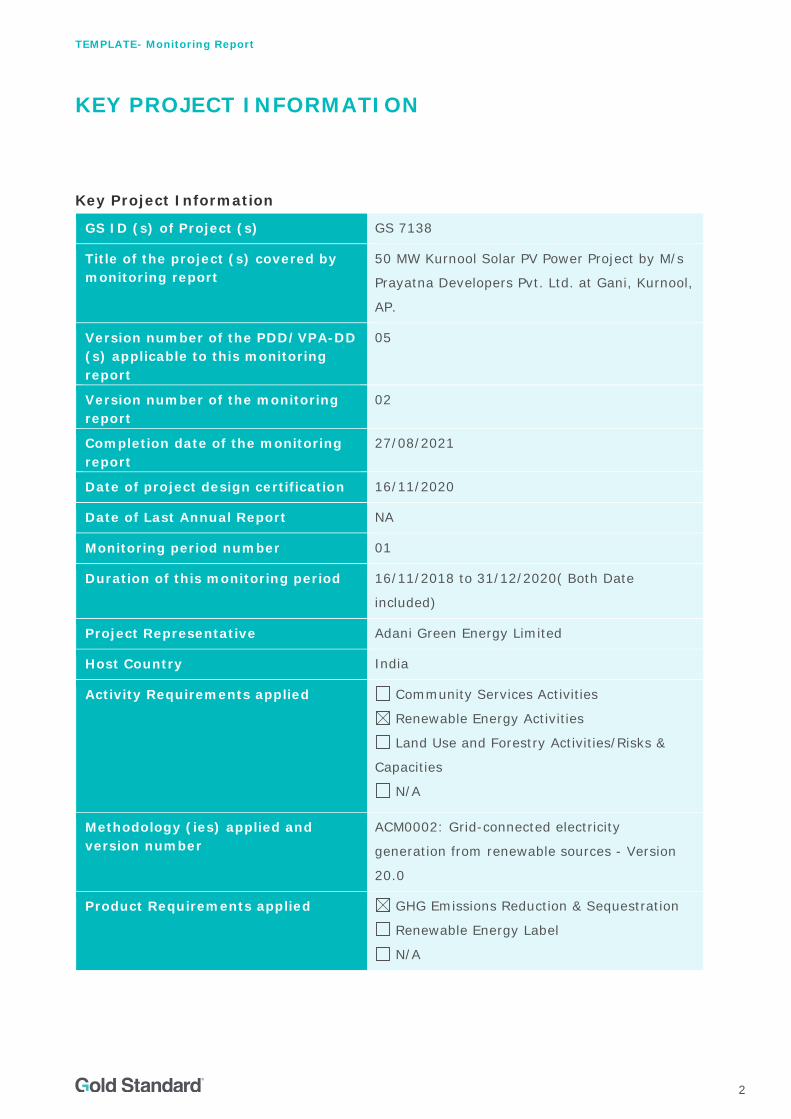
Key Project Information
GS ID (s) of Project (s) GS 7138
Title of the project (s) covered by monitoring report
50 MW Kurnool Solar PV Power Project by M/s
Prayatna Developers Pvt. Ltd. at Gani, Kurnool,
AP.
Version number of the PDD/VPA-DD (s) applicable to this monitoring report
05
Version number of the monitoring report
02
Completion date of the monitoring report
27/08/2021
Date of project design certification 16/11/2020
Date of Last Annual Report NA
Monitoring period number 01
Duration of this monitoring period 16/11/2018 to 31/12/2020( Both Date
included)
Project Representative Adani Green Energy Limited
Host Country India
Activity Requirements applied
Community Services Activities
Renewable Energy Activities
Land Use and Forestry Activities/Risks &
Capacities
N/A
Methodology (ies) applied and version number
ACM0002: Grid-connected electricity
generation from renewable sources - Version
20.0
Product Requirements applied GHG Emissions Reduction & Sequestration
Renewable Energy Label
N/A
TEMPLATE- Monitoring Report
3
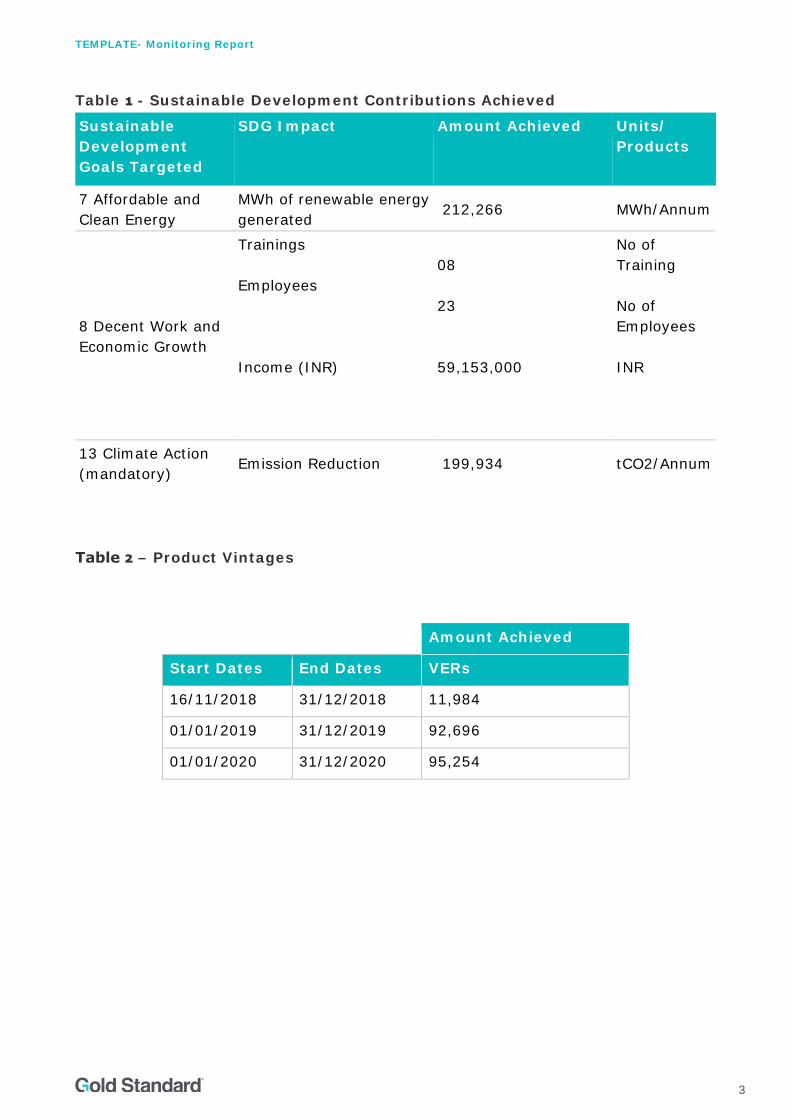
Table 1 - Sustainable Development Contributions Achieved
Sustainable Development Goals Targeted
SDG Impact Amount Achieved Units/ Products
7 Affordable and Clean Energy
MWh of renewable energy generated
212,266 MWh/Annum
8 Decent Work and Economic Growth
Trainings Employees 59,153,000 INIncome (INRI Income (INR) Income (INR)o Income (INR)me (INR))
08 23 5 R59,153,000 INR 59, 59,153,000,153,000 INR 153,000 INR9,153,000 INR
No of Training No of Employees INR Income (INR)
13 Climate Action (mandatory)
Emission Reduction 199,934 tCO2/Annum
Table 2 – Product Vintages
Amount Achieved
Start Dates End Dates VERs
16/11/2018 31/12/2018 11,984
01/01/2019 31/12/2019 92,696
01/01/2020 31/12/2020 95,254

TEMPLATE- Monitoring Report
4
SECTION A. DESCRIPTION OF PROJECT
A.1. General description of project The main purpose of the project activity is to generate electrical energy through
sustainable means using solar power resources, the generated green electricity will
contribute to climate change mitigation efforts. This project activity is a large scale solar
project. Prayatna Developers Pvt. Ltd. is the project investor for this project activity.
The project will replace anthropogenic emissions of greenhouse gases (GHG’s)
estimated to be approximately 89,549 tCO2e per annum, thereon displacing 95,073
MWh/year amount of electricity from the generation-mix of power plants connected to
the Indian electricity grid, which is mainly dominated by thermal/ fossil fuel based power
plant.
The project activity involves installation of 05 projects of 10 MWAC each, totalling to 50
MWAC solar power project under Jawaharlal Nehru National Solar Mission (JNNSM)
Phase-II, Batch-II, Tranche – I, State Specific Bundling Scheme (under DCR1
Category). The projects are installed in the same project boundary at Village: Gani-
Sakunala, Disrtict: Kurnool, State: Andhra Pradesh.
The electricity generated from project activity will be sold under the Power Purchase
Agreement (PPA), signed with NTPC Ltd. NTPC has been identified by the Government
of India (GoI) as the Implementation Agency for setting up of Grid-connected Solar PV
Power Projects under State Specific Bundling Scheme under the National Solar Mission
of Government of India (GoI) and NTPC Vidyut Vyapar Nigam Limited (NVVN) on behalf
of NTPC will purchase Solar Power from Solar Power Developer, and sell it to Discoms.
The electricity generated from the project activity will be evacuated through 220 kV
Gani sub-station located at Gani-Sakunala Village in Kurnool District for consumption in
the Indian Electricity Grid.
The project is registered under GS4GG on 16/11/2020 and as per section 10.2.1 of the
Guideline GHG EMISSIONS REDUCTION & SEQUESTRATION PRODUCT REQUIREMENTS
“The start date of Crediting Period is the date of start of operation (start of planting for
A/R Projects) or a maximum of two years (three years for A/R & AGR) prior to the date
of Project Design Certification, whichever occurs later”; Therefore, the monitoring
period of the project activity is 16/11/2018 to 31/12/2020 i.e., of two prior to the date
of Project Design Certification. Therefore, for the month of November,18 the generation
value has been apportioned for 16 days.
TEMPLATE- Monitoring Report
5
The project activity is the installation of a new grid-connected renewable power
plant/unit and this is not a CPA that has been excluded from a registered CDM PoA as
a result of erroneous inclusion of CPAs. The land for the project activity is leased and a
deed is signed between Andhra Pradesh Solar Power Corporation Pvt. Ltd. and Prayatna
Developers Pvt. Ltd., dated 20/06/2016, for a period of 25 years.
The project is owned by Indian conglomerate Adani Group. Now, ‘Total Energies’ have
the acquisition of a 20% interest in Adani Green Energy Limited (AGEL). Therefore, the
Focal point for transactions will be Adani Green Energy Limited (AGEL). Hence, the
previous name of Project Participant Prayatna Developers Pvt. Ltd.has been changed to
Adani Green Energy Limited in monitoring report.
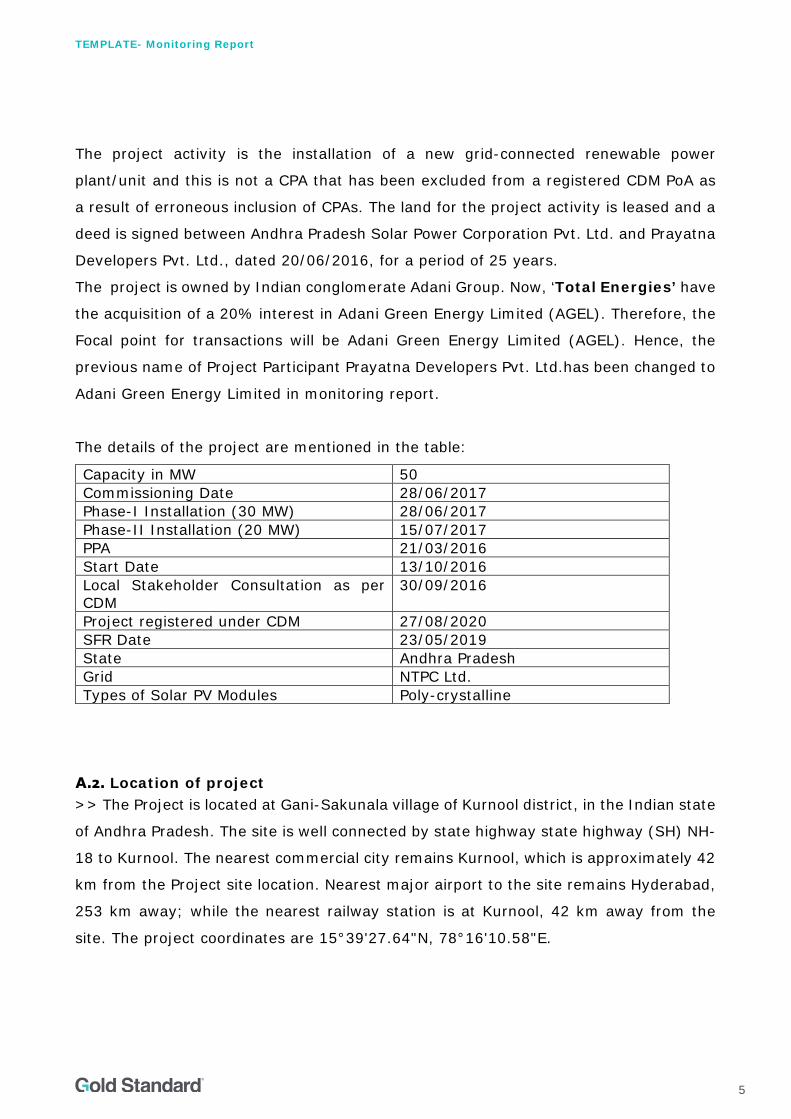
The details of the project are mentioned in the table:
Capacity in MW 50 Commissioning Date 28/06/2017 Phase-I Installation (30 MW) 28/06/2017 Phase-II Installation (20 MW) 15/07/2017 PPA 21/03/2016 Start Date 13/10/2016 Local Stakeholder Consultation as per CDM
30/09/2016
Project registered under CDM 27/08/2020 SFR Date 23/05/2019 State Andhra Pradesh Grid NTPC Ltd. Types of Solar PV Modules Poly-crystalline
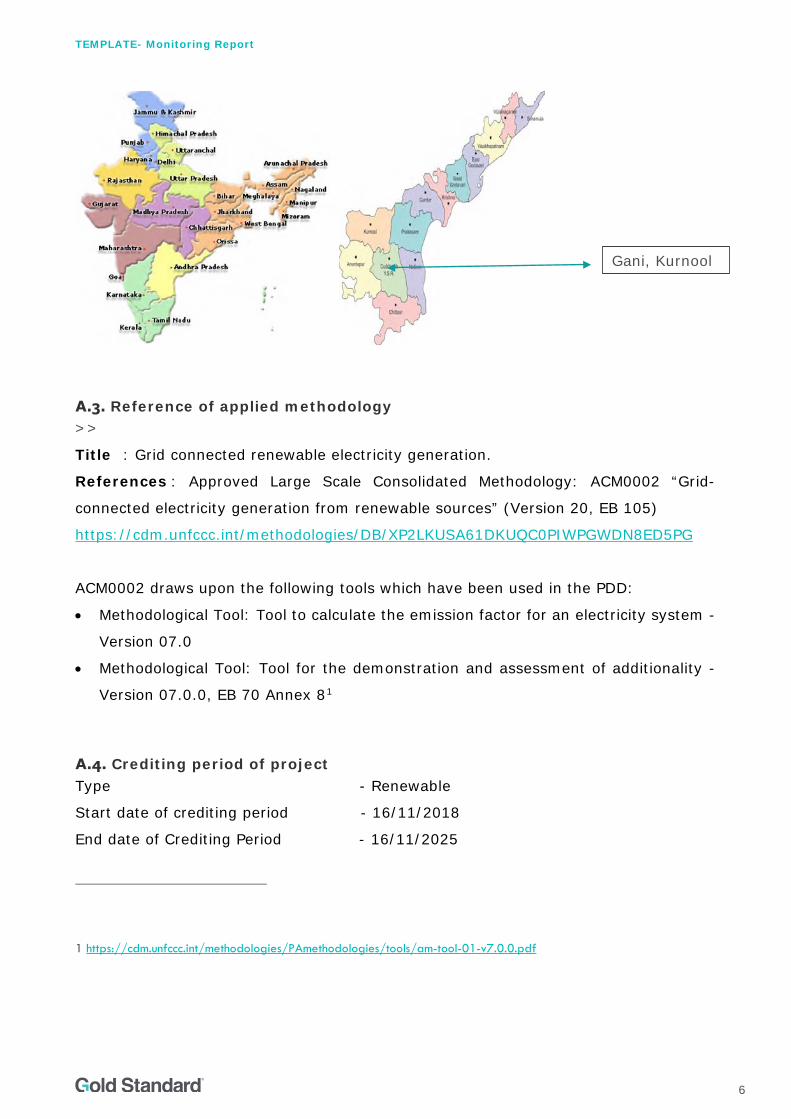
A.2. Location of project >> The Project is located at Gani-Sakunala village of Kurnool district, in the Indian state
of Andhra Pradesh. The site is well connected by state highway state highway (SH) NH-
18 to Kurnool. The nearest commercial city remains Kurnool, which is approximately 42
km from the Project site location. Nearest major airport to the site remains Hyderabad,
253 km away; while the nearest railway station is at Kurnool, 42 km away from the
site. The project coordinates are 15°39'27.64"N, 78°16'10.58"E.
TEMPLATE- Monitoring Report
6
A.3. Reference of applied methodology >>
Title : Grid connected renewable electricity generation.
References : Approved Large Scale Consolidated Methodology: ACM0002 “Grid-
connected electricity generation from renewable sources” (Version 20, EB 105)
https://cdm.unfccc.int/methodologies/DB/XP2LKUSA61DKUQC0PIWPGWDN8ED5PG
ACM0002 draws upon the following tools which have been used in the PDD:
• Methodological Tool: Tool to calculate the emission factor for an electricity system -
Version 07.0
• Methodological Tool: Tool for the demonstration and assessment of additionality -
Version 07.0.0, EB 70 Annex 81
A.4. Crediting period of project Type - Renewable
Start date of crediting period - 16/11/2018
End date of Crediting Period - 16/11/2025
1 https://cdm.unfccc.int/methodologies/PAmethodologies/tools/am-tool-01-v7.0.0.pdf
Gani, Kurnool
TEMPLATE- Monitoring Report
7
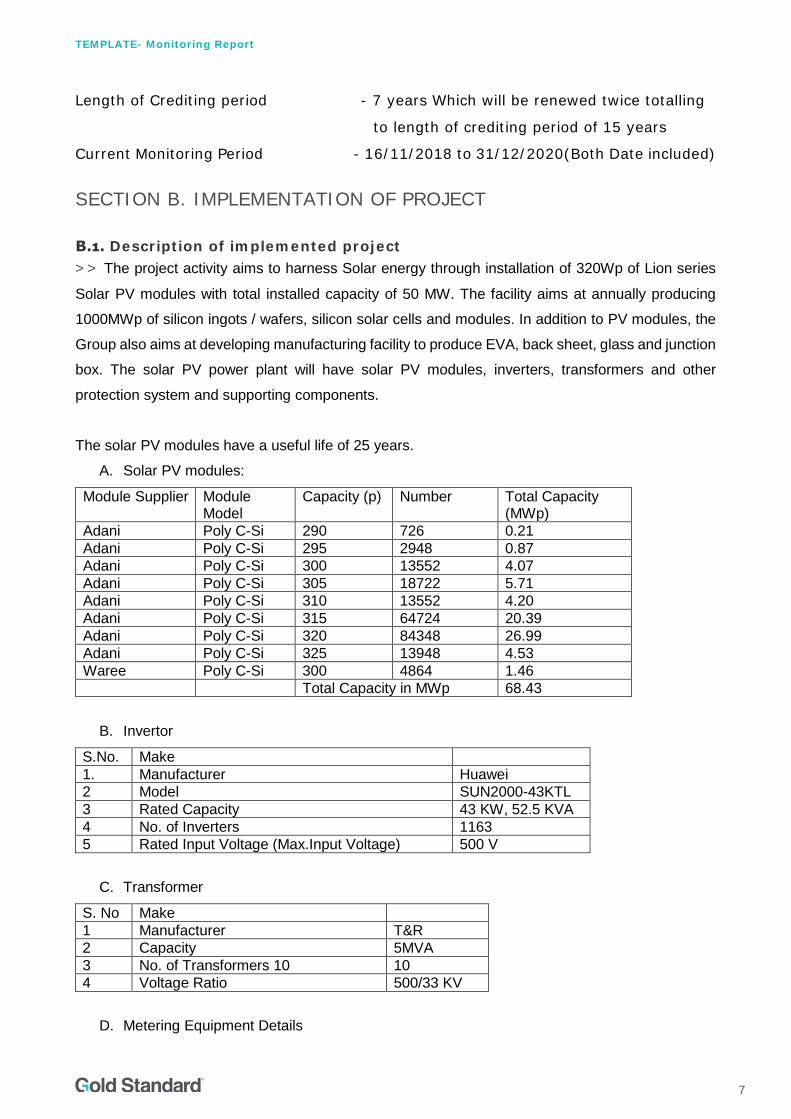
Length of Crediting period - 7 years Which will be renewed twice totalling
to length of crediting period of 15 years
Current Monitoring Period - 16/11/2018 to 31/12/2020(Both Date included)
SECTION B. IMPLEMENTATION OF PROJECT
B.1. Description of implemented project >> The project activity aims to harness Solar energy through installation of 320Wp of Lion series
Solar PV modules with total installed capacity of 50 MW. The facility aims at annually producing
1000MWp of silicon ingots / wafers, silicon solar cells and modules. In addition to PV modules, the
Group also aims at developing manufacturing facility to produce EVA, back sheet, glass and junction
box. The solar PV power plant will have solar PV modules, inverters, transformers and other
protection system and supporting components.
The solar PV modules have a useful life of 25 years.
A. Solar PV modules:
Module Supplier Module Model
Capacity (p)
Number Total Capacity (MWp)
Adani Poly C-Si 290 726 0.21 Adani Poly C-Si 295 2948 0.87 Adani Poly C-Si 300 13552 4.07 Adani Poly C-Si 305 18722 5.71 Adani Poly C-Si 310 13552 4.20 Adani Poly C-Si 315 64724 20.39 Adani Poly C-Si 320 84348 26.99 Adani Poly C-Si 325 13948 4.53 Waree Poly C-Si 300 4864 1.46 Total Capacity in MWp 68.43
B. Invertor
S.No. Make 1. Manufacturer Huawei 2 Model SUN2000-43KTL 3 Rated Capacity 43 KW, 52.5 KVA 4 No. of Inverters 1163 5 Rated Input Voltage (Max.Input Voltage) 500 V
C. Transformer
S. No Make 1 Manufacturer T&R 2 Capacity 5MVA 3 No. of Transformers 10 10 4 Voltage Ratio 500/33 KV
D. Metering Equipment Details

TEMPLATE- Monitoring Report
8
S.No. Make Sub-Station Solar Plant End 1 Manufacturer Secure Make Secure Make 2 Type ABT meters ABT meters 3 Accuracy Level 0.2s 0.2s 4 Total no of meter 3*2=6 2*2 = 4
B.1.1 Forward Action Requests
>> No FAR raised
B.2. Post-Design Certification changes >>
B.2.1. Temporary deviations from the approved Monitoring & Reporting Plan,
methodology or standardized baseline
>> Not Applicable
B.2.2. Corrections
>> Not Applicable
B.2.3. Changes to start date of crediting period
>> Not Applicable
B.2.4. Permanent changes from the Design Certified monitoring plan, applied
methodology or applied standardized baseline
>> Not Applicable
B.2.5. Changes to project design of approved project
>> Not Applicable
SECTION C. DESCRIPTION OF MONITORING SYSTEM APPLIED BY
THE PROJECT
>> The monitoring plan is developed in accordance with the modalities and procedures
for project activities and is proposed for grid-connected solar power project/ unit being
implemented in Andhra Pradesh, India. The monitoring plan, which will be implemented
by the project participant describes about the monitoring organisation, parameters to
TEMPLATE- Monitoring Report
9
be monitored, monitoring practices, quality assurance, quality control procedures, data
storage and archiving.
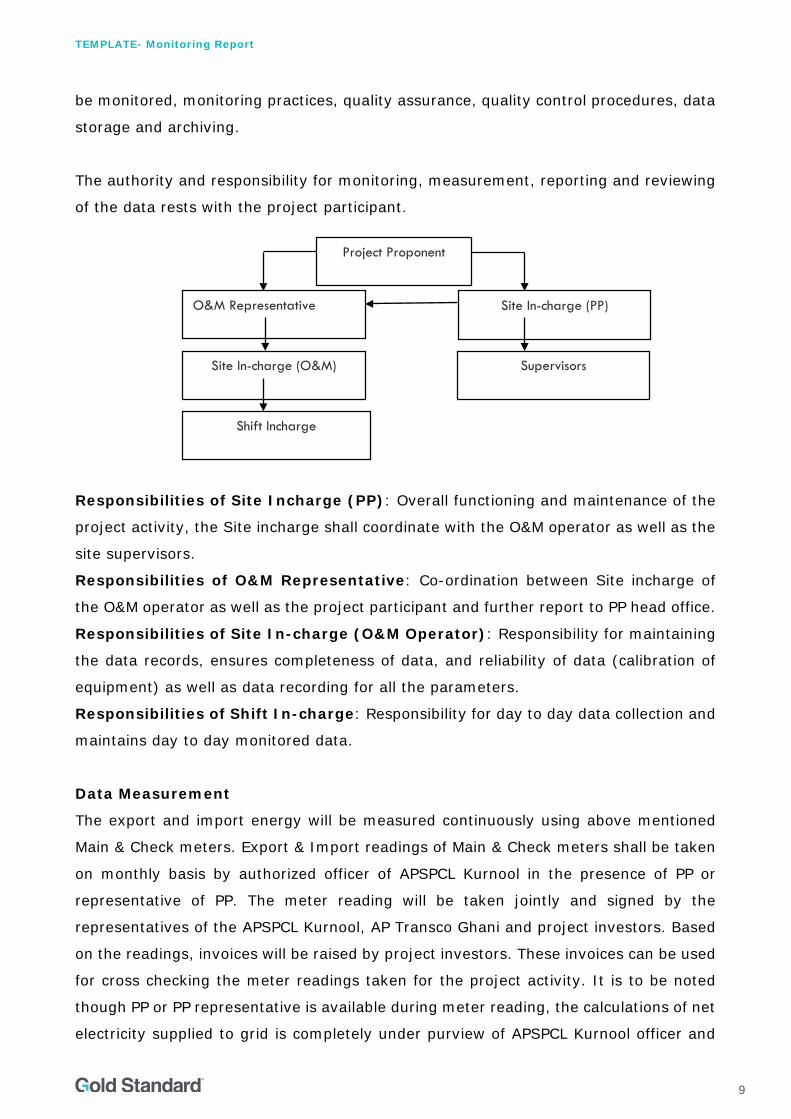
The authority and responsibility for monitoring, measurement, reporting and reviewing
of the data rests with the project participant.
Responsibilities of Site Incharge (PP): Overall functioning and maintenance of the
project activity, the Site incharge shall coordinate with the O&M operator as well as the
site supervisors.
Responsibilities of O&M Representative: Co-ordination between Site incharge of
the O&M operator as well as the project participant and further report to PP head office.
Responsibilities of Site In-charge (O&M Operator): Responsibility for maintaining
the data records, ensures completeness of data, and reliability of data (calibration of
equipment) as well as data recording for all the parameters.
Responsibilities of Shift In-charge: Responsibility for day to day data collection and
maintains day to day monitored data.
Data Measurement
The export and import energy will be measured continuously using above mentioned
Main & Check meters. Export & Import readings of Main & Check meters shall be taken
on monthly basis by authorized officer of APSPCL Kurnool in the presence of PP or
representative of PP. The meter reading will be taken jointly and signed by the
representatives of the APSPCL Kurnool, AP Transco Ghani and project investors. Based
on the readings, invoices will be raised by project investors. These invoices can be used
for cross checking the meter readings taken for the project activity. It is to be noted
though PP or PP representative is available during meter reading, the calculations of net
electricity supplied to grid is completely under purview of APSPCL Kurnool officer and
Project Proponent
O&M Representative Site In-charge (PP)
Site In-charge (O&M)
Shift Incharge
Supervisors

TEMPLATE- Monitoring Report
10
PP do not have any control on it. Also accuracy class of meters and calibration frequency
is under purview of APSPCL Kurnool officer and PP do not have any control on it. PP got
the monthly credit report from where net electricity supplied to grid is obtained and
used for emission reduction calculations.
Data collection and archiving
Export & Import readings from the meters will be collected under the supervision of the
authorized representatives of PP. The net electricity supplied to grid would be calculated
based on export & import readings. Export and Import data would be recorded and
stored in electronic &/or Paper format. The records are checked periodically by the Head
(Operations) and discussed thoroughly with the O&M Team. The period of storage of
the monitored data will be 2 years after the end of crediting period or till the last
issuance of GS CERs for the project activity whichever occurs later.
Mismatch in Monitoring Period and the Billing Period
In case the dates of a particular monitoring period do not match with the dates of the
billing period, the net electricity exported to the grid would be calculated from:
D = (A/B)*C
Where,
A = Difference of number of days which are not matching of billing period and
monitoring period.
B = Number of days of the billing period/ month which was not matched with the
monitoring period.
C = Net Electricity supplied to the grid for that given billing period/ month.
The calculated value after apportioning would be used for calculation of emission
reductions during that period.
Emergency preparedness
The project activity will not result in any unidentified activity that can result in
substantial emissions from the project activity. No need for emergency preparedness in
data monitoring is visualized.
In the unlikely event of failure of all Main, Check as well as Standby meter installed at
Substation, where all the faulty meters are required to be repaired or replaced
simultaneously, the export & import readings from Main, Check & Standby Meters
TEMPLATE- Monitoring Report
11
installed at the inter-connection point at the project site will be used for monitoring of
net electricity exported to the grid.
Personnel training
In order to ensure a proper functioning of the project activity and a proper monitoring
of emission reductions, the staff (CDM team) are trained. The plant helpers are trained
in equipment operation, data recording, reports writing, operation and maintenance and
emergency procedures in compliance with the monitoring plan.
SECTION D. DATA AND PARAMETERS
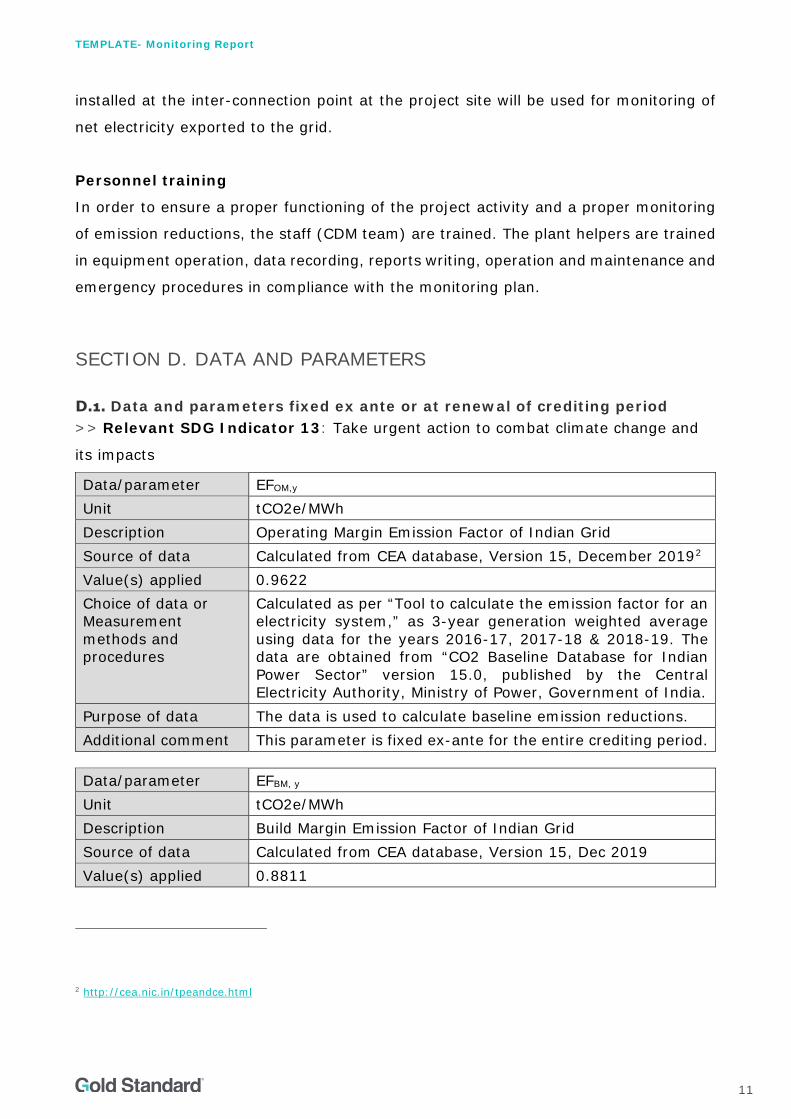
D.1. Data and parameters fixed ex ante or at renewal of crediting period >> Relevant SDG Indicator 13: Take urgent action to combat climate change and
its impacts
Data/parameter EFOM,y Unit tCO2e/MWh Description Operating Margin Emission Factor of Indian Grid Source of data Calculated from CEA database, Version 15, December 20192 Value(s) applied 0.9622 Choice of data or Measurement methods and procedures
Calculated as per “Tool to calculate the emission factor for an electricity system,” as 3-year generation weighted average using data for the years 2016-17, 2017-18 & 2018-19. The data are obtained from “CO2 Baseline Database for Indian Power Sector” version 15.0, published by the Central Electricity Authority, Ministry of Power, Government of India.
Purpose of data The data is used to calculate baseline emission reductions. Additional comment This parameter is fixed ex-ante for the entire crediting period.
Data/parameter EFBM, y Unit tCO2e/MWh Description Build Margin Emission Factor of Indian Grid Source of data Calculated from CEA database, Version 15, Dec 2019 Value(s) applied 0.8811
2 http://cea.nic.in/tpeandce.html
TEMPLATE- Monitoring Report
12
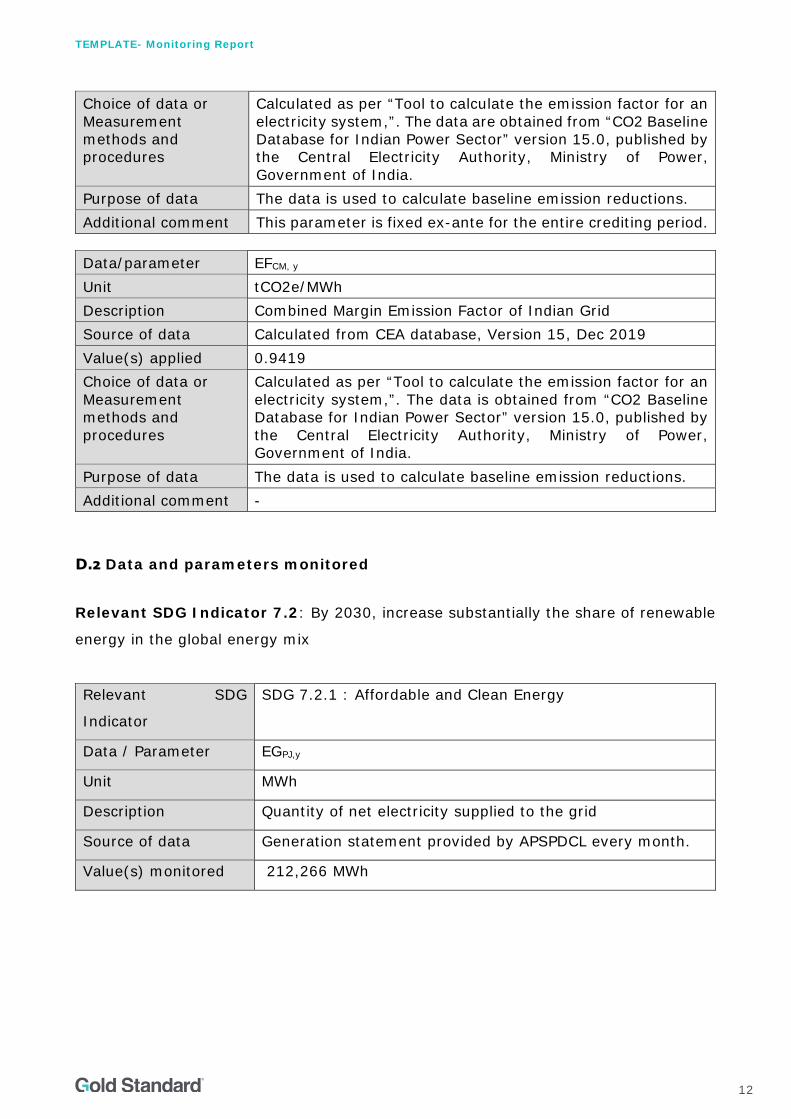
Choice of data or Measurement methods and procedures
Calculated as per “Tool to calculate the emission factor for an electricity system,”. The data are obtained from “CO2 Baseline Database for Indian Power Sector” version 15.0, published by the Central Electricity Authority, Ministry of Power, Government of India.
Purpose of data The data is used to calculate baseline emission reductions. Additional comment This parameter is fixed ex-ante for the entire crediting period.
Data/parameter EFCM, y Unit tCO2e/MWh Description Combined Margin Emission Factor of Indian Grid Source of data Calculated from CEA database, Version 15, Dec 2019 Value(s) applied 0.9419 Choice of data or Measurement methods and procedures
Calculated as per “Tool to calculate the emission factor for an electricity system,”. The data is obtained from “CO2 Baseline Database for Indian Power Sector” version 15.0, published by the Central Electricity Authority, Ministry of Power, Government of India.
Purpose of data The data is used to calculate baseline emission reductions. Additional comment -
D.2 Data and parameters monitored
Relevant SDG Indicator 7.2: By 2030, increase substantially the share of renewable
energy in the global energy mix
Relevant SDG
Indicator
SDG 7.2.1 : Affordable and Clean Energy
Data / Parameter EGPJ,y
Unit MWh
Description Quantity of net electricity supplied to the grid
Source of data Generation statement provided by APSPDCL every month.
Value(s) monitored 212,266 MWh
TEMPLATE- Monitoring Report
13
Measurement
methods and
procedures
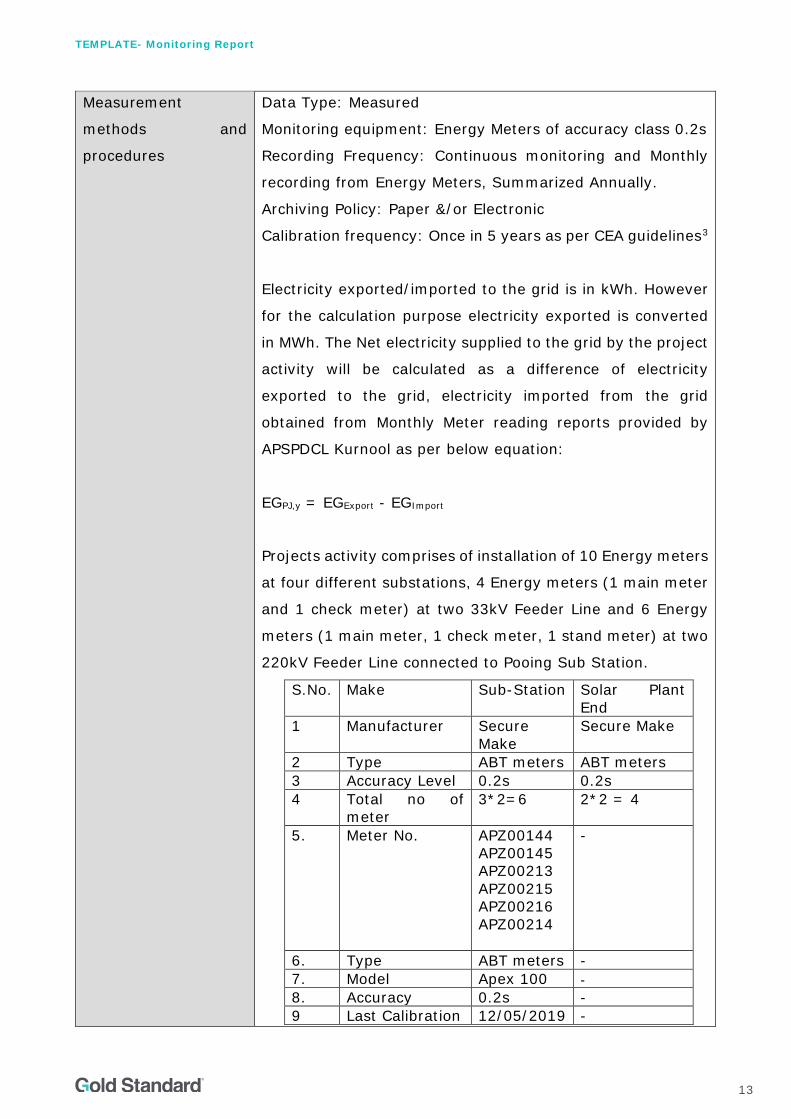
Data Type: Measured
Monitoring equipment: Energy Meters of accuracy class 0.2s
Recording Frequency: Continuous monitoring and Monthly
recording from Energy Meters, Summarized Annually.
Archiving Policy: Paper &/or Electronic
Calibration frequency: Once in 5 years as per CEA guidelines3
Electricity exported/imported to the grid is in kWh. However
for the calculation purpose electricity exported is converted
in MWh. The Net electricity supplied to the grid by the project
activity will be calculated as a difference of electricity
exported to the grid, electricity imported from the grid
obtained from Monthly Meter reading reports provided by
APSPDCL Kurnool as per below equation:
EGPJ,y = EGExport - EGImport
Projects activity comprises of installation of 10 Energy meters
at four different substations, 4 Energy meters (1 main meter
and 1 check meter) at two 33kV Feeder Line and 6 Energy
meters (1 main meter, 1 check meter, 1 stand meter) at two
220kV Feeder Line connected to Pooing Sub Station.
S.No. Make Sub-Station Solar Plant End
1 Manufacturer Secure Make
Secure Make
2 Type ABT meters ABT meters 3 Accuracy Level 0.2s 0.2s 4 Total no of
meter 3*2=6 2*2 = 4
5. Meter No. APZ00144 APZ00145 APZ00213 APZ00215 APZ00216 APZ00214
-
6. Type ABT meters - 7. Model Apex 100 - 8. Accuracy 0.2s - 9 Last Calibration 12/05/2019 -
TEMPLATE- Monitoring Report
14
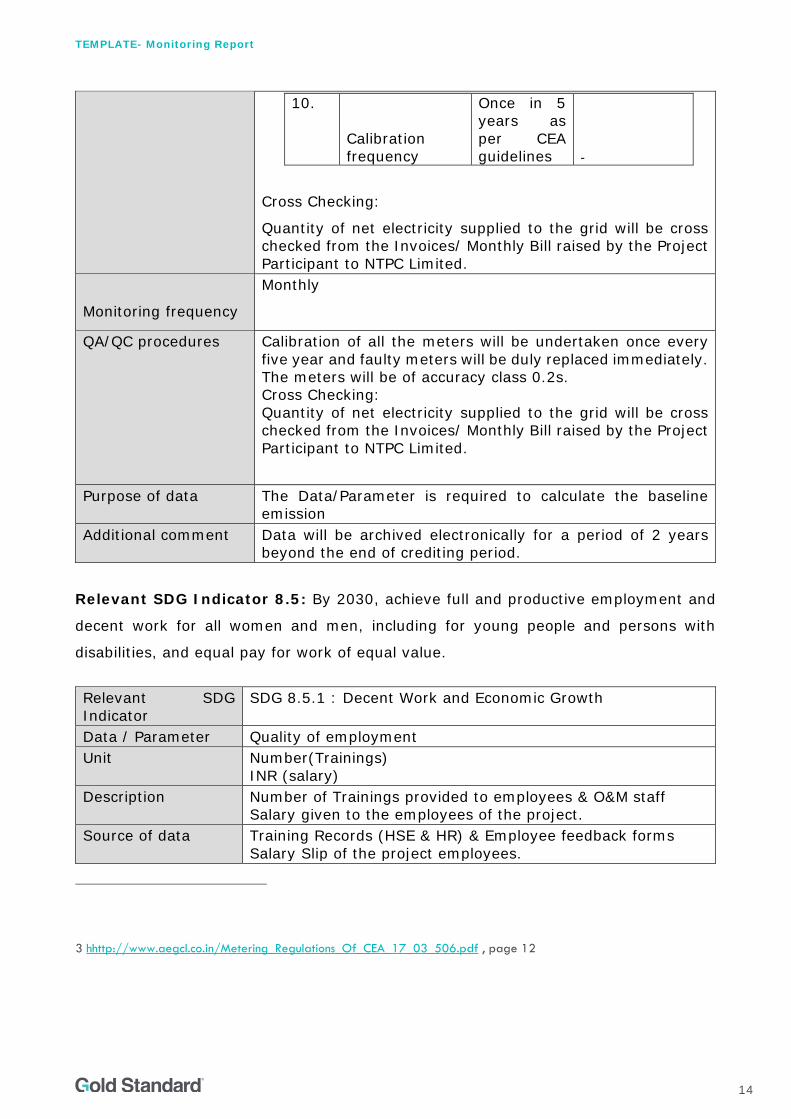
10.
Calibration frequency
Once in 5 years as per CEA guidelines -
Cross Checking:
Quantity of net electricity supplied to the grid will be cross checked from the Invoices/ Monthly Bill raised by the Project Participant to NTPC Limited.
Monitoring frequency
Monthly
QA/QC procedures Calibration of all the meters will be undertaken once every five year and faulty meters will be duly replaced immediately. The meters will be of accuracy class 0.2s. Cross Checking: Quantity of net electricity supplied to the grid will be cross checked from the Invoices/ Monthly Bill raised by the Project Participant to NTPC Limited.
Purpose of data The Data/Parameter is required to calculate the baseline emission
Additional comment Data will be archived electronically for a period of 2 years beyond the end of crediting period.
Relevant SDG Indicator 8.5: By 2030, achieve full and productive employment and
decent work for all women and men, including for young people and persons with
disabilities, and equal pay for work of equal value.
Relevant SDG Indicator
SDG 8.5.1 : Decent Work and Economic Growth
Data / Parameter Quality of employment Unit Number(Trainings)
INR (salary) Description Number of Trainings provided to employees & O&M staff
Salary given to the employees of the project. Source of data Training Records (HSE & HR) & Employee feedback forms
Salary Slip of the project employees.
3 hhttp://www.aegcl.co.in/Metering_Regulations_Of_CEA_17_03_506.pdf , page 12
TEMPLATE- Monitoring Report
15
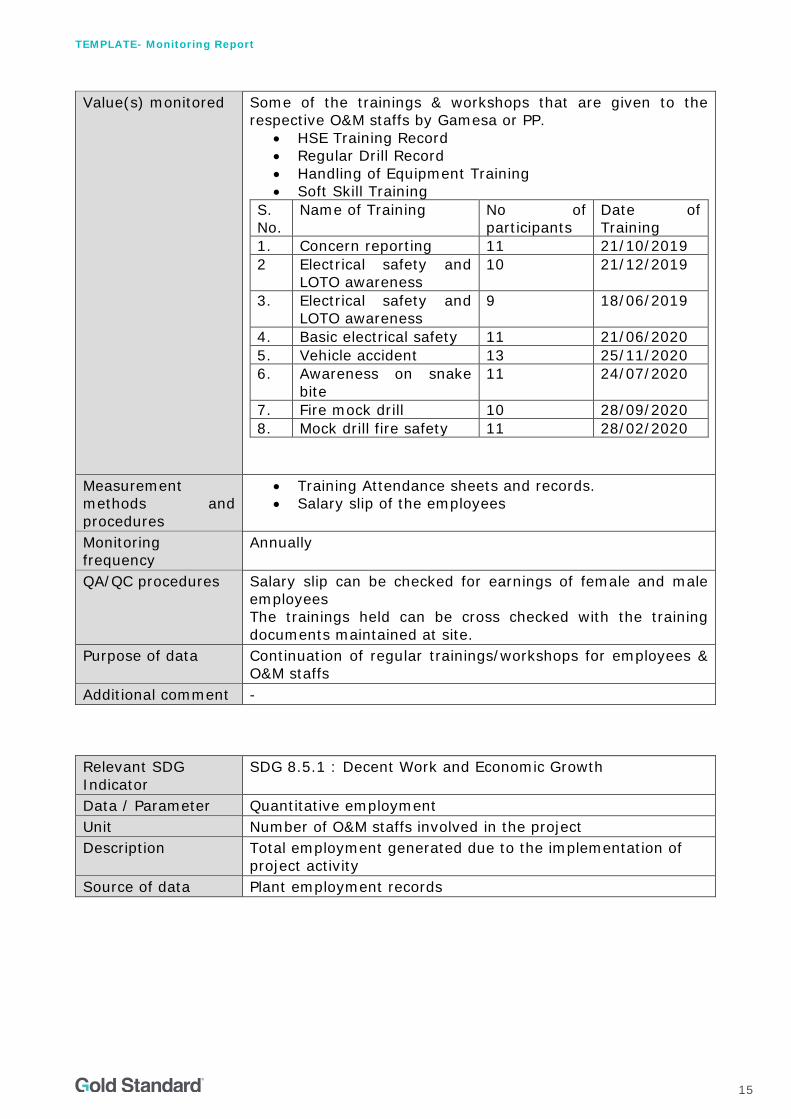
Value(s) monitored Some of the trainings & workshops that are given to the respective O&M staffs by Gamesa or PP.
• HSE Training Record • Regular Drill Record • Handling of Equipment Training • Soft Skill Training
S. No.
Name of Training No of participants
Date of Training
1. Concern reporting 11 21/10/2019 2 Electrical safety and
LOTO awareness 10 21/12/2019
3. Electrical safety and LOTO awareness
9 18/06/2019
4. Basic electrical safety 11 21/06/2020 5. Vehicle accident 13 25/11/2020 6. Awareness on snake
bite 11 24/07/2020
7. Fire mock drill 10 28/09/2020 8. Mock drill fire safety 11 28/02/2020
Measurement methods and procedures
• Training Attendance sheets and records. • Salary slip of the employees
Monitoring frequency
Annually
QA/QC procedures Salary slip can be checked for earnings of female and male employees The trainings held can be cross checked with the training documents maintained at site.
Purpose of data Continuation of regular trainings/workshops for employees & O&M staffs
Additional comment - Relevant SDG Indicator
SDG 8.5.1 : Decent Work and Economic Growth
Data / Parameter Quantitative employment Unit Number of O&M staffs involved in the project Description Total employment generated due to the implementation of
project activity Source of data Plant employment records
TEMPLATE- Monitoring Report
16
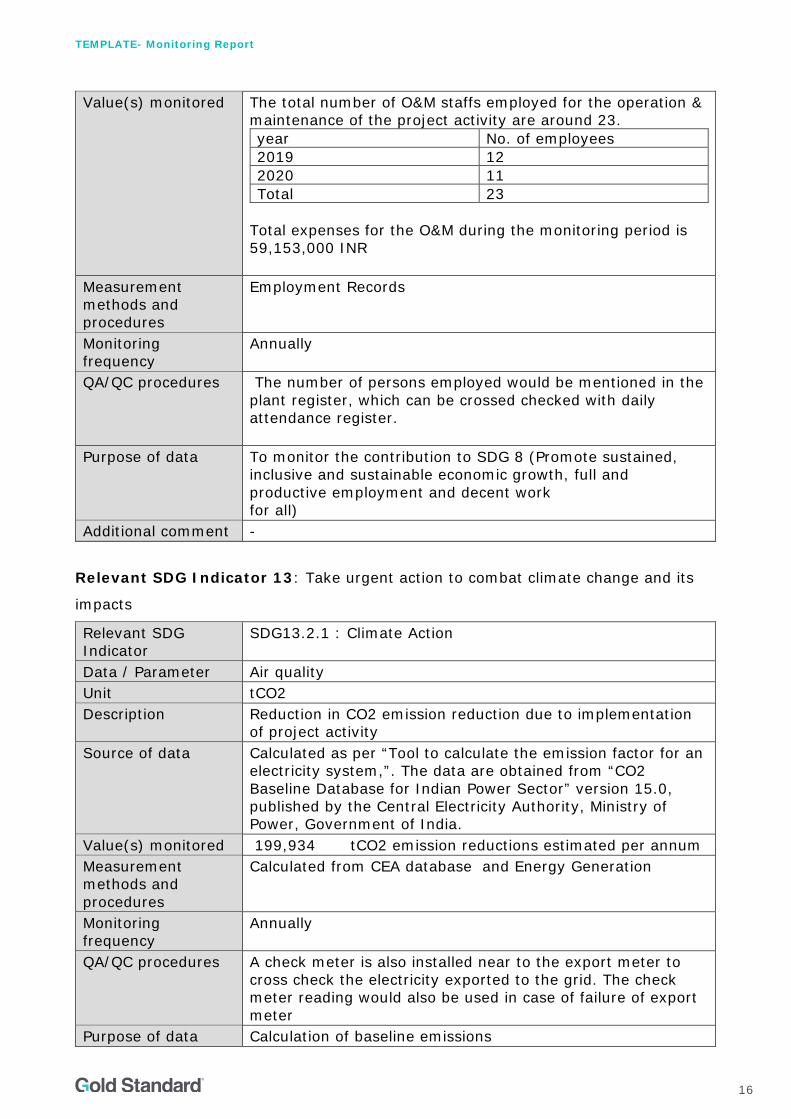
Value(s) monitored The total number of O&M staffs employed for the operation & maintenance of the project activity are around 23. year No. of employees 2019 12 2020 11 Total 23
Total expenses for the O&M during the monitoring period is 59,153,000 INR
Measurement methods and procedures
Employment Records
Monitoring frequency
Annually
QA/QC procedures The number of persons employed would be mentioned in the plant register, which can be crossed checked with daily attendance register.
Purpose of data To monitor the contribution to SDG 8 (Promote sustained, inclusive and sustainable economic growth, full and productive employment and decent work for all)
Additional comment -
Relevant SDG Indicator 13: Take urgent action to combat climate change and its
impacts
Relevant SDG Indicator
SDG13.2.1 : Climate Action
Data / Parameter Air quality Unit tCO2 Description Reduction in CO2 emission reduction due to implementation
of project activity Source of data Calculated as per “Tool to calculate the emission factor for an
electricity system,”. The data are obtained from “CO2 Baseline Database for Indian Power Sector” version 15.0, published by the Central Electricity Authority, Ministry of Power, Government of India.
Value(s) monitored 199,934 tCO2 emission reductions estimated per annum Measurement methods and procedures
Calculated from CEA database and Energy Generation
Monitoring frequency
Annually
QA/QC procedures A check meter is also installed near to the export meter to cross check the electricity exported to the grid. The check meter reading would also be used in case of failure of export meter
Purpose of data Calculation of baseline emissions
TEMPLATE- Monitoring Report
17
Additional comment -
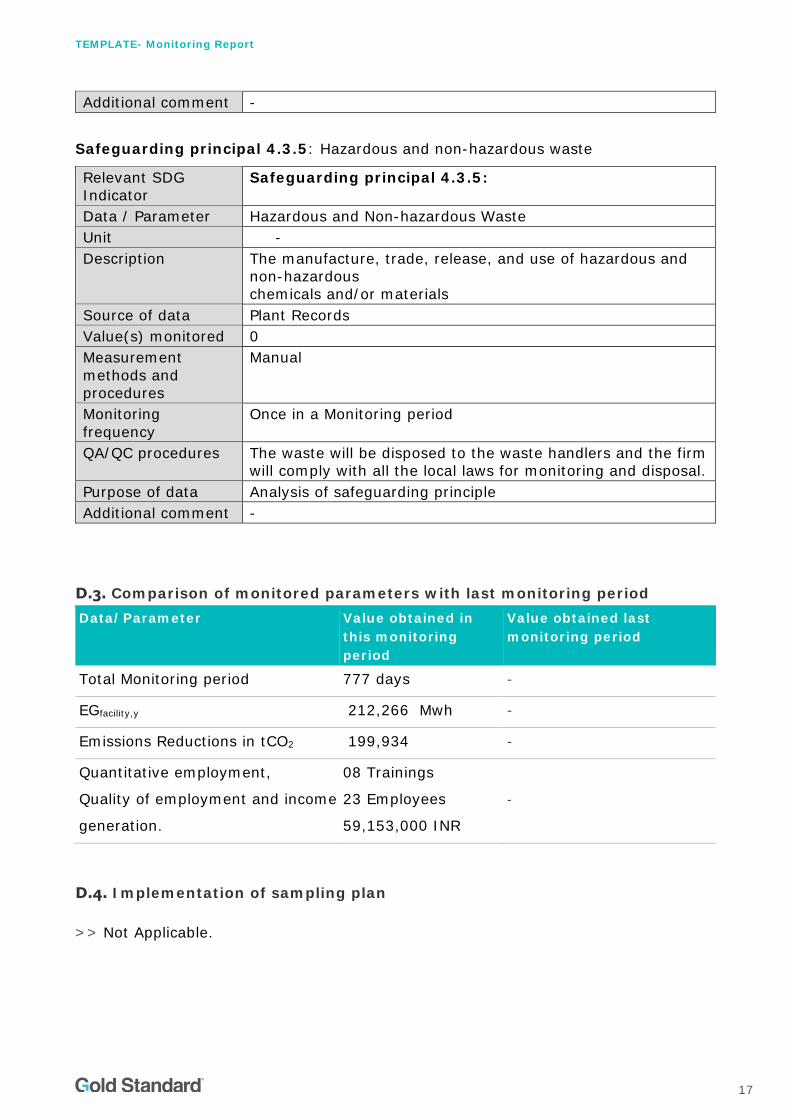
Safeguarding principal 4.3.5: Hazardous and non-hazardous waste
Relevant SDG Indicator
Safeguarding principal 4.3.5:
Data / Parameter Hazardous and Non-hazardous Waste Unit - Description The manufacture, trade, release, and use of hazardous and
non-hazardous chemicals and/or materials
Source of data Plant Records Value(s) monitored 0 Measurement methods and procedures
Manual
Monitoring frequency
Once in a Monitoring period
QA/QC procedures The waste will be disposed to the waste handlers and the firm will comply with all the local laws for monitoring and disposal.
Purpose of data Analysis of safeguarding principle Additional comment -
D.3. Comparison of monitored parameters with last monitoring period Data/Parameter Value obtained in
this monitoring period
Value obtained last monitoring period
Total Monitoring period 777 days -
EGfacility,y 212,266 Mwh -
Emissions Reductions in tCO2 199,934 -
Quantitative employment,
Quality of employment and income
generation.
08 Trainings
23 Employees
59,153,000 INR
-
D.4. Implementation of sampling plan >> Not Applicable.
TEMPLATE- Monitoring Report
18
SECTION E. CALCULATION OF SDG IMPACTS
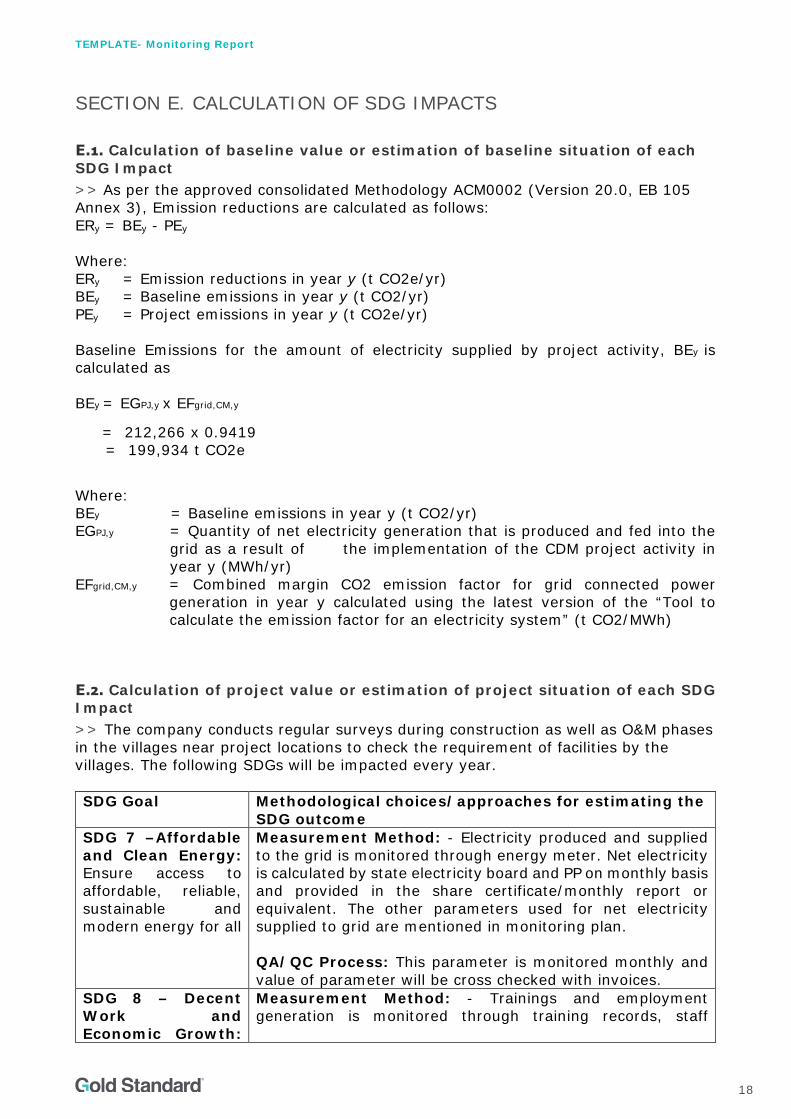
E.1. Calculation of baseline value or estimation of baseline situation of each SDG Impact >> As per the approved consolidated Methodology ACM0002 (Version 20.0, EB 105 Annex 3), Emission reductions are calculated as follows: ERy = BEy - PEy Where: ERy = Emission reductions in year y (t CO2e/yr) BEy = Baseline emissions in year y (t CO2/yr) PEy = Project emissions in year y (t CO2e/yr) Baseline Emissions for the amount of electricity supplied by project activity, BEy is calculated as BEy = EGPJ,y x EFgrid,CM,y
= 212,266 x 0.9419 = 199,934 t CO2e
Where: BEy = Baseline emissions in year y (t CO2/yr) EGPJ,y = Quantity of net electricity generation that is produced and fed into the
grid as a result of the implementation of the CDM project activity in year y (MWh/yr)
EFgrid,CM,y = Combined margin CO2 emission factor for grid connected power generation in year y calculated using the latest version of the “Tool to calculate the emission factor for an electricity system” (t CO2/MWh)
E.2. Calculation of project value or estimation of project situation of each SDG Impact >> The company conducts regular surveys during construction as well as O&M phases in the villages near project locations to check the requirement of facilities by the villages. The following SDGs will be impacted every year. SDG Goal Methodological choices/approaches for estimating the
SDG outcome SDG 7 –Affordable and Clean Energy: Ensure access to affordable, reliable, sustainable and modern energy for all
Measurement Method: - Electricity produced and supplied to the grid is monitored through energy meter. Net electricity is calculated by state electricity board and PP on monthly basis and provided in the share certificate/monthly report or equivalent. The other parameters used for net electricity supplied to grid are mentioned in monitoring plan. QA/QC Process: This parameter is monitored monthly and value of parameter will be cross checked with invoices.
SDG 8 – Decent Work and Economic Growth:
Measurement Method: - Trainings and employment generation is monitored through training records, staff
TEMPLATE- Monitoring Report
19
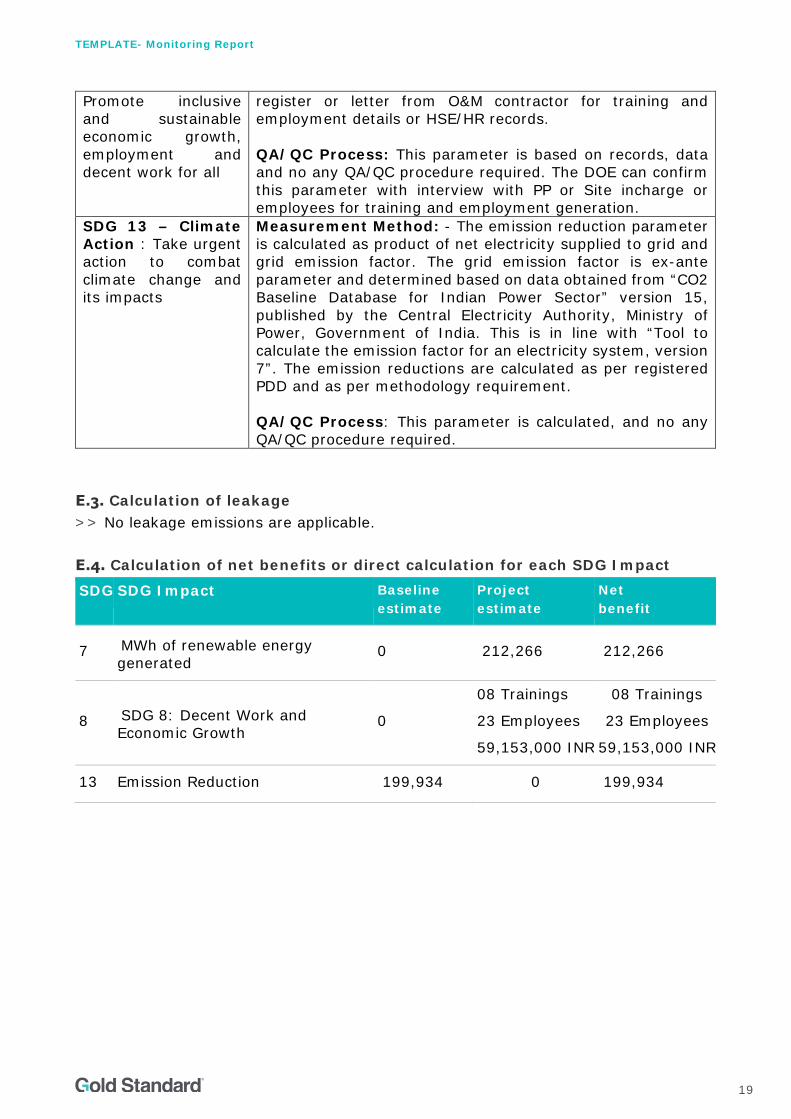
Promote inclusive and sustainable economic growth, employment and decent work for all
register or letter from O&M contractor for training and employment details or HSE/HR records. QA/QC Process: This parameter is based on records, data and no any QA/QC procedure required. The DOE can confirm this parameter with interview with PP or Site incharge or employees for training and employment generation.
SDG 13 – Climate Action : Take urgent action to combat climate change and its impacts
Measurement Method: - The emission reduction parameter is calculated as product of net electricity supplied to grid and grid emission factor. The grid emission factor is ex-ante parameter and determined based on data obtained from “CO2 Baseline Database for Indian Power Sector” version 15, published by the Central Electricity Authority, Ministry of Power, Government of India. This is in line with “Tool to calculate the emission factor for an electricity system, version 7”. The emission reductions are calculated as per registered PDD and as per methodology requirement. QA/QC Process: This parameter is calculated, and no any QA/QC procedure required.
E.3. Calculation of leakage >> No leakage emissions are applicable.
E.4. Calculation of net benefits or direct calculation for each SDG Impact
SDG SDG Impact Baseline estimate
Project estimate
Net benefit
7 MWh of renewable energy generated
0 212,266 212,266
8 SDG 8: Decent Work and Economic Growth
0
08 Trainings
23 Employees
59,153,000 INR
08 Trainings
23 Employees
59,153,000 INR
13 Emission Reduction 199,934 0 199,934
TEMPLATE- Monitoring Report
20
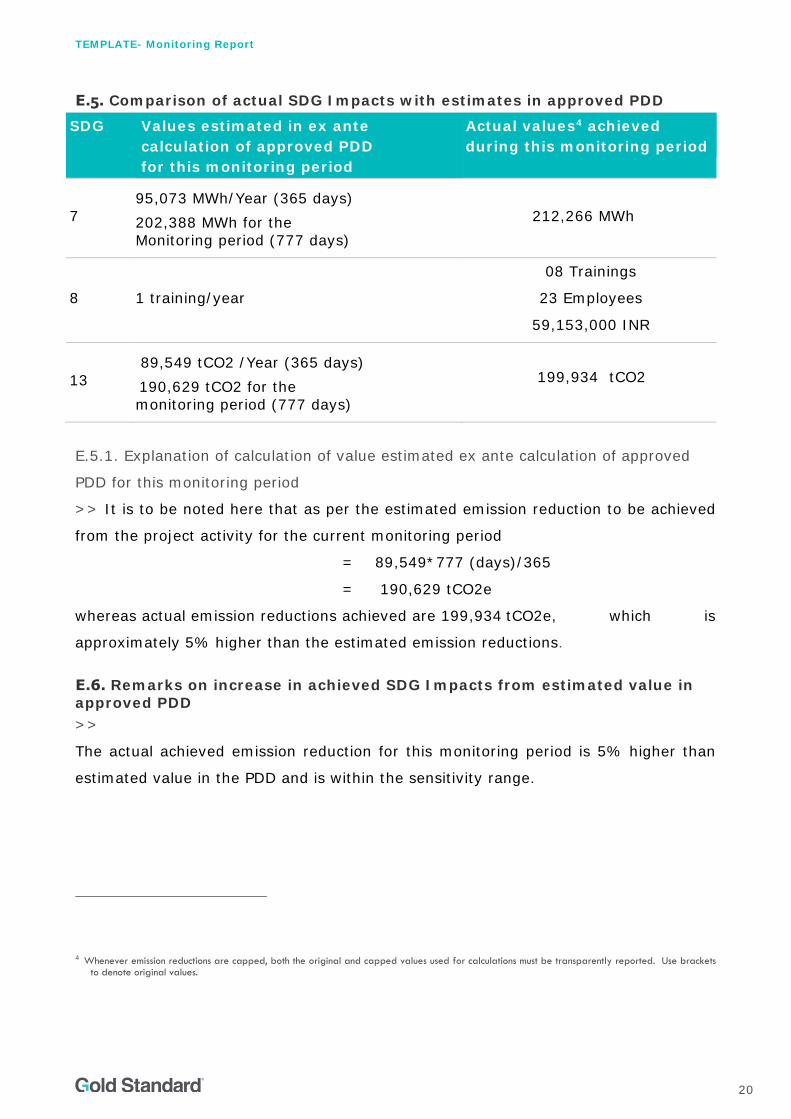
E.5. Comparison of actual SDG Impacts with estimates in approved PDD
SDG Values estimated in ex ante calculation of approved PDD for this monitoring period
Actual values4 achieved during this monitoring period
7 95,073 MWh/Year (365 days) 202,388 MWh for the Monitoring period (777 days)
212,266 MWh
8 1 training/year
08 Trainings
23 Employees
59,153,000 INR
13 89,549 tCO2 /Year (365 days) 190,629 tCO2 for the monitoring period (777 days)
199,934 tCO2
E.5.1. Explanation of calculation of value estimated ex ante calculation of approved
PDD for this monitoring period
>> It is to be noted here that as per the estimated emission reduction to be achieved
from the project activity for the current monitoring period
= 89,549*777 (days)/365
= 190,629 tCO2e
whereas actual emission reductions achieved are 199,934 tCO2e, which is
approximately 5% higher than the estimated emission reductions.
E.6. Remarks on increase in achieved SDG Impacts from estimated value in approved PDD >>
The actual achieved emission reduction for this monitoring period is 5% higher than
estimated value in the PDD and is within the sensitivity range.
4 Whenever emission reductions are capped, both the original and capped values used for calculations must be transparently reported. Use brackets to denote original values.

TEMPLATE- Monitoring Report
21
SECTION F. SAFEGUARDS REPORTING
Safeguarding Principle 9.5 Hazardous and Non-hazardous Waste
Data / Parameter Hazardous and Non-hazardous Waste Mitigation Measures followed
The waste will be disposed to the waste handlers and the firm will comply with all the local laws for monitoring and disposal.
Source of data Plant Records Additional comment All the mitigation measures are implemented at the site.
This is confirmed from site HSE log book and O&M team.
SECTION G. STAKEHOLDER INPUTS AND LEGAL DISPUTES
G.1. List all Inputs and Grievances which have been received via the Continuous Input and Grievance Mechanism together with their respective responses/mitigations. >> No grievances received
G.2. Report on any stakeholder mitigations that were agreed to be monitored. >> No grievances received in the previous monitoring period, thus no follow up
required
G.3. Provide details of any legal contest that has arisen with the project during the monitoring period >> Not applicable

TEMPLATE- Monitoring Report
22
Revision History
Version Date Remarks
1.1 14 October 2020 Hyperlinked section summary to enable quick access to key sections Improved clarity on Key Project Information Section for POA monitoring Forward action request section Improved Clarity on SDG contribution/SDG Impact term used throughout Clarity on safeguard reporting Clarity on design changes Leakage section added for VER/CER projects Addition of Comparison of monitored parameters with last monitoring period Provision of an accompanying Guide to help the user understand detailed rules and requirements
1.0 10 July 2017 Initial adoption