Embed Size (px)
Citation preview

AN EVALUATION TOOL FOR PHYSICS APPLETS
Arcadi Pejuan, Xavier Bohigas, Xavier Jaén
Department of Physics and Nuclear Engineering, Technical University of Catalonia (UPC)
Spain
[email protected], [email protected], [email protected]
Abstract
Physics applets are well known appealing resources to teach and learn physics, and a large number of them are available on the Internet. Nevertheless, not all of them are of the same quality, because such applets do not fit every specific teaching/learning purpose. The start question was which features should have a physics applet in order that it can be considered a good applet according to our experience as teachers or lecturers. The answer should be based on practical evaluations of applets from the Internet, taking quality evaluation criteria already published into account. In this way, an evaluation tool was developed as a rubric which draws attention to the different aspects of an applet that are relevant for teaching or learning a physics topic, grouping these aspects into five categories. Each category is given a separate scoring based on a preparatory qualitative evaluation of the aforementioned aspects. This evaluation tool has been tested on five physics applets by four secondary-school teachers as experts in first-year students’ background. The results show the suitability degree of each of these applets as resources for different teaching/learning environments, as well as the suitability of the evaluation tool itself. In addition, the evaluation tool simplifies the interchange of information on physics applets among teachers and lecturers.
Keywords – multimedia, simulations, applets, physics applets, applet evaluation criteria
1. Introduction
Multimedia resources as teaching and learning tools form part of the so called ‘teaching with technology’. But the use of technology just as a novelty has often resulted in the development of tools which are not pedagogically suitable, for example because they were not more interactive than chalkboard lectures, and teaching with technology without a solid pedagogy, yields no significant educational gain (Christian, Belloni, Dancy & Cox, 2003).
1
1
1
2
3
4
5
6
7
8
9101112131415161718192021222324
2526
27
28
293031323334
23

The need for designing and developing multimedia materials as self-contained, pedagogically rich learning objects was soon acknowledged (Bradley & Boyle, 2004), using a number of constructivist principles by providing, for example, rich interactive visualizations or learner controlled pacing.
Educational applets are one of the most used interactive multimedia resources as learning objects. In particular, physics applets simulate physical phenomena with freely adjustable parameters. According to the important place of technology already in early education in developed countries, as described by Seiter (2009) for Austria, children are encouraged to become involved in areas such as ‘Nature’ and ‘Technology’ from the point of view of technical and scientific phenomena. To question, to test and to explore are abilities which will enable children to gain an insight into technical connections, because children’s curiosity is not primarily based on the demand for scientific explanations but instead develops through the concept of ‘What-If-Relationships’, as stated by this author. Therefore, high-quality applets are a good means of exploring technical and scientific phenomena, due to the possibility of changing parameters at will, exploring ‘what happens if’.
Research shows that visualizations and simulations are a powerful and effective way for students to learn science concepts in learning environments with the suitable technology equipment (Gras, Cañadas & Ginovart, 2013; Zucker & Hug, 2008; Méndez, Lorenzo, Acosta, Torres & González, 2006; Heuer & Blaschke, 2001), and interactive applets provide powerful and flexible simulation tools (Canesin, Gonçalves & Sampaio, 2010). Today there are software tools available which allow lecturers, teachers and even students with very limited Java programming knowledge to create their own independent, high quality applets as an effective teaching and learning tool if used in an appropriate pedagogical setting, including virtual laboratories (Esquembre, 2004; Sánchez et al., 2005). Other JavaScript applications can be useful for self-assessment exercises in an autonomous learning environment (Marcé-Nogué, Gil, Pérez & Sánchez, 2013). Rohaan, Taconis & Jochems (2012) highlight the usefulness of simulations to technology education as preparation for hands-on activities.
2. Applet quality evaluation – Current situation
Certainly, at present there is much multimedia material available worldwide for teaching. However, it is often difficult to find teaching materials matching the teaching purpose required at any given time (Altherr, Wagner, Eckert & Jodl, 2004). The need for evaluating multimedia materials for science teaching and learning was seen already soon, as increasingly more materials of this kind were available. So, Watkins, Augousti & Calverley (1995) evaluated the educational suitability of a software package intended to be used as a replacement for the traditional lecture. Some of these authors’ conclusions concerning computer-technical aspects (like the response of applets to clicks) and user interface design were taken into account in our study,
2
4
35363738
394041424344454647484950
51525354555657585960616263
64
656667686970717273
56

because some simple cues have a considerable effect upon the students’ concept of ‘good-quality’ and user-friendly software. Considerably attention must be paid also to the quality of content of such computer-based learning resources, because students tend to put more faith in the accuracy of information presented on a computer than in a book, according to these authors. However, since 1995 it seems that this higher reliance on ICT learning sources over traditional paper sources may have changed, as this higher reliance was perhaps excessive 20 years ago because of the relative novelty of ICT sources. Thus, Porsch & Bromme (2011) have shown a similar students’ reliability appreciation for encyclopedias, reference books, Internet, and teachers, while students reject newspapers, journals, and Internet forums as suitable sources. In any case, this distinction between source quality levels confirms the need to care for the quality of content of ICT resources.
In this type of simulations, for example the applets evaluated later, the results often include mathematical representations, like vector diagrams or graphs. Therefore, in a quality evaluation, the correct connection between phenomenological description and mathematical representation must be taken into account, responding for example to the students’ difficulties with graphs both in physics and mathematics (Planinic, Milin-Sipus, Katic, Susac & Ivanjek, 2012). Indeed, Park & Choi (2013) have suggested the importance of understanding scientific phenomena as a ‘function’, because when scientific phenomena are understood as a function revealing the relationship of variables, the abstract and theoretical mathematical representations could meaningfully combine with the concrete and realistic scientific phenomena, and this induces meaningful learning.
There are also other software tools for teaching physics in different levels (from primary school to undergraduate education) which have been tested with good results, within a constructivist learning and teaching approach (Tekos & Solomonidou, 2009; Jimenez et al., 2009). Especially, the latter authors highlight the necessary features of the software used as complementary teaching aid for physics in undergraduate education, such as integrative character, adaptability to teacher’s aim, and versatility as a teaching tool.
However, there is not much work published about quality evaluation of physics applets. For software activities in general (including applets), Illa & Franch (2004) refer to the many approaches to quality evaluation which are difficult to compare because of a lacking widespread quality reference framework. Therefore, they propose hierarchically structured quality models from which particular quality evaluation criteria can be inferred, introducing the questions over aspects that are relevant to the particular selection goal. Specifically for physics applets, Christian et al. (2003) have assessed students’ understanding after instruction with an intensive use of them, with results supporting the effectiveness of these interactive materials. These authors state a set of essential characteristics for these applets: simple, visual, interactive and
3
7
747576777879808182838485
8687888990919293949596
979899
100101102103
104105106107108109110111112113
89

flexible both to create and to use. But even in the thematic databases about multimedia material in general, materials are only described by documentation without any information about their quality for a possible user. Only a few of them use an evaluation scheme to judge their content. When the material is evaluated, every organization uses its own list of criteria with its own weaknesses and strengths. Altherr et al. (2004) have compiled a set of these databases that seem to be representative and comprehensive and have initiated a discussion about evaluation criteria, stating a list of criteria characterized by detailed questions. These are accepted quality criteria used as review rubric for the rating of simulations and other multimedia materials (Debowska et al., 2013).
3. Start question and practical goals
The start question was which features a physics applet should have in order that it can be considered a good applet according to our experience as teachers or lecturers. Our aim was to implement the answer to this question as a set of quality evaluation criteria linked to the degree of fulfillment of specific aspects. These were inferred from the literature quoted above (Cristian et al. 2003, Altherr et al. 2004, Jimenez et al. 2009, Planinic et al. 2012) and/or our team’s reflections on our own practical evaluations of real applets from the Internet.
Concerning the learners’ point of view, published results about the evaluation of physics applets by fist-year undergraduate students based on a list of statements were also taken into account (Bohigas, Periago, Jaén & Pejuan, 2011).
So, a first practical goal was the development of a quantitative evaluation tool for physics applets based on the quality evaluation criteria mentioned in the first paragraph. A second practical goal was the evaluation of a sample of applets as test and application of the evaluation tool developed.
We pursued these two practical goals in Section 4 and 5, respectively. In particular, Section 5 reports the results of testing the evaluation tool on five applets as practical examples. Its considerable length responds to the high degree of detail for each of the 5 applets evaluated. This degree of detail may be deemed excessive considering the limited importance of each of the many items. However, it was provided for completeness. Therefore, the length of Section 5 should be given a limited relevance.
4. The evaluation tool – Development method and content
A first step towards answering the start question was a discussion in a team formed by teaching staff of various levels: (a) four secondary-school teachers from different, geographically distant secondary schools, as experts in first-year students’ background and, therefore, the main evaluators of the target applets, (b) five engineering lecturers (including the authors) because of their previous work and experience in physics
4
10
114115116117118119120121122123
124
125126127128129130131
132133134
135136137138
139140141142143144
145
146147148149150
1112

applets, and (c) a teacher training and education science professor, who played an initial valuable advisory role to put out the whole development on the right track with her experience in teaching methodology.
As specific basis for this discussion about the criteria underlying when we teachers consider an applet to be a good resource according to our teaching experience, a first set of ten physics applets were previously selected under following criteria, which had to be fulfilled at least to a great extent:
basic physics level (secondary school, or undergraduate first-year level at the most),
describing phenomena, but offering the possibility of inferring relationships,
relating a phenomenon to its graphic representation,
good working and not too large a file to download,
not inserted in web pages leading to a downloading of banners,
with few or no operating instructions attached.
The applets chosen dealt with vector addition, velocity composition, parabolic trajectory, Carnot cycle, magnet, wave superposition, and Doppler effect.
So, the discussion focused on the informal evaluation of these applets by the team members, but in parallel, the evaluation criteria taken from the references quoted in Section 3 (first paragraph) were taken into account with a critical eye.
As a first problem, display deficiencies were verified: none of the applets could be seen in Mac computers, and other browsers than Microsoft Internet Explorer caused display problems.
Also, there was some confusion in the terminology with regard to the term applet. Deviating from the strict concept stated in the Introduction, the term ‘applet’ was not always distinguished from ‘applet project’, understood as a HTML page that includes not only an applet as Java simulation, but also questions, remarks and comments based on the applet.
There were also opposed aspects to be taken into account when establishing evaluation criteria, for example simplicity vs. poor design or vs. misleading or scientifically deficient treatment, clear movie-like explanation vs. lacking interactivity, self-guiding for autonomous learning vs. use limited to only a teaching tool at the blackboard, and so forth. Also a certain poor conception of learning may be underlying in some applets, like the (wrong) idea that students learn just by observing phenomena, without relating and analyzing them.
5
13
151152153
154155156157
158159
160
161
162
163
164
165166
167168169
170171172
173174175176177
178179180181182183184
1415
In this context, it was realized that it did not make much sense to evaluate whether an applet was good or poor as a whole, but whether its characteristics make it more or less suitable for a specific use in class, a project, and so forth. For example, an applet can be useful for numerical simulation and problem-solving or rather for illustrating a phenomenon in a qualitative way as a help for the teacher’s explanations in class. Therefore, the different characteristics and aspects of applets, that is to say the different evaluation criteria, should be grouped according to the different viewpoints (‘categories’) of interest for each specific use of applets, in line with the conclusions stated by Altherr et al. (2004).
It was realized also that the most opinions and evaluations in the aforementioned discussion referred only to the first three applets (or four at the most). Indeed, most of the comments on every new applet being analyzed were virtually repetition of the comments on the first applets already analyzed.
That is to say, it became evident that (a) it was convenient to establish a fixed evaluation procedure within the framework of a set of categories which grouped the different evaluation criteria together, and (b) four or five physics applets would be sufficient to test this evaluation procedure.
Point (a) led to a start version of a quantitative evaluation tool in the form of a questionnaire with a list of aspects or characteristics of the applet being evaluated (called ‘items’), grouped into categories. Each category corresponds to a different point of view to evaluate an applet, considering also the different uses which can be of interest. These are also the points of view that, taken as a whole, were expected to explain why an applet was deemed of good quality or not: computing/technical aspects, design, scientific quality, potentialities for a course, and underlying learning conception.
According to point (b), this first evaluation tool was tested by the secondary-school teachers in our team on a set of five physics applets designed mainly for secondary education and described in the next section.
The different problems found in the iterative testing were dealt with by all team members and led to a step-by-step improvement of the questionnaire. An important means of improvement turned out to be the free comments made by the evaluating teachers in a blank space provided to this purpose after each category in the first versions of the questionnaire. A few items were eliminated through lack of practical relevance for virtually all physics applets (e.g. concerning ethical aspects). Some few items were initially formulated as negative aspects and this could be confusing for scoring. Therefore, they were reworded as positive aspects. As a result, after three iterations over a whole academic year, no more improvements were suggested by the evaluating teachers for the last version presented here.
6
16
185186187188189190191192193
194195196197
198199200201
202203204205206207208209
210211212
213214215216217218219220221222
1718

In the resulting evaluation tool, a score is given to every category as a whole, instead of every item in the category. However, as a preparation for this quantitative scoring, every item had to be evaluated before rather qualitatively, from ‘very negative’ (sign ‘––‘) up to ‘very positive’ (sign ‘++’) with regard to each specific learning/teaching environment. The sole aim of this preparatory qualitative evaluation is to make the evaluator reflect on each item, considering all positive and negative characteristics of the applet before giving the overall score to the category. Indeed, the score given to every category has to be based on the overall impression given by all items as a whole, not individually. It is true that this qualitative evaluation could be turned into a quantitative one, for example by giving ‘very negative’ a value of 0 and ‘very positive’ a value of 5, with intermediate values for the intermediate ratings. However, the quantity of plus signs (+) and minus signs (–) noted on the evaluation form can better help the evaluator in a visual way to give his or her quantitative category score as a whole.
The total number of items, 43, may seem very large, but the most aspects addressed by them are very specific and easy to rate. In addition, not all of them are relevant for all applets, so that many can be immediately rated as ‘irrelevant’ (no plus nor minus sign) for a given applet, speeding up the whole evaluation.
After the development of this evaluation tool with its iterative testing, the final set of categories was found to be neither insufficient nor excessive, as they grouped all the relevant criteria (items) in a logical, ordered manner. The resulting evaluation tool is shown as Tables 1 and 2.
With regard to the category scoring scale of 0 to 10 (absolutely poor to absolutely excellent, respectively), it may be deemed too large, since it makes little sense to distinguish for example between 6 and 7 out of 10 in this case. However, this choice in the version in Tables 1 and 2 responds to the usual grading/scoring scale that is familiar to teachers and people in general in Spain. Of course, it can be changed very easily to any usual grading scale in any country, mentioning the score scale (0-10 in our case, or for example 0–100, 6-1, H–A, or E–A in other countries).
Name: Applet:
Please evaluate each one of following items qualitatively as very positive (++), positive (+), irrelevant (0), negative (–) or very negative (– –) in the applet evaluated. Afterwards, basing on this preparatory qualitative evaluation, score the category quantitatively as a whole on a scale of 0 (‘absolutely poor’) to 10 (‘absolutely excellent’).
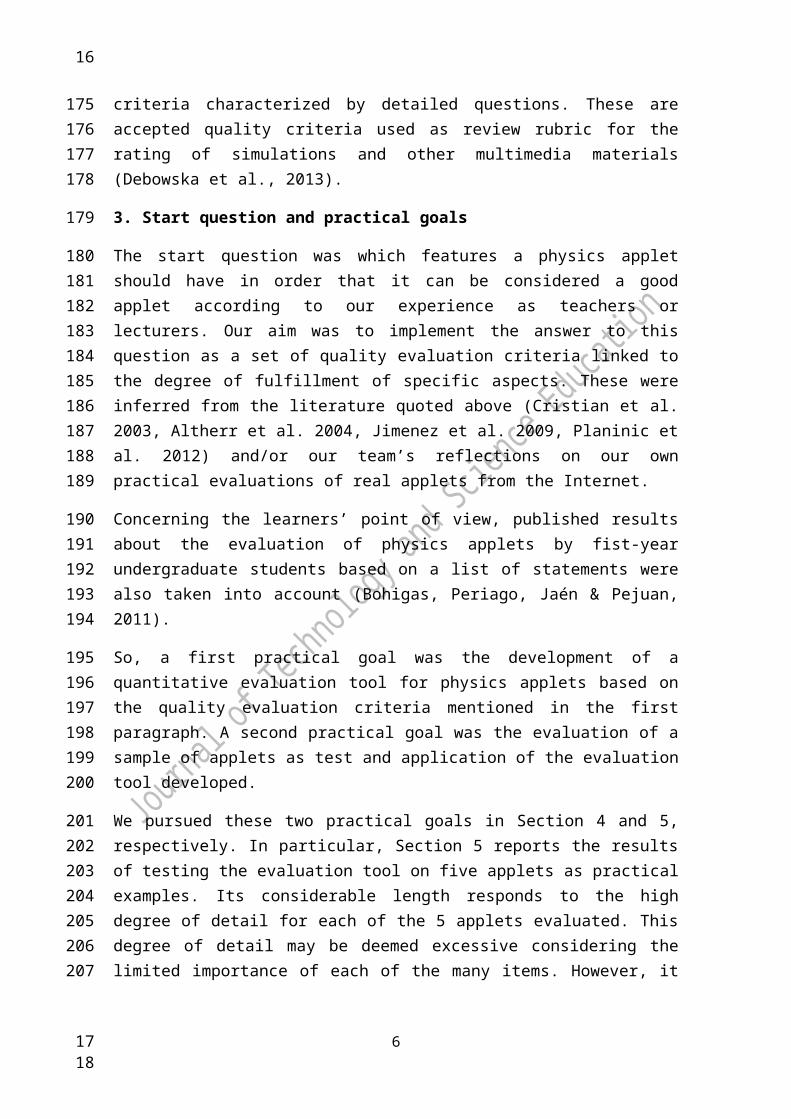
Category A: Computing/Technical Aspects. That is to say factors that depend on the programming and computing ability of the applet designer or on the web site containing the applet.
Item Evaluation
7
19
223224225226227228229230231232233234235236
237238239240
241242243244
245246247248249250251
2021

A01 Screen refresh rate (the applet responds quickly to any parameter modification)
A02 Degree of interactivity
A03 Easy entering of data
A04 Easy to see how to handle the applet
A05 Suitable speed of the phenomenon displayed (suitable to follow it visually)
A06 Automatic correct readaptation of the display of results (e.g. by rescaling the coordinate axes, rounding figures correctly, etc.)
A07 Opening of the applet in an adjusted window size
A08 Good connection to the website containing the applet (source website always working, not too slow, …)
A09 Stability of the source website (not changing from day to day)
A10 Clear displayed technical information on the operations that can be performed
A11 Easy handling
Score of the category (0 to 10)
Category B: Design. That is to say quality of the visual language used both from the aesthetic viewpoint and the visual clarity of the scientific message.
Item Evaluation
B01 Eye-catching design
B02 Esthetically appealing design
B03 Easy interpretation of the phenomenon displayed
B04 Rich scientific contents of the images
B05 Relative screen occupation: good distribution of the information on the screen
B06 Proper use of a color code (same color for same elements)
B07 Suitable font size, font type and text color
B08 Clear expression of results after operation
B09 Symbols adequate for the scientific message content: images adequate for the elements they represent
8
22
2324

B10 Clarity in the simultaneous use of real and abstract elements
B11 Adequate proportions of the single images on the screen (e.g. an ape not as large as a cannon nor even larger)
Score of the category (0 to 10)
Table 1. Evaluation Questionnaire (first part)
Category C: Scientific quality of the message. That is to say factors that depend on the scientific accuracy of the applet. We will consider it reliable if the representation of the phenomenon fits the scientifically accepted model.
Item Evaluation
C01 Scientific correctness of the message
C02 Quantity of information on the result obtained from handling the applet
C03 Adequate number of significant figures in the results
C04 Clear frame of reference
C05 Display of the units for the magnitudes involved
C06 Representation of the phenomenon also in a qualitative way
C07 Display of real phenomena together with the representation of the theoretical model applied
Score of the category (0 to 10)
Category D: Potentialities for use in a course. That is to say potentialities for being included in a teaching unit, considering the applet as a mere Java application included in a HTMP page, not as an applet project.
Item Evaluation
D01 It can be used as a movie where the explanation must be given by the teacher
Solució:
D02 It can be used as a slide (it can be used instead of a drawing or diagram) Solució:
D03 It is useful to display a phenomenon Solució:
D04 It serves as a complement to problem-solving Solució:
D05 It can be easily adapted for a project Solució:
D06 It improves the efficiency of the time devoted to interpret the phenomenon
Score of the category (0 to 10)
9
25
252
2627

Category E: Underlying learning conception. The learning conception includes images and interaction possibilities resulting from the different learning process models.
Item Evaluation
E01 The applet tries to advance the learning process with regard to possible misconceptions (e.g. with irrelevant variables like mass in the parabolic motion)
Solució:
E02 It tries to advance the learning process through interactive discovery Solució:
E03 It has just the needed number of variables which the user can choose and play with (both phenomenon and animation variables)
Solució:
E04 It tries to advance the learning process on a trial-and-error basis Solució:
E05 It tries to advance the learning process by means of appealing images (e.g. on the principle that using appropriate colours helps to understand)
Solució:
E06 It tries to advance the learning process explaining with just the number of details needed (i.e. nothing is excessively explained)
Solució:
E07 Adequate complexity: there are not too many things to do, as it is a delimited problem
Solució:
E08 Even if it tries to be simple, it deals with the matter correctly from a didactic viewpoint, without leading to confusions
Score of the category (0 to 10)
Table 2. Evaluation Questionnaire (second part)
5. Applets evaluated
The evaluation tool developed was tested by the secondary-school teachers in our team on a set of five physics applets. Certainly, the applets chosen may be deemed old-style applets and at present there is instructional software which is much more visually appealing. However, the first four of these applets are still very used in class because of their easy availability in the Internet and their practical features, in spite of their possible old-fashioned look. Indeed, referring to the seductive detail principle, Rey (2011) has proved that today’s increasing seductive illustration details, as they can be found in more recent instructional materials, do not significantly influence learning performance.
The test results show the suitability degree of each of these applets as teaching/learning resources for different teaching/learning environments, as well as the suitability of the evaluation tool itself for any other physics applets.
When mentioning the strengths and weaknesses of each applet on which the evaluation results are based, reference is made to the items in Tables 1 and 2 (first column). Many of these mentions are the literal open comments added by the
10
28
253
254
255256257258259260261262263
264265266
267268269
2930

evaluating teachers at the end of each category in the development of the evaluation tool.
With regard to scores, the mean values of the scores provided by the four evaluating teachers are given. Also the corresponding standard deviations are given, but not as a measure of the statistical significance, which would be out of place here. Indeed, the reduced number of evaluating teachers is certainly a strong limitation in terms of statistical power. However, our aim was not a quantitative score for the goodness of the evaluation tools, but the building of a good evaluation tool in the form of a rubric based on published criteria and our own team experience as described in Section 4. The usefulness of this evaluation tool is illustrated by the fact observed in the following that, in general, the four evaluating teachers did not differ too much in their independent scores, despite they came from different, geographically distant schools.
Figure 1. Initial display of applet No. 1, ‘Motion with constant acceleration’
5.1. Applet 1 – Motion with constant acceleration
(a) Source: http://www.walter-fendt.de/ph14e/acceleration.htm (English version)
(b) Description: (Fig. 1) The applet simulates the one-dimensional motion of a car with adjustable values for initial position, initial velocity, and acceleration.
(c) Evaluation:
Category A (Computing/Technical Aspects): mean score 8 ± 1 (out of 10).
11
31
270271
272273274275276277278279280281
282
283
284
285
286287
288
289
3233
Strengths: It is easy to see how the applet works (A04) and its use is also easy (A11). In addition, an option ‘Slow motion’ is available (A05), which is very useful in class.
Weaknesses: Only A06 was poorly evaluated. Indeed, the coordinate axes in the graphs are not rescaled, so that often, a large portion of the graph becomes useless. Neither is the whole picture rescaled or readapted for example in case of zero initial position and negative velocity. Then, the car gets out of the screen and disappears. Because of the lacking rescaling of the axes, if negative values for initial velocity and acceleration are entered, the position vs. time curve remains out of the graph area (it is not drawn).
Category B (Design): mean score 7 ± 1 (out of 10).
Strengths: Visually appealing design (B01), with a consistent colour use (although one evaluating teacher found too many colours, leading to a distracting first impression) (B06). Protagonist role of the graphs (B04, B08).
Weaknesses: The right panel for entering values and options takes too much space (about 30% of the window), which would be more useful for relieving the agglomeration of moving object, chronometers and graphs (B05).
Category C (Scientific quality of the message): mean score 7 ± 1 (out of 10).
Strengths: Clear reference system (C04), units of measurement expressly mentioned (C05), large quantity of information (C02). Also the option of representing the velocity vector or the acceleration vector on the moving car (C07).
Weaknesses: No negative initial positions allowed, and deficient treatment of negative initial velocities (quantitative possibilities not sufficiently considered) (C06). Not careful enough about significant figures (C03). [The former version taken for this study contained an error in the units of acceleration (m/s instead of m/s2) (C01), which has already been corrected.]
Category D (Potentialities for use in a course): mean score 8 ± 1 (out of 10).
Strengths: Easy to adapt for a project (D05), especially for interpreting the negative sign of acceleration, depending on the plus or minus sign of the velocity. It allows to improve the efficiency of the time devoted to teach or to learn this phenomenon (D06), because it favours its mental representation and the abstraction. Useful for checking problem-solving (D04), especially because of the two chronometers anchored at two points of the path.
Weaknesses: None under this category.
Category E (Underlying learning conception): mean score 7 ± 1 (out of 10).
12
34
290291292
293294295296297298299
300
301302303
304305306
307
308309310
311312313314315
316
317318319320321322
323
324
3536

Strengths: It tries to advance the learning process by explaining all details visually (E05).
Weaknesses: None under this category.
Figure 2. Screenshot from applet No. 2, ‘Crossing the river’ (= ‘Cruzar el río’) about composition of velocities, during running
5.2. Applet 2 – ‘Crossing the river’ (Composition of velocities)
(a) Source: http://www.educaplus.org/play-108-Cruzar-el-río.html (only Spanish version available)
(b) Description: (Fig. 2) The applet simulates the composition of two velocities at equal or different angles: the downstream velocity of water in a river and the velocity of a jet ski relative to water.
(c) Evaluation:
Category A (Computing/Technical Aspects): mean score 8.8 ± 0.5 (out of 10).
Strengths: Easy to see how it works (A04) and easy to use (A11).
Weaknesses: It is not always easy to enter an exact angle previously chosen (e.g. in order to compare with the result of solving a given numerical problem) (A03). For
13
37
325326
327
328
329330
331
332333
334335336
337
338
339
340341
3839

some velocity values, the jet ski gets off the screen while the applet keeps computing positions which are not shown (A06).
Category B (Design): mean score 9 ± 1 (out of 10).
Strengths: Visually appealing, beautiful design (B01, B02), with a fairly realistic appearance evoking a real situation, combined with abstract symbols which refer to the underlying theory model (B09 to B11). Clear display of both numerical and graphical results (current position of the jet ski) (B08). The colour code helps to use properly the applet, distinguishing at once which the possible entries and the available results are (B06). The use of arrow buttons to increase or decrease the entries delimits the range of entries available, avoiding troublesome results (B03).
Weaknesses: The resulting vector sum should be highlighted more clearly (B03). No information on the theoretical validity conditions (B11).
Category C (Scientific quality of the message): mean score 7 ± 1 (out of 10).
Strengths: The real phenomenon is displayed together with the composition of velocities according to the theory model (C07). The quantity of data displayed is large (C02), although it could be larger for comparison with data obtained from problem-solving.
Weaknesses: Position data without units (C05). The actual scales for the x and y positions are not the same, because when setting the angle at 45º and the water velocity at 0 m/s, x and y should be exactly the same, but they are not (C01). The number of significant figures in the results is not consistent with that in the data entered (C03).
Category D (Potentialities for use in a course): mean score 8 ± 2 (out of 10).
Strengths: It helps to improve the efficiency of the time devoted to interpret the composition of velocities (D06) due to its clear, simple design. It is useful for problem-solving or similar activities (D04); students may even be asked to write a problem statement themselves, to solve it and to compare the results with those from the applet. It can be also useful for integration into a project (D05).
Weaknesses: None under this category.
Category E (Underlying learning conception): mean score 8 ± 1 (out of 10).
Strengths: It uses just the variables needed to explain the phenomenon (E03). It tries to advance the learning process by means of visually appealing images (E05). If used in a specific manner, it can help to advance the learning process on a trial-and-error basis (E04), as well as through interactive discovery (E02).
14
40
342343
344
345346347348349350351352
353354
355
356357358359
360361362363364
365
366367368369370
371
372
373374375376
4142

Weaknesses: None under this category.
Figure 3. Screenshot from applet No. 3, ‘Spring pendulum’
5.3. Applet 3 – Mass and spring system
(a) Source: http://www.electronics.dit.ie/staff/ktiernan/DT020/ph14e/springpendulum.htm , http://www.walter-fendt.de/ph14e/springpendulum.htm (English version)
(b) Description: (Fig. 3) The applet simulates the simple harmonic motion of a mass and spring system (assuming no friction), displaying elongation, velocity, acceleration, force or energy vs. time. (The English applet title is ‘Spring pendulum’, but we avoid this designation since it may lead to a misunderstanding.)
(c) Evaluation:
Category A (Computing/Technical Aspects): mean score 9.3 ± 0.5 (out of 10).
Strengths: The applet reacts quickly to any command (A01). As the time runs or if other graph magnitudes are chosen, the axes are rescaled always appropriately and quickly, so that the whole available screen area is used in an optimal way (06). It provides clear technical information on the possibilities (A10). It is easy to use (A11) and offers many options for interactivity (A02). The running speed is adequate and in addition, the option ‘Slow motion’ may be very useful in class (A05).
Weaknesses: None under this category.
15
43
377
378
379
380
381382383
384385386387
388
389
390391392393394395396
397
4445

Category B (Design): mean score 8 ± 1 (out of 10).
Strengths: The images and symbols used are adequate to the scientific message content (B09). The results of handling the applet are expressed clearly, with a essential role of the graph (B08). Consistent colour use (although one evaluating teacher found the colours a bit too gaudy) (B06). Eye-catching design (B01).
Weaknesses: The right panel for entering values and options takes too much space (about 30% of the window) (B05).
Category C (Scientific quality of the message): mean score 9 ± 1 (out of 10).
Strengths: The message given is comprehensive and, nevertheless, correct, also in the representation of both potential and kinetic energy types and when referring to both gravitational and elastic potential energies involved (C01). The simultaneous display of phenomenon and graph helps to deal with some misconceptions about the simple harmonic motion linked to its graph (C07).
Weaknesses: The number of significant figures in the results for energy seems to change arbitrarily, while students have to learn that this number is linked to the accuracy of each result (C03). The applet would improve if the graphs of elongation, velocity and acceleration were displayed simultaneously (C02), and also if the phase could be given different values, in order to round off the quantitative aspects of the study (C06).
Category D (Potentialities for use in a course): mean score 9 ± 1 (out of 10).
Strengths: It allows to increase the efficiency of the time devoted to teach or to learn this phenomenon which is relatively complex for secondary-education students (D06), even when used in class to reinforce the teacher’s explanations. Easy to adapt for a project (D05) and for activities on simple harmonic motion, especially for checking the corresponding problem-solving (D04).
Weaknesses: None under this category.
Category E (Underlying learning conception): mean score 8 ± 1 (out of 10).
Strengths: Students can discover the relationship between different variables in the motion (e.g. how the period varies with a different mass); also the way how the applet shows the different graphs one after another is suitable to learn through guided interactive discovery (E02). The combined display of the real phenomenon and the different graphs can help to deal with misconceptions (E01). The number of variables to choose are just the necessary ones (E03).
Weaknesses: None under this category.
16
46
398
399400401402
403404
405
406407408409410
411412413414415416
417
418419420421422
423
424
425426427428429430
431
4748

Figure 4. Screenshot from applet No. 4, ‘Reflection and refraction with Huygens wavelets’, during running, with secondary waves at the change of medium
5.4. Applet 4 – Reflection and refraction with Huygens wavelets
(a) Source: http://micro.magnet.fsu.edu/primer/java/reflection/huygens (English version)
(b) Description: (Fig. 4) The applet simulates the propagation of a light wave according to Huygens’ principle, allowing to vary the refractive indexes and the angle of incidence.
(c) Evaluation:
Category A (Computing/Technical Aspects): mean score 7 ± 2 (out of 10).
Strengths: Easy adjustment of the data (A03). Easy handling (A11).
Weaknesses: Degree of interactivity rather low (e.g. no start-stop control) (A02).
Category B (Design): mean score 7 ± 1 (out of 10).
Strengths: The images and symbols are adequate to the message content and its representation (B09). Eye-catching design (B01). After operation, the results are expressed clearly (B08). Rich scientific content of the images describing Huygens’ principle (B04).
Weaknesses: The simultaneous use of real and abstract elements is not clear and needs the teacher’s explanation (B10).
Category C (Scientific quality of the message): mean score 7 ± 1 (out of 10).
17
49
432
433434
435
436437
438439440
441
442
443
444
445
446447448449
450451
452
5051

Strengths: The phenomenon of light reflection and refraction is represented both in a quantitative and qualitative way (C06), including the underlying theoretical model (C07). The message is scientifically correct (C01).
Weaknesses: None under this category.
Category D (Potentialities for use in a course): mean score 6 ± 2 (out of 10).
Strengths: It can be useful as a good movie with the teacher’s explanation (D01).
Weaknesses: It is not possible to pause the image as a fixed slide, to the detriment of a possible more detailed explanation by the teacher (D02).
Category E (Underlying learning conception): mean score 6 ± 1 (out of 10).
Strengths: It allows to advance the learning process through interactive discovery (E02), as well as by means of appealing images and image motion, also using colours which help to understand the phenomenon (E05).
Weaknesses: None under this category.
Figure 5. Initial display of applet No. 5, ‘Microscope’
5.5. Applet 5 – Microscope
(a) Source: http://cvu.strath.ac.uk/courseware/msc/jbaggot/microscope/microscope.html (this was the original source, currently not available. A copy is available at http://baldufa.upc.edu/recerca/acreac/Optica_05/index.htm . Currently, a somewhat similar microscope applet, but with better features, is available at http://vnatsci.ltu.edu/s_schneider/physlets/main/microscope.shtml. Of course, this is not the applet evaluated here).
18
52
453454455
456
457
458
459460
461
462463464
465
466
467
468
469470471472473474475
5354

(b) Description: (Fig. 5) The applet simulates relevant light rays in a microscope, whose lenses can be shifted and modified within given ranges.
(c) Evaluation:
Category A (Computing/Technical Aspects): mean score 3 ± 1 (out of 10).
Strengths: Good refresh rate (A01).
Weaknesses: It is not easy to see how to handle the applet (A04) and no technical information is given about the operations that can be performed (A10). It is not possible to enter numerical data and it is difficult to set a given geometrical situation chosen beforehand (A03). Difficult handling (A11).
Category B (Design): mean score 3.5 ± 0.6 (out of 10).
Strengths: None by at least three of the evaluating teachers.
Weaknesses: Difficult interpretation of the phenomenon displayed (B03) and no clarity in the results of changing the geometrical situation (B08). Dull (B01), rather unpleasant and poor design (B02). Poor colour code (B06).
Category C (Scientific quality of the message): mean score 4 ± 1 (out of 10).
Strengths: None by at least three of the evaluating teachers.
Weaknesses: Actually, it does not show the image formation in a microscope, but the deviation of light rays when going across the lenses. The images are not very accurate and the results obtained have no much scientific value, since no information (no message) about them and their obtaining is available (C01, C02). No realistic display of the real phenomenon together with the theoretical model applied (C07).
Category D (Potentialities for use in a course): mean score 4 ± 2 (out of 10).
Strengths: It can be useful as a slide for supporting the teacher’s explanations (D02). Although with limitations, it can be useful to display the light path in a microscope (D03).
Weaknesses: Because of its exclusively qualitative nature, it cannot be used for supporting problem-solving (D04). It is not suitable for incorporation into a project (D05).
Category E (Underlying learning conception): mean score 1 ± 1 (out of 10).
Strengths: None by at least three of the evaluating teachers.
19
55
476477
478
479
480
481482483484
485
486
487488489
490
491
492493494495496497
498
499500501
502503504
505
506
5657

Weaknesses: It tries to be simple, but it does not deal with the matter in a wise didactic manner, leading to confusions (E08). Because of its behaviour, it is not suitable for learning through interactive discovery or for autonomous learning (E02), and it is too complex and becomes a not delimited problem (E07).
Table 3 summarizes the scores of every category, allowing to draw the final conclusions from this practical evaluation. In particular, it allows an immediate comparison in order to infer which of the applets is better from which viewpoint.
Applet
Computing/ technical
aspects DesignScientific quality
Potential-ities for a
course
Underlying learning
conception
Motion with constant acceleration 8 ± 1 7 ± 1 7 ± 1 8 ± 1 7 ± 1
‘Crossing the river’ (Composition of velocities) 8.8 ± 0.5 9 ± 1 7 ± 1 8 ± 2 8 ± 1
Spring pendulum 9.3 ± 0.5 8 ± 1 9 ± 1 9 ± 1 8 ± 1
Reflection and refraction with Huygens wavelets 7 ± 2 7 ± 1 7 ± 1 6 ± 2 6 ± 1
Microscope 3 ± 1 3.5 ± 0.6 4 ± 1 4 ± 2 1 ± 1
Table 3. Synopsis of the scoring of the five applets evaluated, considering the different categories (mean score ± standard deviation, out of 10)
6. Conclusions
We considered the criteria for deeming a physics applet a good one according to our experience as teachers or lecturers. Their analysis lead to a list of aspects (Tables 1 and 2) taken in part from the literature and refined and completed step by step on the basis of our own iterative tests on applets. This list formed the basis for a quality evaluation tool for physics applets. It was realized that an applet evaluation with only an absolute quantitative result for the applet as a whole did not make much sense, but the evaluation should instead address each of the five different viewpoints or ‘categories’ of criteria under which the different aspects could be grouped: Computing/technical aspects, Design, Scientific quality, Potentialities for use in a course, and Underlying learning conception.
With regard to the five applets chosen to test the final evaluation tool, Table 3 summarizes the results. The first three ones are examples of good applets, with potential for use in a practical course. The forth one is also quite good, especially as a support for the teacher in class, but not so much for autonomous learning activities for example, in comparison with the preceding ones. In contrast, the fifth one is an example of poor applet from all viewpoints.
20
58
507508509510
511512513
514515
516
517518519520521522523524525526
527528529530531532
5960

So, the set of scores given to the mentioned categories provides more accurate information about the suitability of a given applet than an overall score for the applet as a whole, considering the particular teaching/learning environment in each practical case. It also provides clearer information than a hypothetical large set of scores for the many single criteria or items under the categories in Tables 1 and 2, for which a problematic weighting is not needed anymore. This makes this evaluation tool a good compromise between clarity and detail accuracy, leading to a quality evaluation with useful information for practice. In addition, it simplifies the interchange of information on physics applets among teachers and lecturers. In addition, the rubric form of the evaluation tool helps to detect and correct weaknesses of applets that already exist or are currently being built. By way of example, the interactivity of applet 4 could be essentially improved by adding control buttons as indicated in Section 5.4.
7. References
Altherr, S., Wagner, A., Eckert, B. & Jodl, H.J. (2004). Multimedia material for teaching physics (search,
evaluation and examples). European Journal of Physics, 25, 7–14.
Bohigas, X., Periago, C., Jaén, X. & Pejuan, A. (2011). Evaluation by university students of the use of
applets for learning physics. Journal of Educational Multimedia and Hypermedia, 20(3), 235-245.
Bradley, C. & Boyle, T. (2004). The Design, Development, and Use of Multimedia Learning Objects.
Journal of Educational Multimedia and Hypermedia, 13(4), 371-389.
Canesin, C.A., Gonçalves, F.A.S. & Sampaio, L.P. (2010). Simulation tools for power electronics courses
based on Java technologies. IEEE Transactions on Education, 53(4), 580-586.
http://dx.doi.org/10.1109/TE.2009.2036157
Christian, W., Belloni, M., Dancy, M. & Cox, A. (2003). Authoring and assessing Physlet (R)-based
interactive curricular material. In IEEE Region 8 Eurocon 2003, Vol A, Proceedings: Computer as a Tool,
Ljubljana, Slovenia (pp. 41-44).
Debowska, E., Girwidz, R., Greczyło, T., Kohnle, A., Mason, B., Mathelitsch, L., et al. (2013). Report and
recommendations on multimedia materials for teaching and learning electricity and magnetism.
European Journal of Physics, 34, L47-L54. http://dx.doi.org/10.1088/0143-0807/34/3/L47
Esquembre, F. (2004). Easy Java Simulations: a software tool to create scientific simulations in Java.
Computer Physics Communications, 156, 199–204. http://dx.doi.org/10.1016/S0010-4655(03)00440-5
Gras, A., Cañadas, J.C. & Ginovart, M. (2013). A free accessible individual-based simulator enabling
virtual experiments on soil organic matter processes in classroom, Journal of Technology and Science
Education, 3(2), 73-88. http://dx.doi.org/10.3926/jotse.72
21
61
533534535536537538539540541542543544
545
546547
548549
550551
552553554
555556557
558559560
561562
563564565
6263

Heuer, D. & Blaschke, K. (2001). Learning physics with multimedia- and experimental-supported
workshop instruction. In H. Behrendt et al. (Ed.), Research in Science Education – Past, Present, and
Future (pp. 301–306). Kluwer Academic Publishers.
Illa, X.B. & Franch, X. (2004). Formalising software quality using a hierarchy of quality models. In
Database and Expert Systems Applications, Proceedings, Lecture Notes in Computer Science, vol. 3180,
Zaragoza, Spain (pp. 741-750).
Jimenez, P.M., Perez, G.P., Martinez, M.V., Martinez, M.C.G., Posadillo, R. & Martinez, E.V. (2009).
Virtual learning environment for physics instruction. In CSEDU 2009: Proceedings of the First
International Conference on Computer Supported Education, vol. II, Lisbon, Portugal (pp. 73-77).
Marcé-Nogué, J., Gil, LL., Pérez, M.A. & Sánchez, M. (2013). Self-assessment exercises in continuum
mechanics with autonomous learning. Journal of Technology and Science Education, 3(1), 23-30.
http://dx.doi.org/10.3926/jotse.57
Méndez, J.A., Lorenzo, C., Acosta, L., Torres, S. & González, E. (2006). A web-based tool for control
engineering teaching. Computer Applications for Engineering Education, 14, 178-187.
http://dx.doi.org/10.1002/cae.20080
Park, E.J. & Choi, K, (2013). Analysis of student understanding of science concepts including
mathematical representations: pH values and the relative differences of pH values. International
Journal of Science and Mathematics Education, 11, 683-706.
Planinic, M., Milin-Sipus, Z., Katic, H., Susac, A. & Ivanjek, L. (2012). Comparison of student
understanding of line graph slope in physics and mathematics. International Journal of Science and
Mathematics Education, 10, 1393-1414.
Porsch, T. & Bromme, R. (2011). Effects of epistemological sensitization on source choices. Instructional
Science, 39, 805-819.
Rey, G.D. (2011). Seductive details in multimedia messages. Journal of Educational Multimedia and
Hypermedia, 20(3), 283-314.
Rohaan, E.J., Taconis, R. & Jochems, W.M.G. (2012). Analysing teacher knowledge for technology
education in primary schools. International Journal of Technology and Design Education, 22, 271-280.
http://dx.doi.org/10.1007/s10798-010-9147-z
Sánchez, J., Esquembre, F., Martín, C., Dormido, S., Dormido-Canto, S., Canto, R.D., et al. (2005). Easy
Java Simulations: an open-source tool to develop interactive virtual laboratories using
MATLAB/Simulink. International Journal of Engineering Education, 21(5), 798-813.
22
64
566567568
569570571
572573574
575576577
578579580
581582583
584585586
587588
589590
591592593
594595596
6566

Seiter, J. (2009). “Crafts and technology” and “technical education” in Austria. International Journal of
Technology and Design Education, 19, 419-429. http://dx.doi.org/10.1007/s10798-009-9096-6
Tekos, G. & Solomonidou, C. (2009). Constructivist learning and teaching of optics concepts using ICT
tools in Greek primary school: A pilot study. Journal of Science Education and Technology, 18, 415–
428. http://dx.doi.org/10.1007/s10956-009-9158-2
Watkins, J., Augousti, A. & Calverley, G. (1995). Evaluation of a Physics Multimedia Resource. Computers
& Education, 28(3), 165-171.
Zucker, A.A & Hug, S.T. (2008). Teaching and Learning Physics in a 1:1 Laptop School. Journal of Science
Education and Technology, 17, 586–594. http://dx.doi.org/10.1007/s10956-008-9125-3
AUTHOR BIOGRAPHY
Arcadi Pejuan
Arcadi Pejuan received his PhD degree in Sciences in 1984 from the University of Barcelona. He is Assistant Professor at the Technical University of Catalonia (UPC), where he teaches Physics and related subjects since 1990. His main research area is Efficiency and Innovation in Physics Education.
Xavier Bohigas
Xavier Bohigas received his PhD from the University of Barcelona. Since 1991, he teaches Mechanics and Electromagnetism as Assistant Professor at the Technical University of Catalonia (UPC). His research interest in Education includes Internet applications, engineering education, and teaching and learning strategies.
Xavier Jaén
Xavier Jaén received his PhD from the University of Barcelona. Since 1988, he teaches Mechanics and Electromagnetism as Assistant Professor at the Technical University of Catalonia (UPC). His research includes the pedagogical aspects of the Internet.
23
67
597598
599600601
602603
604605
606
607
608609610611
612
613614615616
617
618619620
621
6869


![한국어 전산통사붐석의 여러 양상*s-space.snu.ac.kr/bitstream/10371/85834/1/16.[주제발표] 한국어 전산통사... · UKOG-이것은 Unifìcation-based Korean Grammar의](https://img.pdfslide.net/doc/110x75/5e081fe81a6c267b24691da2/oee-e-e-fs-spacesnuackrbitstream1037185834116oeeoeoe.jpg)