Embed Size (px)
Citation preview

RESEARCH ARTICLE
Temporal and Spatial Evolution of Dengue
Incidence in Brazil, 2001-2012
Nadia Cristina Pinheiro Rodrigues1,2¤a¤b*, Valeria Teresa Saraiva Lino1☯, Regina
Paiva Daumas1, Monica Kramer de Noronha Andrade1,3☯, Gisele O’Dwyer1☯, Denise Leite
Maia Monteiro2☯, Alyssa Gerardi4, Gabriel Henrique Barroso Viana Fernandes5‡, Jose
Augusto Sapienza Ramos5‡, Carlos Eduardo Goncalves Ferreira5‡, Iuri da Costa Leite1‡
1 National School of Public Health Sergio Arouca, Oswaldo Cruz Foundation, Rio de Janeiro, Rio de Janeiro,
Brazil, 2 School of Medical Sciences, Rio de Janeiro State University, Rio de Janeiro, Rio de Janeiro, Brazil,
3 Centre for Studies and Research on Ageing, Vital Brazil Institute, Rio de Janeiro, Rio de Janeiro, Brazil,
4 Georgetown University, Washington, D.C., United States of America, 5 School of Geology, Rio de Janeiro
State University, Rio de Janeiro, Rio de Janeiro, Brazil
☯ These authors contributed equally to this work.
¤a Current address: Centro de Saude Germano Sinval Faria, Escola Nacional de Saude Publica Sergio
Arouca, Fundacão Oswaldo Cruz, Rio de Janeiro, Rio de Janeiro, Brazil
¤b Current address: Departamento de Tecnologias de Informacão e Educacão em Saude, Faculdade de
Medicina, Universidade do Estado do Rio de Janeiro, Rio de Janeiro, Rio de Janeiro, Brazil
‡ These authors also contributed equally to this work.
Abstract
Background
In Brazil, the incidence of dengue greatly increased in the last two decades and there are
several factors impeding the control of the disease. The present study focused on describing
the space-time evolution of dengue in Brazil from 2001 to 2012 and analyzing the relation-
ship of the reported cases with socio-demographic and environmental factors.
Methods
The analytic units used in the preparation of thematic maps were municipalities. Statistical
tests and multilevel regression models were used to evaluate the association between den-
gue incidence and the following factors: climate, diagnostic period, demographic density,
percentage of people living in rural areas, Gross Domestic Product, Gini index, percentage
of garbage collection and the rate of households with a sewage network.
Results
The largest accumulation of dengue cases in Brazil was concentrated on the Atlantic coast
and in the interior part of São Paulo State. The risk of dengue in subtropical and tropical cli-
mates was 1.20–11 times lower than that observed in semi-arid climates. In 2009–2010 and
2011–2012, the risks were ten and six times higher than in 2003–2004, respectively.
Conclusion
Dengue is a common infection in the Brazilian population, with the largest accumulation of
dengue cases concentrated on the Atlantic coast and in the interior area of São Paulo State.
PLOS ONE | DOI:10.1371/journal.pone.0165945 November 10, 2016 1 / 12
a11111
OPENACCESS
Citation: Rodrigues NCP, Lino VTS, Daumas RP,
Andrade MKdN, O’Dwyer G, Monteiro DLM, et al.
(2016) Temporal and Spatial Evolution of Dengue
Incidence in Brazil, 2001-2012. PLoS ONE 11(11):
e0165945. doi:10.1371/journal.pone.0165945
Editor: Ying-Hen Hsieh, China Medical University,
TAIWAN
Received: May 3, 2016
Accepted: October 20, 2016
Published: November 10, 2016
Copyright: © 2016 Rodrigues et al. This is an open
access article distributed under the terms of the
Creative Commons Attribution License, which
permits unrestricted use, distribution, and
reproduction in any medium, provided the original
author and source are credited.
Data Availability Statement: Data are available
from the DATASUS website: http://www2.datasus.
gov.br/DATASUS/index.php.
Funding: The authors received no specific funding
for this work.
Competing Interests: The authors have declared
that no competing interests exist.

The high dengue rates observed in the Brazilian coastal region suggest that the cases
imported from neighboring countries contribute to the spread of the disease in the country.
Our results suggest that several socio-demographic and environmental factors resulted in
the increase of dengue in the country over time. This is likely applicable to the occurrence of
other arboviruses like Zika and chikungunya. To reverse the situation, Brazil must imple-
ment effective public policies that offer basic services such as garbage collection and sanita-
tion networks as well as reduce vector populations.
Introduction
Dengue is a mosquito-borne viral disease (arbovirus) caused by a flavivirus, which infects
about 390 million inhabitants of several countries every year. Currently, there are four known
types of dengue virus (DENV): DENV1, DENV2, DENV3 and DENV4 [1].
The role of arboviruses in public health has increased globally [2–5]. Around 40% of the
world population is at risk to acquire some arbovirus in Asia, the Americas, Africa and the
Eastern Mediterranean [6, 7].
The incidence of dengue increased greatly over the past two decades in Brazil, affecting all
regions except the South. The Brazilian Health Ministry reported that the incidence of dengue
rose from 273.9/100,000 in 2014 to 756.9/100,000 in 2015 [8]. Attempts to reduce the dengue
incidence have not been a simple task for Brazilian’s health managers. Several factors impede
the ability to control the disease: different serotypes of the DENV can circulate simultaneously,
Brazil has the appropriate environmental conditions for vector reproduction [6, 7], and there
is fast and disordered growth of the population in urban centers, impacting other problems
such as poor sanitation and inadequate garbage collection [7]. This influences the increase of
the incidence of arboviruses, like dengue, Zika and chikungunya, in the Brazilian population.
The present study focused on describing the profile of the space-time evolution of dengue in
Brazil from 2001 to 2012 and analyzing the relationship of the notified cases with socio-demo-
graphic and environmental factors.
Methods
This is an ecological study using public access data collected from government websites: Infor-
matics Department of Brazilian Unified Health System (DATASUS), Brazilian Institute of
Geography and Statistics (IBGE) and Information System of Compulsory Notification of Dis-
eases (SINAN) [9–13]. Municipalities were the analytic units used in the preparation of the-
matic maps. In Brazil, there are 27 states incorporating 5,570 municipalities.
We used the geo-referenced mesh of Brazilian municipalities (shapefile file), available on
the IBGE website [14], and collected notification data of dengue cases according to the diag-
nostic year for each municipality from the SINAN website. We determined the municipal pop-
ulation for each year according to the census data and inter-census projections of IBGE.
To compute the spatial statistics, we formulated a binary spatial weight matrix (ω), in which
two counties are neighbors if they share a common physical boundary. The Queen matrix,
used in the present study, also considers two neighboring regions that share a common border
by analyzing the vertices. We calculated Global Moran Index and the rate of dengue per
100,000 inhabitants for the 2001–2006 and 2007–2012 periods using the Global Empirical
Bayesian technique.
Temporal and Spatial Evolution of Dengue Incidence in Brazil, 2001-2012
PLOS ONE | DOI:10.1371/journal.pone.0165945 November 10, 2016 2 / 12

We defined the climatic distribution according to Koppen-Geiger classification (Af, Aw,
Am, BSh, Cfb, Cfa, Cwa and Cwb) [11, 15, 16] (Table 1), and the municipalities sharing borders
with others countries according to the neighbor country (border with Uruguay, Argentina, Par-
aguay, Bolivia, Guyana, Surinam, French Guiana, Venezuela, Colombia and Peru). We col-
lected information about the percentage of garbage collection by cleaning service, the rate of
households with a sewage network per 1,000 dwellings, the percentage of the population living
in rural areas, the demographic density (measured by the number of inhabitants per square
kilometer), the Gross Domestic Product (GDP) per capita/1,000 dollar, and the Gini Index per
capita household income from the DATASUS website [17]. We calculated the incidence of den-
gue per 100,000 inhabitants using the notified records and its respective population.
For each municipality, we assessed the Gini index to evaluate the degree of inequality
between individuals according to per capita household income. This index ranges from zero to
one, where zero indicates the absence of inequality and one indicates complete inequality.
Information about garbage collection, sewage network and Gini Index was only available
for the years 2000 and 2010.
Statistical analysis
We used chi-square tests to evaluate the association between dengue incidence and the follow-
ing factors: climate, diagnostic period, demographic density and percentage of people living in
rural areas.
We used Quasi Poisson regression models to evaluate the association between dengue
occurrence and the following factors: GDP, Gini index, garbage collection and sewage net-
works. We calculated both crude and adjusted relative risks (RR) using a different model for
each factor. To get adjusted estimates, we added the covariate “percentage of the population
living in rural areas” in the model. Excluding information on the relationship between GDP
Table 1. Division of Brazilian climate characteristics using Koppen-Geiger classification.
Group Climate Characteristics Prevailing area
Tropical Am High total rainfall North
Short dry season
Af Humid climate North
No dry season
Aw Rainy season in the summer Midwest
Dry winter Northeast
Arid (hot) BSh Dry climate Northeast
High temperatures
Strong sunlight
Little and irregular rainfall
Torrential flooding
Subtropical (temperate) Cfa Hot summer South
No dry season Southeast
Cfb Mild summer South
No dry season Southeast
Cwa Hot summer Southeast
Dry winter Midwest
Cwb Mild summer Southeast
Dry winter
doi:10.1371/journal.pone.0165945.t001
Temporal and Spatial Evolution of Dengue Incidence in Brazil, 2001-2012
PLOS ONE | DOI:10.1371/journal.pone.0165945 November 10, 2016 3 / 12
and dengue, in which information was available for the entire period (2001–2012), we only
used data from 2010 of the 5,570 Brazilian municipalities to perform the other analyses.
We fitted three multilevel Poisson regression models to explain the risk of dengue (response
variable) from 2001 to 2012. The first model included the diagnostic period in the first level
and climate, demographic density, GDP, municipality and state in the second level. The second
model included climate in the first level, and diagnostic period, demographic density, GDP,
municipality and state in the second level. The third model included demographic density in
the first level and diagnostic period, climate, GNP, municipality and state in the second level.
Poisson regression is frequently used to model count data, but it is often inadequate for
over-dispersion situations [18]. Therefore, we applied the multilevel Poisson regression [19]
and the quasi-Poisson regression to circumvent over-dispersion in the study context and to
permit the inclusion of contextual effects in the model specification.
We used tables and maps to present the results. All analyses were performed using ArcGis
(version 10.4) and R-Project (version 3.2.4) software.
Results
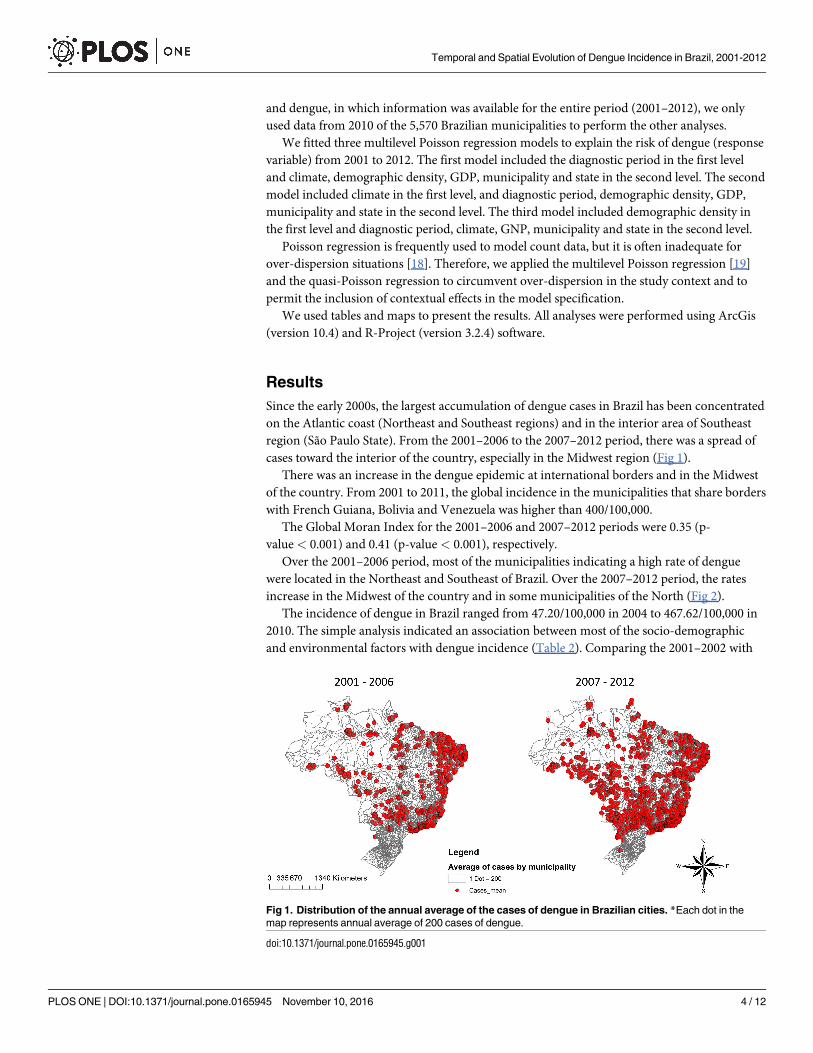
Since the early 2000s, the largest accumulation of dengue cases in Brazil has been concentrated
on the Atlantic coast (Northeast and Southeast regions) and in the interior area of Southeast
region (São Paulo State). From the 2001–2006 to the 2007–2012 period, there was a spread of
cases toward the interior of the country, especially in the Midwest region (Fig 1).
There was an increase in the dengue epidemic at international borders and in the Midwest
of the country. From 2001 to 2011, the global incidence in the municipalities that share borders
with French Guiana, Bolivia and Venezuela was higher than 400/100,000.
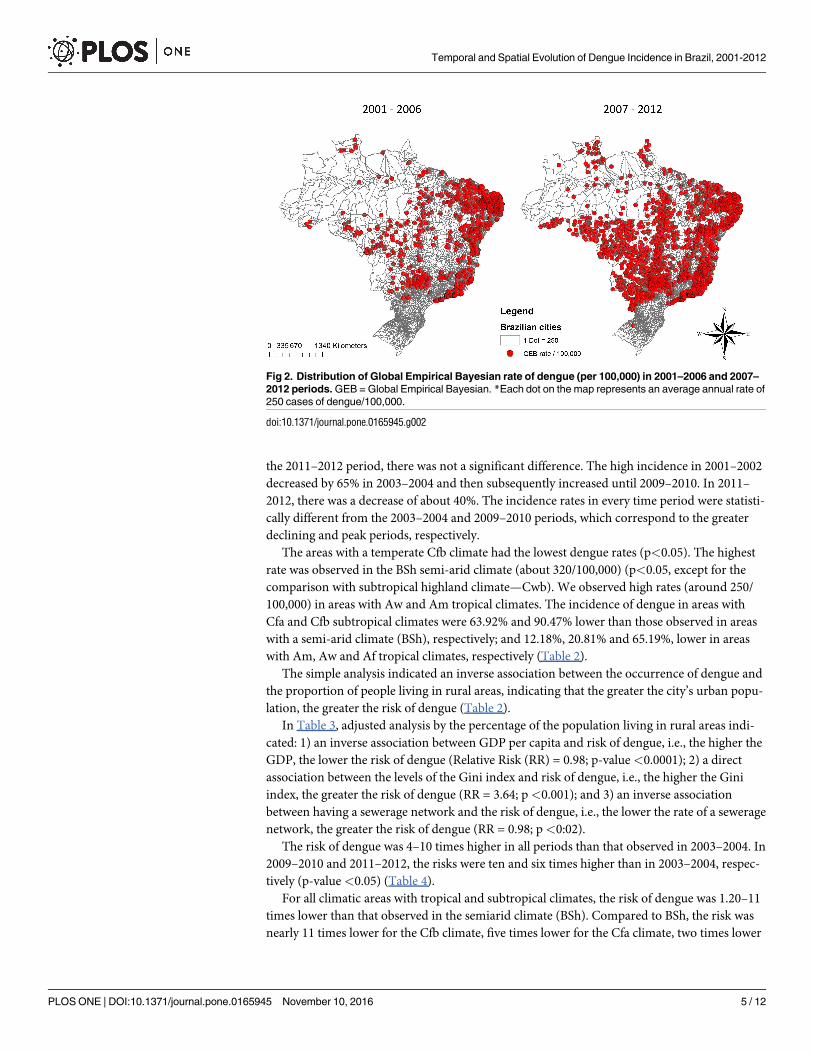
The Global Moran Index for the 2001–2006 and 2007–2012 periods were 0.35 (p-
value < 0.001) and 0.41 (p-value < 0.001), respectively.
Over the 2001–2006 period, most of the municipalities indicating a high rate of dengue
were located in the Northeast and Southeast of Brazil. Over the 2007–2012 period, the rates
increase in the Midwest of the country and in some municipalities of the North (Fig 2).
The incidence of dengue in Brazil ranged from 47.20/100,000 in 2004 to 467.62/100,000 in
2010. The simple analysis indicated an association between most of the socio-demographic
and environmental factors with dengue incidence (Table 2). Comparing the 2001–2002 with
Fig 1. Distribution of the annual average of the cases of dengue in Brazilian cities. *Each dot in the
map represents annual average of 200 cases of dengue.
doi:10.1371/journal.pone.0165945.g001
Temporal and Spatial Evolution of Dengue Incidence in Brazil, 2001-2012
PLOS ONE | DOI:10.1371/journal.pone.0165945 November 10, 2016 4 / 12
the 2011–2012 period, there was not a significant difference. The high incidence in 2001–2002
decreased by 65% in 2003–2004 and then subsequently increased until 2009–2010. In 2011–
2012, there was a decrease of about 40%. The incidence rates in every time period were statisti-
cally different from the 2003–2004 and 2009–2010 periods, which correspond to the greater
declining and peak periods, respectively.
The areas with a temperate Cfb climate had the lowest dengue rates (p<0.05). The highest
rate was observed in the BSh semi-arid climate (about 320/100,000) (p<0.05, except for the
comparison with subtropical highland climate—Cwb). We observed high rates (around 250/
100,000) in areas with Aw and Am tropical climates. The incidence of dengue in areas with
Cfa and Cfb subtropical climates were 63.92% and 90.47% lower than those observed in areas
with a semi-arid climate (BSh), respectively; and 12.18%, 20.81% and 65.19%, lower in areas
with Am, Aw and Af tropical climates, respectively (Table 2).
The simple analysis indicated an inverse association between the occurrence of dengue and
the proportion of people living in rural areas, indicating that the greater the city’s urban popu-
lation, the greater the risk of dengue (Table 2).
In Table 3, adjusted analysis by the percentage of the population living in rural areas indi-
cated: 1) an inverse association between GDP per capita and risk of dengue, i.e., the higher the
GDP, the lower the risk of dengue (Relative Risk (RR) = 0.98; p-value<0.0001); 2) a direct
association between the levels of the Gini index and risk of dengue, i.e., the higher the Gini
index, the greater the risk of dengue (RR = 3.64; p<0.001); and 3) an inverse association
between having a sewerage network and the risk of dengue, i.e., the lower the rate of a sewerage
network, the greater the risk of dengue (RR = 0.98; p<0:02).
The risk of dengue was 4–10 times higher in all periods than that observed in 2003–2004. In
2009–2010 and 2011–2012, the risks were ten and six times higher than in 2003–2004, respec-
tively (p-value <0.05) (Table 4).
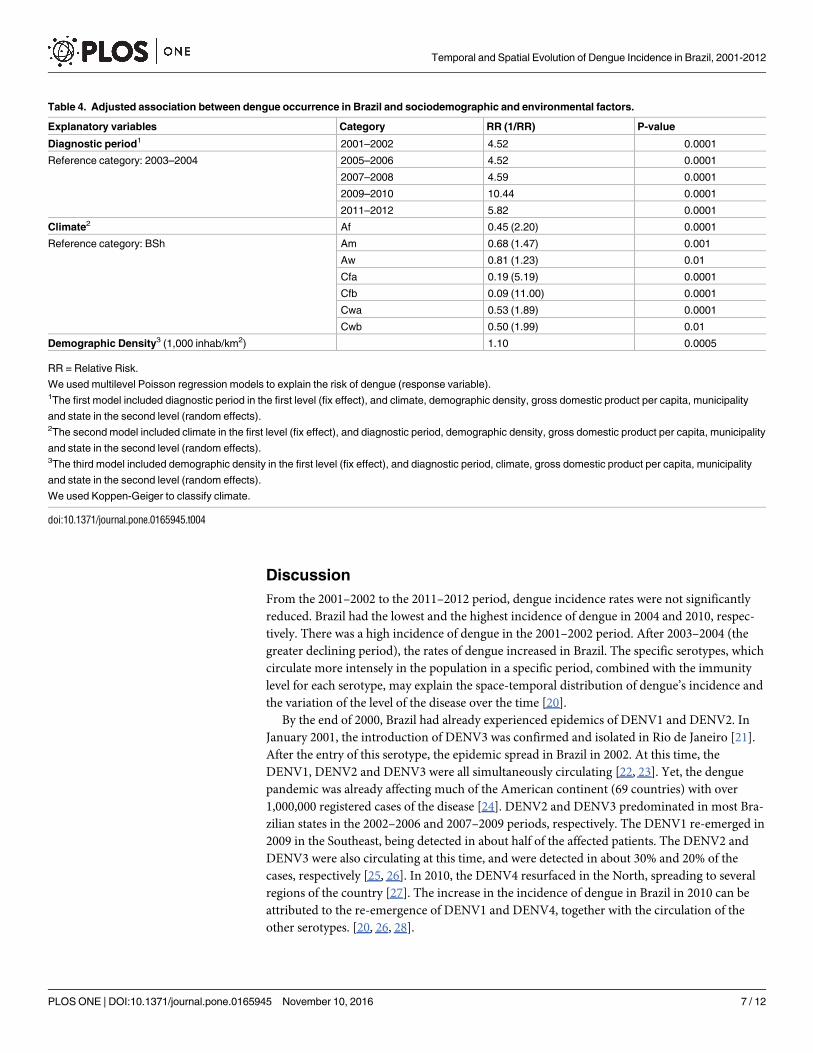
For all climatic areas with tropical and subtropical climates, the risk of dengue was 1.20–11
times lower than that observed in the semiarid climate (BSh). Compared to BSh, the risk was
nearly 11 times lower for the Cfb climate, five times lower for the Cfa climate, two times lower
Fig 2. Distribution of Global Empirical Bayesian rate of dengue (per 100,000) in 2001–2006 and 2007–
2012 periods. GEB = Global Empirical Bayesian. *Each dot on the map represents an average annual rate of
250 cases of dengue/100,000.
doi:10.1371/journal.pone.0165945.g002
Temporal and Spatial Evolution of Dengue Incidence in Brazil, 2001-2012
PLOS ONE | DOI:10.1371/journal.pone.0165945 November 10, 2016 5 / 12
for Af, Cwa and Cwb climates, and less than 50% lower for Am and Aw climates (p-value
<0.05) (Table 4).
There was a direct association between the risk of dengue and population density, indicat-
ing that the higher the population density, the greater the risk of dengue. Data indicated a 10%
increase in dengue risk for each increase of 1,000 inhabitants/km2 in the city (p-value < 0.05)
(Table 4).
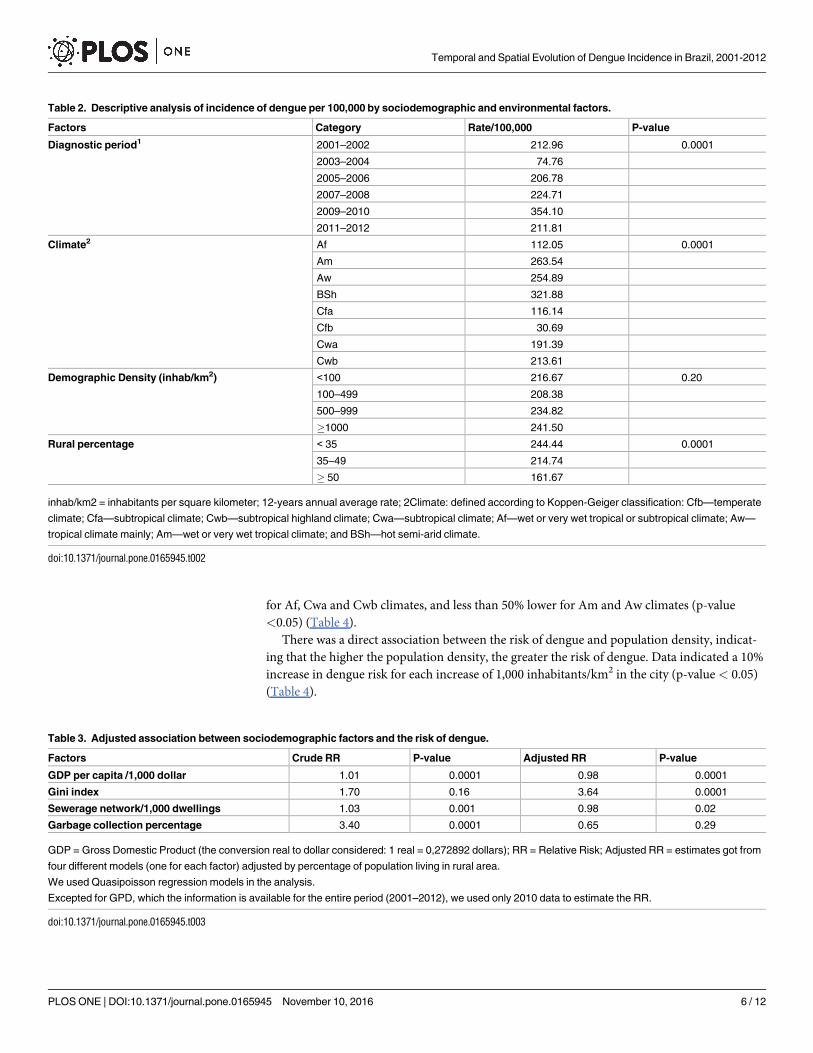
Table 2. Descriptive analysis of incidence of dengue per 100,000 by sociodemographic and environmental factors.
Factors Category Rate/100,000 P-value
Diagnostic period1 2001–2002 212.96 0.0001
2003–2004 74.76
2005–2006 206.78
2007–2008 224.71
2009–2010 354.10
2011–2012 211.81
Climate2 Af 112.05 0.0001
Am 263.54
Aw 254.89
BSh 321.88
Cfa 116.14
Cfb 30.69
Cwa 191.39
Cwb 213.61
Demographic Density (inhab/km2) <100 216.67 0.20
100–499 208.38
500–999 234.82
�1000 241.50
Rural percentage < 35 244.44 0.0001
35–49 214.74
� 50 161.67
inhab/km2 = inhabitants per square kilometer; 12-years annual average rate; 2Climate: defined according to Koppen-Geiger classification: Cfb—temperate
climate; Cfa—subtropical climate; Cwb—subtropical highland climate; Cwa—subtropical climate; Af—wet or very wet tropical or subtropical climate; Aw—
tropical climate mainly; Am—wet or very wet tropical climate; and BSh—hot semi-arid climate.
doi:10.1371/journal.pone.0165945.t002
Table 3. Adjusted association between sociodemographic factors and the risk of dengue.
Factors Crude RR P-value Adjusted RR P-value
GDP per capita /1,000 dollar 1.01 0.0001 0.98 0.0001
Gini index 1.70 0.16 3.64 0.0001
Sewerage network/1,000 dwellings 1.03 0.001 0.98 0.02
Garbage collection percentage 3.40 0.0001 0.65 0.29
GDP = Gross Domestic Product (the conversion real to dollar considered: 1 real = 0,272892 dollars); RR = Relative Risk; Adjusted RR = estimates got from
four different models (one for each factor) adjusted by percentage of population living in rural area.
We used Quasipoisson regression models in the analysis.
Excepted for GPD, which the information is available for the entire period (2001–2012), we used only 2010 data to estimate the RR.
doi:10.1371/journal.pone.0165945.t003
Temporal and Spatial Evolution of Dengue Incidence in Brazil, 2001-2012
PLOS ONE | DOI:10.1371/journal.pone.0165945 November 10, 2016 6 / 12
Discussion
From the 2001–2002 to the 2011–2012 period, dengue incidence rates were not significantly
reduced. Brazil had the lowest and the highest incidence of dengue in 2004 and 2010, respec-
tively. There was a high incidence of dengue in the 2001–2002 period. After 2003–2004 (the
greater declining period), the rates of dengue increased in Brazil. The specific serotypes, which
circulate more intensely in the population in a specific period, combined with the immunity
level for each serotype, may explain the space-temporal distribution of dengue’s incidence and
the variation of the level of the disease over the time [20].
By the end of 2000, Brazil had already experienced epidemics of DENV1 and DENV2. In
January 2001, the introduction of DENV3 was confirmed and isolated in Rio de Janeiro [21].
After the entry of this serotype, the epidemic spread in Brazil in 2002. At this time, the
DENV1, DENV2 and DENV3 were all simultaneously circulating [22, 23]. Yet, the dengue
pandemic was already affecting much of the American continent (69 countries) with over
1,000,000 registered cases of the disease [24]. DENV2 and DENV3 predominated in most Bra-
zilian states in the 2002–2006 and 2007–2009 periods, respectively. The DENV1 re-emerged in
2009 in the Southeast, being detected in about half of the affected patients. The DENV2 and
DENV3 were also circulating at this time, and were detected in about 30% and 20% of the
cases, respectively [25, 26]. In 2010, the DENV4 resurfaced in the North, spreading to several
regions of the country [27]. The increase in the incidence of dengue in Brazil in 2010 can be
attributed to the re-emergence of DENV1 and DENV4, together with the circulation of the
other serotypes. [20, 26, 28].
Table 4. Adjusted association between dengue occurrence in Brazil and sociodemographic and environmental factors.
Explanatory variables Category RR (1/RR) P-value
Diagnostic period1 2001–2002 4.52 0.0001
Reference category: 2003–2004 2005–2006 4.52 0.0001
2007–2008 4.59 0.0001
2009–2010 10.44 0.0001
2011–2012 5.82 0.0001
Climate2 Af 0.45 (2.20) 0.0001
Reference category: BSh Am 0.68 (1.47) 0.001
Aw 0.81 (1.23) 0.01
Cfa 0.19 (5.19) 0.0001
Cfb 0.09 (11.00) 0.0001
Cwa 0.53 (1.89) 0.0001
Cwb 0.50 (1.99) 0.01
Demographic Density3 (1,000 inhab/km2) 1.10 0.0005
RR = Relative Risk.
We used multilevel Poisson regression models to explain the risk of dengue (response variable).1The first model included diagnostic period in the first level (fix effect), and climate, demographic density, gross domestic product per capita, municipality
and state in the second level (random effects).2The second model included climate in the first level (fix effect), and diagnostic period, demographic density, gross domestic product per capita, municipality
and state in the second level (random effects).3The third model included demographic density in the first level (fix effect), and diagnostic period, climate, gross domestic product per capita, municipality
and state in the second level (random effects).
We used Koppen-Geiger to classify climate.
doi:10.1371/journal.pone.0165945.t004
Temporal and Spatial Evolution of Dengue Incidence in Brazil, 2001-2012
PLOS ONE | DOI:10.1371/journal.pone.0165945 November 10, 2016 7 / 12
Since dengue vectors usually live near people, they are common in urban centers of Brazil.
Previous research has indicated that the major risk areas for dengue are: urban areas, areas
with high population density, areas with informal settlements and in places where sanitation
conditions are not satisfactory. In those areas, the female mosquito finds conditions in which
it can feed and reproduce [29, 30]. Further, the Brazilian coast is densely populated since the
major Brazilian urban centers are located on the coast or near it (e.g., São Paulo, Rio de Janeiro
and Salvador). Problems like high population density, informal settlements and poor sanita-
tion conditions are common in these areas, especially in slums, which are very frequent in
urban centers. According to the 2010 Brazilian Census, 77.1% of the homes located in informal
settlements are found in municipalities with more than 2,000,000 inhabitants (e.g. 19% in São
Paulo and 15% in Rio de Janeiro). There is a lack of essential public services, like garbage col-
lection and a water/sewage network in these houses [31].
The role of the transmission of the disease across international borders is reported in scien-
tific literature [32]. Our findings detected a high incidence of dengue in the municipalities’
neighbors of French Guiana, Bolivia and Venezuela. The dengue vector is found from Uruguay
to the southern United States, and outbreaks of dengue have been recorded in countries such
as Venezuela, Cuba and Paraguay. Some research indicates the possibility that dengue was
introduced to Brazil in the 1980s from the northern countries of South America [24].
The present study detected high dengue rates in Northeastern and Northern municipalities.
Before the 2000s, the vast majority of reported dengue cases were from Northeastern and
Southeastern municipalities [33]. In 2002, the rates increased significantly not only in the
Southeast and Northeast, but also in the Midwest [34]. By 2006, there was an increase in den-
gue cases in the Southeast and Midwest [34]. The following year, states from the Southeast and
Midwest had the highest number of reported cases [34]. In 2009, the dengue cases decreased in
almost all Brazilian regions [35].
According to the Ministry of Health, 80% of cases were concentrated in the Southeast and
Northeast in 2012, while the remaining 20% were mainly concentrated in the Midwestern and
Northern regions. Compared to 2011, the number of cases in the country in 2012 decreased
more than 40% [36].
The space-time fluctuations in the number of cases in the different regions are related not
only to the serotypes and susceptible populations, but also to the great mobility between the
populations from these states and unplanned urban expansion, which results in problems such
as poor sanitation and inadequate garbage collection [34].
Environmental factors are predictors of dengue’s incidence. We observed that in areas with
milder temperatures, the incidence of dengue was smaller. It is known that the drop in temper-
ature to levels below 20˚C impacts mosquito development and reproduction and consequently
causes a reduction in the number of cases of dengue [37, 38]. The areas with lower dengue
incidence in Brazil were those with a subtropical climate, located in the Southern region, and
those with a tropical climate, located mainly in the west of the Amazon and in the narrow
coastal strip stretching from the Southeast to the Northeast of the country [16].
Our findings indicate that there were higher dengue rates in areas with semiarid climates,
which is predominant in the Northeast. Regions with a tropical climate that have a dry winter
and a humid or sub-humid tropical climate had a high incidence as well (greater than 200/
100,000). Tropical climates (Aw and Am) occupy the greatest part of Brazilian territory. The
Aw climate is mainly found in the Northeast and the Midwest, while the Am climate is princi-
pally located in the north of the country [16]. According to literature, the Aedes aegypti mos-
quito (the main vector of dengue) grows faster in warmer areas, explaining the high dengue
rates in the semiarid region [39]. Moreover, the rise in temperatures over the years due to cli-
mate change and the growing urban population may have affected the growth and spread of
Temporal and Spatial Evolution of Dengue Incidence in Brazil, 2001-2012
PLOS ONE | DOI:10.1371/journal.pone.0165945 November 10, 2016 8 / 12
the mosquito population. This explains why the regions whose climate has the highest average
temperatures (BSh, Aw and Am) were the ones that had the highest dengue incidence. Despite
the lack of rainfall and the short time frame of the rainy season in regions with a hot semi-arid
climate, massive flooding occurs when it rains [16]. Even when there are occasional droughts,
characteristic of semi-arid climates, they do not prevent the reproduction of the vector, since
their eggs can resist desiccation up to one year without water [37, 38]. As a result, the high tem-
peratures in these regions, combined with the poor sanitary conditions of the population,
favors the presence of domestic water reservoirs. In general, these reservoirs do not have a
proper seal, thereby providing the ideal environment for vector reproduction [40].
The results of this study indicate that the greater the urbanization and population density of
a city, the greater the risk of dengue. It is known that the transmission of arboviruses is more
frequent in overpopulated areas [41], which likely explains the low incidence of dengue in the
most northern areas. In Brazil, urbanization has taken place in an unplanned and rapid man-
ner, leading to the establishment of informal settlements and socioeconomically segregated
urban environments, which has resulted in the precariousness of the provision of basic services
and inadequate living conditions [34, 42]. The scale of environmental problems, such as
unsanitary conditions and difficulty in managing solid waste, has increased in the Brazilian
metropolitan urban areas, especially in areas of informal settlements. These specific areas
probably contribute the most to the spread of arboviruses in these metropolises [42].
Further, the highest GDP areas are concentrated in the Southern and Southeastern urban
regions. In large urban areas with high population density, there is also great socioeconomic
inequality. Since the first survey of mosquito infestation in Rio de Janeiro at the beginning of
the last century, the direct relationship between the presence of Aedes aegypti and population
density was already described [37].
This study has some limitations. First, information about the Gini Index, garbage collec-
tion, and the sewage network were only available for the years 2000 and 2010. Second, not all
dengue cases are reported by health professionals, especially during major outbreaks. This
occurs because of the high demand and inadequate number of health services and profession-
als. Third, we could not assess the dengue seasonality throughout the year in this study, since
the Brazilian Ministry of Heath does not provide monthly data information about the occur-
rence of the cases for each municipality.
Since the 1980s, there have been records of Aedes aegypti in coastal cities of Brazil, which
have since expanded to the interior of the country over time. The increase in waste production,
such as containers and debris that accumulate rainwater and are discharged in streets, back-
yards and vacant lots, favors the proliferation of mosquitoes. All of this, coupled with the weak-
ness of government’s basic services and protective public health actions, creates a favorable
setting for arbovirus epidemics.
The fight against mosquitoes in the early twentieth century was easier, considering both the
lower production of waste (mostly organic) and population density. Currently, the urban con-
text is different due to the greater number of inhabitants living in urban cities (about 80%
higher than in the early century) and the greater production of non-organic waste [43]. In
addition, there are the socioeconomic, political, cultural, environmental and geographic differ-
ences linked to the urban environment as well as the complexity of urban life [34].
In large Brazilian cities, there are areas of high and low socioeconomic status. In the latter,
the populations live in poor housing with inadequate sanitary conditions and irregular garbage
collection, contributing to the increase of the vectors and the incidence of dengue [44]. In
recent decades, government policies aimed at the prevention of arboviruses have been frag-
mented. In 1990, due to the end of the Superintendence of Public Health Campaigns
(SUCAM) and the decentralization of monitoring actions of vector outbreaks by surveillance
Temporal and Spatial Evolution of Dengue Incidence in Brazil, 2001-2012
PLOS ONE | DOI:10.1371/journal.pone.0165945 November 10, 2016 9 / 12
officers, there was a partial break in the continuity of actions [45]. When dengue rates began to
increase again, some actions were resumed, though only occasionally, to combat outbreaks or
during the peak months of the epidemic. Another important factor was the failure of the
implementation of the sanitary network (water and sewage) throughout the country. In 2007,
the intended expansion of the sewage system by the Growth Acceleration Program (PAC) in
order to meet the Millennium Development Goals did not happen as scheduled [46].
Conclusion
Dengue is a common infection in the Brazilian population, with the largest accumulation of
dengue cases concentrated on the Atlantic coast and in the interior area of São Paulo State.
The high dengue rates observed in the Brazilian coastal region suggest that the cases imported
from neighboring countries contribute to the spread of the disease into the country. Our
results suggest that several socio-demographic and environmental factors resulted in the
increase of dengue in the country over the time. This is likely applicable to the occurrence of
others arbovirosis, such as Zika and chikungunya. To reverse this situation, Brazil must imple-
ment effective public policies that offer basic services such as garbage collection and sanitation
networks as well as reduce vector populations.
Author Contributions
Conceptualization: NCPR.
Data curation: NCPR.
Formal analysis: NCPR ICL GHBVF JASR CEGF.
Investigation: NCPR VTSL MKNA GO DLMM.
Methodology: NCPR RPD.
Project administration: NCPR.
Writing – original draft: NCPR AG.
Writing – review & editing: NCPR VTSL RPD MKNA GO DLMM AG GHBVF JASR CEGF
ICL.
References1. Grange L, Simon-Loriere E, Sakuntabhai A, Gresh L, Paul R, Harris E. Epidemiological risk factors
associated with high global frequency of inapparent dengue virus infections. Front Immunol. 2014;
5:280. doi: 10.3389/fimmu.2014.00280 PMID: 24966859; PubMed Central PMCID: PMCPMC4052743.
2. PLOS Neglected Tropical Diseases: Spatial Distribution of the Risk of Dengue and the Entomological
Indicators in Sumare, State of São Paulo, Brazil 2015. Available from: http://journals.plos.org/plosntds/
article?id=10.1371/journal.pntd.0002873.
3. PLOS Neglected Tropical Diseases: Spatio-Temporal Distribution of Dengue and Lymphatic Filariasis
Vectors along an Altitudinal Transect in Central Nepal 2015. Available from: http://journals.plos.org/
plosntds/article?id=10.1371/journal.pntd.0003035.
4. Abrao EP, Fonseca BA. Infection of Mosquito Cells (C6/36) by Dengue-2 Virus Interferes with Subse-
quent Infection by Yellow Fever Virus. Vector Borne Zoonotic Dis. 2016. doi: 10.1089/vbz.2015.1804
PMID: 26808727.
5. Jaenisch T, Junghanss T, Wills B, Brady OJ, Eckerle I, Farlow A, et al. Dengue expansion in Africa-not
recognized or not happening? Emerg Infect Dis. 2014; 20(10). doi: 10.3201/eid2010.140487 PMID:
25271370; PubMed Central PMCID: PMCPMC4193177.
6. WHO WHO. Dengue: guidelines for diagnosis, treatment, prevention and control. Geneva, Switzerland:
2009.
Temporal and Spatial Evolution of Dengue Incidence in Brazil, 2001-2012
PLOS ONE | DOI:10.1371/journal.pone.0165945 November 10, 2016 10 / 12
7. WHO WHO. Global strategy for dengue prevention and control 2012–2020. Geneva, Switzerland:
2012.
8. HM BHM. [Comparison of the probable cases of dengue between 2014 and 2015]. Brasılia, Brazil:
2016.
9. The_World_Bank. Equity and Development. Washington DC: 2006 32204.
10. IPEA. [Economic and Applied Research] 2016 [cited 2016 02162016]. Available from: http://www.ipea.
gov.br/portal/.
11. Sampaio MdS, Alves MdC, Carvalho LG, Sanches L. [Use of Geographic Information System to com-
pare climate classification Koppen-Geiger and Thornthwaite]. Anais XV Simposio Brasileiro de Sensor-
iamento Remoto—SBSR—INPE. 2011:8857.
12. IBGE BIoGaS. [Estimates of Resident Population in Brazil and Federal Units with Reference Date in
July 1st, 2014] Rio de Janeiro/Brazil: IBGE—Brazilian Institute of Geography and Statistics; 2014. Avail-
able from: ftp://ftp.ibge.gov.br/Estimativas_de_Populacao/Estimativas_2014/estimativas_2014_TCU.
pdf.
13. DATASUS. [Health Information] Brazil2015 [cited 2014 02/16/2014]. Ministerio da Saude do Brasil].
Available from: http://www2.datasus.gov.br/DATASUS/index.php.
14. IBGE. IBGE malhas digitais Rio de Janeiro/Brazil2015 [cited 2015 05/28/2015]. Available from: http://
mapas.ibge.gov.br/bases-e-referenciais/bases-cartograficas/malhas-digitais.
15. Rolim GdS, Camargo MBPd, Lania DG, Moraes JFLd. Classificacão climatica de Koppen e de
Thornthwaite e sua aplicabilidade na determinacão de zonas agroclimaticas para o estado de são
Paulo. Bragantia. 2007; 66:711–20.
16. EMBRAPA EBdPA. [Climate] Brasılia, Brazil: Brazilian Ministry of Agriculture; [cited 2016 03/09/2016].
Available from: http://www.cnpf.embrapa.br/pesquisa/efb/clima.htm.
17. RIPSA RIdIpS. Indicadores e Dados Basicos—Brasil—2012 Brasılia, Brasil2012 [cited 2015 26/10/
2015]. Available from: http://tabnet.datasus.gov.br/cgi/idb2012/matriz.htm.
18. Ismail N, Jemain AA. Handling Overdispersion with Negative Binomial and Generalized Poisson
Regression Models. Casualty Actuarial Society Forum [Internet]. Winter 2007 201/29/2016:[103–
58 pp.]. Available from: http://www.casact.org/pubs/forum/07wforum/07w109.pdf.
19. Gelman A, Hill J. Data Analysis Using Regression and Multilevel/Hierarchical Models. New York
(United States of America): Cambridge University Press; 2007.
20. Teixeira MG. Few characteristics of dengue’s fever epidemiology in Brazil. Rev Inst Med Trop Sao
Paulo. 2012; 54 Suppl 18:S1–4. PMID: 23011449.
21. Nogueira RM, Schatzmayr HG, de Filippis AM, dos Santos FB, da Cunha RV, Coelho JO, et al. Dengue
virus type 3, Brazil, 2002. Emerg Infect Dis. 2005; 11(9):1376–81. doi: 10.3201/eid1109.041043 PMID:
16229765; PubMed Central PMCID: PMCPMC3310608.
22. Siqueira JB, Martelli CM, Coelho GE, Simplicio AC, Hatch DL. Dengue and dengue hemorrhagic fever,
Brazil, 1981–2002. Emerg Infect Dis. 2005; 11(1):48–53. doi: 10.3201/eid1101.031091 PMID:
15705322; PubMed Central PMCID: PMCPMC3294356.
23. Rocco IM, Kavakama BB, Santos CL. First isolation of dengue 3 in Brazil from an imported case. Rev
Inst Med Trop Sao Paulo. 2001; 43(1):55–7. PMID: 11246285.
24. Barreto ML, Teixeira MG. Dengue in Brazil: epidemiological situation and contribution to a research
agenda. Estudos Avancados. 2008; 22:53–72.
25. Muhamad M, Kee LY, Rahman NA, Yusof R. Antiviral actions of flavanoid-derived compounds on den-
gue virus type-2. Int J Biol Sci. 2010; 6(3):294–302. PMID: 20567498; PubMed Central PMCID:
PMCPMC2878174.
26. Nogueira RM, Eppinghaus AL. Dengue virus type 4 arrives in the state of Rio de Janeiro: a challenge for
epidemiological surveillance and control. Mem Inst Oswaldo Cruz. 2011; 106(3):255–6. PMID:
21655810.
27. de Souza RP, Rocco IM, Maeda AY, Spenassatto C, Bisordi I, Suzuki A, et al. Dengue virus type 4 phy-
logenetics in Brazil 2011: looking beyond the veil. PLoS Negl Trop Dis. 2011; 5(12):e1439. doi: 10.
1371/journal.pntd.0001439 PMID: 22216365; PubMed Central PMCID: PMCPMC3246447.
28. Bertolacci-Rocha LG, Cunha RV, Lichs GG, Dal Fabbro MM, Motta-Castro AR. Introduction of the den-
gue virus type 4 in the State of Mato Grosso do Sul, Brazil. Cad Saude Publica. 2014; 30(8):1789–92.
PMID: 25210917.
29. Chahad-Ehlers S, Gentile C, Lima JB, Peixoto AA, Bruno RV. Analysis of cycle gene expression in
Aedes aegypti brains by in situ hybridization. PloS one. 2013; 8(1):e52559. doi: 10.1371/journal.pone.
0052559 PMID: 23300979; PubMed Central PMCID: PMCPMC3534671.
Temporal and Spatial Evolution of Dengue Incidence in Brazil, 2001-2012
PLOS ONE | DOI:10.1371/journal.pone.0165945 November 10, 2016 11 / 12

30. Gentile C, Rivas GB, Lima JB, Bruno RV, Peixoto AA. Circadian clock of Aedes aegypti: effects of
blood-feeding, insemination and RNA interference. Mem Inst Oswaldo Cruz. 2013; 108 Suppl 1:80–7.
doi: 10.1590/0074-0276130471 PMID: 24473806; PubMed Central PMCID: PMCPMC4109183.
31. IBGE. [Subnormal Clusters—Territorial Information]. Brasılia, Brazil: 2010.
32. Chowell G, Cazelles B, Broutin H, Munayco CV. The influence of geographic and climate factors on the
timing of dengue epidemics in Peru, 1994–2008. BMC infectious diseases. 2011; 11:164. doi: 10.1186/
1471-2334-11-164 PMID: 21651779; PubMed Central PMCID: PMCPMC3121613.
33. Camara FP, Theophilo RLG, Santos GTd, Pereira SRFG, Camara DCP, Matos RRCd. [Regional and
dynamics characteristics of dengue in Brazil: a retrospective study]. Revista da Sociedade Brasileira de
Medicina Tropical. 2007; 40:192–6. PMID: 17568887
34. Mendonca FdA, Souza AVe, Dutra DdA. [Public health, urbanization and dengue’s fever in Brazil]. Soci-
edade & Natureza. 2009; 21:257–69.
35. HM BHM. Dengue no Brasil Informe epidemiologico 17/2009. Brasılia, Brazil: 2009.
36. HM BHM. [Epidemiological Bulletin—Dengue: epidemiological situation]. Brasılia, Brazil: 2012.
37. FIOCRUZ FOC. [The Aedes aegypti mosquito is part of history and is spreading around the world from
the period of colonization] Rio de Janeiro, Brazil: Fundacão Oswaldo Cruz; 2016 [cited 2016 03/21/
2016]. Available from: http://www.ioc.fiocruz.br/dengue/textos/longatraje.html.
38. Peryassu AG. Os Culicideos do Brasil. São Paulo, Brasil1908.
39. Glasser CM, Gomes AdC. [Climate and the superimposed distribution of Aedes aegypti and Aedes
albopictus on infestation of São Paulo State, Brazil]. Revista de Saude Publica. 2002; 36:166–72.
PMID: 12045797
40. Barcellos C, Monteiro AMV, Corvalan C, Gurgel HC, Carvalho MS, Artaxo P, et al. [Climatic and envi-
ronmental changes and their effect on infectious diseases: scenarios and uncertainties for Brazil]. Epi-
demiologia e Servicos de Saude. 2009; 18:285–304.
41. Ribeiro AF, Marques GR, Voltolini JC, Condino ML. [Association between dengue incidence and cli-
matic factors]. Rev Saude Publica. 2006; 40(4):671–6. PMID: 17063244.
42. Jacobi P. [Urban environmental impacts risk to seeking sustainability]2004:[169–84 pp.].
43. UJVARI SC. [The story and its epidemics: the coexistence of man with microorganisms]. Revista do
Instituto de Medicina Tropical de São Paulo. 2003; 45:212-.
44. Vlahov D, Freudenberg N, Proietti F, Ompad D, Quinn A, Nandi V, et al. Urban as a determinant of
health. J Urban Health. 2007; 84(3 Suppl):i16–26. doi: 10.1007/s11524-007-9169-3 PMID: 17356903;
PubMed Central PMCID: PMCPMC1891649.
45. FUNASA BHM. [Historical Public Health Chronology] Brasılia, Brazil2011 [cited 04/08/2016]. Available
from: http://www.funasa.gov.br/site/museu-da-funasa/cronologia-historica-da-saude-publica/.
46. MP BPM. PAC Brasılia, DF2016 [cited 2016 04/08/2016]. Available from: http://www.pac.gov.br/.
Temporal and Spatial Evolution of Dengue Incidence in Brazil, 2001-2012
PLOS ONE | DOI:10.1371/journal.pone.0165945 November 10, 2016 12 / 12


![Geographic Differences in Temporal Incidence Trends of ... · Geographic Differences in Temporal Incidence Trends of ... [PYO]), 371 HCV incident ... leading to the loss of data on](https://img.pdfslide.net/doc/110x75/5b08e8eb7f8b9a520e8d616f/geographic-differences-in-temporal-incidence-trends-of-differences-in-temporal.jpg)