Embed Size (px)
Citation preview

Temporal and spatial patterns of NDVI and their relationship toprecipitation in the Loess Plateau of China
TIANMING WANG†, XIAOJUN KOU†, YOUCAI XIONG†, PU MOU†,
JIANGUO WU‡ and JIANPING GE*†
†State Key Laboratory of Earth Surface Processes and Resource Ecology, & MOE Key
Laboratory for Biodiversity Science and Engineering, Beijing Normal University, Beijing,
100875, PR China
‡School of Life Sciences & Global Institute of Sustainability, Arizona State University,
Tempe, AZ 85287-4501, USA
(Received 27 March 2008; in final form 17 November 2008)
The relationship between vegetation and precipitation has been studied exten-
sively, but little is known about its mechanistic linkage to agro-ecosystem sustain-
ability. In this study, we used 250 m MODIS NDVI 16-day composite data and
precipitation data for the period 2001–2005 to evaluate the connection between
vegetation and precipitation in the Jinghe River watershed of the central Loess
Plateau, China. A principal component analysis (PCA) was employed to determine
the primary feature of vegetation cover. The results indicated that the first two
principal components (PC1 and PC2) explained around 89% of total NDVI
variances. The spatial distribution of PC1 followed an increasing trend from
northwest to southeast, a similar dynamics to the spatial pattern of NDVI,
which was determined by the variation of mean annual precipitation in the
Jinghe River watershed. Furthermore, PC2 was associated with the spring/summer
modes of the annual cycle while their intra-annual variations were largely modified
by the regular phonological cycle of the winter wheat–summer fallow cropping
practices, a dominant farming practice in severely degraded regions of the Loess
Plateau.Winter wheat–summer fallow practice was a dominant factor affecting the
precipitation–vegetation relationship. A sharp decrease in vegetation cover after
wheat harvesting during the rainy seasons from July to September may be a major
cause of extensive soil erosion in this region. Our findings provide new insight into
the relationship between vegetation and precipitation which is critical in the
restoration of degraded ecosystems and developing appropriate crop rotation
systems to achieve a certain amount of agricultural sustainability.
1. Introduction
Driven primarily by inter- and intra-annual climate variability and by human-induced
modification of the landscape, land use/cover principally determine the structure,
functioning, and dynamics of most ecosystems (Wu and Hobbs 2002). For centuries,
the Loess Plateau has been exposed to anthropogenic disturbance, particularly
through agricultural practices, deforestation and overgrazing, and as a result the
original vegetation here has been mostly attenuated (Jing and Chen 1983, Ren 2000,
*Corresponding author. Email: [email protected]
International Journal of Remote SensingISSN 0143-1161 print/ISSN 1366-5901 online # 2010 Taylor & Francis
http://www.tandf.co.uk/journalsDOI: 10.1080/01431160902929263
International Journal of Remote Sensing
Vol. 31, No. 7, 10 April 2010, 1943–1958
Downloaded By: [Wang, Tianming] At: 08:52 29 April 2010

Ren and Beug 2002,Wang et al. 2006). In recent decades, anthropogenic modification
of land cover due to continuous population growth and intensified land use has
increased erosion and land degradation (Meng 1996, Wang et al. 2006, Wei et al.
2006, Zheng 2006). Most natural vegetation in this area has been converted into
various farming systems and agricultural land patterns (Hardiman et al. 1990,Shangguan et al. 1999), resulting in less-effective ground cover for soil conservation
and increasingly fragile systems to resisting perturbations (Suo et al. 2007).
In the last decade, a considerable amount of study has focused on the integrated
analysis of natural (climatic, tectonic, or both) and anthropogenic disturbances
(e.g. agriculture) on the landscape in determining soil sustainability to prevent erosion
and suggesting sustainable land use in the Loess Plateau in China (Jing and Chen
1983, Meng 1996, Chen et al. 2003, Hessel et al. 2003, Stolte et al. 2005, Zhou et al.
2006, Wei et al. 2007). Rainfall regimes and farming practices have frequently beenidentified as the mechanisms responsible for triggering soil erosion in the Loess
Plateau (Xu 2005, Zheng 2006, Zhou et al. 2006, Wei et al. 2007). However, the
spatial and temporal patterns of precipitation and the corresponding patterns of
vegetation, as well as their relationship to soil erosion, particularly on a watershed
scale, are much less studied. The latter has seriously hindered the efforts of ecological
restoration in the Loess Plateau. Therefore, it is crucial to evaluate annual and inter-
annual variability of land cover and its interaction with climate towards sustainable
land use planning.Satellite imagery has become a potential goldmine for ecologists with which to
assess ecological responses to environmental changes (Pettorelli et al. 2005). Recent
advances in remote sensing theories and technologies have lent opportunities to
quantify seasonal and inter-annual dynamics of vegetation. In particular, the
Normalized Difference Vegetation Index (NDVI), an index derived from the red/
near-infrared reflectance ratio, has been recognized as a reliable indicator for land
cover conditions and variation, especially in arid and semi-arid regions. There are
numerous ways developed to apply this index for different ecological purposes (Kerrand Ostrovsky 2003, Turner et al. 2003, Pettorelli et al. 2005). NDVI has become an
important tool in coupling vegetation with climate on broad spatial and temporal
scales (Salinas-Zavala et al. 2002, Philippon et al. 2007). Useful insights have also
been gained on the relationship between NDVI and climate variability by analysing
temporal and spatial patterns of NDVI and climate at local and regional scales in
North America (Wang et al. 2001, 2003, Ji and Peters 2003), Africa (Nicholson et al.
1990, Vanacker et al. 2005, Mennis 2006), China (Chen and Pan 2002, Li et al. 2002,
Zhang et al. 2003, Piao et al. 2004, 2006), and at a global scale (Kawabata et al. 2001,Zhang et al. 2004, Suzuki et al. 2006). Most of these studies generally indicated strong
spatial or temporal relationships between climate and NDVI at seasonal and inter-
annual time scales for a given period. NDVI and vegetation patterns exhibited large
inter-annual variability over the Loess Plateau. Results from several studies have
demonstrated that NDVI correlated with annual precipitation fluctuations in differ-
ent areas of the Loess Plateau (Sun et al. 2001, Yang et al. 2002, Liu and Xiao 2006,
Xin et al. 2007). However, little is known about the difference in the seasonal cycle of
NDVI and precipitation for various vegetation types, in particular for areas with highagricultural use.
In this article, we report the results of possible correlations between local precipita-
tion regimes and phonological changes of various vegetation types. The main objec-
tives of the research are: (1) to explore the temporal and spatial patterns of NDVI
1944 T. Wang et al.
Downloaded By: [Wang, Tianming] At: 08:52 29 April 2010

variability for various vegetation types; (2) to examine its relationship to the precipi-
tation cycles; and (3) to evaluate the congruence of NDVI temporal patterns of
different vegetation types and the corresponding precipitation cycles as indicators
of local water erosion potential. We carried out the analyses by combining the long-
term remote sensing data, precipitation data, and the knowledge of crop cultivation.The current study is limited to the Jinghe River watershed of the Loess Plateau. We
seek to determine the degree and nature of the precipitation–NDVI relationship: that
is, the correlation and timing of NDVI responses to precipitation. A better under-
standing of the precipitation–vegetation relationship provides important insights into
the restoration of degraded ecosystems and appropriate land use.
2. Study area
The study was performed in the Jinghe River watershed located in the middle part of
the Loess Plateau (34� 240–37�200 N and 106�200–108� 480 E). It covers an area of
45 421 km2 (figure 1). Due to the combined effect of natural causes (rain erosion) and
human activity (agricultural practices), the Jinghe River watershed is a typical region
of the Loess Plateau. Geomorphologically, it is composed of fragmental hills and
gullies with gully densities ranging between 1.0 and 4.0 km km–2 (Meng 1996). Soil
erosion is one of the most predominant ecological problems. The erosion region is
33 220 km2, accounting for 73.1% of the watershed. The annual soil erosion ratereaches 5845 t km–2 yr-1. This region has a pronounced southeast-northwest
Figure 1. Land cover of the Jinghe River watershed in the middle Loess Plateau.
The Loess Plateau vegetation–precipitation study 1945
Downloaded By: [Wang, Tianming] At: 08:52 29 April 2010

precipitation gradient that ranges from approximately 300 mm in the northwest to
800 mm in the southeast (precipitation values reflect annual averages from 2001 to
2005) (figure 2). During recent decades, temperature has shown an overall warming
trend, whereas precipitation has oscillated without showing systematic changes. The
region has a very high population density of about 121 persons km–2 based on the year2000 census. In order to produce enough food, a large amount of sloping land was
turned into farmland, resulting in a rapid degrading of the land. The main crops
cultivated are winter wheat, corn, millet, soybean and potato.
3. Materials and methods
3.1 MODIS NDVI data
The MODIS NDVI 16-day composite data used in this research were downloaded
from the NASA Earth Observing System Data Gateway for the period 2001–2005.
The study area was covered by 2 MODIS tiles (h26v5 and h27v5). The two tiles were
mosaicked into a single contiguous tile, re-projected from a sinusoidal to an Albers
Conical Equal Area projection, using a nearest-neighbour re-sampling operator, andentered into a 250 �250 m grid cell by running MODIS Reprojection Tool (MRT)
Figure 2. Mean annual precipitation (MAP) recorded in Jinghe River watershed from the5-year mean (2001–2005) for the 34 stations.
1946 T. Wang et al.
Downloaded By: [Wang, Tianming] At: 08:52 29 April 2010

from the website (http://edcdaac.usgs.gov/main.asp). The 23 16-day composite
MODIS NDVI data for each year were subset to the study boundary and stacked
into one image by running batch scripts in ERDAS Imagine 8.7. The data stack was
filtered to eliminate anomalous values from the original NDVI data stack following
Lunetta et al. (2006) and Knight et al. (2006). Time-series NDVI data were extractedand analysed based on land use map and field sites of specific land cover types across
the Jinghe River watershed. Annual integrated NDVI (iNDVI) values are computed
as 12-month averages. To determine the spatiotemporal patterns of
precipitation–NDVI relationships the mean 16-day NDVI and iNDVI over the
whole study period were also created.
3.2 Land-use data
We utilized the land-use data from the National Land Cover Dataset (NLCD)
provided by the Chinese Academy of Sciences (figure 1). The land-use data wereconstructed from Landsat 7 ETMþ images acquired in 2000 for China. The NLCD
set was used in previous characterizations of China land cover (Boles et al. 2004, Liu
et al. 2005). The land-use data were recorded in vector format with a 30 m original
resolution. The data were converted into a raster format and subset to the study
boundary at a 250 m resolution to facilitate comparisons with results from the
MODIS data. Land cover in the region mainly comprises cropland (55.76%), grass-
land (30.64%), forest (11.34%) and shrubland (2.15%). Agriculture is a major land-
scape component in this region.
3.3 Precipitation data
Climate data were collected from a total of 34 weather stations provided by the China
Meteorological Data Sharing Service System (CMDSS) (http://cdc.cma.gov.cn/). The
precipitation time series used in the analysis are based on daily and monthly land
observations spanning the period from 2001 to 2005. The daily precipitation data was
aggregated to a 16-day temporal resolution to match the MODIS NDVI 16-day
composite periods from 2001 to 2005. To investigate the relationship between pre-
cipitation andNDVI, we generated precise precipitation grids to take into account theclimatic spatial differences caused by topographic and geographic factors. For this
purpose the 16-day average precipitation was calculated for the 2001–2005 period.
The gridded mean precipitation values were then constructed by interpolating 16-day
precipitation data as a function of latitude, longitude and elevation using thin plate
smoothing spline method implemented in the ANUSPLIN package (Hutchinson
1995). The resulting precipitation grid has a spatial resolution of 250 m and was
developed using a Digital Elevation Model (DEM), obtained from the Shuttle Radar
Topography Mission (SRTM). The DEM, which has a fine-pixel resolution of 90 m,was aggregated into 250 m resolution. Similar methods have been extensively applied
to other areas in the world (e.g. Hijmans et al. 2005). In general, the interpolation
done in this study should be adequate. Monthly precipitation grids show a high
quality and root mean square error (RMSE) is less than 12 mm.
3.4 Statistical analyses
Principal component analysis (PCA) has proven to be particularly effective when
applied to both short and long time-series image data to identify surface change, and
The Loess Plateau vegetation–precipitation study 1947
Downloaded By: [Wang, Tianming] At: 08:52 29 April 2010

has been widely used in change-detection analysis (Eastman and Fulk 1993, Hirosawa
et al. 1996, Gurgel and Ferreira 2003, Hall-Beyer 2003, Cakir et al. 2006, Lasponara
2006). PCA of the NDVI time series provides an alternative to the NDVI index for
tracking vegetation response to climate variability and human activity
(e.g. agriculture practice, such as cropping system, failed harvest and irrigation, andso on; Gurgel and Ferreira 2003). PCAdecreases the number of correlated variables in
one given data set, while at the same time preserving its total variance. This applica-
tion makes it possible to identify patterns of change and physical processes imbedded
in the observed variables, revealing possible relationships with biological, physical, or
socio-economic factors to investigate the underlying mechanisms (Gurgel and
Ferreira 2003, Chamaille-Jammes et al. 2006). In this study precipitation records
and knowledge about farming practices were used. PCA may be performed using
either standardized or non-standardized data. Standardized PCA effectively forces alloriginal input images to be of same weight in the derivation of the new component
images. In this study, the changes in the magnitude, as well as the timing, of the NDVI
are important information since the NDVI can be correlated with biomass on the
ground. For instance, in a sequence of images of central southern region of the
watershed, the few images containing the relatively rapid NDVI decrease due to
winter wheat harvest in July will have their importance in the PCA. Standardizing
the input images will remarkably weaken the magnitude of these periods of change by
forcing the input images to be of equal importance. For these reasons, non-standardized PCA is considered for time series NDVI analysis. The non-standardized
PCA in this study was undertaken on a set of 115 images of NDVI for the years
2001–2005. The principal components were computed from the covariance matrix of
the time sequential NDVI images by using ENVI 4.3 software. The relationship
between seasonal variation of NDVI or PCA loadings and precipitation are assessed
by computing correlation coefficients between these variables. The spatial correlation
between 16-day average precipitation and corresponding NDVI for each grid point
was computed by running the spatial modeller in ERDAS Imagine 8.7.
4. Results
4.1 Determinants of the interpretable components of the PCA
PCA results are interpreted by examining the percentage of total variance explained,
the spatial pattern of component values, and the correlation (eigenvector or loadings)
between a component image and an original image. The percentage of variance
explained by each component can be seen in the scree plot (figure 3). It displays a
turning point in component 3, suggesting that subsequent components explain pro-
gressively less variance. Components 1 and 2 explain 89.25% of the total seasonal
variability of NDVI, which generally have physical significance and will be discussed
in subsequent analysis. Later components represent information variance for a smallarea (e.g. relatively short-term meteorological effects) or essentially noise and, in this
case, should not be interpreted. As is common in PCA, the interpretation of higher-
order components becomes increasingly more difficult.
4.2 Spatial pattern of NDVI–precipitation changes
Results obtained from the application of PCA to NDVI temporal series are shown in
figures 4, 5(a), and (b). The first principal component (PC1) represents 82.16% of the
1948 T. Wang et al.
Downloaded By: [Wang, Tianming] At: 08:52 29 April 2010

total variance and describes the weighted mean pattern of 115 images of seasonal
NDVI for the years 2001–2005. The eigenvector of PC1 is predominantly composed
of positive weights across all dates (figure 4). In general, the annual variation of the
eigenvector value for PC1 displays a typical bell-shape curve. However, the eigenvec-
tor varies with season. Therefore, it can be concluded that the effect of NDVI on thepersistent annual pattern in late spring and the entire summer is stronger than that of
early spring and the entire winter. The loadings of PC1 are highly correlated to
corresponding precipitation calculated for the period 2001–2005 (r ¼ 0.591, P ¼0.0000). Precipitation can be therefore viewed as an important driver of NDVI
changes during the course of the season.
As expected, PC1 characterizes a comprehensive spatial distribution of accumu-
lated NDVI over the 5-year study period, which is coincident with the vegetation
distribution of the area (figure 5(a)). The high PC1 values tend to be distributedaround the low half of the watershed which is covered with high forest vegetation and
few farming fields. Relatively high values are found in the central southern area of the
watershed, where much land has been converted to agricultural land. The low value is
generally distributed on dry grasslands of the northern watershed.
Figure 3. Proportion of total NDVI variance explained by the different components.
–0.20
–0.10
0.00
0.10
0.20
Eig
enve
ctor
wei
ght
0
20
40
60
80
100
120
140
Rai
nfal
l (m
m)
1st PC 2nd PC
2001 2002 2003 2004 2005Date
Figure 4. Time series of eigenvectors over Jinghe River watershed for component 1 and 2 of aprincipal component analysis (PCA) performed on the 16-day composite MODIS NDVI forthe period 2001–2005.
The Loess Plateau vegetation–precipitation study 1949
Downloaded By: [Wang, Tianming] At: 08:52 29 April 2010

PC1 is highly correlated with mean iNDVI, which is a proxy of mean vegetation
productivity (r ¼ 0.991, P , 0.001) (figure 5(a), (c)). The iNDVI gradually increases
along a gradient fromnorthwest to southeast in thewatershed.Noticeably, it appears to
be spatially coupled with the mean annual precipitation pattern (see figures 2 and 5(c)).
This result is supported by the statistical analysis which showed there exists a significant
Figure 5. (a)–(c) Spatial patterns of principal component values and mean annual integratedNDVI (iNDVI) derived from 16-day compositeMODISNDVI data for 2001–2005 periods. (a)First principal component image (PC1). (b) Second principal image (PC2). (c)Mean iNDVI. (d)Correlation coefficients (R) between seasonal variations of NDVI and precipitation in theJinghe River watershed (2001–2005).
1950 T. Wang et al.
Downloaded By: [Wang, Tianming] At: 08:52 29 April 2010

correlation between mean iNDVI and mean annual precipitation (r ¼ 0.808, P ,0.00001) (figure 6(a)). The iNDVI values remain generally below 0.3 when the pre-
cipitation is less than 500mm.As the precipitation surpasses 500mm, the iNDVI values
increase rapidly, but scattered points are mostly spotted above the linear trend line.
4.3 Seasonal NDVI anomalies
The second principal component (PC2) accounts for 7.09% of total data set variance.
It provides temporal information on local phenology and shows a clear spatialdistribution. The periodicity of the second eigenvector is consistent for every year,
showing a clear difference between spring (positive value) and summer (negative
value) (figure 4). Specifically, the greenness peak occurs generally in April and the
green-up trend happens during the October–December period. Moreover, the load-
ings of PC2 are found to be negatively correlated with monthly precipitation (r ¼–0.507, P ¼ 0.0000).
Figure 5(b) shows the component 2 image. The value of pixel in the component 2
image indicates the correlation of annual NDVI and loadings. If inter- or intra-annualchanges of one pixel NDVI show a synchronous correlation with its corresponding
loading of one component image, the pixel is defined as a positive anomaly of that
component. Similarly, a strong negative correlation represents a negative anomaly. If
one pixel NDVI in 5 years does not change or changes only a little, the value of this
pixel in the component 2 image is zero or around zero. Significant contrast of the
eigenvector value of PC2 is closely related to the seasonal dynamics of vegetation.
Significant positive anomalies can be observed in the central southern region of the
watershed, where the seasonal dynamic of NDVI exhibited similar cycle with theeigenvector of PC2 for the period 2001–2005. This region was strongly modified by
agricultural practices, mostly by cultivation of winter wheat which is characterized by
a nearly three-month summer fallow from wheat harvest at the end of June or early
July to sowing in late September. The analysis of the 16-day NDVI images (data not
shown) showed that vegetation cover density is low for the period from June to
September. The time series of NDVI of winter wheat exhibits low NDVI values
from July to September as a result of the harvest of winter wheat (figure 7).
–1.0
–0.5
0.0
0.5
1.0
1.5
2.0
2.5
–1 –0.5 0 0.5 1R
PC
2
00.10.20.30.40.50.60.70.8(a) (b)
300 400 500 600 700 800MAP (mm)
Mea
n iN
DV
I
Figure 6. (a) Linear relationships between mean annual integrated NDVI (iNDVI) and meanannual precipitation (MAP) in the Jinghe River watershed for 3500 random grid points (Y ¼0.0007X – 0.04, R2 ¼ 0.65). (b) Scatter plot of the second component (PC2), versus correlationcoefficients between NDVI and precipitation (R), for 3500 random grid points in the JingheRiver watershed (Y ¼ –1.16X þ 0.75, R2 ¼ 0.69).
The Loess Plateau vegetation–precipitation study 1951
Downloaded By: [Wang, Tianming] At: 08:52 29 April 2010
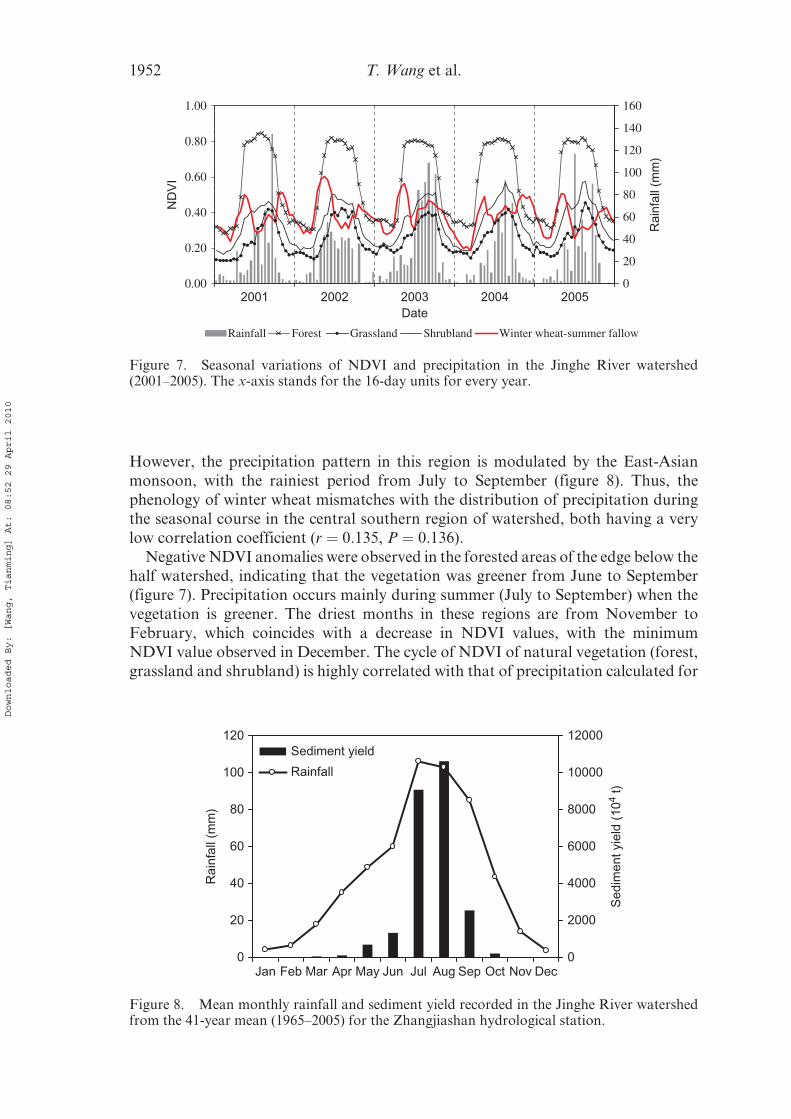
However, the precipitation pattern in this region is modulated by the East-Asian
monsoon, with the rainiest period from July to September (figure 8). Thus, the
phenology of winter wheat mismatches with the distribution of precipitation during
the seasonal course in the central southern region of watershed, both having a very
low correlation coefficient (r ¼ 0.135, P ¼ 0.136).
Negative NDVI anomalies were observed in the forested areas of the edge below thehalf watershed, indicating that the vegetation was greener from June to September
(figure 7). Precipitation occurs mainly during summer (July to September) when the
vegetation is greener. The driest months in these regions are from November to
February, which coincides with a decrease in NDVI values, with the minimum
NDVI value observed in December. The cycle of NDVI of natural vegetation (forest,
grassland and shrubland) is highly correlated with that of precipitation calculated for
0.00
0.20
0.40
0.60
0.80
1.00
ND
VI
0
20
40
60
80
100
120
140
160
Rai
nfal
l (m
m)
Rainfall Forest Grassland Shrubland Winter wheat-summer fallow
2001 2002 2003 2004 2005Date
Figure 7. Seasonal variations of NDVI and precipitation in the Jinghe River watershed(2001–2005). The x-axis stands for the 16-day units for every year.
0
20
40
60
80
100
120
Jan Feb Mar Apr May Jun Jul Aug Sep Oct Nov Dec
Rai
nfal
l (m
m)
0
2000
4000
6000
8000
10000
12000
Sed
imen
t yie
ld (
104
t)
Sediment yield
Rainfall
Figure 8. Mean monthly rainfall and sediment yield recorded in the Jinghe River watershedfrom the 41-year mean (1965–2005) for the Zhangjiashan hydrological station.
1952 T. Wang et al.
Downloaded By: [Wang, Tianming] At: 08:52 29 April 2010

the period 2001–2005 (forest: r¼ 0.637, P¼ 0.0000; shrubland: r¼ 0.685, P¼ 0.0000;
grassland: r ¼ 0.686, P ¼ 0.0000) (figure 7). This suggests that the natural vegetation
reflects the precipitation variability in this area.
To further analyse this result, the correlation coefficient map of seasonal NDVI and
precipitation was also generated (figure 5(d)). The map data suggest that the distribu-tion of coefficients matched well the patterns of PC2. This is confirmed by the plot of
correlation coefficients versus PC2 (r¼ –0.831, P, 0.00001) (figure 6(b)). The winter
wheat area located in the central southern watershed has a low correlation between
NDVI and precipitation (r ¼ 0.07 � 0.19, mean � s.d.), corresponding to a positive
PC2 value, while natural vegetation shows a high correlation (r¼ 0.62� 0.11, mean�s.d.), corresponding to a negative PC2 value (see figure 5(b), (d)).
5. Discussion
In this study, the application of PCA to NDVI time series for 2001–2005 periods
captures the annual variation of vegetation cover, which provides valuable informa-
tion to increase our understanding on how vegetation dynamics respond to climate
and human activities. Our results confirm that precipitation is amajor driving force of
NDVI changes, but it also shows that conventional farming practices alter seasonal
NDVI–precipitation relationships in the Jinghe River watershed.Our spatial results show that PC1 is strongly correlated with mean iNDVI and
perfectly corresponds to the land use in our data set (figure 5(a), (c)). This has also
been observed in other regions of the world (Paruelo and Lauenroth 1995, Gurgel and
Ferreira 2003). As a general spatial pattern, the northwest–southeast-increased gra-
dient of themean iNDVI (or PC1) is strikingly similar to the dynamics ofmean annual
precipitation in the Jinghe watershed. The strong association between mean iNDVI
and mean annual precipitation is well in line with that of other studies in different
biomes (Sala et al. 1988, Paruelo and Lauenroth 1995, Paruelo et al. 1997, Jobbagyet al. 2002, Martiny et al. 2006). This suggests that iNDVI (or PC1) may be repre-
sentative for precipitation effects in the study area and precipitation accounts for the
majority of the variation (i.e. 65.1%) in NDVI. The remaining unexplained portion
(34.9%) could be linked to other ecological characteristics, such as topography, soil
type and farming practices. In this study, topographic data and land use explain such
behaviour. The iNDVI increased in the Ziwuling Mountains and Liupan Mountains,
areas with thin loess coverage dominated by broadleaved deciduous forest, and which
are likely to maintain a higher soil moisture content during most of the year (Zhangand An 1994). The higher iNDVI values than expected by climatic conditions are
recorded in forested lands in this region. This is also a reason why the sudden increase
in mean iNDVI shows greater scatter around the NDVI–rainfall relationship above
500 mm of precipitation (figure 6(a)). This is highlighted by Briggs and Knops (1995)
and Jobbagy el al. (2002), who reported spatial variation in the precipitation-primary
production relationship caused by topography. These results confirmed previous
findings that long-term mean NDVI values can be used as a proxy for mean annual
precipitation over a wide geographical scale (Davenport and Nicholson 1993,Kawabata et al. 2001, Jobbagy et al. 2002). The results obtained from this work
also confirms the study by Tucker et al. (1985) and Lasponara (2006), who found that
PC1 patterns were those expected from ecoregion mapping, which were based on a
long-term stable climate and topography.
The Loess Plateau vegetation–precipitation study 1953
Downloaded By: [Wang, Tianming] At: 08:52 29 April 2010

In this study, the NDVI dynamics of natural vegetation is consistent with the
precipitation events, with a very high correlation. Nevertheless, the cultivation of
the winter wheat broke the coupling relationship between precipitation and NDVI
due to the fallow period parallelling the rainy season, as seen from the analysis of the
NDVI–precipitation relationships and PCA (figures 4 and 5). This is related tophenology and has high ecological importance.
Within this region, over 60% of precipitation is concentrated during the rainiest
period from July and August in the form of rainstorms, which tend to cause heavy
erosion (In and Xie 2005). About 80% of total sediment yield occurs during these
months (figure 8). However, the eigenvectors of PC2 reveals that the vegetation is
greener from April to June, with minimum NDVI values from July to August. The
associated image (PC2) indicated that the central southern region of the watershed
showed a decline in vegetation over the last few years (figure 5(b)), matching the lowor negative correlation areas between NDVI and precipitation. This is mainly because
the cultivation of winter wheat is characterized by a fallow period from July to
September. Vegetation deficiency combined with intense rainfall during the rainy
season makes soil prone to erosion (Huang et al. 2003). In the Loess Plateau, winter
wheat as a monoculture, which is a prevailing cropping practice in this region, causes
the most serious erosion problems. Because it is harvested in early summer, the soil is
plowed just before the rainy season and left unprotected from rainstorms for several
months (Suo et al. 2007). A study by Kang et al. (2001) revealed that the ploughedbare soil of winter wheat fields yielded 60–100% more eroded soil than the vegetated
lands during the June–August period in which intense thunderstorms are concen-
trated. Due to rainfall erosivity and unsustainable land-use practices, many countries
are facing serious soil erosion. Crops are often cultivated with a low cover density
during the erosive summer months due to economics and tradition (Valentin et al.
2005, Vezina et al. 2006, Schillinger et al. 2007). It not only lowers the overall
precipitation-use efficiency because of the large amount of evaporation from the
bare soil surface during the fallow period, but also entails high risk of erosion bysummer rainstorms (Li et al. 2000).
Results from this study have ecological implications in our understanding of the
NDVI–precipitation relationship and its connection to soil erosion vulnerability.
Therefore, it is likely to be used as a guide in developing and adopting more effective
cropping systems and the implementation of new land management policies, particu-
larly in the Loess Plateau where agriculture is a large component of the landscape.
Improving soil and water conservation practices are essential to bring soil erosion
under control and to achieve sustainable agriculture in the Loess Plateau. Theapplication of new land-use shifting actions should be done by considering crop
rotation systems in accordance with the cycle of precipitation events (Huang et al.
2003). In the long term, future research is needed to carry out an integrated analysis
combining rainfall erosivity, soil erodibility, topography, cover, management, and
conservation practices to determine the spatial and temporal dynamics of soil erosion
vulnerability. This would be essential to the understanding of the impact of various
land-use patterns on soil erosion toward sustainable land-use planning.
6. Conclusions
This study focused on the vegetation–precipitation interactions in the central Loess
Plateau of China. PCAwas employed to enhance the change information contained in
1954 T. Wang et al.
Downloaded By: [Wang, Tianming] At: 08:52 29 April 2010

MODISNDVI data for the period 2001–2005. The northwest–southeast spatial trend
of PC1, which highly coincides with that of the average NDVI, is noticeably deter-
mined by the spatial variation of mean annual precipitation in the Jinghe River
watershed. PC2 accounts for the most prominent man-induced vegetation alterations.
These dynamics are closely related to the spring/summer seasonal NDVI cycle,specifically summer fallow cropping of winter wheat. Our results revealed that agri-
culture land-use caused a great long-term change in the NDVI–precipitation relation-
ship. The result may provide environmental scientists with a better understanding of,
and new insight into, vegetation restoration by developing appropriate crop rotation
systems in semi-arid degraded ecosystems. In addition, the application of PCA to
NDVI time series analysis is an effective method for identifying the annual variability
of seasonal landscape factors and can provide valuable information for sustainable
soil conservation planning involving rational use of natural and agriculturalvegetation.
Acknowledgements
This research was jointly supported by the National Natural Science Foundation of
China (40730631) and the Chinese National Key Foundational Research and
Development Plan Program (2002CB111507). We would like to thank two anon-
ymous reviewers for their invaluable suggestions on the manuscript.
References
BOLES, S.H., XIAO, X.M., LIU, J.Y., ZHANG, Q.Y., MUNKHTUYA, S., CHEN, S.Q. and OJIMA, D.,
2004, Land cover characterization of Temperate East Asia using multi-temporal
VEGETATION sensor data. Remote Sensing of Environment, 90, pp. 477–489.
BRIGGS,M.K. andKNOPS, A.K., 1995, Interannual variability in primary production in tallgrass
prairie: climate, soil moisture, topographic position, and fire as determinant of above
ground biomass. American Journal of Botany, 82, pp. 1024–1030.
CAKIR, H.I., KHORRAM, S. and NELSON, S.A.C., 2006, Correspondence analysis for detecting
land cover change. Remote Sensing of Environment, 102, pp. 306–317.
CHAMAILLE-JAMMES, S., FRITZ, H. and MURINDAGOMO, F., 2006, Spatial patterns of the
NDVI–rainfall relationship at the seasonal and interannual time scales in an African
savanna. International Journal of Remote Sensing, 27, pp. 5185–5200.
CHEN, L.D., MESSING, I., ZHANG, S.R., FU, B.J. and LEDIN, S., 2003, Land use evaluation and
scenario analysis towards sustainable planning on the Loess Plateau in China – case
study in a small catchment. Catena, 54, pp. 303–316.
CHEN, X.Q. and PAN, W.F., 2002, Relationships among phenological growing season, time-
integrated normalized difference vegetation index and climate forcing in the temperate
region of eastern China. International Journal of Climatology, 22, pp. 1781–1792.
DAVENPORT, M.L. and NICHOLSON, S.E., 1993, On the relation between rainfall and the
Normalized Difference Vegetation Index for diverse vegetation types in East Africa.
International Journal of Remote Sensing, 14, pp. 2369–2389.
EASTMAN, J.R. and FULK, M., 1993, Long sequence time series evaluation using standardized
principal components. Photogrammetric Engineering and Remote Sensing, 59, pp.
1307–1312.
GURGEL, H.C. and FERREIRA, N.J., 2003, Annual and interannual variability of NDVI in Brazil
and its connections with climate. International Journal of Remote Sensing, 24, pp.
3595–3609.
HALL-BEYER, M., 2003, Comparison of single-year and multiyear NDVI time series principal
components in cold temperate biomes. IEEE Transactions on Geoscience and Remote
Sensing, 41, pp. 2568–2574.
The Loess Plateau vegetation–precipitation study 1955
Downloaded By: [Wang, Tianming] At: 08:52 29 April 2010

HARDIMAN, R.T., LACEY, R. and YANG, M., 1990, Use of cluster analysis for identification and
classification of farming systems in Qingyang County, Central North China.
Agricultural Systems, 33, pp. 115–125.
HESSEL, R., MESSING, I., CHEN, L.D., RITSEMA, C. and STOLTE, J., 2003, Soil erosion simulations
of land use scenarios for a small Loess Plateau catchment. Catena, 54, pp. 289–302.
HIJMANS, R.J., CAMERON, S.E., PARRA, J.L., JONES, P.G. and JARVIS, A., 2005, Very high
resolution interpolated climate surfaces for global land areas. International Journal of
Climatology, 25, pp. 1965–1978.
HIROSAWA, Y., MARSH, S.E. and KLIMAN, D.H., 1996, Application of standardized principal
component analysis to land-cover characterization using multitemporal AVHRR data.
Remote Sensing of Environment, 58, pp. 267–281.
HUANG, M.B., SHAO, M.G., ZHANG, L. and LI, Y.S., 2003, Water use efficiency and sustain-
ability of different long-term crop rotation systems in the Loess Plateau of China. Soil &
Tillage Research, 72, pp. 95–104.
HUTCHINSON, M.F., 1995, Interpolating mean rainfall using thin plate smoothing splines.
International Journal of Geographical Information Science, 9, pp. 385–403.
IN, S.Q. and XIE, Y., 2005, Spatial variations and seasonal distributions of rainfall erosivity on
the Loess Plateau [in Chinese]. Bulletin of Soil and Water Conservation, 25, pp. 29–33.
JI, L. and PETERS, A.J., 2003, Assessing vegetation response to drought in the northernGreat Plains
using vegetation and drought indices. Remote Sensing of Environment, 87, pp. 85–98.
JING, K. and CHEN, Y.Z., 1983, Preliminary studies on the erosion environment background and
soil erosion rates in the Loess Plateau [in Chinese]. Geographical Research, 2, pp. 7–10.
JOBBAGY, E.G., SALA, O.E. and PARUELO, J.M., 2002, Patterns and controls of primary produc-
tion in the Patagonian steppe: a remote sensing approach. Ecology, 83, pp. 307–319.
KANG, S.Z., ZHANG, L., SONG, X.Y., ZHANG, S.H., LIU, X.Z., LIANG, Y.L. and ZHENG, S.Q.,
2001, Runoff and sediment loss responses to rainfall and land use in two agricultural
catchments on the Loess Plateau of China. Hydrological Processes, 15, pp. 977–988.
KAWABATA, A., ICHII, K. and YAMAGUCHI, Y., 2001, Global monitoring of interannual changes
in vegetation activities using NDVI and its relationships to temperature and precipita-
tion. International Journal of Remote Sensing, 22, pp. 1377–1382.
KERR, J.T. and OSTROVSKY, M., 2003, From space to species: ecological applications for remote
sensing. Trends in Ecology & Evolution, 18, pp. 299–305.
KNIGHT, J.F., LUNETTA, R.S., EDIRIWICKREMA, J. and KHORRARN, S., 2006, Regional scale land
cover characterization using MODIS-NDVI 250 m multi-temporal imagery: a
phenology-based approach. Giscience & Remote Sensing, 43, pp. 1–23.
LASPONARA, R., 2006, On the use of principal component analysis (PCA) for evaluating inter-
annual vegetation anomalies from SPOT/VEGETATION NDVI temporal series.
Ecological Modelling, 194, pp. 429–434.
LI, B., TAO, S. and DAWSON, R.W., 2002, Relations between AVHRR NDVI and ecoclimatic
parameters in China. International Journal of Remote Sensing, 23, pp. 989–999.
LI, F.R., ZHAO, S.L. and GEBALLE, G.T., 2000, Water use patterns and agronomic performance
for some cropping systems with and without fallow crops in a semi-arid environment of
northwest China. Agriculture Ecosystems & Environment, 79, pp. 129–142.
LIU, L.L. and XIAO, F.J., 2006, Spatial–temporal correlations of NDVI with precipitation and
temperature in Yellow River Basin [in Chinese]. Chinese Journal of Ecology, 25, pp.
477–481.
LIU, J.Y., TIAN, H., LIU, M., ZHUANG, D., MELILLO, J.M. and ZHANG, Z., 2005, China’s
changing landscape during the 1990s: large-scale land transformations estimated with
satellite data. Geophysical Research Letters, 32, L02405, doi:02410.01029/
02004GL021649.
LUNETTA, R.S., KNIGHT, J.F., EDIRIWICKREMA, J., LYON, J.G. and WORTHY, L.D., 2006. Land-
cover change detection using multi-temporal MODIS NDVI data. Remote Sensing of
Environment, 105, pp. 142–154.
1956 T. Wang et al.
Downloaded By: [Wang, Tianming] At: 08:52 29 April 2010

MARTINY, N., CAMBERLIN, P., RICHARD, Y. and PHILIPPON, N., 2006, Compared regimes of
NDVI and rainfall in semi-arid regions of Africa. International Journal of Remote
Sensing, 27, pp. 5201–5223.
MENG, Q.M., 1996,Water and Soil Conservation in the Loess Plateau (Zhengzhou: YellowRiver
Conservancy Press).
MENNIS, J., 2006, Exploring the influence of ENSO on African vegetation variability using
multidimensional map algebra. Giscience & Remote Sensing, 43, pp. 352–376.
NICHOLSON, S.E., DAVENPORT, M.L. and MALO, A.R., 1990, A comparison of the vegetation
response to rainfall in the Sahel and East Africa using normalized difference vegetation
index from AVHRR. Climate Change, 17, pp. 209–241.
PARUELO, J.M., EPSTEIN, H.E., LAUENROTH, W.K. and BURKE, I.C., 1997, ANPP estimates from
NDVI for the Central Grassland Region of theUnited States.Ecology, 78, pp. 953–958.
PARUELO, J.M. and LAUENROTH, W.K., 1995, Regional patterns of normalized difference vegeta-
tion index in north American shrublands and grasslands. Ecology, 76, pp. 1888–1898.
PETTORELLI, N., VIK, J.O., MYSTERUD, A., GAILLARD, J.M., TUCKER, C.J. and STENSETH, N.C.,
2005, Using the satellite-derived NDVI to assess ecological responses to environmental
change. Trends in Ecology & Evolution, 20, pp. 503–510.
PHILIPPON, N., JARLAN, L., MARTINY, N., CAMBERLIN, P. and MOUGIN, E., 2007,
Characterization of the interannual and intraseasonal variability of West African
vegetation between 1982 and 2002 by means of NOAA AVHRR NDVI data. Journal
of Climate, 20, pp. 1202–1218.
PIAO, S., MOHAMMAT, A., FANG, J.Y., CAI, Q. and FENG, J.M., 2006, NDVI-based increase in
growth of temperate grasslands and its responses to climate changes in China. Global
Environmental Change-Human and Policy Dimensions, 16, pp. 340–348.
PIAO, S.L., FANG, J.Y., JI, W., GUO, Q.H., KE, J.H. and TAO, S., 2004, Variation in a satellite-
based vegetation index in relation to climate in China. Journal of Vegetation Science, 15,
pp. 219–226.
REN, G.Y., 2000, Decline of the mid- to late Holocene forests in China: climatic change or
human impact? Journal of Quaternary Science, 15, pp. 273–281.
REN, G.Y. and BEUG, H.J., 2002, Mapping Holocene pollen data and vegetation of China.
Quaternary Science Reviews, 21, pp. 1395–1422.
SALA, O.E., PARTON,W.J., JOYCE, L.A. and LAUENROTH,W.K., 1988, Primary production of the
central grassland region of the United States. Ecology, 69, pp. 40–45.
SALINAS-ZAVALA, C.A., DOUGLAS, A.V. and DIAZ, H.F., 2002, Interannual variability of NDVI
in northwest Mexico. Associated climatic mechanisms and ecological implications.
Remote Sensing of Environment, 82, pp. 417–430.
SCHILLINGER, W.F., KENNEDY, A.C. and YOUNG, D.L., 2007, Eight years of annual no-till
cropping in Washington’s winter wheat–summer fallow region. Agriculture
Ecosystems & Environment, 120, pp. 345–358.
SHANGGUAN, Z.P., PENG, K.S., LIN, P. andWANG, L.C., 1999,Research on Grain Production and
Sustainable Development of Loess Plateau (Xi’an: Shaanxi People Press).
STOLTE, J., RITSEMA, C. and BOUMA, J., 2005, Developing interactive land use scenarios on the
Loess Plateau in China, presenting risk analyses and economic impacts. Agriculture
Ecosystems & Environment, 105, pp. 387–399.
SUN, R., LIU, C.M. and ZHU,Q.J., 2001, Relationship between the fractional vegetation cover change
and rainfall in theYellowRiver basin [in Chinese].ActaGeographica Sinica, 56, pp. 667–672.
SUO, A.N., XIONG, Y., XIONG, Y.C. andGE, J.P., 2007, Redundancy and deficiency of vegetation in
a typical region of the Loess Plateau [in Chinese]. Acta Ecologica Sinica, 27, pp. 889–996.
SUZUKI, R., XU, J.Q. and MOTOYA, K., 2006, Global analyses of satellite-derived vegetation
index related to climatological wetness and warmth. International Journal of
Climatology, 26, pp. 425–438.
TUCKER, C.J., TOWNSHEND, J.R.G. andGOFF, T.E., 1985, African land-cover classification using
satellite data. Science, 227, pp. 369–375.
The Loess Plateau vegetation–precipitation study 1957
Downloaded By: [Wang, Tianming] At: 08:52 29 April 2010

TURNER, W., SPECTOR, S., GARDINER, N., FLADELAND, M., STERLING, E. and STEININGER, M.,
2003, Remote sensing for biodiversity science and conservation. Trends in Ecology &
Evolution, 18, pp. 306–314.
VALENTIN, C., POESEN, J. and LI, Y., 2005, Gully erosion: impacts, factors and control. Catena,
63, pp. 132–153.
VANACKER, V., LINDERMAN, M., LUPO, F., FLASSE, S. and LAMBIN, E., 2005, Impact of short-
term rainfall fluctuation on interannual land cover change in sub-Saharan Africa.
Global Ecology and Biogeography, 14, pp. 123–135.
VEZINA, K., BONN, F. and VAN, C.P., 2006, Agricultural land-use patterns and soil erosion
vulnerability of watershed units in Vietnam’s northern highlands. Landscape Ecology,
21, pp. 1311–1325.
WANG, J., PRICE, K.P. and RICH, P.M., 2001, Spatial patterns of NDVI in response to pre-
cipitation and temperature in the central Great Plains. International Journal of Remote
Sensing, 22, pp. 3827–3844.
WANG, J., RICH, P.M. and PRICE, K.P., 2003, Temporal responses of NDVI to precipitation and
temperature in the central Great Plains, USA. International Journal of Remote Sensing,
24, pp. 2345–2364.
WANG, L., SHAO, M., WANG, Q.J. and GALE, W.J., 2006, Historical changes in the environment
of the Chinese Loess Plateau. Environmental Science & Policy, 9, pp. 675–684.
WEI, J., ZHOU, J., TIAN, J.L., HE, X.B. and TANG, K.L., 2006, Decoupling soil erosion and
human activities on the Chinese Loess Plateau in the 20th century. Catena, 68, pp.
10–15.
WEI, W., CHEN, L.D., FU, B.J., HUANG, Z.L., WU, D.P. and GUI, L.D., 2007, The effect of land
uses and rainfall regimes on runoff and soil erosion in the semi-arid loess hilly area,
China. Journal of Hydrology, 335, pp. 247–258.
WU, J.G. and HOBBS, R., 2002, Key issues and research priorities in landscape ecology: An
idiosyncratic synthesis. Landscape Ecology, 17, pp. 355–365.
XIN, Z.B., XU, J.X. and ZHENG, W., 2007, Spatiotemporal variations of vegetation cover on the
Chinese Loess Plateau (1981–2006): impacts of climate changes and human activities.
Science in China Series D: Earth Sciences, 51, pp. 67–78.
XU, J.X., 2005, Precipitation–vegetation coupling and its influence on erosion on the Loess
Plateau, China. Catena, 64, pp. 103–116.
YANG, S.T., LIU, C.M. and SUN, R., 2002, The vegetation cover change over last 20 years in the
Yellow river basin [in Chinese]. Acta Geographica Sinica, 57, pp. 679–684.
ZHANG, J.Y., DONG, W.J., FU, C.B. and WU, L.Y., 2003, The influence of vegetation cover on
summer precipitation in China: a statistical analysis of NDVI and climate data.
Advances in Atmospheric Sciences, 20, pp. 1002–1006.
ZHANG, P., ANDERSON, B. and BARLOW, M., 2004, Climate-related vegetation characteristics
derived from Moderate Resolution Imaging Spectroradiometer (MODIS) leaf area
index and normalized difference vegetation index. Journal of Geophysical Research,
109, D20105, doi:20110.21029/22004JD004720.
ZHANG, X.B. and AN, Z.S., 1994, Relationship between forests and loess thicknesses in the
Loess Plateau [in Chinese]. Bulletin of Soil and Water Conservation, 14, pp. 1–4.
ZHENG, F.L., 2006, Effect of vegetation changes on soil erosion on the Loess Plateau.
Pedosphere, 16, pp. 420–427.
ZHOU, Z.C., SHANGGUAN, Z.P. and ZHAO, D., 2006, Modeling vegetation coverage and soil
erosion in the Loess Plateau Area of China. Ecological Modelling, 198, pp. 263–268.
1958 T. Wang et al.
Downloaded By: [Wang, Tianming] At: 08:52 29 April 2010