Embed Size (px)
Citation preview
AQUATIC MICROBIAL ECOLOGYAquat Microb Ecol
Vol. 39: 211–223, 2005 Published June 20
INTRODUCTION
Viruses are the most numerically abundant entitiesin aquatic habitats. Virus concentrations have beenshown to range between 4.8 × 10⁶ and 1.4 × 10⁷ ml–1 inmarine systems (Bergh et al. 1989, Wommack & Col-well 2000, Weinbauer 2004), and numbers are often anorder of magnitude higher in freshwater (Maranger &Bird 1995). Virus abundance is also generally higher inhabitats with higher nutrient status in both freshwater(Bettarel et al. 2003b) and marine systems (Bratbak etal. 1994), possibly as a result of higher bacterial num-bers in these environments. The impact of viruses ontheir host communities is significant, with as much as34% of bacterial production in freshwater estimated tobe lost through viral lysis (Hennes & Simon 1995,Mathias et al. 1995, Bettarel et al. 2003a).
Although many studies have investigated virus–hostinteractions in freshwater habitats (Mathias et al. 1995,Weinbauer & Höfle 1998a, Fischer & Velimirov 2002,Bettarel et al. 2004), none have been carried out overboth spatial and temporal scales in any detail. This isthe first study of a complete freshwater microbial com-munity, including viruses, that extends over an entireannual cycle. We aimed to gain a clearer picture ofvirus community dynamics throughout the water col-umn of Priest Pot, a small hypereutrophic lake in theEnglish Lake District (Cumbria, UK), over a wholeannual cycle. Priest Pot has been extensively studied,and the seasonal changes that occur in the physicaland chemical characteristics of the water column, andthe phyto- and zooplankton communities have beenwell documented (Finlay & Maberly 2000). The watercolumn is mixed and oxygenated in the winter and
© Inter-Research 2005 · www.int-res.com*Corresponding author. Email: [email protected]
Temporal distribution of viruses, bacteria andphytoplankton throughout the water column in a
freshwater hypereutrophic lake
V. J. Goddard1, A. C. Baker1, 2, J. E. Davy1, D. G. Adams2, M. M. De Ville3,S. J. Thackeray3, S. C. Maberly3, W. H. Wilson1, 4,*
1Marine Biological Association of the UK, The Laboratory, Citadel Hill, Plymouth PL1 2PB, UK2Department of Biochemistry and Molecular Biology, University of Leeds, Leeds LS2 9JT, UK
3Centre for Ecology and Hydrology, Lancaster Environment Centre, Library Avenue, Lancaster LA1 4AP, UK4Plymouth Marine Laboratory, Prospect Place, Plymouth PL1 3DH, UK
ABSTRACT: Analytical flow cytometry (AFC) and denaturing gradient gel electrophoresis (DGGE)were used to investigate the diversity and dynamics of viruses, bacteria and phytoplankton commu-nities in a hypereutrophic freshwater lake. Samples were taken from different depths throughout thewater column over an annual cycle. Priest Pot is a small lake in the Lake District in NW England (UK),and has been well characterised in previous studies; however, little is known of the diversity anddynamics of the virus community. Virus abundance was shown to change over both spatial and tem-poral scales, and appeared to be closely linked to other biotic and abiotic parameters. The highestvirus concentrations occurred in the deepest part of the lake at a depth of 3.2 m, in the anoxic layer,at the same time as a peak of abundance of green sulphur bacteria. Sequence analysis of a DGGEband that occurred at the same time suggested a bacterium similar to Chlorobium spp., a greensulphur bacterium, comprised part of this bacterial bloom.
KEY WORDS: Viruses · Microbial community dynamics · Freshwater · Flow cytometry
Resale or republication not permitted without written consent of the publisher
Aquat Microb Ecol 39: 211–223, 2005
early spring. During early summer, the lake stratifiesand high nutrient concentrations support a largemicrobial biomass, which leads to oxygen depletion atdepth. During the autumn, the water cools and thestratification eventually breaks down as oxygenbecomes available at depth. The stratified water col-umn provides a large number of diverse niches inwhich different organisms can proliferate, generatinga dynamic and complex microbial community.Although Priest Pot has been well studied, the role ofviruses within the microbial community has receivedlittle attention.
The different microbial communities were enumer-ated by analytical flow cytometry (AFC), an accurateway of screening large numbers of samples; this tech-nique has been shown to be useful in studies of micro-bial ecology, and has been used to enumerate viruses(Marie et al. 1999, Larsen et al. 2001), bacteria (Gasolet al. 1999) and phytoplankton (Olson et al. 1985,Binder et al. 1996, Crosbie et al. 2003) from a range ofaquatic systems. The diversity of potential bacterialand phytoplankton host populations was determinedby denaturing gradient gel electrophoresis (DGGE)separation of PCR amplified 16S and 18S rDNA,respectively. DGGE has been widely used to monitordiversity and dynamics within aquatic microbial popu-lations, and remains a powerful tool in this field(Casamayor et al. 2002, Ovreas et al. 2003). A previousstudy suggested that the virus community in Priest Potwas closely coupled to both the bacteria and phyto-plankton communities in the surface layer (Goddard etal. unpubl.). In the present study we investigated theeffect of depth, and the steep physical and chemicalgradients that develop during the year in Priest Pot, onthe dynamics of microbial and virus communities.
MATERIALS AND METHODS
Sampling. Samples were taken from Priest Pot every2 wk from March to May 2002, then monthly until April2003. Samples for flow cytometry (2 to 5 ml) weretaken using a pneumatically operated sampler modi-fied from the design of Heaney (1974), so that samplesof up to 180 ml could be collected simultaneously fromeach of 16 depths. All samples were taken from thecentre of the lake. Samples for bacteria and phyto-plankton diversity were taken using an acid and sam-ple rinsed 250 ml glass bottle sealed with a rubberbung attached to a line, and weighted with a brassweight. The bottle was lowered to the appropriatedepth, then the bung was jerked off with a sharp tug;the bottle was returned to the surface when full. Allsamples were processed or fixed immediately onarrival at the laboratory.
Physical and chemical measurements. Nitrate, phos-phate, silicate and oxygen analyses were carried outusing the methods detailed in Mackereth et al. (1978).Algal chlorophyll a and bacterial chlorophylls c and dwere analysed using the method of Caraco & Puccoon(1986).
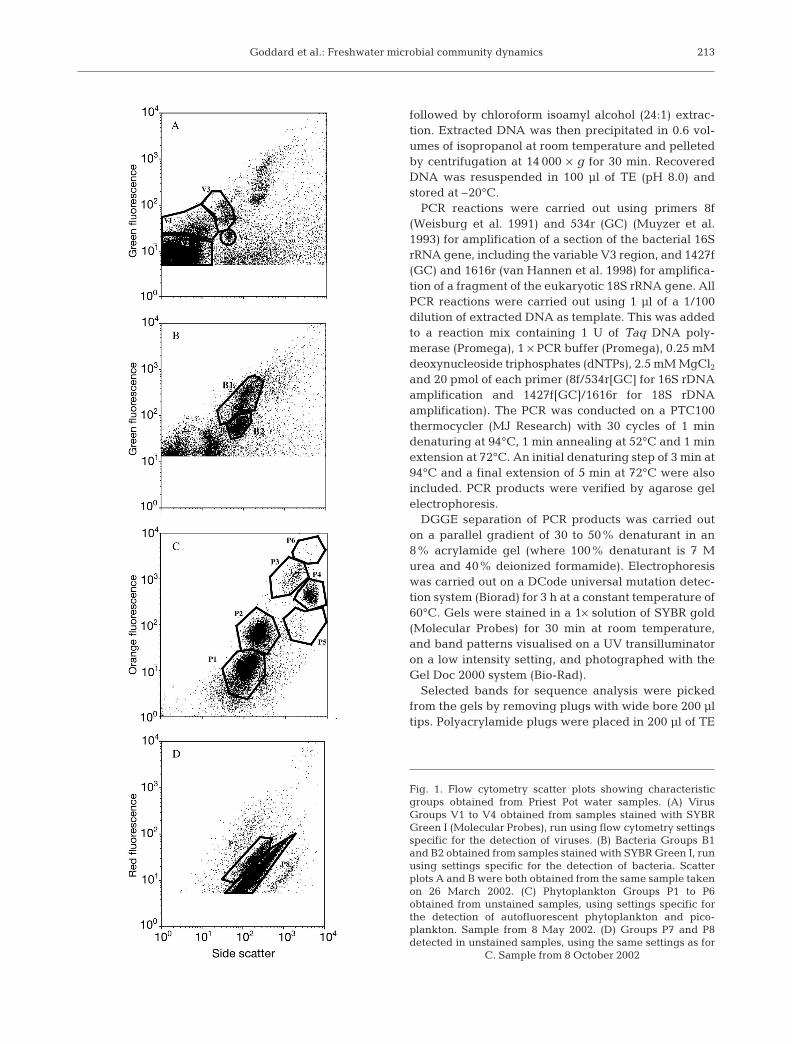
Phytoplankton, bacteria and virus enumeration. Allcounts were carried out on a FACScan flow cytometer(Becton Dickinson), equipped with an air cooled laserproviding 15 mW at 488 nm, with the standard filter set-up. For phytoplankton enumeration, fresh samples(collected from the 26 March 2002 to the 17 December2002) were analysed for 3 min at a flow rate of 90 µlmin–1, using red fluorescence as the trigger. Whenviewing the scatter plots, the majority of the differentgroups were easier to distinguish when plotted on thebasis of orange fluorescence versus side scatter. Sam-ples for virus and bacteria enumeration (collected fromthe 26 March 2002 to the 8 April 2003) were fixed in afinal concentration of 0.5% gluteraldehyde (Sigma, EMgrade) overnight at 4°C, and stored at –80°C for analy-sis at a later date. (Note that recent research by Brus-saard [2004] has shown that this method may haveunderestimated virus numbers.) For virus enumeration,10 µl of fixed sample was diluted in 980 µl TE (Tris-eth-ylenediaminetetraacetic acid; 10 mM Tris, 1 mM EDTA)and incubated at 80°C for 10 min with 10 µl 1/1000 con-centration SYBR Green 1 (Molecular Probes) in thedark. Samples were analysed for 2 min at a flow rate of30 µl min–1 with the discriminator set on green fluores-cence. For bacteria enumeration, 100 µl of fixed samplewas diluted 10-fold in TE, and incubated with 10 µl of1/1000 concentration SYBR Green 1 for 15 min at roomtemperature in the dark, and samples analysed asabove. In each case, distinct virus, bacteria or phyto-plankton groups were identified from scatter plots ofside scatter versus fluorescence using Cellquest soft-ware (Becton Dikinson) (Fig. 1).
Bacteria and phytoplankton diversity. The diversityof bacteria and phytoplankton communities was mea-sured by DGGE of PCR amplified 16S and 18S rDNAfragments, respectively. Prokaryotes and eukaryoteswere harvested from approximately 100 to 200 mlwater onto 47 mm diameter 0.2 µm Durapore filters(Millipore) by vacuum filtration. The filters were cutinto strips and stored at –80°C until processing. DNAextraction was carried out using an adaptation of theCTAB (1% N-cetyl N,N,N-trimethylammonium bro-mide) method (Goddard et al. 2001). Half filters wereincubated in lysis buffer (0.5% sodium dodecyl sul-phate [SDS], 20 µg ml–1 Proteinase K) for 1 h at 55°C.Eighty µl of 5 M NaCl and 150 µl of CTAB buffer (2%[w/v] hexadecyltrimethylammonium bromide [Sigma],1.4 M NaCl, 20 mM EDTA, 100 mM Tris HCl [pH 8.0])were added and incubated for a further 15 min at 65°C,
212
Goddard et al.: Freshwater microbial community dynamics
followed by chloroform isoamyl alcohol (24:1) extrac-tion. Extracted DNA was then precipitated in 0.6 vol-umes of isopropanol at room temperature and pelletedby centrifugation at 14 000 × g for 30 min. RecoveredDNA was resuspended in 100 µl of TE (pH 8.0) andstored at –20°C.
PCR reactions were carried out using primers 8f(Weisburg et al. 1991) and 534r (GC) (Muyzer et al.1993) for amplification of a section of the bacterial 16SrRNA gene, including the variable V3 region, and 1427f(GC) and 1616r (van Hannen et al. 1998) for amplifica-tion of a fragment of the eukaryotic 18S rRNA gene. AllPCR reactions were carried out using 1 µl of a 1/100dilution of extracted DNA as template. This was addedto a reaction mix containing 1 U of Taq DNA poly-merase (Promega), 1 × PCR buffer (Promega), 0.25 mMdeoxynucleoside triphosphates (dNTPs), 2.5 mM MgCl2and 20 pmol of each primer (8f/534r[GC] for 16S rDNAamplification and 1427f[GC]/1616r for 18S rDNAamplification). The PCR was conducted on a PTC100thermocycler (MJ Research) with 30 cycles of 1 mindenaturing at 94°C, 1 min annealing at 52°C and 1 minextension at 72°C. An initial denaturing step of 3 min at94°C and a final extension of 5 min at 72°C were alsoincluded. PCR products were verified by agarose gelelectrophoresis.
DGGE separation of PCR products was carried outon a parallel gradient of 30 to 50% denaturant in an8% acrylamide gel (where 100% denaturant is 7 Murea and 40% deionized formamide). Electrophoresiswas carried out on a DCode universal mutation detec-tion system (Biorad) for 3 h at a constant temperature of60°C. Gels were stained in a 1× solution of SYBR gold(Molecular Probes) for 30 min at room temperature,and band patterns visualised on a UV transilluminatoron a low intensity setting, and photographed with theGel Doc 2000 system (Bio-Rad).
Selected bands for sequence analysis were pickedfrom the gels by removing plugs with wide bore 200 µltips. Polyacrylamide plugs were placed in 200 µl of TE
213
Fig. 1. Flow cytometry scatter plots showing characteristicgroups obtained from Priest Pot water samples. (A) VirusGroups V1 to V4 obtained from samples stained with SYBRGreen I (Molecular Probes), run using flow cytometry settingsspecific for the detection of viruses. (B) Bacteria Groups B1and B2 obtained from samples stained with SYBR Green I, runusing settings specific for the detection of bacteria. Scatterplots A and B were both obtained from the same sample takenon 26 March 2002. (C) Phytoplankton Groups P1 to P6obtained from unstained samples, using settings specific forthe detection of autofluorescent phytoplankton and pico-plankton. Sample from 8 May 2002. (D) Groups P7 and P8detected in unstained samples, using the same settings as for
C. Sample from 8 October 2002
Aquat Microb Ecol 39: 211–223, 2005
and heated to 94°C for 10 min, then cooled to 4°C.Eluted bands were then stored at –20°C prior to ream-plification. For the 16S rDNA bands, 1 µl of eluate wasused as the template for reamplification using the PCRconditions detailed above, with modifications. Reampli-fication was carried out in half volume reactions (25 µl),the annealing temperature was increased to 60°C and25 cycles were carried out instead of 30. For the 18SrDNA bands, 1 µl of 1/100 diluted eluate was used asthe template for reamplification using the modifiedconditions detailed above. Reamplified bands wereverified on agarose and DGGE gels as described above.
Reamplified 16S rDNA and 18S rDNA DGGE bandsfor sequencing were treated with Exo SAP-IT (USB) toremove unused primers and nucleotides, according tothe manufacturer’s instructions. Sequencing reactionswere carried out on a PTC100 thermocycler (MJResearch), using a BigDye Terminator v3.1 cyclesequencing kit (ABI), with 8f and 1616r as the sequenc-ing primers for 16S rDNA and 18S rDNA bands,respectively. Cycle sequencing was carried out follow-ing the manufacturer’s instructions, the only modifica-tion being an increased annealing temperature of 60°Cduring the cycle sequencing reactions. Sequenceswere determined on an ABI 3100 capillary sequencer,and similarity to known sequences determined usingthe BLAST database (www.ncbi.nlm.nih.gov). Thesequences obtained in this study are available inGenBank (see Table 1 for accession numbers).
RESULTS
Spatial and temporal variations in environmentalconditions
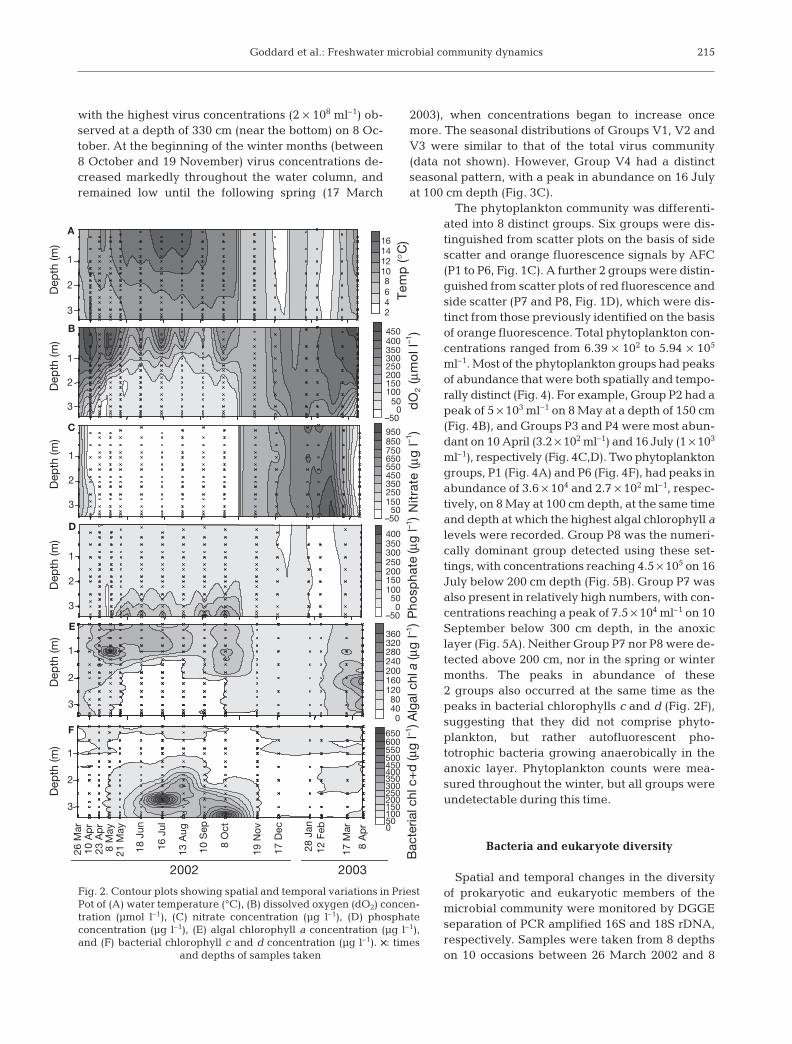
Changes in water temperature, dissolved oxygen, ni-trate, phosphate, algal chlorophyll a and bacterialchlorophyll c and d concentrations were measured at dif-ferent depths throughout the annual cycle from March2002 to March 2003 (Fig. 2). Water temperature rangedbetween 3.7 and 18°C over the annual cycle, with thehighest temperatures recorded in the summer in the sur-face waters. During this time, the difference between thesurface temperature and that in proximity to the sedi-ment was between 2 and 4°C. During the winter, thetemperature was consistent throughout the water col-umn (Fig. 2A). Dissolved oxygen (dO2) ranged from 0 to490 µmol l–1, with the development of an anoxic layer be-low 150 cm occurring between 8 May and 8 October2002 (Fig. 2B). Nitrate was undetectable in Priest Potthroughout the water column between 23 April and 8October, and increased markedly between 8 Octoberand 19 November (Fig. 2C). Nitrate concentrations thenincreased to a peak of 865 µg l–1 on 12 February 2003,
before dropping again, and did not vary greatly withdepth. The majority of phosphate was detected in thedeeper part of the water column (below 200 cm) between21 May and 8 October (Fig. 2D). Concentrations rangedfrom 1.3 to 439 µg l–1. Algal chlorophyll a concentrationsranged from 5.2 to 387.5 µg l–1, with a peak at 100 cm on8 May, and were generally higher in the upper half of thewater column (Fig. 2E). Algal chlorophyll a was notdetected in the anoxic layer, but was present at very lowlevels at all depths from October 2002 to February 2003.Bacterial chlorophylls c and d were detected at highlevels (up to 650 µg l–1 ) during the late summer andautumn months (between 18 June and 8 October) in theanoxic layer below 150 cm, and only low concentrations(<7.5 µg l–1) were detected in other parts of the watercolumn (Fig. 2F).
Abundance and succession of bacteria, viruses andphytoplankton
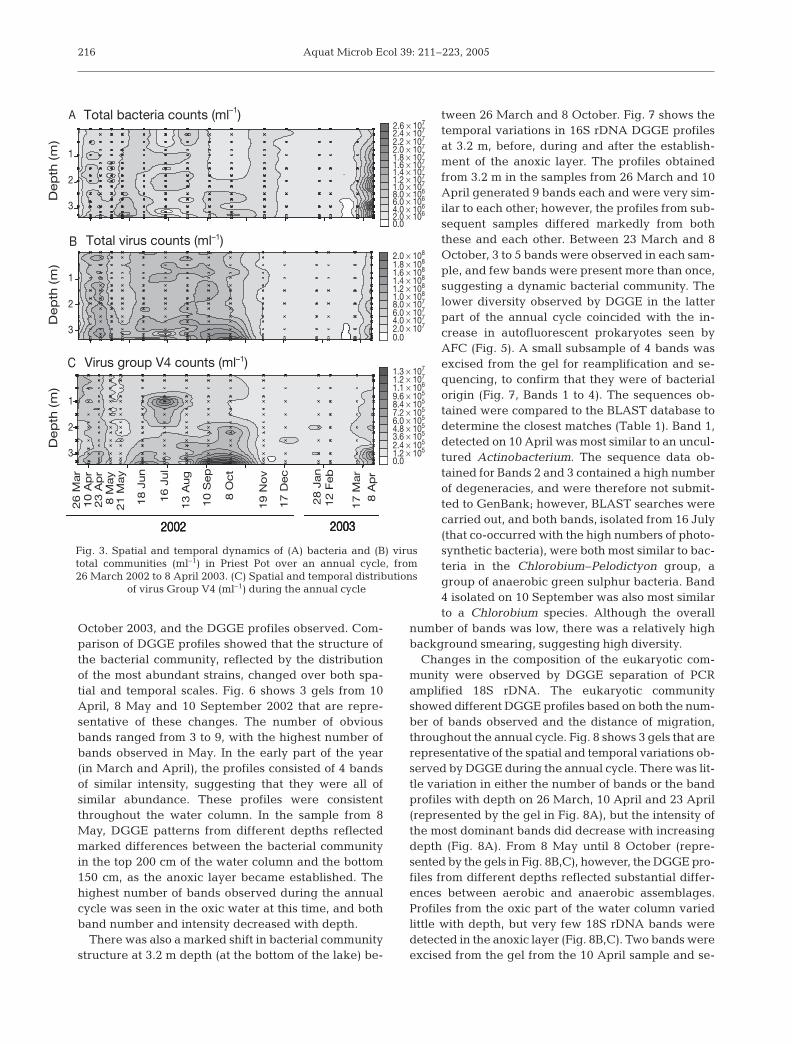
Several different groups of bacteria, viruses andphytoplankton were identified in scatter plots of greenfluorescence versus side scatter for viruses and bacte-ria, and red or orange fluorescence versus side scatterfor phytoplankton (see Fig. 1). Concentrations of bac-teria ranged from 9.46 × 10⁵ to 2.17 × 10⁷ ml–1 (Fig. 3A).Two distinct bacterial groups were observed in theAFC scatter plots (Fig. 1B), thought to represent highand low DNA fluorescence bacteria. Similar bacteriagroups have previously been observed by flow cytom-etry (Gasol et al. 1999). The seasonal distribution of the2 groups was found to be very similar (data not shown),and it was decided to take the 2 bacterial groups as onecommunity. The bacterial abundance reported heretherefore reflects the sum of both bacterial regions.Although patchy, bacterial abundance increased dur-ing the spring months (26 March to 21 May) andremained relatively constant during the summer(18 June to 10 October), although concentrations werelower in the surface waters during September andOctober. Abundance remained consistently low (2 ×10⁶) during the winter months (between 19 Novemberand 17 March). The following spring (17 March to8 April 2003) bacteria concentrations started toincrease again, with little variation over depth.
Total virus concentrations (the sum of all 4 virusgroups determined from AFC scatter plots shown inFig. 1A) ranged from 7.06 × 10⁶ to 2.03 × 10⁸ ml–1
(Fig. 3B). During the spring months (26 March to21 May), temporal variations in virus abundance wereobserved, but concentrations remained relativelyconsistent with depth. In contrast, during the summermonths (18 June to 8 October), higher concentrationsof viruses were observed in the deeper anoxic layers,
214
Goddard et al.: Freshwater microbial community dynamics
with the highest virus concentrations (2 × 10⁸ ml–1) ob-served at a depth of 330 cm (near the bottom) on 8 Oc-tober. At the beginning of the winter months (between8 October and 19 November) virus concentrations de-creased markedly throughout the water column, andremained low until the following spring (17 March
2003), when concentrations began to increase oncemore. The seasonal distributions of Groups V1, V2 andV3 were similar to that of the total virus community(data not shown). However, Group V4 had a distinctseasonal pattern, with a peak in abundance on 16 Julyat 100 cm depth (Fig. 3C).
The phytoplankton community was differenti-ated into 8 distinct groups. Six groups were dis-tinguished from scatter plots on the basis of sidescatter and orange fluorescence signals by AFC(P1 to P6, Fig. 1C). A further 2 groups were distin-guished from scatter plots of red fluorescence andside scatter (P7 and P8, Fig. 1D), which were dis-tinct from those previously identified on the basisof orange fluorescence. Total phytoplankton con-centrations ranged from 6.39 × 10² to 5.94 × 10⁵
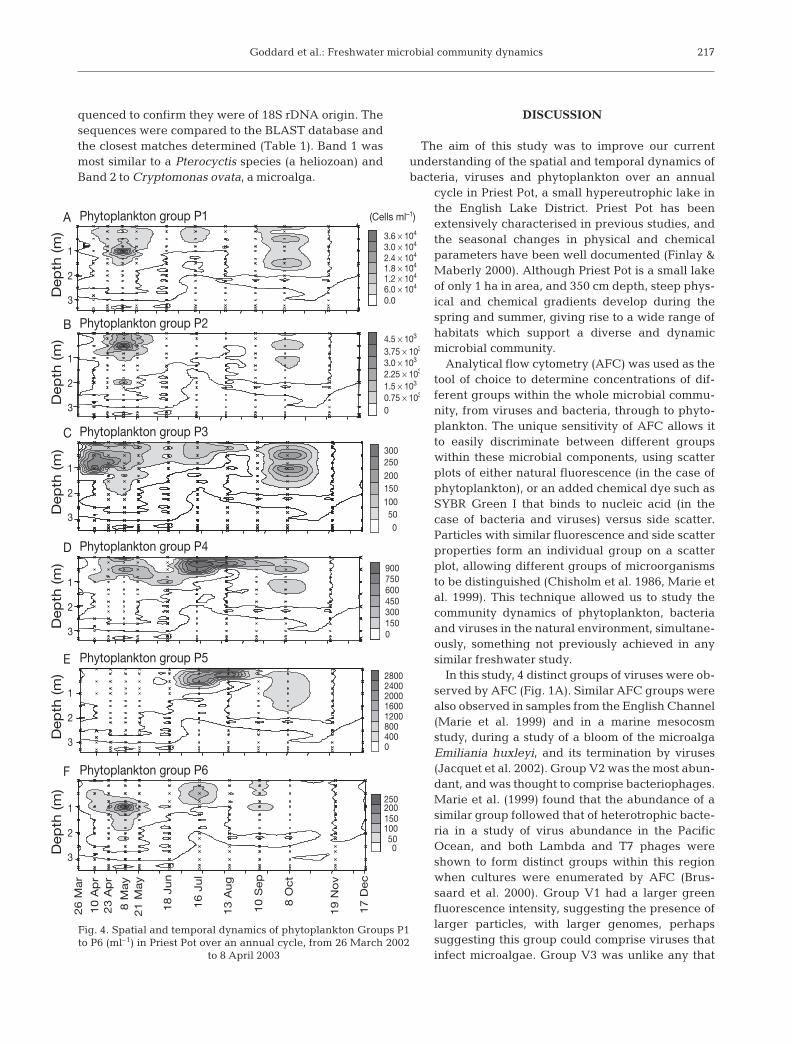
ml–1. Most of the phytoplankton groups had peaksof abundance that were both spatially and tempo-rally distinct (Fig. 4). For example, Group P2 had apeak of 5 × 10³ ml–1 on 8 May at a depth of 150 cm(Fig. 4B), and Groups P3 and P4 were most abun-dant on 10 April (3.2 × 10² ml–1) and 16 July (1 × 10³
ml–1), respectively (Fig. 4C,D). Two phytoplanktongroups, P1 (Fig. 4A) and P6 (Fig. 4F), had peaks inabundance of 3.6 × 10⁴ and 2.7 × 10² ml–1, respec-tively, on 8 May at 100 cm depth, at the same timeand depth at which the highest algal chlorophyll alevels were recorded. Group P8 was the numeri-cally dominant group detected using these set-tings, with concentrations reaching 4.5 × 10⁵ on 16July below 200 cm depth (Fig. 5B). Group P7 wasalso present in relatively high numbers, with con-centrations reaching a peak of 7.5 × 10⁴ ml–1 on 10September below 300 cm depth, in the anoxiclayer (Fig. 5A). Neither Group P7 nor P8 were de-tected above 200 cm, nor in the spring or wintermonths. The peaks in abundance of these2 groups also occurred at the same time as thepeaks in bacterial chlorophylls c and d (Fig. 2F),suggesting that they did not comprise phyto-plankton, but rather autofluorescent pho-totrophic bacteria growing anaerobically in theanoxic layer. Phytoplankton counts were mea-sured throughout the winter, but all groups wereundetectable during this time.
Bacteria and eukaryote diversity
Spatial and temporal changes in the diversityof prokaryotic and eukaryotic members of themicrobial community were monitored by DGGEseparation of PCR amplified 16S and 18S rDNA,respectively. Samples were taken from 8 depthson 10 occasions between 26 March 2002 and 8
215
3
2
1
3
2
1
Pho
spha
te (µ
g l–1
)A
lgal
chl
a (µ
g l–1
)B
acte
rial c
hl c
+d
(µg
l–1)
Dep
th (m
)D
epth
(m)
Dep
th (m
)D
epth
(m)
Dep
th (m
)D
epth
(m)
2
450400350300250200150100
500
–50
950850750650550450350250150
50–50
400350300250200150100
36032028024020016012080400
500
–50
468
10121416
3
2
1
Tem
p (
°C)
dO
2 (µ
mo
l l–1
)N
itra
te (
µg l–1
)
A
B
C
D
3
2
1
E
26 M
ar10
Ap
r23
Ap
r8
May
21 M
ay
18 J
un
16 J
ul
13 A
ug
10 S
ep
8 O
ct
19 N
ov
17 D
ec
28 J
an12
Feb
17 M
ar
8 A
pr
2002 2003
F
3
2
1
050100150200250300350400450500550600650
3
2
1
Fig. 2. Contour plots showing spatial and temporal variations in PriestPot of (A) water temperature (°C), (B) dissolved oxygen (dO2) concen-tration (µmol l–1), (C) nitrate concentration (µg l–1), (D) phosphateconcentration (µg l–1), (E) algal chlorophyll a concentration (µg l–1),and (F) bacterial chlorophyll c and d concentration (µg l–1). ××: times
and depths of samples taken
Aquat Microb Ecol 39: 211–223, 2005
October 2003, and the DGGE profiles observed. Com-parison of DGGE profiles showed that the structure ofthe bacterial community, reflected by the distributionof the most abundant strains, changed over both spa-tial and temporal scales. Fig. 6 shows 3 gels from 10April, 8 May and 10 September 2002 that are repre-sentative of these changes. The number of obviousbands ranged from 3 to 9, with the highest number ofbands observed in May. In the early part of the year(in March and April), the profiles consisted of 4 bandsof similar intensity, suggesting that they were all ofsimilar abundance. These profiles were consistentthroughout the water column. In the sample from 8May, DGGE patterns from different depths reflectedmarked differences between the bacterial communityin the top 200 cm of the water column and the bottom150 cm, as the anoxic layer became established. Thehighest number of bands observed during the annualcycle was seen in the oxic water at this time, and bothband number and intensity decreased with depth.
There was also a marked shift in bacterial communitystructure at 3.2 m depth (at the bottom of the lake) be-
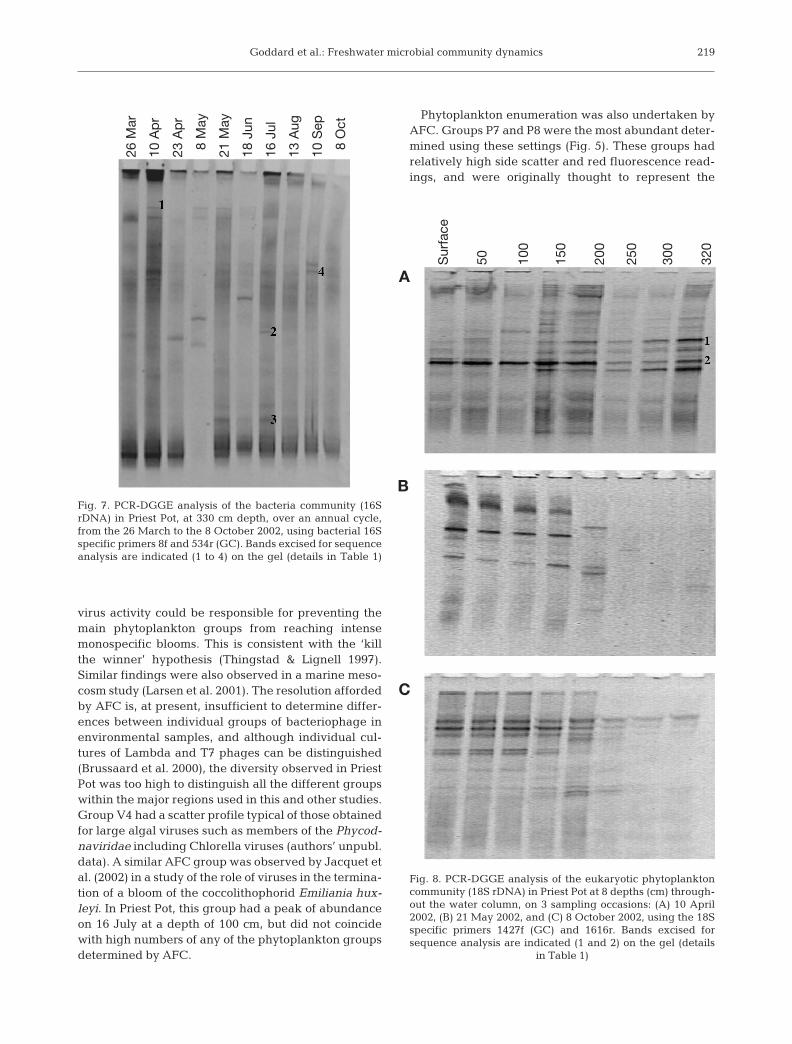
tween 26 March and 8 October. Fig. 7 shows thetemporal variations in 16S rDNA DGGE profilesat 3.2 m, before, during and after the establish-ment of the anoxic layer. The profiles obtainedfrom 3.2 m in the samples from 26 March and 10April generated 9 bands each and were very sim-ilar to each other; however, the profiles from sub-sequent samples differed markedly from boththese and each other. Between 23 March and 8October, 3 to 5 bands were observed in each sam-ple, and few bands were present more than once,suggesting a dynamic bacterial community. Thelower diversity observed by DGGE in the latterpart of the annual cycle coincided with the in-crease in autofluorescent prokaryotes seen byAFC (Fig. 5). A small subsample of 4 bands wasexcised from the gel for reamplification and se-quencing, to confirm that they were of bacterialorigin (Fig. 7, Bands 1 to 4). The sequences ob-tained were compared to the BLAST database todetermine the closest matches (Table 1). Band 1,detected on 10 April was most similar to an uncul-tured Actinobacterium. The sequence data ob-tained for Bands 2 and 3 contained a high numberof degeneracies, and were therefore not submit-ted to GenBank; however, BLAST searches werecarried out, and both bands, isolated from 16 July(that co-occurred with the high numbers of photo-synthetic bacteria), were both most similar to bac-teria in the Chlorobium–Pelodictyon group, agroup of anaerobic green sulphur bacteria. Band4 isolated on 10 September was also most similarto a Chlorobium species. Although the overall
number of bands was low, there was a relatively highbackground smearing, suggesting high diversity.
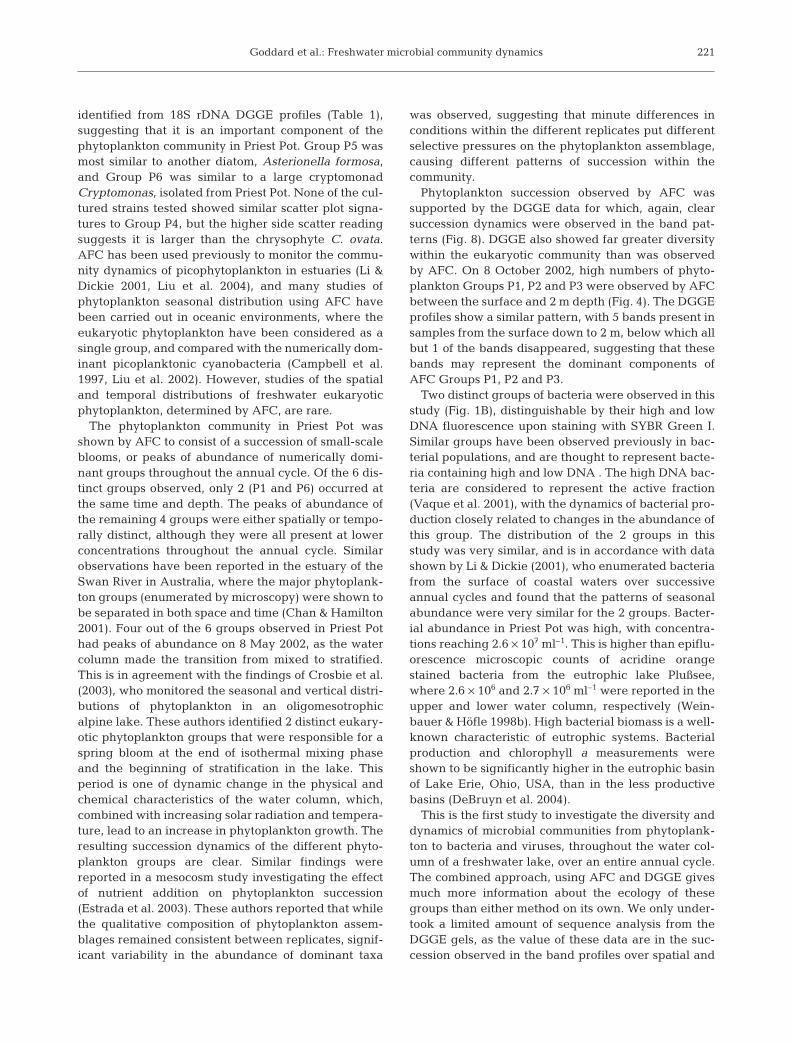
Changes in the composition of the eukaryotic com-munity were observed by DGGE separation of PCRamplified 18S rDNA. The eukaryotic communityshowed different DGGE profiles based on both the num-ber of bands observed and the distance of migration,throughout the annual cycle. Fig. 8 shows 3 gels that arerepresentative of the spatial and temporal variations ob-served by DGGE during the annual cycle. There was lit-tle variation in either the number of bands or the bandprofiles with depth on 26 March, 10 April and 23 April(represented by the gel in Fig. 8A), but the intensity ofthe most dominant bands did decrease with increasingdepth (Fig. 8A). From 8 May until 8 October (repre-sented by the gels in Fig. 8B,C), however, the DGGE pro-files from different depths reflected substantial differ-ences between aerobic and anaerobic assemblages.Profiles from the oxic part of the water column variedlittle with depth, but very few 18S rDNA bands weredetected in the anoxic layer (Fig. 8B,C). Two bands wereexcised from the gel from the 10 April sample and se-
216
2002 2003
3
2
1
Total bacteria counts (ml–1)
Total virus counts (ml–1)
26 M
ar
10 A
pr
23 A
pr
8 M
ay
21 M
ay
18 J
un
16 J
ul
13 A
ug
10 S
ep
8 O
ct
19 N
ov
17 D
ec
28 J
an
12 F
eb
17 M
ar
8 A
pr
2002 20032002 2003
2.6 × 10⁷
2.4 × 10⁷
2.2 × 10⁷
2.0 × 10⁷
1.8 × 10⁷
1.6 × 10⁷
1.4 × 10⁷
1.2 × 10⁷
1.0 × 10⁷
8.0 × 10⁶
6.0 × 10⁶
4.0 × 10⁶
2.0 × 10⁶
2.0 × 10⁸
1.8 × 10⁸
1.6 × 10⁸
1.4 × 10⁸
1.2 × 10⁸
1.0 × 10⁸
8.0 × 10⁷
6.0 × 10⁷
4.0 × 10⁷
2.0 × 10⁷
1.3 × 10⁷
1.2 × 10⁷
1.1 × 10⁶
9.6 × 10⁵
8.4 × 10⁵
7.2 × 10⁵
6.0 × 10⁵
4.8 × 10⁵
3.6 × 10⁵
2.4 × 10⁵
1.2 × 10⁵
0.0
0.0
0.0
Dep
th (m
)
3
2
1
Dep
th (m
)
3
2
1
Dep
th (m
)
B
A
Virus group V4 counts (ml–1)C
Fig. 3. Spatial and temporal dynamics of (A) bacteria and (B) virustotal communities (ml–1) in Priest Pot over an annual cycle, from26 March 2002 to 8 April 2003. (C) Spatial and temporal distributions
of virus Group V4 (ml–1) during the annual cycle
Goddard et al.: Freshwater microbial community dynamics
quenced to confirm they were of 18S rDNA origin. Thesequences were compared to the BLAST database andthe closest matches determined (Table 1). Band 1 wasmost similar to a Pterocyctis species (a heliozoan) andBand 2 to Cryptomonas ovata, a microalga.
DISCUSSION
The aim of this study was to improve our currentunderstanding of the spatial and temporal dynamics ofbacteria, viruses and phytoplankton over an annual
cycle in Priest Pot, a small hypereutrophic lake inthe English Lake District. Priest Pot has beenextensively characterised in previous studies, andthe seasonal changes in physical and chemicalparameters have been well documented (Finlay &Maberly 2000). Although Priest Pot is a small lakeof only 1 ha in area, and 350 cm depth, steep phys-ical and chemical gradients develop during thespring and summer, giving rise to a wide range ofhabitats which support a diverse and dynamicmicrobial community.
Analytical flow cytometry (AFC) was used as thetool of choice to determine concentrations of dif-ferent groups within the whole microbial commu-nity, from viruses and bacteria, through to phyto-plankton. The unique sensitivity of AFC allows itto easily discriminate between different groupswithin these microbial components, using scatterplots of either natural fluorescence (in the case ofphytoplankton), or an added chemical dye such asSYBR Green I that binds to nucleic acid (in thecase of bacteria and viruses) versus side scatter.Particles with similar fluorescence and side scatterproperties form an individual group on a scatterplot, allowing different groups of microorganismsto be distinguished (Chisholm et al. 1986, Marie etal. 1999). This technique allowed us to study thecommunity dynamics of phytoplankton, bacteriaand viruses in the natural environment, simultane-ously, something not previously achieved in anysimilar freshwater study.
In this study, 4 distinct groups of viruses were ob-served by AFC (Fig. 1A). Similar AFC groups werealso observed in samples from the English Channel(Marie et al. 1999) and in a marine mesocosmstudy, during a study of a bloom of the microalgaEmiliania huxleyi, and its termination by viruses(Jacquet et al. 2002). Group V2 was the most abun-dant, and was thought to comprise bacteriophages.Marie et al. (1999) found that the abundance of asimilar group followed that of heterotrophic bacte-ria in a study of virus abundance in the PacificOcean, and both Lambda and T7 phages wereshown to form distinct groups within this regionwhen cultures were enumerated by AFC (Brus-saard et al. 2000). Group V1 had a larger greenfluorescence intensity, suggesting the presence oflarger particles, with larger genomes, perhapssuggesting this group could comprise viruses thatinfect microalgae. Group V3 was unlike any that
217
Phytoplankton group P1
050
100150200250300
A
Phytoplankton group P2B
Phytoplankton group P3C
Phytoplankton group P4D
Phytoplankton group P5E
Phytoplankton group P6F
050
100150200250
26
Mar
10
Ap
r2
3 A
pr
8 M
ay
21
May
18
Ju
n
16
Ju
l
13
Au
g
10
Sep
19
No
v
17
Dec
8 O
ct
(Cells ml–1)
P1
3
2
1
Dep
th (m
)
3
2
1
Dep
th (m
)
3
2
1
Dep
th (m
)
3
2
1
Dep
th (m
)
3
2
1
Dep
th (m
)
3
2
1
Dep
th (m
)
P1P13.6 × 104
3.0 × 10⁴
2.4 × 10⁴
1.8 × 10⁴
1.2 × 10⁴
6.0 × 10⁴
4.5 × 10³
3.75 × 10³
3.0 × 10³
2.25 × 10³
1.5 × 10³
0.75 × 10³
0
0.0
0150300450600750900
040080012001600200024002800
Fig. 4. Spatial and temporal dynamics of phytoplankton Groups P1to P6 (ml–1) in Priest Pot over an annual cycle, from 26 March 2002
to 8 April 2003
Aquat Microb Ecol 39: 211–223, 2005
has been reported previously. The larger sidescatter and green fluorescence readings suggestthis group could comprise large viruses, or smallbacteria, although the group was not removed byfiltration through a 0.2 µm filter (data not shown).The distribution of abundance of Groups V1, V2and V3 over the 2002/2003 annual cycle did notdiffer greatly from each other, and were very sim-ilar to the total virus distribution. No correlationwas observed between these groups, or any of thebacteria or phytoplankton groups determined byAFC (data not shown). In contrast, a study byLarsen et al. (2004) reported that virus numbers inan AFC group similar to V2 increased during abloom of picoeukaryotes in coastal waters offNorway, suggesting that this group was domi-nated by viruses infecting a major component ofthe bloom. Although overall abundance of micro-algae was high, their diversity was also high, asillustrated by both AFC (Fig. 4) and DGGE analy-sis of 18S rDNA (Fig. 8). This suggests that thehigh microalgal diversity could be maintained bycontinuous infection by viruses, hence virus con-centrations remained relatively consistent andhigh from April to October in the top 250 cm(Fig. 3). Essentially, it may be interpreted that
218
2002 2003
26
Mar
10
Ap
r2
3 A
pr
8 M
ay
21
May
18
Ju
n
16
Ju
l
13
Au
g
10
Sep
8 O
ct
19
No
v
17
Dec
28
Jan
12
Feb
17
Mar
8 A
pr
2002 20032002 2003
Dep
th (m
)
7.50 × 10⁴
6.75 × 10⁴
4.5 × 10⁵
4.0 × 10⁵
3.5 × 10⁵
3.0 × 10⁵
2.5 × 10⁵
2.0 × 10⁵
1.5 × 10⁵
1.0 × 10⁵
5.0 × 10⁴
0.0
6.00 × 10⁴
3.75 × 10⁴
3.00 × 10⁴
5.25 × 10⁴
4.50 × 10⁴
2.25 × 10⁴
1.50 × 10⁴
7.50 × 10³
0.03
2
1
Dep
th (m
)
3
2
1
P7 counts (ml–1)
P8 counts (ml–1)
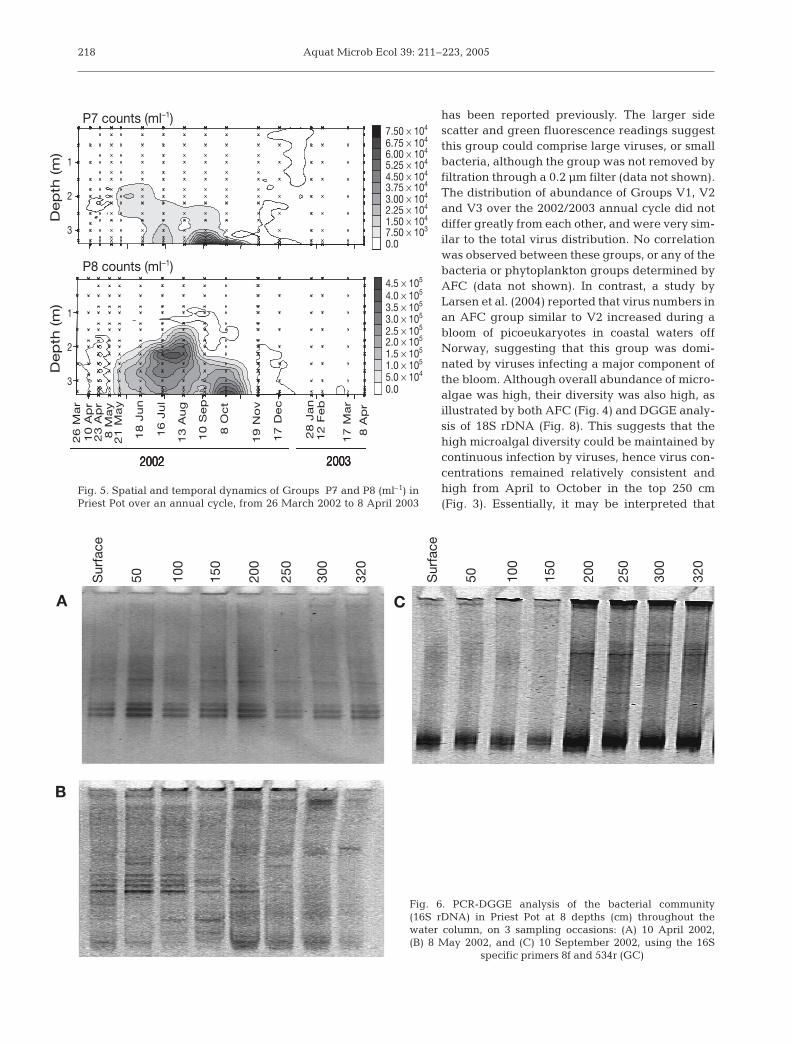
Fig. 5. Spatial and temporal dynamics of Groups P7 and P8 (ml–1) inPriest Pot over an annual cycle, from 26 March 2002 to 8 April 2003
Fig. 6. PCR-DGGE analysis of the bacterial community (16S rDNA) in Priest Pot at 8 depths (cm) throughout thewater column, on 3 sampling occasions: (A) 10 April 2002,(B) 8 May 2002, and (C) 10 September 2002, using the 16S
specific primers 8f and 534r (GC)
Sur
face
50 100
150
200
250
300
320
Sur
face
50 100
150
200
250
300
320
A
B
C
Goddard et al.: Freshwater microbial community dynamics
virus activity could be responsible for preventing themain phytoplankton groups from reaching intensemonospecific blooms. This is consistent with the ‘killthe winner’ hypothesis (Thingstad & Lignell 1997).Similar findings were also observed in a marine meso-cosm study (Larsen et al. 2001). The resolution affordedby AFC is, at present, insufficient to determine differ-ences between individual groups of bacteriophage inenvironmental samples, and although individual cul-tures of Lambda and T7 phages can be distinguished(Brussaard et al. 2000), the diversity observed in PriestPot was too high to distinguish all the different groupswithin the major regions used in this and other studies.Group V4 had a scatter profile typical of those obtainedfor large algal viruses such as members of the Phycod-naviridae including Chlorella viruses (authors’ unpubl.data). A similar AFC group was observed by Jacquet etal. (2002) in a study of the role of viruses in the termina-tion of a bloom of the coccolithophorid Emiliania hux-leyi. In Priest Pot, this group had a peak of abundanceon 16 July at a depth of 100 cm, but did not coincidewith high numbers of any of the phytoplankton groupsdetermined by AFC.
Phytoplankton enumeration was also undertaken byAFC. Groups P7 and P8 were the most abundant deter-mined using these settings (Fig. 5). These groups hadrelatively high side scatter and red fluorescence read-ings, and were originally thought to represent the
219
Fig. 7. PCR-DGGE analysis of the bacteria community (16SrDNA) in Priest Pot, at 330 cm depth, over an annual cycle,from the 26 March to the 8 October 2002, using bacterial 16Sspecific primers 8f and 534r (GC). Bands excised for sequenceanalysis are indicated (1 to 4) on the gel (details in Table 1)
Fig. 8. PCR-DGGE analysis of the eukaryotic phytoplanktoncommunity (18S rDNA) in Priest Pot at 8 depths (cm) through-out the water column, on 3 sampling occasions: (A) 10 April2002, (B) 21 May 2002, and (C) 8 October 2002, using the 18Sspecific primers 1427f (GC) and 1616r. Bands excised forsequence analysis are indicated (1 and 2) on the gel (details
in Table 1)
Sur
face
50 100
150
200
250
300
320
A
B
C
26 M
ar
10 A
pr
23 A
pr
8 M
ay
21 M
ay
18 J
un
16 J
ul
13 A
ug
10 S
ep
8 O
ct
Aquat Microb Ecol 39: 211–223, 2005
picoplanktonic cyanobacteria. However, both groupswere found to flourish under anaerobic conditions inthe stratified water column during the late summer andautumn (Fig. 5), and were therefore thought to com-prise anaerobic green sulphur bacteria. Despite thedominance of cyanobacteria in many marine (Liu et al.2002) and freshwater (Callieri & Stockner 2002) habi-tats, they were not detected in Priest Pot by AFC at anypoint during this study. Sequence analysis of a DGGEband whose appearance also coincided with the highGroup P7 concentration suggested that a component ofthe bloom was closely related to Chlorobium ferrooxi-dans, an obligate anaerobic green sulphur bacteriumthat grows photoautotrophically using sulphide as theelectron donor (Holt et al. 1994). Chlorobium specieshave previously been found in the anoxic layer of strat-ified lakes (Casamayor et al. 2000) and another mem-ber of the green sulphur bacteria has been observed inPriest Pot, and was tentatively identified as Clathro-chloris hypolimnica, on the basis of TEM analysis(Davison & Finlay 1986). The large cell size of GroupP7 suggested by AFC scatter plots is in accordancewith other studies that have found bacteria in theanoxic hypolimnion to be up to twice the size of thosein oxic waters (Cole et al. 1993). Strains within both theChlorobium and Clathrochloris genera are known toform filaments, which could also explain the relativelyhigh side scatter reading. High bacterial chlorophylls cand d levels recorded at the same time as the peaks inabundance of both Groups P7 and P8 (577 and 643 µgl–1, respectively) indicate that this is an actively grow-ing population (Fig. 2F).
The highest virus concentrations detected duringthis study were also observed in the anoxic layer, at thesame time and depth as the P7 peak of abundance,suggesting possible interactions between these 2groups. Larger bacteria have been shown to be moresusceptible to viral infection than smaller ones in aeutrophic lake (Weinbauer & Höfle 1998b), and highvirus concentrations, enumerated as the frequency ofvisibly infected bacterial cells, have previously beenreported in the anoxic hypolimnion of the eutrophicLake Plußsee, Germany, where viruses were shown to
account for up to 94% of bacterial mortality (Wein-bauer & Höfle 1998a).
In Priest Pot, there was a great deal of variation inbacterial community composition, at 320 cm depth,during and after the establishment of the anoxic layer.Although variation in bacterial community composi-tion in the anoxic hypolimnia of freshwater lakes hasbeen shown to be less marked than in communitiesfrom oxygenated parts of the water column (Casa-mayor et al. 2002), bacterial community composition isknown to vary in response to changing environmentalparameters. The level of photosynthetically availableradiation (PAR) is an important factor in structuringanoxic bacterial communities, with organisms withdifferent light harvesting adaptations proliferatingunder a range of light conditions (Vila & Abella 2001).Temporal and spatial fluctuations in microbial commu-nity composition in response to changes in limnologi-cal parameters have also been well documented(Casamayor et al. 2000). Once stratification is estab-lished in Priest Pot, data from this and previous studieshave shown that physical and chemical parametersremain relatively stable in the anoxic layer (Finlay &Maberly 2000), so it is probable there are other forcesdriving the dynamic change observed within the bac-terial community. The data reported in this study sup-port those by others in suggesting that viruses couldplay an important role in structuring anoxic bacterialcommunities.
In addition to Groups P7 and P8, 6 distinct phyto-plankton groups were determined by AFC analysisduring this study (Fig. 1C), and were distinguishableon scatter plots of orange fluorescence versus sidescatter. We compared the groups observed in thisstudy with the scatter plots generated by individualcultured strains from the Culture Collection of Algaeand Protazoa (CCAP) at the Centre for Ecology andHydrology, Windermere, UK, in an attempt to deter-mine possible identities for each (data not shown).Group P1 had a similar AFC signature to the diatomStephanodiscus hantschii. Groups P2 and P3 weremost similar to the chrysophytes Synura petersenii andCryptomonas ovata, respectively. C. ovata was also
220
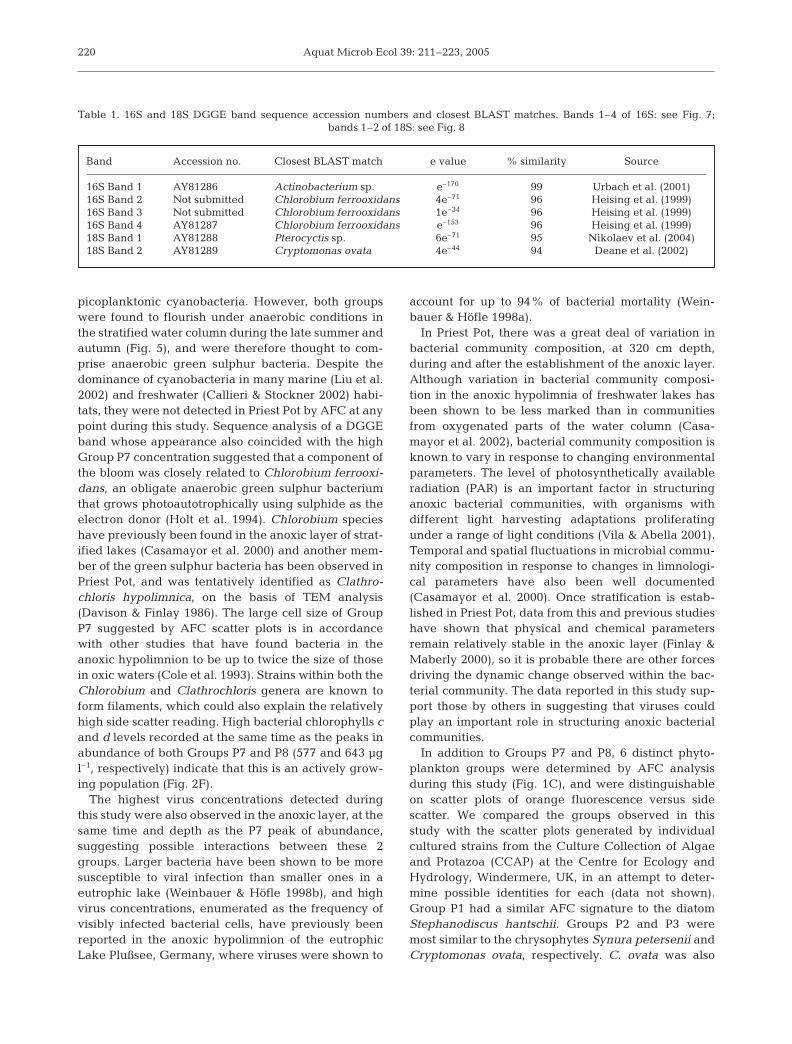
Band Accession no. Closest BLAST match e value % similarity Source
16S Band 1 AY81286 Actinobacterium sp. e–170 99 Urbach et al. (2001)16S Band 2 Not submitted Chlorobium ferrooxidans 4e–71 96 Heising et al. (1999)16S Band 3 Not submitted Chlorobium ferrooxidans 1e–34 96 Heising et al. (1999)16S Band 4 AY81287 Chlorobium ferrooxidans e–153 96 Heising et al. (1999)18S Band 1 AY81288 Pterocyctis sp. 6e–71 95 Nikolaev et al. (2004)18S Band 2 AY81289 Cryptomonas ovata 4e–44 94 Deane et al. (2002)
Table 1. 16S and 18S DGGE band sequence accession numbers and closest BLAST matches. Bands 1–4 of 16S: see Fig. 7; bands 1–2 of 18S: see Fig. 8
Goddard et al.: Freshwater microbial community dynamics
identified from 18S rDNA DGGE profiles (Table 1),suggesting that it is an important component of thephytoplankton community in Priest Pot. Group P5 wasmost similar to another diatom, Asterionella formosa,and Group P6 was similar to a large cryptomonadCryptomonas, isolated from Priest Pot. None of the cul-tured strains tested showed similar scatter plot signa-tures to Group P4, but the higher side scatter readingsuggests it is larger than the chrysophyte C. ovata.AFC has been used previously to monitor the commu-nity dynamics of picophytoplankton in estuaries (Li &Dickie 2001, Liu et al. 2004), and many studies ofphytoplankton seasonal distribution using AFC havebeen carried out in oceanic environments, where theeukaryotic phytoplankton have been considered as asingle group, and compared with the numerically dom-inant picoplanktonic cyanobacteria (Campbell et al.1997, Liu et al. 2002). However, studies of the spatialand temporal distributions of freshwater eukaryoticphytoplankton, determined by AFC, are rare.
The phytoplankton community in Priest Pot wasshown by AFC to consist of a succession of small-scaleblooms, or peaks of abundance of numerically domi-nant groups throughout the annual cycle. Of the 6 dis-tinct groups observed, only 2 (P1 and P6) occurred atthe same time and depth. The peaks of abundance ofthe remaining 4 groups were either spatially or tempo-rally distinct, although they were all present at lowerconcentrations throughout the annual cycle. Similarobservations have been reported in the estuary of theSwan River in Australia, where the major phytoplank-ton groups (enumerated by microscopy) were shown tobe separated in both space and time (Chan & Hamilton2001). Four out of the 6 groups observed in Priest Pothad peaks of abundance on 8 May 2002, as the watercolumn made the transition from mixed to stratified.This is in agreement with the findings of Crosbie et al.(2003), who monitored the seasonal and vertical distri-butions of phytoplankton in an oligomesotrophicalpine lake. These authors identified 2 distinct eukary-otic phytoplankton groups that were responsible for aspring bloom at the end of isothermal mixing phaseand the beginning of stratification in the lake. Thisperiod is one of dynamic change in the physical andchemical characteristics of the water column, which,combined with increasing solar radiation and tempera-ture, lead to an increase in phytoplankton growth. Theresulting succession dynamics of the different phyto-plankton groups are clear. Similar findings werereported in a mesocosm study investigating the effectof nutrient addition on phytoplankton succession(Estrada et al. 2003). These authors reported that whilethe qualitative composition of phytoplankton assem-blages remained consistent between replicates, signif-icant variability in the abundance of dominant taxa
was observed, suggesting that minute differences inconditions within the different replicates put differentselective pressures on the phytoplankton assemblage,causing different patterns of succession within thecommunity.
Phytoplankton succession observed by AFC wassupported by the DGGE data for which, again, clearsuccession dynamics were observed in the band pat-terns (Fig. 8). DGGE also showed far greater diversitywithin the eukaryotic community than was observedby AFC. On 8 October 2002, high numbers of phyto-plankton Groups P1, P2 and P3 were observed by AFCbetween the surface and 2 m depth (Fig. 4). The DGGEprofiles show a similar pattern, with 5 bands present insamples from the surface down to 2 m, below which allbut 1 of the bands disappeared, suggesting that thesebands may represent the dominant components ofAFC Groups P1, P2 and P3.
Two distinct groups of bacteria were observed in thisstudy (Fig. 1B), distinguishable by their high and lowDNA fluorescence upon staining with SYBR Green I.Similar groups have been observed previously in bac-terial populations, and are thought to represent bacte-ria containing high and low DNA . The high DNA bac-teria are considered to represent the active fraction(Vaque et al. 2001), with the dynamics of bacterial pro-duction closely related to changes in the abundance ofthis group. The distribution of the 2 groups in thisstudy was very similar, and is in accordance with datashown by Li & Dickie (2001), who enumerated bacteriafrom the surface of coastal waters over successiveannual cycles and found that the patterns of seasonalabundance were very similar for the 2 groups. Bacter-ial abundance in Priest Pot was high, with concentra-tions reaching 2.6 × 10⁷ ml–1. This is higher than epiflu-orescence microscopic counts of acridine orangestained bacteria from the eutrophic lake Plußsee,where 2.6 × 10⁶ and 2.7 × 10⁶ ml–1 were reported in theupper and lower water column, respectively (Wein-bauer & Höfle 1998b). High bacterial biomass is a well-known characteristic of eutrophic systems. Bacterialproduction and chlorophyll a measurements wereshown to be significantly higher in the eutrophic basinof Lake Erie, Ohio, USA, than in the less productivebasins (DeBruyn et al. 2004).
This is the first study to investigate the diversity anddynamics of microbial communities from phytoplank-ton to bacteria and viruses, throughout the water col-umn of a freshwater lake, over an entire annual cycle.The combined approach, using AFC and DGGE givesmuch more information about the ecology of thesegroups than either method on its own. We only under-took a limited amount of sequence analysis from theDGGE gels, as the value of these data are in the suc-cession observed in the band profiles over spatial and
221
Aquat Microb Ecol 39: 211–223, 2005
temporal scales, rather than in the identification of allbands. The data presented here suggest close couplingbetween the virus, bacteria and phytoplankton com-munities in Priest Pot. The high turnover of phyto-plankton could be driving bacterial succession andabundance, which in turn maintains a diverse andabundant bacteriophage community. Priest Pot is adynamic ecosystem in which a complex array of envi-ronmental factors combine to shape a rich and diversemicrobial community.
Acknowledgements. We thank the staff at CEH Windermere(now Lancaster) for their assistance during fieldwork and forsample collection, and in particular J. E. Parker and Dr. G. H.Hall for help in providing the physicochemical data. Work inthis study was funded by the Natural Environment ResearchCouncil’s Marine and Freshwater Microbial Biodiversityprogramme through grant NER/T/s/2000/01365 awarded toW.H.W. and D.G.A., and grant F3/G11/34/01 awarded toS.C.M.
LITERATURE CITED
Bergh O, Borsheim KY, Bratbak G, Heldal M (1989) Highabundance of viruses found in aquatic environments.Nature 340:467–468
Bettarel Y, Amblard C, Sime-Ngando T, Carrias JF, Sargos D,Garabetian F, Lavandier P (2003a) Viral lysis, flagellategrazing potential, and bacterial production in Lake Pavin.Microb Ecol 45:119–127
Bettarel Y, Sime-Ngando T, Amblard C, Carrias JF, Portelli C(2003b) Virioplankton and microbial communities inaquatic systems: a seasonal study in two lakes of differingtrophy. Freshw Biol 48:810–822
Bettarel Y, Sime-Ngando T, Amblard C, Dolan J (2004) Viralactivity in two contrasting lake ecosystems. Appl EnvironMicrobiol 70:2941–2951
Binder BJ, Chisholm SW, Olson RJ, Frankel SL, Worden AZ(1996) Dynamics of picophytoplankton, ultraphytoplank-ton and bacteria in the central equatorial Pacific. Deep-Sea ResPart II 43:907–931
Bratbak G, Thingstad F, Heldal M (1994) Viruses and themicrobial loop. Microb Ecol 28:209–221
Brussaard CPD (2004) Optimization of procedures for count-ing viruses by flow cytometry. Appl Environ Microbiol 70:1506–1513
Brussaard CPD, Marie D, Bratbak G (2000) Flow cytometricdetection of viruses. J Virol Methods 85:175–182
Callieri C, Stockner JG (2002) Freshwater autotrophicpicoplankton: a review. J Limnol 61:1–14
Campbell L, Liu HB, Nolla HA, Vaulot D (1997) Annual vari-ability of phytoplankton and bacteria in the subtropicalNorth Pacific Ocean at Station ALOHA during the1991–1994 ENSO event. Deep-Sea Res I 44:167–192
Caraco N, Puccoon AH (1986) The measurement of bacterialchlorophyll and algal chlorophyll a in natural water.Limnol Oceanogr 31:889–893
Casamayor EO, Schafer H, Baneras L, Pedros-Alio C, MuyzerG (2000) Identification of and spatio-temporal differencesbetween microbial assemblages from two neighboringsulfurous lakes: comparison by microscopy and denatur-ing gradient gel electrophoresis. Appl Environ Microbiol66:499–508
Casamayor EO, Pedros-Alio C, Muyzer G, Amann R (2002)Microheterogeneity in 16S ribosomal DNA-defined bac-terial populations from a stratified planktonic environmentis related to temporal changes and to ecological adapta-tions. Appl Environ Microbiol 68:1706–1714
Chan TU, Hamilton P (2001) Effect of freshwater flow on thesuccession and biomass of phytoplankton in a seasonalestuary. Mar Freshw Res 52:869–884
Chisholm SW, Armbrust EV, Olson RJ (1986) The individualcell in phytoplankton ecology: cell cycles and applicationsof flow cytometry. In: Platt T, Li WKW (eds) Photosyntheticpicoplankton. Can Bull Fish Aquat Sci, Ottawa, p 343–369
Cole JJ, Pace ML, Caraco NF, Steinhart GS (1993) Bacterialbiomass and cell-size distributions in lakes — more andlarger cells in anoxic waters. Limnol Oceanogr 38:1627–1632
Crosbie ND, Teubner K, Weisse T (2003) Flow-cytometricmapping provides novel insights into the seasonal andvertical distributions of freshwater autotrophic picoplank-ton. Aquat Microb Ecol 33:53–66
Davison W, Finlay BJ (1986) Ferrous iron and phototrophy asalternative sinks for sulfide in the anoxic hypolimnia of 2adjacent lakes. J Ecol 74:663–673
Deane JA, Strachan IM, Saunders GW, Hill DRA, McFaddenGI (2002) Cryptomonad evolution: nuclear 18S rDNAphylogeny versus cell morphology and pigmentation.J Phycol 38:1236–1244
DeBruyn JM, Leigh-Bell JA, McKay RML, Bourbonniere RA,Wilheim SW (2004) Microbial distributions and the impactof phosphorus on bacterial activity in Lake Erie. J GreatLakes Res 30:166–183
Estrada M, Berdalet E, Vila M, Marrase C (2003) Effects ofpulsed nutrient enrichment on enclosed phytoplankton:ecophysiological and successional responses. AquatMicrob Ecol 32:61–71
Finlay B, Maberly S (2000) Microbial diversity in Priest Pot: aproductive pond in the English Lake District. FreshwaterBiological Association, Ambleside
Fischer UR, Velimirov B (2002) High control of bacterial pro-duction by viruses in a eutrophic oxbow lake. AquatMicrob Ecol 27:1–12
Gasol JM, Zweifel UL, Peters F, Fuhrman JA, Hagström Å(1999) Significance of size and nucleic acid content het-erogeneity as measured by flow cytometry in naturalplanktonic bacteria. Appl Environ Microbiol 65:4475–4483
Goddard VJ, Bailey MJ, Darrah P, Lilley AK, Thompson IP(2001) Monitoring temporal and spatial variation in rhi-zosphere bacterial population diversity: a communityapproach for the improved selection of rhizosphere com-petent bacteria. Plant Soil 232:181–193
Heaney SI (1974) A pneumatically operated water sampler forclose intervals of depths. Freshw Biol 4:103–106
Heising S, Richter L, Ludwig W, Schink B (1999) Chlorobiumferrooxidans sp. nov., a phototrophic green sulfur bac-terium that oxidizes ferrous iron in coculture with a‘Geospirillum’ sp. strain. Arch Microbiol 172:116–124
Hennes KP, Simon M (1995) Significance of bacteriophagesfor controlling bacterioplankton growth in a mesotrophiclake. Appl Environ Microbiol 61:333–340
Holt JG, Krieg NR, Sneath PHA, Staley JT, Williams ST (1994)Bergey’s manual of determinative bacteriology. Williams& Wilkins, Baltimore, MA
Jacquet S, Heldal M, Iglesias-Rodriguez D, Larsen A, WilsonW, Bratbak G (2002) Flow cytometric analysis of an Emil-iana huxleyi bloom terminated by viral infection. AquatMicrob Ecol 27:111–124
222
Goddard et al.: Freshwater microbial community dynamics
Larsen A, Castberg T, Sandaa RA, Brussaard CPD and 6 oth-ers (2001) Population dynamics and diversity of phyto-plankton, bacteria and viruses in a seawater enclosure.Mar Ecol Prog Ser 221:47–57
Larsen A, Flaten GAF, Sandaa RA, Castberg T, Thyrhaug R,Erga SR, Jacquet S, Bratbak G (2004) Spring phyto-plankton bloom dynamics in Norwegian coastal waters:microbial community succession and diversity. LimnolOceanogr 49:180–190
Li WKW, Dickie PM (2001) Monitoring phytoplankton, bacte-rioplankton, and virioplankton in a coastal inlet (BedfordBasin) by flow cytometry. Cytometry 44:236–246
Liu HB, Suzukil K, Minami C, Saino T, Watanabe M (2002)Picoplankton community structure in the subarctic PacificOcean and the Bering Sea during summer 1999. Mar EcolProg Ser 237:1–14
Liu HB, Dagg M, Campbell L, Urban-Rich J (2004) Picophyto-plankton and bacterioplankton in the Mississippi Riverplume and its adjacent waters. Estuaries 27:147–156
Mackereth FGH, Heron J, Talling JF (1978) Water analysis: some revised methods for limnologists, Vol 36. Titus Wilson &
Son, KendalMaranger R, Bird DF (1995) Viral abundance in aquatic sys-
tems—a comparison between marine and fresh-waters.Mar Ecol Prog Ser 121:217–226
Marie D, Brussaard CPD, Thyrhaug R, Bratbak G, Vaulot D(1999) Enumeration of marine viruses in culture and nat-ural samples by flow cytometry. Appl Environ Microbiol65:45–52
Mathias CB, Kirschner AKT, Velimirov B (1995) Seasonal-variations of virus abundance and viral control of the bac-terial production in a backwater system of the DanubeRiver. Appl Environ Microbiol 61:3734–3740
Muyzer G, Dewaal EC, Uitterlinden AG (1993) Profiling ofcomplex microbial-populations by denaturing gradientgel-electrophoresis analysis of polymerase chain reaction-amplified genes-coding for 16S ribosomal-RNA. ApplEnviron Microbiology 59:695–700
Nikolaev SI, Berney C, Fahrni JF, Bolivar I and 5 others (2004)The twilight of Heliozoa and rise of Rhizaria, an emergingsupergroup of amoeboid eukaryotes. Proc Natl Acad Sci
USA 101:8066–8071Olson RJ, Vaulot D, Chisholm SW (1985) Marine-phytop-
lankton distributions measured using shipboard flow-cytometry. Deep-Sea Res I 32:1273–1280
Ovreas L, Bourne D, Sandaa RA, Casamayor EO and 5 others(2003) Response of bacterial and viral communities tonutrient manipulations in seawater mesocosms. AquatMicrob Ecol 31:109–121
Thingstad F, Lignell R (1997) Theoretical models for the con-trol of bacterial growth rate, abundance, diversity and car-bon demand. Aquat Microb Ecol 13:19–27
Urbach E, Vergin KL, Young L, Morse A, Larson GL, Giovan-noni SJ (2001) Unusual bacterioplankton communitystructure in ultra-oligotrophic Crater Lake. LimnolOceanography 46:557–572
van Hannen EJ, van Agterveld MP, Gons HJ, Laanbroek HJ(1998) Revealing genetic diversity of eukaryotic microor-ganisms in aquatic environments by denaturing gradientgel electrophoresis. J Phycol 34:206–213
Vaque D, Casamayor EO, Gasol JM (2001) Dynamics of wholecommunity bacterial production and grazing losses in sea-water incubations as related to the changes in the propor-tions of bacteria with different DNA content. AquatMicrob Ecol 25:163–177
Vila X, Abella CA (2001) Light-harvesting adaptations ofplanktonic phototrophic micro- organisms to differentlight quality conditions. Hydrobiologia 452:15–30
Weinbauer MG (2004) Ecology of prokaryotic viruses. FEMSMicrobiol Rev 28:127–181
Weinbauer MG, Höfle MG (1998a) Significance of viral lysisand flagellate grazing as factors controlling bacterio-plankton production in a eutrophic lake. Appl EnvironMicrobiol 64:431–438
Weinbauer MG, Höfle MG (1998b) Size-specific mortality oflake bacterioplankton by natural virus communities.Aquat Microb Ecol 15:103–113
Weisburg WG, Barns SM, Pelletier DA, Lane DJ (1991) 16sribosomal DNA amplification for phylogenetic study.J Bacteriol 173:697–703
Wommack KE, Colwell RR (2000) Virioplankton: viruses inaquatic ecosystems. Microbiol Molec Biol Rev 64:69–114
223
Editorial responsibility: Gunnar Bratbak, Bergen, Norway
Submitted: December 13, 2004; Accepted: March 31, 2005 Proofs received from author(s): June 1, 2005