Embed Size (px)
Citation preview

Temporal organization of the budding yeast cell cycle:
General principles and detailed simulations
Laurence Calzone
Dissertation submitted to the Faculty of the Virginia Polytechnic Institute and State University
in partial fulfillment of the requirements for the degree of
Doctor of Philosophy in
Biology
John J. Tyson, Chair Jill Sible
Edward Wojcik Robert C. Rogers Robert Wheeler
December 2003 Blacksburg, Virginia
Keywords: cell cycle, cyclin-dependent kinase, Saccharomyces cerevisiae
Copyright 2003, Laurence Calzone
Temporal organization of the budding yeast cell cycle: General principles and detailed simulations
Laurence Calzone
(ABSTRACT)
The budding yeast cell cycle has attracted attention from many experimentalists over the years for its simplicity and amenability to genetic manipulation. Moreover, the regulatory components described in budding yeast, Saccharomyces cerevisiae, are conserved in higher eukaryotes. The budding yeast cell cycle is governed by a complex network of chemical reactions controlling the activity of the cyclin-dependent kinases (CDKs), proteins that drive the major events of the cell cycle. The presence of these proteins is required for the transition from G1 to S phase (Start) whereas their absence permits the transition from S/M to G1 phase (Finish). The cell cycle of budding yeast is based on alternation between these two states. To test the accuracy of this theory against experiments, we built a hypothetical molecular mechanism of the budding yeast cell cycle and transcribed it into differential equations. With a proper choice of kinetic parameters, the differential equations reproduce the main events of the cell cycle such as: the synthesis of cyclins (Cln1,2; Cln3; Clb1,2; Clb5,6) by their transcription factors (SBF, Mcm1, MBF); their association with stoichiometric inhibitors (Sic1, Cdc6); their degradation by SCF and adaptors of the APC (Cdc20, Cdh1). The emphasis was put on mechanisms responsible for the release of Cdc14 from the RENT complex, Cdc14 being a major player in exit from mitosis. Simulations of the wild type strain and more than 100 mutants showed phenotypes in accordance with experimental observations. Some mutants defective in the Start and Finish transitions and the different ways to rescue them will be presented.

iii
Acknowledgements
I would like to thank my advisor, Professor John J. Tyson, for his patience and
encouragement. I am grateful to Dr. Kathy Chen from Virginia Tech, Professor Bela
Novak and my friend, Dr. Attila Csikasz-Nagy from the Technical University of
Budapest, Hungary for working with me and correcting my frequent errors throughout
my research. I also would like to thank other members of my committee, Drs Jill Sible,
Edward Wojcik, R. Rogers and R. Wheeler for their interest in my project. I am very
grateful to all the members of Tyson and Novak’s groups (Andrea Ciliberto, Jason
Zwolak, Chris I. Hong, and Bela Gyorffy) for their friendship and for all the wonderful
moments we spent together during all these years in Blacksburg and Budapest. I also
need to thank all my friends from France, South Africa, and the United States for their
moral support.
I dedicate this dissertation to my loving family and more especially to my nephew
Louis Moearii Consolin who brought more happiness to our family.
Que la vie te soit douce, p’tit loup!

iv
“The best test of our understanding of cells will be to make quantitative predictions about
their behavior and test them. This will require detailed simulations of the biochemical
processes taking place within [cells]. ... We need to develop simplifying, higher-level
models and find general principles that will allow us to grasp and manipulate the
functions of [biochemical networks].”
Hartwell, Hopfield, Leibler and Murray (1999). Nature 402:C47.

v
TABLE OF CONTENTS
Abstract................................................................................................................................ii
Acknowledgements..……………………………………………………………………..iii
List of Figures…………………………………………………………………………...viii
List of Tables……………………………………………………………………………..ix
Chapter 1: Introduction
1.1. The origin of “cells”……………………………………………………………...1
1.2. Basic properties of the cell cycle…………………………………………………2
1.2.1. Phases of the cell cycle……………………………………………………..3
1.2.2. DNA replication…………………………………………………………....3
1.2.3. Mitosis....…………………………………………………………………...3
1.2.4. Checkpoints………………………………………………………………...4
1.2.5. Regulation of cell cycle by cyclin dependent kinase……………………….4
1.3. Modeling.......................…………………………………………………………...5
1.3.1. The wiring diagram....………………………………………………………5
1.3.2. Method for modeling ………………………………………………………6
1.4. What can be found in this thesis ………………………………………………….6
Chapter 2: Modeling the molecular network that controls the budding yeast cell
cycle 8
2.1. Introduction……………………………………………………………………….8
2.1.1. Why budding yeast? ......................................................................................8
2.1.2. The budding yeast cell cycle………………………………………………..8
2.1.3. Cyclin-dependent kinases…………………………………………………..9
2.1.4. Cyclins…………………………………………………………………….10
2.1.5. How to regulate the dimer’s activity……………………………................12
a. Availability of the cyclins……………………………………………..12
b. Association with a stoichiometric inhibitor…………………………...13
2.1.6. The major actors of the cell cycle. Who does what?...................................14

vi
2.1.7. Hypotheses and verification through modeling…………………………...16
2.2. A simple model………………………………………………………………….17
2.2.1. Mathematical model……………………………………………………….17
2.2.2. Is the simple model enough?........................................................................20
2.3. A realistic model………………………………………………………………...21
2.3.1. The wild-type cells…………………………………...………………........22
2.3.2. Can the models do more than describe wild-type cells?..............................23
2.3.3. “Start” mutants…………………………………………………………….24
2.4. Components of the mitotic exit pathways……………………………………….26
2.4.1. Sister chromatids kinetics………………………………………………..27
2.4.2. MEN: Mitotic Exit Network..……………………………………………27
2.4.3. Exit from mitosis…………………………………………………………28
2.4.4. Checkpoint proteins……………………………………………………...28
Chapter 3: An improved version of the budding yeast cell cycle 30
3.1. Consensus picture……………………………………………………………….30
3.2. Modifications from Chen’s model (2000)……………………………………....32
3.2.1. Improved description of exit of mitosis…………………………………...32
3.2.2. Assumptions of the model………………………………………………...33
3.3. Mathematical model……………………………………………………………..36
3.3.1. The Wild-Type cell………………………………………………………..36
3.3.2. How do we know the model is wired properly?..........................................39
3.4. Mutants......……………………………………………………………………...39
3.4.1. “Finish mutants”…………………………………………………………..39
3.4.2. Checkpoint mutants……………………………………………………...42
3.4.3. MEN mutants and release of Cdc14……………………………………..45
3.4.4. APC-A mutants…………………………………………………………..46
3.4.5. The rest of the mutants.………………………………………………….48
3.5. What the model cannot explain.................……………………………………...48
3.5.1. Problems…………………………………………………………………48
3.5.2. The target model..................................................………………………..52

vii
3.6. What the model can predict...................………………………………………...53
Chapter 4: the web page 58
Chapter 5: The mammalian cell cycle and the MAP kinase pathway 65
5.1. Similarities between mammalian and the budding yeast cell cycle……………..65
5.2. Background of mammalian cell cycle…………………………………………...65
5.2.1. Zetterberg’s experiments………………………………………………….65
5.2.2. The core mechanism………………………………………………………69
5.3. MAPK Pathway...……………………………………………………………….70
5.3.1. Definition………………………………………………………………….71
5.3.2. Mathematical representation of responses………………………………...72
a. Michaelian response…………………………………………………...72
b. Sigmoidal response……………………………………………………72
c. All-or-none response…………………………………………………..73
5.3.3. MAP kinase pathway in Ferrell’s experiments……………………………73
5.3.4. MAP kinase pathway in mammalian cell cycle…………………………...76
5.3.5. Conclusions………………………………………………………………..80
Chapter 6: Conclusions 82
6.1. What mathematical can do!..................................................................................82
6.2. Open problems…………………………………………………………………..82
6.3. What is next?.........................................................................................................82
6.4. Last words.............................................................................................................84
References 85
Appendix
A1: Equations 95
A2: Parameters 101
VITA 103

viii
LIST OF FIGURES
1.1. Illustration of plant cells...............................................................................................2
1.2. Example of a wiring diagram.......................................................................................6
2.1. Cyclin-dependent kinase activation..............................................................................9
2.2. Antagonism between Cdc28/Clb2, and Cdh1 and Sic1..............................................16
2.3. A simple model: primitive eukaryote.........................................................................17
2.4. Bifurcation diagram of the simple model...................................................................19
2.5. Wiring diagram of the budding yeast cell cycle (Chen et al., 2000)..........................21
2.6. Simulation of a wild-type cell cycle...........................................................................23
2.7. Start mutants...............................................................................................................25
3.1. Consensus picture of the budding yeast cell cycle......................................................31
3.2. Flow chart of the Finish transition..............................................................................33
3.3. IE and APC core ........................................................................................................34
3.4. PPX and the FEAR pathway.......................................................................................36
3.5. Simulation of a wild type daughter cell......................................................................38
3.6. Simulations of “Finish” mutants.................................................................................41
3.7. Checkpoint mutants....................................................................................................44
3.8. MEN mutants..............................................................................................................46
3.9. APC-A mutants............................................................................................................47
3.10. Simulations of cdh1∆ sic1∆ and cdc6∆2-49 cdh1∆ sic1∆........................................53
3.11. Simulation of the quadruple mutant cln1∆ cln2∆ cln3∆ cdc6∆2-49........................56
3.12. Simulation of cdc20∆ pds1∆ + an extra-copy of CDC15.........................................56
3.13. Simulation of cdc20∆ pds1∆ + TAB6-1....................................................................57
3.14. Simulation of cdc20∆ pds1∆ clb5∆ + 1.5X NET1....................................................57
4.1. First page of the web site “Modeling the budding yeast”...........................................59
4.2. Equations/Parameters..................................................................................................61
4.3. The mutant page..........................................................................................................62

ix
4.4. Simulator.....................................................................................................................64
5.1. Experimental (a) and simulated (b) results of the first cycle of treated cells.............66
5.2. Simplified of effects of growth factors.......................................................................66
5.3. Second cell cycle. Experimental (a) and simulated (b) results...................................67
5.4. Cell treated at different times during the cell cycle....................................................68
5.5. Wiring diagram from Tyson and Novak, manuscript in preparation..........................69
5.6. The MAPK pathway...................................................................................................71
5.7. Michaelian response....................................................................................................72
5.8. Sigmoidal response.....................................................................................................72
5.9. One-way bistability.....................................................................................................73
5.10. Two-way bistability..................................................................................................73
5.11. Schematic representation of an irreversible bistable system....................................75
5.12. Rate balance plot.......................................................................................................76
5.13. ERG/LRG model......................................................................................................77
5.14. The MAP kinase cascade..........................................................................................78
5.15. Plot of MAPKKK, MAPKK, MAPK as a function of time......................................79
5.16. Bifurcation diagram when 2k =2...............................................................................80
5.17. Bifurcation diagram when 2k =5...............................................................................80
LIST OF TABLES
2.1. Table of regulatory proteins involved in the budding yeast cell cycle.......................26
3.1. List of mutants simulated by the model......................................................................40
3.2. List of predictions that the model suggests.................................................................54
5.1. Homolog proteins of mammalian and budding yeast cells and their function...........65
5.2. Nonlinear system of differential equations of the MAP kinase cascade....................79
1
Chapter 1: Physiology of the cell cycle
1.1. The origin of “cells”
The word “cell” (from the Latin, cella, “small room”) was used for the first time in
the seventeenth century by the physicist Robert Hooke. Known for developing one of the
most powerful microscopes of his time, Hooke published in 1665 a book, Micrographia*,
(London, 1665) where he reported detailed observations of plants, sponges, bird feathers
and other living creatures such as insects. Among his many descriptions, the one of the
cork drew much attention. It is in his book that he referred to the little “compartments” or
“units” that he could see as “cells”. What he could spot were in fact the cell walls (what
remained from the living cells). Later, as the techniques of microscopy improved, it
became possible to see ever more clearly the world of cells.
Based on Aristotle’s idea of “spontaneous generation”, many scientists believed
that living organisms emerged spontaneously from water and soil. Other scientists such
as Lazzaro and much later Pasteur refuted this hypothesis. In 1831, Brown characterized
the nucleus as a major element of living cells. A few years later, although both Schleiden
(1838) and Schwann (1839) still believed in the spontaneous generation hypothesis, they
formulated their famous “cell theory” that speculated that living things were composed of
cells and that the smallest living organism could be composed of one cell only. The
process of cell formation was then believed to be universal and through division of pre-
existing cells. It was Virchow who in 1855 stated omnis cellula e cellula (“all cells come
from cells”). These advances led to rapid discoveries concerning cells and their
constituents. Flemming, in 1882, first introduced the terms chromatin and mitosis to
describe the separation of chromosomes in salamanders (for a review, see Mazzarello,
1999).
A better understanding of the cell has helped uncover other mysteries of living
organisms and their internal organization, from the understanding that DNA codes for
genetic information to the characterization of proteins that drive the cell cycle. By
* Micrographia: or some Physiological Descriptions of Minute Bodies made by Magnifying Glasses. With Observations and Inquiries thereupon... London, John Martyn and James Allestry, 1665

2
examining the cell, scientists continue to work towards an understanding of the
fascinating machinery behind life itself.
Figure 1.1. Illustration of plant cells from Micrographia (1665)
1.2. Basic properties of cell cycle
During a cell cycle, a cell grows and divides into two daughter cells containing the
same genetic information (Murray and Hunt, 1993; Alberts et al., 1994). Before each
division, all the components of the cell need to be duplicated. Of these processes, DNA
replication (S phase) and chromosome segregation (M phase) are of special importance.
It is crucial that the genetic information is passed on to the next generation by a careful
duplication of DNA and a proper distribution of sister chromatids to each daughter cell.
In most eukaryotes, S and M phases are separated in time and alternating. If S phase
occurs repeatedly without an accompanying M phase, the cell remains viable with several
copies of DNA (endoreplication). No somatic cell is viable if cytokinesis occurs before
DNA has been properly replicated. S and M phases are separated by gaps G1 and G2
during which the cell checks if it is ready to move on to the next stage.

3
1.2.1. Phases of the cell cycle
The cell cycle can be divided in four phases, in the following order: G1, S, G2 and M.
During G1, the cell grows and prepares itself for S phase, during which DNA replication
occurs. From one double-stranded DNA molecule (chromosome), two identical double
stranded DNA molecules (called sister chromatids) are formed and held together by
cohesion proteins. G2 phase is the temporal gap between the end of replication and the
beginning of mitosis. During M phase, replicated DNA molecules are segregated to
daughter cells. The sister chromatids separate so that the daughter cells get one copy of
each chromosome. The cell cycle is the progression through these four phases (Murray
and Hunt, 1993).
1.2.2. DNA replication
DNA replication must occur only once per cycle. To ensure that DNA does not re-
replicate before mitosis, a network of proteins controls DNA synthesis. In late mitosis
and early G1 phase, some proteins prepare for DNA synthesis: ORC (origin recognition
complexes), MCM (Mini-chromosome maintenance) and proteins such as licensing
factors associate into a pre-replication complex. In early S phase, a family of proteins, the
Cdk/cyclins, phosphorylates the complex which allows the opening of a replication fork.
Once DNA synthesis has occurred, the same proteins that promoted DNA replication
inhibit the reformation of the pre-replication complexes. When these proteins degrade at
the end of mitosis, the pre-replication complexes can reform (Botchan, 1996; Wuarin,
1996).
1.2.3. Mitosis
The process of separating sister chromatids occurs in four different stages: prophase,
metaphase, anaphase, and telophase.
In prophase, the chromosomes condense and mitotic spindles form. At this time, each
chromosome consists of two sister chromatids. The chromatids are each carefully folded
up into very compact structures (condensed chromosomes), which are held together in
pairs at kinetochores situated at the centromere. In early prophase, thin fibers,
(microtubules) are assembling a bipolar spindle. The microtubules attach to the
4
chromosomes and pull them into alignment on the metaphase plate between the two poles
of the spindle. When aligned, one chromatid of each chromosome is attached by a
microtubule to one pole of the spindle, and the other sister chromatid is attached by
another microtubule to the other pole of the spindle. This brief cell state is called
metaphase. Triggered by a signal, the glue that holds the sister chromatids together is
dissolved allowing each chromatid, separated from its sister, to be pulled by the
microtubules to one of the poles of the spindle. The cell is now in anaphase. During
telophase, a nucleus reforms around each of the separated bundles of chromatids, and the
cell divides at the final step, cytokinesis, in two daughter cells. The daughter cells are
then back in G1 phase each having one copy of the genetic information of the mother cell
(Murray and Hunt, 1993; Alberts et al.. 1994).
1.2.4. Checkpoints
During cell division, mistakes are fatal. In order to avoid catastrophic failure, the cell
verifies that proper conditions are satisfied at crucial steps in the division process. As it
progresses through the division cycle, the cell halts at three checkpoints: in G1, G2 and
M phases.
Before entering S phase, the cell must be large enough and have undamaged DNA. If
these conditions are not met, the cell arrests in G1. When the conditions are satisfied, the
cell can enter S phase.
Before entering mitosis, at the G2 checkpoint, the cell verifies that DNA synthesis is
complete, DNA is undamaged and the cell is large enough.
In M phase, two criteria must be fulfilled. First of all, the chromosomes need to be
properly aligned and DNA replication needs to be complete. Secondly, the spindles need
to be oriented towards the daughter cell. When these conditions are verified, the
metaphase checkpoint is lifted and the cell can divide.
1.2.5. Regulation of cell cycle by cyclin dependent kinase
The proper alternation between the two phases, S and M, is coordinated by a
complicated network that regulates the activity of a family of key proteins. These proteins
are composed of two subunits: a catalytic subunit, the cyclin-dependent kinase, Cdk, and
5
a regulatory subunit, a cyclin (for reviews, see Morgan, 1995 and Pines, 1995). Cdk has
to associate with a cyclin partner to form a dimer and has to be appropriately
phosphorylated (a phosphate group is attached to Cdk) in order to be active.
On top of ensuring S/M alternation, the dimers also control cell size, and DNA
replication. Progression through cell cycle is orchestrated by the rise and fall of the
Cdk/cyclin dimers. There are different ways to regulate the activity of the dimers:
through synthesis of the cyclins which is induced by transcription factors, through
degradation of the cyclins, through association with stoichiometric inhibitors, and
through phosphorylation and dephosphorylation of Cdk (for review, see Mendenhall,
1998).
In 2001, the Nobel Prize was awarded to Lee Hartwell and Paul Nurse for their work
on the characterization of the major Cdk of budding yeast and fission yeast, Cdc28 and
Cdc2 respectively, and to Tim Hunt for discovering proteins (“cyclins”) that fluctuate
dramatically during early embryonic cell cycle in fertilized sea urchin eggs.
1.3. Modeling
Based on experiments, it is possible to build small diagrams that illustrate some parts
of cell cycle regulation. However, as the pieces (or modules) are wired together to form a
complete picture, the degree of complexity is increased tremendously. Hypothetical
diagrams such as Kohn’s (1999) that describes hundreds of interactions among proteins
involved in mammalian cell cycle control, reflect the kind of challenges that experimental
biologists have to face. For many organisms, the complexity of molecular regulatory
network has become so great that it is no longer possible to rely on intuition to predict
how these networks behave. There is a need of new techniques offered by mathematics or
computer science in order to understand the integrated behavior of molecular networks.
1.3.1. The wiring diagram
Mechanisms regulating interactions among proteins during a cell cycle are derived
from the literature. The experimental data is then organized into a consensus diagram.
Figure 1.2 is a simple example of a wiring diagram. Shapes (ovals or rectangles)
represent proteins, solid arrows represent biochemical reactions such as synthesis,

6
degradation, or binding, and dashed arrows represent influence of proteins on reactions.
The wiring diagram is translated into ordinary differential equations using laws of mass
action or Michaelis Menten kinetics. Each protein concentration is considered to be a
variable, and arrows represent reaction rates. If an arrow is pointing towards the protein,
the rate of change of protein concentration is positive, if it is pointing away, the rate of
change is negative. Nonlinear differential equations appear to be a good tool to describe
the temporal change of the concentration of proteins since all the components of the
system interact with each other.
Figure 1.2. Example of a wiring diagram
1.3.2. Method for modeling
First, all the relevant data known about the organism of interest are collected and
organized into a wiring diagram, as shown in previous paragraph. Equations are derived
from the diagram describing the cell cycle of the organism and an appropriate set of
parameters is chosen to fit experimental data (wild-type characteristics and mutant
phenotypes). If the solutions do not fit the data, the parameters need to be adjusted more.
If these adjustments are still not enough, the model is modified further and improved
(more proteins are added or the diagram is wired differently).
It is important to note, here, that the main goal of modeling is not to re-create an in-
silico cell but rather to suggest a possible mechanism that would explain the sequence of
events leading to cell division.
1.4. What can be found in this thesis …
Chapter 2 is an introduction of the budding yeast cell cycle. The characteristics of this
cell cycle will be illustrated first by a small model introduced by Tyson and Novak
(2001), then by a more complex model published by Chen et al. in 2000. A discussion of
Protein A
Protein B
7
new parts of the network (new proteins and their role in the cell cycle) will conclude the
chapter. These important pieces of the complete machinery will be in included in an
improved version of Chen et al. (2000) model in chapter 3. The newer version will offer
more details of important aspects of the cell cycle, such as mechanisms leading to exit
from mitosis. To accompany the model, a web page was created and will be presented in
chapter 4. The primary goal of studying the budding yeast is to get familiar with
pathways and mechanisms that can be observed in higher eukaryotes such as mammalian
cells. Chapter 5 will be a review of the mammalian cell cycle and the MAP kinase
pathway. Finally, chapter 6 will contain some closing comments and conclusions.

8
Chapter 2: Modeling the molecular network that controls the budding yeast cell cycle 2.1. INTRODUCTION
2.1.1. Why budding yeast?
The budding yeast, Saccharomyces cerevisiae, is a good candidate for modeling cell
cycle regulation for several reasons. First of all, its genome is fully sequenced, so we
have a complete list of all its genes and predicted protein sequences. Secondly, it is a
single cell organism. It is also haploid during some parts of the cell cycle. Therefore, the
budding yeast is easier to manipulate genetically. As a consequence, the molecular
interactions regulating Cdk activities have been dissected and studied in great detail.
Thirdly, many of the networks present in budding yeast are conserved in higher
eukaryotes, such as nematodes, fruit fly, frog, and mammalian cells. So knowledge
gained about the control of the budding yeast cell cycle can be used as the basis for
building regulatory networks of more sophisticated multicellular organisms.
A particularity of budding yeast lies in its asymmetric division. At division, mother
and daughter cells have different sizes (Hartwell and Unger, 1977; Lord and Wheals,
1980). To compensate for this difference, the daughter cell (the smaller cell) needs more
time than the mother cell to grow and to begin cell cycle events (G1 phase longer in the
daughter cell). Another peculiar aspect of budding yeast is that S and M phases partly
overlap, leaving no time for G2.
2.1.2. The budding yeast cell cycle
In budding yeast, there is only one cyclin-dependent kinase Cdc28 that is essential
for cell cycle progression. Cdc28 is always present and in excess, and there are nine
cyclins (Cln1-3, Clb1-6) that associate with Cdc28 very rapidly (for reviews, see Morgan,
1995; Pines, 1995; Mendenhall, 1998). Among these cyclins, Cln1 and 2 have similar
functions, as do Clb1 and 2, and Clb5 and 6. For simplicity, in the following discussion,
these redundant pairs will be treated as one (e.g., Cln2 represents the Cln1 and 2 pair).
According to the cyclin partner, Cdc28/cyclin dimers accomplish specific and different
tasks (the cyclin regulates the substrate specificity of the kinase). For instance,

9
Cdc28/Cln3 is largely responsible for activating transcription factors, Cdc28/Cln2 for the
initiation of bud emergence, Cdc28/Clb5 for the timing of DNA replication, and
Cdc28/Clb2 for the timing of mitotic events.
Nonetheless, the functions of Cdc28/cyclin dimers overlap. In the absence of Cln2,
budding is only delayed, indicating that other proteins (Cln3 and Clb5) might participate
less efficiently in the initiation of bud emergence. Similarly, Clb5 deletion only delays
DNA replication, because Clb2-kinase can also do the job. However, the lack of Clb2 is
lethal (G2 arrest), because other Cdk/cyclin complexes cannot initiate mitosis. Proper
progression through mitosis requires successive activation and inactivation of
Cdc28/Clb2. More details on the role and regulation of cyclins will be given later.
2.1.3. Cyclin-dependent kinase
The cyclin-dependent kinase Cdk associates with a cyclin partner to form a dimer.
As mentioned in section 1.2.5, the dimer activity is not only regulated by the availability
of cyclins or by stoichiometric inhibition, but also by phosphorylation. For instance, in
frog eggs, the phosphorylation on threonine 161 is required for Cdc2 to be active. On the
other hand, the phosphorylations on tyrosine 15 (and the adjacent threonine 14) inhibit
Cdc2. The phosphorylations are caused by a protein kinase, Wee1. They are then
removed by a phosphatase, Cdc25. The dimer is only fully active when phosphorylated
on threonine 161 (Figure 2.1).
Figure 2.1. Activation of the complex Cdk/cyclin requires successive phosphorylation and dephosphorylation of Cdk. Unphosphorylated Cdc2 associates with CycB to form an inactive dimer. Different kinases (Wee1 and CAK) phosphorylate the dimer at 3 sites (Thr 161, Tyr 15 and Thr 14). A phosphatase (Cdc25) activates the dimer by removing the inhibitory phosphate groups. CycB is then degraded and Cdc2 is released. Some unknown phosphatases dephosphorylate the last site of phosphorylation and Cdc2 is back to the unphosphorylated form.
Thr 14 Thr 161 Thr 161
CycB
Thr 161
Phosphorylation
Dephosphorylation
CycB
CycB CycB
Cdc2 Cdc2
Cdc2 Cdc2 Cdc2
Tyr 15
Dephosphorylation

10
During normal cell cycles in budding yeast, Cdc28/cyclin activity is not regulated
by phosphorylation. Swe1 (Wee1 homolog) is turned off by a mechanism triggered by the
bud. So by the time Clb2 is formed (and associates with Cdc28), Swe1 is gone and cannot
inhibit the dimer. When a defect in bud emergence occurs, Swe1 and Mih1 (Cdc25
homolog) play significant roles. If the cell does not bud, the protein kinase Swe1 does not
disappear and is present at the same time as Cdc28/Clb2. The dimer can then be inhibited
by Swe1-dependent phosphorylation and a delay in exit of mitosis is observed. This
special case is called the morphogenetic checkpoint (Ciliberto et al. in press, for details).
A deletion of CDC28 gene shows a defect in G1. No matter how large the cell gets,
it cannot move to the S phase.
2.1.4. Cyclins
There are many different types of cyclins, and the substrate specificity of the Cdk
subunit depends on its cyclin partner. This study lumps together Cln1 and 2 (“Cln2”),
Clb1 and 2 (“Clb2”), and Clb5 and 6 (“Clb5”).
The G1-cyclins control the Start transition (G1 to S phase):
• Cdc28/Cln3 (with the help of Bck2) initiates Start by activating transcription factors
of Cln2 and Clb5 (SBF and MBF respectively), when cell size reaches a critical value.
The level of Cdc28/Cln3 remains relatively constant throughout the cell cycle
(Wittenberg, 1990; Tyers, 1993). Cln3 also plays a major role in size control (Cross,
1988; Nash, 1988). For a low dosage of Cln3, cell size increases and for high dosage of
Cln3, cell size decreases. To support this idea, Miller and Cross (2001) constructed a
CLN3 mutant that deleted both the nuclear localization signal of Cln3 and some
sequences responsible for its degradation. As a consequence, Cln3 is abundant but not
necessarily in the nucleus where MBF and SBF exist. They then manipulated the import
and export of the protein in the nucleus. When a nuclear import signal is added (more
Cln3 in the nucleus), the cells showed a slight decrease in size, whereas when a nuclear
export signal is added (less Cln3 in the nucleus), the cells were much bigger.
• Cdc28/Cln2 induces budding. Cdc28/Cln2 inactivates Sic1 and Cdh1, proteins active
in G1 phase that keep Cdc28/Clbs level low. Thus, Cdc28/Cln2 promotes the Start
11
transition. Cln2’s transcription factor is SBF (Nasmyth, 1991) and its degradation is
activated by SCF (Deshaies, 1995).
The B-type cyclins control the S/G2/M transition:
• Cdc28/Clb5 participates in the initiation of DNA replication in S phase. Clb5 is
synthesized in G1. Its transcription factor is MBF and its degradation is activated by
Cdc20/APC (Shirayama, 1999). There is no activity of Clb5-kinase in G1 since the
stoichiometric inhibitor Sic1 is abundant and inhibits it (Schwob, 1994).
• Cdc28/Clb2 is essential for successful mitosis. Clb2’s transcription factor is Mcm1,
which is activated by Clb2-kinase itself, creating a positive feedback. Mcm1 also
activates the synthesis of Cdc20 (Prinz, 1998). Cdc20, in combination with the APC,
then partially degrades the cyclin (Yeong, 2000; Baumer, 2000) and later Cdh1/APC
completely gets rid of Clb2 at the end of M phase (Visintin, 1997). Cdc28/Clb2 also
forms inactive complexes with Sic1 and Cdc6 (Mendenhall, 1993; Elsasser, 1996).
If the G1-cyclins are deleted (triple deletion cln1∆ cln2∆ cln3∆), the mutant cell
arrests in G1 (Richardson, 1989). On the other hand, as mentioned in section 2.1.2, if
only one class of the G1 cyclins is deleted (cln1∆ cln2∆ or cln3∆), the transition to S
phase occurs but the cell divides at a larger mass than wild-type (Dirick, 1995). Even
though the cell takes more time to reach the requirement for entry in S phase, other
cyclins, namely Cln2, Cln3 or Clb5 (in combination with Cdc28) are able to make up for
the missing one.
Cdc28/Clb5 is responsible for the initiation of DNA replication. A deletion of Clb5
retards the onset of DNA synthesis (Schwob, 1993), indicating that other proteins,
namely Cdc28/Clb2, might participate in the initiation of DNA replication in S phase.
Cdc28/Clb5 (with the help of Cdc28/Clb2) ensures that DNA is replicated only once
before mitosis occurs (Hartwell, 1971; Schwob, 1994). To be competent for replication,
some proteins e.g., Cdc6, ORC (origin recognition complexes), and MCM (mini-
chromosome maintenance), must be loaded on to DNA strands at the end of mitosis and
during G1 phase. When Cdc28/cyclins are active, some of these proteins are
phosphorylated and degraded. Hence, after replication begins, newly replicated origins
cannot be re-licensed. Their competence can be restored only after Clb5 and Clb2 are
degraded at the end of mitosis.
12
Cdc28/Clb2 appears to be an essential element of the cell cycle. Its deletion (i.e.
clb1∆ clb2∆) provokes a cell cycle arrest (G2 arrest), which emphasizes its key role in
regulating cell cycle events (Surana, 1991).
2.1.5. How to regulate the dimer’s activity
There are different ways to regulate the activity of Cdc28/cyclin dimers. The first
thing to consider is the availability of the proteins forming the dimers. The cyclin-
dependent kinase Cdc28 is not fluctuating much during the cell cycle. It is therefore
always available. On the other hand, the cyclin partner is cell cycle regulated and its
availability is important for the activity of the dimer. The level of the cyclins varies
throughout the cycle as they are synthesized and degraded. Lastly, the dimer activity is
also controlled by association with a stoichiometric inhibitor. In brief, the dimers can be
regulated by availability of the cyclins and by association with a third protein to form
inactive complexes. Since Cdc28/Clb2 is so crucial in cell cycle events, we will analyze
the different ways to shut the dimers’ activity down.
a. Availability of the cyclins
The first way to regulate Clb2 level is through synthesis. Cdc28/Clb2 activates its
own transcription factor, Mcm1 (Amon, 1993). Therefore when Mcm1 is inactive, Clb2
is not synthesized, and Cdc28/Clb2 activity is low. On the other hand, if Mcm1 is active,
Cdc28/Clb2 activates rapidly.
The second way to control Cdc28/Clb2 activity is through degradation. Two major
components of the APC, Cdc20 and Cdh1 (Visintin, 1997), activate the degradation of
Cdc28/Clb2. The degradation is done through ubiquitination. An ubiquitin-dependent,
proteolytic pathway is known to drive the cell out of mitosis. (Ubiquitin is a small
protein; it labels specific proteins for destruction by the cell’s protein degradation
machinery.) Cdc20 and Cdh1 find their target, here Clb2, and present it to the APC for
ubiquitination. Once the target protein is tagged, it is quickly recognized by proteasomes
and degraded.
The synthesis of the first adaptor protein of the APC, Cdc20, is controlled by Mcm1,
the same transcription factor as Clb2 itself (Spellman, 1998; Zhu, 2000; Simon, 2001).

13
Among other targets, Cdc28/Clb2 is known to phosphorylate APC core proteins, Cdc16,
Cdc23 and Cdc27 (Rudner, 2000). The phosphorylated form of the APC binds to Cdc20
more easily. When bound to the APC, Cdc20 becomes active. Nonetheless, even in the
presence of Clb2-kinase, Cdc20 remains inactive until the chromosomes properly align
on the metaphase plate. Mad2, a checkpoint protein, binds to Cdc20 and keeps it inactive
until microtubules attach to the kinetochores of all chromosomes (Gardner, 2000). Even
one unattached kinetochore blocks Cdc20 activation. In wild-type cells though, a deletion
of MAD2 does not affect the cycle. This result indicates that the cell still has time to align
its chromosomes on the metaphase plate even in the absence of the checkpoint protein.
Cdc20 is then degraded by the APC itself at the end of mitosis and in early G1
(Shirayama, 1998; Prinz, 1998).
Cdc20 is an essential protein. The mutant cdc20ts is lethal. It arrests in metaphase
(Sethi, 1991; Shirayama, 1998) with high Cdc28/Clb2 activity and unattached sister
chromatids.
The other adaptor protein of the APC, Cdh1 triggers the degradation of Clb2 in
telophase (Baumer, 2000; Yeong, 2000). The protein is inactive during S/G2/M but
remains fairly stable throughout the cycle (Zacchariae, 1998, Jaspersen, 1999). Cdh1
needs to be in its unphosphorylated form to bind to the APC (Zacchariae, 1998,
Jaspersen, 1999). The phosphorylation of Cdh1 is Cdk-dependent, and Cdc28/Clb5
phosphorylates Cdh1 most readily (Shirayama, 1998). In late telophase, the phosphatase
Cdc14 activates Cdh1 (Visintin, 1997). A deletion of CDH1 is viable (Schwab, 1997).
b. Association with a stoichiometric inhibitor
The third way to decrease Cdc28/Clb2 activity significantly is through association
with cyclin inhibitors. The resulting trimer is inactive. In the model, there are two such
inhibitors, Sic1 and Cdc6.
Sic1 binds to Cdc28/Clb5 and Cdc28/Clb2. Its synthesis is activated by Swi5 and its
degradation is SCF-dependent (Verma, 1997). In late mitosis, the phosphatase Cdc14
both stabilizes Sic1 and activates the transcription factor, Swi5. Cdc28/Cln2 turns Sic1
off in late G1.

14
Cdc6 regulation is very similar to that of Sic1. Its transcription factors are Swi5 and
MBF (Piatti, 1995), and Cdc6 is also degraded in a SCF-manner (Elsasser, 1999). Cdc14
activates Cdc6 in late mitosis, but Cdc6 becomes unstable in early S phase. There is some
evidence that Cdc6 is not only a stoichiometric cyclin-dependent kinase inhibitor
(Calzada, 2001, Elsasser, 1996, Bueno, 1992), but also a licensing factor needed for entry
in S phase (Liang, 1997; Bueno, 1992). For simplicity, in the model, we ignore its second
function.
By analyzing the phenotypes of various mutants, we can conclude that Sic1 is a
stronger inhibitor of Cdc28/Clb5 than is Cdc6, but that both Sic1 and Cdc6 bind
efficiently to Clb2. Several mutants justify these assumptions. For instance, in the mutant
GAL-CLB5 (over-expression of CLB5), there is no advance in DNA synthesis. With so
much Clb5, initiation of DNA would be expected to occur early, but because Sic1 (or
Cdc6 or both) is a good inhibitor of Cdc28/Clb5, no advance is observed. On the other
hand, the G1 phase of the mutant sic1∆ is shorter than the G1 phase of the wild-type
(Schneider, 1996) indicating that Cdc6 does not inhibit Cdc28/Clb5 strongly enough to
delay DNA synthesis (assumption verified by Archambault et al, 2003). On the contrary,
Cdc6 is a strong inhibitor of Cdc28/Clb2 since the quadruple mutant cln1∆ cln2∆ cln3∆
sic1∆ is viable but large with a long G1 phase. In this mutant, since we established that
Cdc6 is a weak inhibitor of Cdc28/Clb5, Clb5-dependent kinase activity comes up slowly
even in the presence of Cdc6. Eventually it reaches high enough activity to phosphorylate
and inactivate Cdc6. It is only when Cdc6 disappears that Clb2-dependent kinase activity
can rise.
2.1.6. The major actors of the cell cycle. Who does what?
Although the activity of the dimers and their antagonists was thoroughly discussed in
the previous section, it is still not obvious how they interact during a cell cycle. The next
question to answer is: who does what and when?
Throughout the cell cycle, Cdc28/Clb2 dimers alternate between low and high
activity. Cdc28/Clb2 needs to be present at certain stages to trigger major events such as
mitosis, and it must be removed at other phases in order to allow proper advance in the
cell cycle. To ensure its removal, Cdc28/Clb2 is opposed by antagonist proteins that have
15
the ability of shutting it down. These antagonists are CKIs (Cyclin-dependent Kinase
Inhibitors) and Cdh1.
Cdc28/Clb2 also has a negative effect on Cdh1 and CKIs. Cdc28/Clb2
phosphorylates and inactivates both of them. When Cdc28/Clb2 is absent, the antagonists
have high activity (G1 state) and when Cdc28/Clb2 is present, the antagonists have low
activity (S/G2/M state). Due to this mutual antagonism, the two states, G1 and S/G2/M,
are often viewed as two alternative self-maintaining steady states (Nasmyth, 1996, and
Tyson and Novak, 1996, 2001). The next question one can ask is how the system gets
from one state to another. There exist some “helper” proteins that push the cell through
the two transitions from G1 to S (which is called “Start”) and from M back to G1 (often
called “Finish”).
Figure 2.2 is a simplified version of the known mechanism that describes how these
major actors interact with each other. Cdc28/Cln2 appears to be the helper protein for the
Start transition, whereas Cdc20 forces the system through the Finish transition. In early
G1, Cdc28/Clb2 activity is off and the antagonist proteins are high and active (stage 1 in
figure 2.2). As the cell grows and reaches a certain size, Cdc28/Cln2 is synthesized (stage
2). Cdc28/Cln2 phosphorylates and inhibits the antagonist proteins. Because Cdc28/Cln2
cannot be inhibited by CKIs, nor can it be degraded by Cdh1, it is able to help
Cdc28/Clb2 come up (stage 3). Once Cdc28/Clb2 dimers are active, they are able to keep
the antagonist proteins inactive without continued help from Cdc28/Cln2. Cdc28/Clb2
then turns off production of the helper protein Cdc28/Cln2, to prepare the cell for the next
transition (stage 4). Later, Cdc28/Clb2 activates its own destruction through Cdc20 with a
certain delay (stage 5). However, Cdc20 does not turn on until all the chromosomes are
properly aligned on the metaphase plate. When Cdc20 is activated, the Cdc20/APC
complex is formed and Cdc28/Clb2 is degraded to a lower level to prepare the cell for the
Finish transition (stage 6). Cdc20 also triggers mitotic exit through the activation of
complex pathways that lead to the activation of Cdh1 and CKIs, resulting in the total
inactivation of Cdc28/Clb2 dimers. When Cdc28/Clb2 level drops, the cell exits from
mitosis. At the same time, Cdc20 rapidly disappears (stage 7). The cell is then back in G1
(stage 8 = stage 1).

16
Figure 2.2. Simple wiring diagram describing the antagonism between Cdc28/Clb2, Cdh1 and Sic1. When Cdc28/Clb2 is low, the antagonist proteins are high, and vice versa. The alternation between these two states is driven by the helper proteins Cdc28/Cln2 (controlled by size) and Cdc20 (monitored by proper chromosome alignment). The activities of these helper proteins are transient; after doing their jobs, they are removed. The stages 1-8 in the lower part of the figure are described in the text. 2.1.7. Hypotheses and verification through modeling
The basic mechanism presented above is a believable but intuitive story. How do we
know that the story is true? Are we sure that the experiments are properly understood and
interpreted? The answer is no. One cannot, with confidence, affirm that the system
behaves exactly as stated earlier. To explain in quantitative detail such networks and
verify these hypotheses, these kinds of mechanisms are translated into mathematical
models based on realistic biochemistry of the control system. The intuitive explanation of
the cell cycle described above can be verified by studying a simple model that illustrates
the basic functioning of the network control.
Cdc28/Clb2
Cdc20 Cdc28/Cln2
sizeUnaligned chromosomes
Cdh1, Sic1
Cdc20Cdc28/ Cln2
Cdc28/Clb2
Cdh1, Sic1 1
2
3 6
7
8
G1 S/G2/M G1
4 5
time
time

17
2.2. A SIMPLE MODEL: A PRIMITIVE EUKARYOTE
2.2.1. Mathematical model
In an article, Tyson and Novak (2001) presented a simple case where only one
cyclin, Clb2, and one antagonist protein, Cdh1, are considered. Cdc28/Clb2
phosphorylates and inactivates Cdh1 whereas Cdh1 degrades Clb2. In the equations,
Cdc28/Clb2 concentration is simply referred to as [Clb2]. The interaction between Clb2
and Cdh1 is shown in figure 2.3 a.
(a)
(b) Figure 2.3. (a) Clb2 and Cdh1 antagonism. Clb2 phosphorylates and inactivates Cdh1, which in turn, labels Clb2 for proteolysis. Plain arrows represent biochemical reactions and dashed arrows indicate the influence of proteins on a reaction. (b) Phase portrait for the dynamical system (1) and (2) The solid line is the Clb2-nullcline, where d[Clb2]/dt=0. The dashed lines are Cdh1-nullclines, where d[Cdh1]/dt=0, for indicated values of R. At the intersection of nullclines, the dynamical system has a steady state solution, either stable (●) or unstable (○). The parameter R is a function of the concentrations of the helper proteins, [Cln2] and [Cdc20]. The parameters for the system are:
' '' ' " ' "syn deg deg a a i i a i0.07, =0.05, =3, =0.2, =1, =0.2, =1, = =0.05k k k k k k k J J= .
Clb2 Cdh1
Cln2
Mass
Cdc20
Cdh1 Chromosome Alignment
0.01 0.1 10.0
0.5
1.0
R=40 R=20 R=3
S/G2/M
ln(Clb2)
Cdh1 G1
18
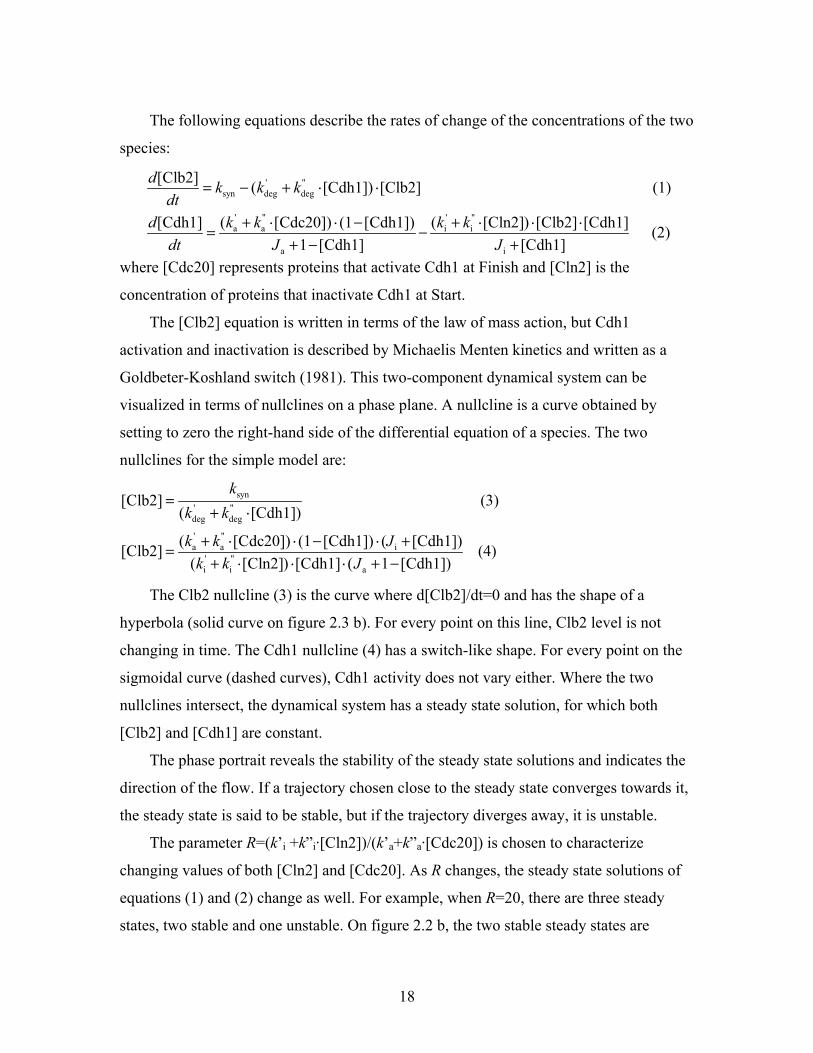
The following equations describe the rates of change of the concentrations of the two
species:
where [Cdc20] represents proteins that activate Cdh1 at Finish and [Cln2] is the
concentration of proteins that inactivate Cdh1 at Start.
The [Clb2] equation is written in terms of the law of mass action, but Cdh1
activation and inactivation is described by Michaelis Menten kinetics and written as a
Goldbeter-Koshland switch (1981). This two-component dynamical system can be
visualized in terms of nullclines on a phase plane. A nullcline is a curve obtained by
setting to zero the right-hand side of the differential equation of a species. The two
nullclines for the simple model are:
syn' "deg deg
' "a a i
' "i i a
[Clb2] (3) ( [Cdh1])
( [Cdc20]) (1 [Cdh1]) ( [Cdh1])[Clb2]( [Cln2]) [Cdh1] ( 1 [Cdh1
kk k
k k Jk k J
=+ ⋅
+ ⋅ ⋅ − ⋅ +=+ ⋅ ⋅ ⋅ + −
(4)])
The Clb2 nullcline (3) is the curve where d[Clb2]/dt=0 and has the shape of a
hyperbola (solid curve on figure 2.3 b). For every point on this line, Clb2 level is not
changing in time. The Cdh1 nullcline (4) has a switch-like shape. For every point on the
sigmoidal curve (dashed curves), Cdh1 activity does not vary either. Where the two
nullclines intersect, the dynamical system has a steady state solution, for which both
[Clb2] and [Cdh1] are constant.
The phase portrait reveals the stability of the steady state solutions and indicates the
direction of the flow. If a trajectory chosen close to the steady state converges towards it,
the steady state is said to be stable, but if the trajectory diverges away, it is unstable.
The parameter R=(k’i +k”i·[Cln2])/(k’a+k”a·[Cdc20]) is chosen to characterize
changing values of both [Cln2] and [Cdc20]. As R changes, the steady state solutions of
equations (1) and (2) change as well. For example, when R=20, there are three steady
states, two stable and one unstable. On figure 2.2 b, the two stable steady states are
' "syn deg deg
' " ' "a a i i
a i
[Clb2] ( [Cdh1]) [Clb2] (1)
( [Cdc20]) (1 [Cdh1])[Cdh1] ( [Cln2]) [Clb2] [Cdh1] (2)1 [Cdh1] [Cdh1]
d k k kdt
k kd k kdt J J
= − + ⋅ ⋅
+ ⋅ ⋅ − + ⋅ ⋅ ⋅= −+ − +

19
designated as G1 (with high Cdh1 and low Clb2) and as S/G2/M (with low Cdh1 and
high Clb2). When R is increased (R=40), the Cdh1 nullcline (dashed curve) moves to the
left, two of the steady states, the G1 stable steady state and the unstable steady state,
merge and disappear and only the S/G2/M stable steady state remains. When R is
decreased (R=3), the Cdh1 nullcline shifts to the right. The S/G2/M stable steady state
and the unstable steady state merge and disappear and only the G1 stable steady state is
left.
To better understand this result, steady state values of Clb2 are plotted as a function
of the parameter R (Figure 2.4). This figure is called a one-dimensional bifurcation
diagram. It allows to keep track of the different kinds of solutions for different values of a
key parameter. In figure 2.4, the competition between Clb2 and Cdh1 reveals a bistable
behavior: for range of R values, there exist two stable solutions, where Clb2 is either
active or inactive.
Figure 2.4. Bifurcation diagram: A graph of steady-state Clb2 activity as a function of the parameter R reveals a hysteresis loop. Dashed curve: as the activity of Cdc28/Cln2 rises and falls, R moves to the right, triggering the Start transition, and then back to the left. Dotted curve: as the activity of Cdc20 rises and falls, R moves to the left, triggering the Finish transition, and then back to the right.
Early in G1, R has the value k’i / k’a because both Cln2 and Cdc20 are “off”. As
mass increases, Cln2 is synthesized, and as a consequence, R increases too, traveling to
the right on the lower branch of the diagram. When Cln2 reaches a threshold value, Cdh1
is inactivated and Clb2 level can come up. The system undergoes the first transition
(Start) at R≈30 and jumps to the upper branch of stable steady states corresponding to the
S/G2/M state. As Clb2 activates, it turns off Cln2 by inhibiting SBF. As a result, R
G1
Start
Finish
S/G2/M
' 'i ak k
ln(Clb2) 1
0 3 40
' "i i
' "a a
[Cln2][Cdc20]
k kRk k
+ ⋅=+ ⋅

20
decreases and the control system is now moving to the left on the upper branch towards
the value R= k’i / k’a, where Cln2 and Cdc20 activities are again zero. Another job of
Clb2 is to activate its degradation pathway through Cdc20. Since Cdc20 is in the
denominator of R, when Cdc20 increases, R decreases. The control system keeps moving
to the left on the upper branch until the second threshold value is reached (R≈5). At this
point, the system loses stability again and undergoes the reverse (Finish) transition. Cdh1
is activated again and Clb2 is totally degraded. As a consequence, the system is back in
G1 and returns to the starting point as [Cdc20] disappears.
These threshold values (R≈5 and 30) are called saddle node bifurcation points and
correspond to the merging and disappearance of two steady states, one stable and one
unstable. At these saddle node points, two irreversible transitions occur. For example,
when the cell moves from G1 to S/G2/M, it commits itself to a new round of DNA
synthesis and mitosis, and it cannot go back to G1 before executing the second transition
(S/G2/M to G1) to complete the cell cycle. This behavior is called hysteresis. In a real
cell, the irreversibility of the transitions is also observed. Once a cell moves to S/G2/M
phase by action of Cln2-kinase, a small drop of Cln2 activity should not bring the cell
back to G1. Similarly, once the cell has degraded its Clb2, separated its sister chromatids
and exited from mitosis to the G1 state by action of Cdc20, a small perturbation of Cdc20
activity should not bring it back to the mitotic state. Therefore, the budding yeast cell
cycle can be defined as an excursion around a hysteresis loop driven by growth (for Start
transition) and the state of the chromosomes (for the Finish transition).
In addition to Cdh1, if a second antagonist protein Sic1 is included, the bifurcation
diagram would look very similar. The hysteresis loop would still exist, since, in this
model, Sic1 and Cdh1 have the same role and similar regulation.
2.2.2. Is the simple model enough?
The simple version of the budding yeast cell cycle is far from representing reality. If
the interest is to understand the details of cell cycle events, it is necessary to study a more
complicated model that would give more insight about the physiology of the budding
yeast cell cycle. Based on experiments, Chen et al. (2000) built a more detailed

21
mechanism that describes the complex machinery ensuring proper DNA replication and
chromosome segregation.
2.3. A REALISTIC MODEL
Chen et al. (2000) used a computational approach to study a consensus picture of
cell cycle control in budding yeast (Figure 2.5) built on a wealth of published
biochemical and genetic studies. Can this hypothetical mechanism account in quantitative
detail for all that is known about the physiology of the cell cycle in budding yeast? To
answer this question, each reaction in the wiring diagram is translated into mathematical
terms, and the integral behavior of the system as a whole is studied by computer
simulation.
Once the equations are properly written, a suitable set of parameters that accurately
reproduces cell cycle events must be proposed. Then the differential equations are solved
numerically using a program, WinPP, created by B. Ermentrout (2002). The numerical
solutions must give an accurate description of wild-type and mutant cells by faithfully
describing the cycle time, the timing of bud emergence, the length of the G1 phase for
both daughter and mother cells, the timing of DNA replication, and the ratios of various
cyclins and their inhibitors.
The focus of Chen’s paper (2000) is a description of protein interaction involved
in the Start transition in budding yeast cells.
Figure 2.5. Wiring diagram of the budding yeast cell cycle (Chen et al., 2000). Reprinted from Molecular Biology of the Cell (2000, vol. 11, pgs. 369-391) with permission by the American Society for Cell Biology. Cdc28, combines with cyclins to drive the major events of the cell cycle (bud emergence, DNA synthesis and mitosis) is not indicated on the diagram. Cdc28 subunits are present in excess throughout the cell cycle, so it must be imagined that a Cdc28 subunit is associated with each of the cyclin proteins in the diagram (Cln2, Cln3, Clb2, Clb5).

22
2.3.1. The wild-type cells
Figure 2.6 shows a simulation of a wild-type daughter cell. The cell is born at a
small mass and is divided according to specific rules (Chen et al., 2000 for details). In
wild-type cells, in early G1, Cln3 is present but Cln2, Clb5 and Clb2 are not present.
During G1 phase, several proteins antagonize the B-type cyclins, Clb2 and Clb5. Sic1
binds to Cdc28/Clb dimers to form inactive trimeric complexes. In addition, Clb proteins
are labeled for degradation by the APC (Anaphase Promoting Complex), in conjunction
with Cdh1, which targets Clbs to the APC. During G1 phase, Sic1 is abundant and Cdh1
active.
Although Cdc28/Cln3 level is never fluctuating very much throughout the cycle,
its amount in the nucleus is somehow related to cell size control (Cross, 1988; Nash,
1988; Dirick, 1995), but the details are not yet well understood (for more details, see
section 2.1.4) . In the model, [Cln3] is function of its dosage. It is described as an
increasing saturating function: 0 n3
n3 n3
mass[Cln3] mass
C DJ D
⋅ ⋅=+ ⋅
, where C0 is the maximal
concentration of Cln3, Dn3 is its dosage and Jn3 determines how fast Cln3 saturates. When
cell size reaches a threshold, Cln3 activates the transcription factors of Cln2 and Clb5
(called SBF and MBF, respectively). Cdc28/Cln2 and Cdc28/Clb5 are then formed.
Although Cdc28/Clb5 level rises, it is inhibited by Sic1. Since Cdc28/Cln2 cannot
be inhibited by Sic1, these dimers can phosphorylate Sic1, making it more susceptible to
degradation mediated by SCF (an APC-like complex that labels specific proteins for
proteolysis). As Sic1 is degraded, Cdc28/Clb5 becomes active and phosphorylates Cdh1,
causing Cdh1’s complete inactivation. As a consequence, Cdc28/Clb2 starts to
accumulate and activates its own transcription factor (Mcm1) through a positive
feedback. Active Cdc28/Clb2 opposes Mad2 in controlling the activity of Cdc20. Mad2
binds to Cdc20 and prevents the binding of Cdc20 to the APC. When all chromosomes
are properly aligned on the mitotic spindle, Mad2 turns off, and Cdc20 can be fully
activated by Cdc28/Clb2. Clb2 and Clb5 are then degraded, and Sic1 and Cdh1 are
reactivated at the end of mitosis. (For detailed references about the regulation of cell
cycle of budding yeast, see reviews by Kock, 1994; Futcher, 1996; Mendenhall, 1998;
Chen et al., 2000).

23
Figure 2.6. Simulation of a wild-type cell cycle. Concentrations of proteins are plotted as a function of time. The cycle time of a daughter cell is about 145 min. Just before division, the active form of Cdc20 (purple curve) increases abruptly to a value of 0.7, which triggers the activation of Cdh1 (dark blue curve). Together, they cause the precipitous degradation of Clb2 (red curve) and cell division. Notice that cell division is slightly asymmetric (mass at division=1.55, mass of daughter cell at birth=0.65). The solid arrows show cell divisions. 2.3.2. Can the models do more than describe wild-type cells?
If the only purpose of modeling were to describe the wild-type cell, the difficulty of
writing down and parameterizing the differential equations would be minor. But the
model also needs to account for all the different phenotypes observed in various mutants.
If a mutant is viable, then its properties, such as advance in DNA replication, or bigger
size than wild-type at division, need to be modeled. If a mutant is inviable, the problem
that causes it to die must be investigated.
Deletion of a gene is modeled by setting the synthesis rate of the corresponding
protein to zero; over-expression by assigning a high value to a non-regulated synthesis
parameter; multiple copies of a gene by multiplying all the synthesis constants by a
common factor; and temperature-sensitive mutants by reducing (by a certain percentage)
all the rate constants associated to the mutant protein. Also, when a mutant is put in a
different medium, the growth rate is adjusted in the simulations. When simulating a
mutant, the only changes allowed are the ones dictated by the experiments and no other
parameters can be modified. To successfully simulate dozens of mutants in this fashion
places a lot of constraints on the choice of parameters.
CKI
Cdh1
Cln2
Clb2
Cdc20 Clb5
Concentration (a.u.)
Time

24
For instance, for a temperature sensitive cdc20 mutant, the cell arrests in metaphase
(the chromosomes align on the mitotic spindle but the sister chromatids do not separate,
Shirayama, 1999). To simulate cdc20ts, the activity of Cdc20 is set to zero (or close to
zero). The simulation shows that cdc20ts never divides, Clb2 level remains high, and
Esp1, the protease responsible for sister chromatid separation is not activated.
2.3.3. “Start” mutants
Another example is the triple-deletion mutant cln1∆ cln2∆ cln3∆. It was mentioned
earlier (in section 2.1.4) that some proteins are needed for triggering Start transition.
What happens when these proteins are deleted? The helper proteins for the Start
transition are the Cdc28/Clns. In the absence of the G1 cyclins, the cell is not able to bud,
and Cdh1 and Sic1 remain active. Because Clb5 is inhibited by Sic1, and Clb2 cannot
come up, the cell is not able to initiate DNA synthesis and exhibits a G1 arrest phenotype
(Richardson, 1989). However, in the simulation (Figure 2.7 a), even though the mutant
remains in G1 for a long time (396 min with mass=6.2), the cell eventually accumulates
enough Clb5 to inactivate Sic1 and Cdh1 and drive the cell into S/G2/M. In the model,
Chen et al. assume that the cell is dead if it has not initiated DNA synthesis by the time it
reaches mass=5.
The G1-cyclins have several targets. When one of these targets is deleted, the cell
cycle advances. Therefore, a deletion of CDH1 allows cells to undergo the Start transition
earlier than in the triple mutant. In the quadruple mutant, Clb2 is not degraded as much
and the small amount of Clb2 present in G1 can initiate DNA synthesis earlier. In the
simulation (Figure 2.7 b), the mutant barely passes the G1 criterion for an arrest. But in
reality, the experiments show that the cells do not arrest uniformly. Some cells arrest with
two copies of DNA while other cells remain arrested in G1 with only one copy of DNA
(Schwab, 1997), which could explain why in our model, the G1 arrest is not so tight.
In the case of an additional deletion of SIC1, since Clb5 is not inhibited by Sic1 and
poorly inhibited by Cdc6, the small amount of Clb5 can activate SBF (and MBF). When
MBF is on, Clb5 is synthesized rapidly and DNA synthesis occurs even in the absence of
the G1 cyclins. This quadruple mutant is viable but large with a longer G1 than wild-type

25
(Tyers, 1996). In the simulation (Figure 2.7 c), the cells are bigger than wild-type in
accordance with observations.
(a)
(b)
(c) Figure 2.7. (a) The triple mutant cln1∆ cln2∆ cln3∆ arrests in G1. (b) An additional deletion of CDH1advances the cell in its cycle but the quadruple mutant arrests in metaphase. (c) An additional deletion of SIC1 rescues the lethality of the triple mutant and the quadruple mutant is viable and big.
In Chen et al. (2000) paper, 50 mutants were listed. Roughly, 90% of the simulated
mutants fit the experiments. The remaining 10% show weaknesses of the model
Cdh1
Clb5
Mass
Clb2
Cdc20
Sic1 Cdh1
Clb5
Mass
Sic1
Clb5
Mass
Clb2
Sic1
Clb5
Mass
Clb2
Cdc20
Concentration (a.u.)
Time
Time
Concentration (a.u.)
Time
Concentration (a.u.)

26
indicating where refinement is needed. The model is still incomplete, though. As more
proteins are added to describe more aspects of the cell cycle, the complexity of the model
increases. The mitotic exit pathways of this model, especially, need major improvements.
2.4. COMPONENTS OF THE MITOTIC EXIT PATHWAYS
Apart from the cyclins and their antagonists, many other proteins that participate in
the regulation of the budding yeast cell cycle have been identified and studied
thoroughly. Along with the proteins already mentioned in the previous sections, the major
ones (in bold) are listed below:
Cdc28 Cyclin dependent kinase. Cln3 G1-cyclins initiating Start events. Bck2 Protein initiating Start events. Cln1,2 Cyclins involved in budding (represented as Cln2 in the model).
Clb5,6 B-type cyclins appearing late in G1, involved in DNA synthesis (represented as Clb5 in the model).
Clb1,2 B-type cyclin essential for mitosis, present in S/G2/M phase (represented as Clb2 in the model).
Cdh1 Activator of the APC, protein involved in Clb2 proteolysis. Sic1 Stoichiometric inhibitor of CDC28/Clb2 and CDC28/Clb5.
Cdc6 Stoichiometric inhibitor of CDC28/Clb2 and CDC28/Clb5. Also involved in DNA licensing.
IE Intermediary enzyme. Hypothetical protein in activating Cdc20.
Cdc20 Activator of the APC, required for exit from mitosis. Pds1 Stoichiometric inhibitor of Esp1 that prevents sister chromatid separation.Esp1 Separin protein required for sister chromatid separation. PPX Hypothetical phosphatase keeping Net1 unphosphorylated and active.
Mad2 "Mitosis Arrest Deficient". Checkpoint protein keeping Cdc20 inactive until the chromosomes are properly aligned.
Bub2 "Budding Uninhibited by Benomyl". Checkpoint protein governed by spindle orientation.
Lte1 GTP-exchange factor, present in the bud. Activator of Tem1. Tem1 GTP-binding protein. Component of the MEN pathway.
Cdc15 Kinase essential for late nuclear division. Component of the MEN pathway.
Net1 Nucleolar protein, stoichiometric inhibitor of Cdc14.

27
Cdc14 Phosphatase required for exit of mitosis. Swi5 Transcription factor for Sic1 and Cdc6. SBF Transcription factor for Cln2. Mcm1 Transcription factor for Clb2. MBF Transcription factor for Clb5. Table 2.1. Table of regulatory proteins involved in the budding yeast cell cycle (the proteins in bold are the newly added elements)
What is the role of the new proteins? How do these elements relate to the rest of the
mechanism?
2.4.1. Sister chromatid kinetics
The sister chromatids separate once the chromosomes are properly aligned on the
metaphase plate. Pds1, a securin, inhibits the separation of the chromatids by binding to
Esp1, a separase. Esp1 is responsible for the cleavage of the proteins that hold the sister
chromatids together, such as Scc1/Mcd1 (Ciosk, 1998; Michaelis, 1997; Guacci, 1997).
This process requires the presence of the kinase Cdc5 for the cleavage but the details
remain unclear. Possibly, Cdc5 phosphorylates Scc1 that can then be targeted by Esp1. If
Esp1 is deleted, the sister chromatids do not separate but Clb2 is degraded (Visintin,
1999) with a short delay compared to wild type (Cohen-Fix, 1999).
So how does the wild-type cell know when to dissolve the glue holding sisters
together? When Pds1 is active, it keeps Esp1 in complex and prevents the separation to
occur prematurely. When the chromosomes are properly aligned on the metaphase plate,
Mad2 turns off and Cdc20 can activate. Cdc20 then degrades Pds1, liberating Esp1 from
the complex (Yamamoto, 1996). That way, when DNA damage occurs, Cdc20 stays
inactive, Pds1 level remains high and the cell can repair the damage before the error is
passed on to the next generation.
2.4.2. Mitotic Exit Network
At several points during the cycle, the cell halts and checks that there are no errors.
The metaphase checkpoint, already discussed, makes sure that the chromosomes are
properly aligned on the metaphase plate. The second major checkpoint is the spindle
orientation checkpoint. The checkpoint protein Bub2 forms a complex with Bfa1. Both

28
proteins are located on the spindle pole body (Li, 1999; Bardin, 2000) along with Tem1 a
GTP-binding protein, which is kept inactive by the complex Bub2/Bfa1 (Pereira, 2000,
Krishnan, 2000). When Cdc5 activates, it phosphorylates Bfa1 and renders the complex
incapable of inhibiting Tem1 (Hu, 2001). As the spindle pole body moves into the bud,
Tem1 activates when it enters in contact with Lte1, a GTP exchange factor protein
located only in the bud (Bardin, 2000). If the spindle pole body is misoriented, Tem1 is
kept inactive. However, if no problems are encountered, the mitotic exit network (MEN)
is initiated. A cascade of proteins, including Cdc15, Dbf2, Mob1 ..., is activated leading
to the phosphorylation of Net1 and the release of Cdc14.
Deletion of MEN components blocks the cell in telophase. Thus, MEN activation is
essential to enter mitosis.
2.4.3. Exit from mitosis
Throughout G1, S/G2 and early mitosis, Cdc14 is inactive. It is sequestered in the
nucleolus by association with Net1 and Sir2 into an inactive complex called RENT
(REgulator of Nucleolar silencing and Telophase) (Visintin, 1999; Shou, 1999). When
MEN activates Net1 (possibly via phosphorylation) in anaphase (Shou, 2002; Yoshida,
2002), Cdc14 is released from the nucleolus to reach its targets in the nucleus (Sic1, Cdc6
and Cdh1) and the cytoplasm (Swi5). When Cdc14 targets are activated, they inhibit Clb2
activity and the cell is able to exit mitosis (Shou, 1999, Visintin, 1999). Cdc14 is re-
sequestered in late telophase (Pereira, 2002; Stegmeier, 2002).
A first pool of Cdc14 is released from the nucleolus by the FEAR (Cdc Fourteen
Early Anaphase Release) pathway. However, this release, independent of MEN, is
transient and is not enough to release Cdc14 completely. MEN (Mitotic Exit Network)
activates later and maintains Cdc14 in its released state (Stegmeier, 2002).
2.4.4. Checkpoint proteins
When treated with nocodazole or benomyl (drugs that prevent microtubule
polymerization, causing destruction of the spindle, and therefore making chromosome
alignment impossible), wild-type cells halt at the mitotic phase, i.e., their chromosomes
are condensed, with sister chromatids still attached to each other, and Clb2 activity high

29
until the drug is removed. If the drug is washed off, the cells resume their cycle
undamaged, indicating that the cells have mitotic surveillance mechanisms that prevent
Pds1 and Clb2 degradation.
Mutants that are not arrested in the presence of nocodazole or benomyl have allowed
the identification of several genes involved in these surveillance mechanisms: MAD1-3
(for “Mitosis Arrest Deficient” mutants) and BUB1-3 (for “Budding Uninhibited by
Benomyl” mutants). If the drugs are not present in the medium, cells with deletions of
these genes are perfectly normal.
Alexandru et al. (1999) have studied these mutants and found that the genes can be
catalogued in two groups: five of them (MAD1,2,3 and BUB1,3) are required for
inhibiting Pds1 degradation by Cdc20/APC (thus preventing sister chromatid separation),
whereas the gene BUB2 is essential to prevent Clb2 degradation by Cdh1/APC (keeping
Clb2 activity high).
In the following discussion, we will attempt to wire these subparts together and
analyze a more complete version of the budding yeast cell cycle.

30
Chapter 3: An improved version of the budding yeast cell cycle model
Even though the Chen (2000) model can account for interesting details of the Start
transition, the exit from mitosis is not described properly. Starting from Chen’s model,
we developed, little by little, a more complete picture of the budding yeast cell cycle.
This model was created with the close collaboration of Drs K. Chen, A. Csikasz-Nagy,
and Professors B. Novak and J.J. Tyson.
3.1. CONSENSUS PICTURE
The consensus diagram (Figure 3.1) regroups various networks regulating the main
events of the budding yeast cell cycle into a complete mechanism. The diagram 3.1
should be read from bottom-left toward top-right.
Newborn daughter cells must grow to a critical size to accumulate enough Cln3 and
Bck2 to activate the transcription factors, SBF and MBF, which drive synthesis of two
cyclins, Cln2 and Clb5 respectively.
Cln2 is primarily responsible for bud emergence and Clb5 for initiating DNA
synthesis. Clb5-dependent kinase activity is not immediately evident because in G1
phase, the cell is full of cyclin-dependent kinase inhibitors (CKIs; namely, Sic1 and
Cdc6).
In late G1 phase, Cln2 phosphorylates the CKIs. Once phosphorylated, the inhibitors
are rapidly degraded by SCF, releasing Clb5 to do its job. The dimer Cdc28/Clb2 is
inactive in G1 for several reasons: its transcription factor, Mcm1, is inactive, its
degradation pathway, Cdh1/APC, is active, and its stoichiometric inhibitors, CKIs, are
abundant. Cln2- and Clb5-dependent kinases remove the CKIs and inactivate Cdh1,
allowing Clb2 to appear, after some delay, as it activates its own transcription factor,
Mcm1.
Clb2 turns off SBF. MBF turns off at the same time, but by an unknown process in
addition to Clb2 (in the model we let SBF=MBF). As Clb2 drives the cell into mitosis, it
also sets the stage for exit from mitosis by stimulating the synthesis of Cdc20 and by
activating an intermediary enzyme (IE, which may be the APC component of

31
Figure 3.1. Consensus picture of the budding yeast cell cycle. This wiring diagram is the latest version of the budding yeast model It includes a detailed network of exit from mitosis. See text for details. In this diagram also, the catalytic subunit of the dimers, Cdc28, is omitted because of its constant abundant amount throughout the cell cycle.

32
Cdc20/APC, more on this later). Meanwhile, Cdc20 is kept inactive by the Mad2-
dependent checkpoint signal responsive to unaligned chromosomes. When the replicated
chromosomes are properly aligned on the metaphase plate, Cdc20/APC activates.
Cdc20/APC has several targets. It partially degrades some Clb2 but also the securin
Pds1. The disappearance of Pds1 leads to the release of Esp1, a protease involved in
sister chromatid separation. Moreover, it lifts the inhibitory signal on PPX degradation by
Cdc20/APC. PPX is a hypothetical phosphatase that keeps Net1 in its active,
unphosphorylated form. When Net1 gets phosphorylated by Cdc15 (the endpoint of the
"MEN" signal transduction pathway in the model), it releases its hold on Cdc14, a
phosphatase.
Cdc14 then reverses the activities of Cdc28/Clbs by activating Cdh1, stabilizing
CKIs, and activating Swi5 (the transcription factor for CKIs). Clb2 is then completely
degraded and when the kinase activity drops below a threshold value, the cell divides.
3.2. MODIFICATIONS FROM CHEN’S MODEL
3.2.1. Improved description of exit from mitosis
In the more realistic model of the budding yeast presented in chapter 2, Chen (2000)
thoroughly discussed the Start transition but used a simplified version of the Finish
transition by assuming that Cdc20 was directly activating Cdh1 and Sic1, thereby causing
mitotic exit. Also, in that paper, Clb2 kinase was directly activating Cdc20, making the
checkpoint protein Mad2 essential for cell viability, which is contrary to observation.
The new and improved mechanism includes major interaction between proteins and
important pathways that lead to Clb2 inactivation and mitotic exit. The new model also
shows how the spindle assembly checkpoint impinges on the cell cycle engine. We
included an intermediate enzyme IE to introduce a time delay between Clb2 activation
and Cdc20 activation, so that Mad2 would no longer be an essential protein. Figure 3.2 is
a schematic picture of the mechanism with the new elements involved in Finish transition
added.

33
Figure 3.2. Flow chart of the Finish transition. Clb2 initiates mitotic events. First, it activates its own degradation pathway through Cdc20 activation. Cdc20 then degrades proteins that lead to Cdc14 release. In a parallel manner, Clb2 activates MEN which also contributes to Cdc14 release. Cdc14, in turn, activates antagonists of the CDKs and cells can exit mitosis.
3.2.2. Assumptions of the model
Two unidentified elements were added
• IE: Intermediary Enzyme.
As mentioned in the previous paragraph, IE was added to the model to introduce a
delay between Clb2 and Cdc20 activations, independently of the checkpoint protein. Clb2
activates the hypothetical enzyme IE through phosphorylation, which, in turn, activates
Cdc20. Mad2 whose role is to keep Cdc20 inactive until all the chromosomes are
properly aligned on the mitotic spindle, is not playing an important part unless the cell is
put in nocodazole (drug that prevents microtubule polymerization, making chromosome
alignment impossible). When placed in normal conditions (glucose medium), the mutant
mad2∆ is viable (Alexandru, 1999), which shows that the cell still has some time to align
chromosomes on the metaphase plate.
The APC core could be a candidate for IE since it seems to fit its characteristics very
well. In figure 3.3, we compare the assumption made by the model (a) and the actual
molecular interaction between APC, Cdc20 and Mad2 (b).
Mitosis
Clb2 IEP Cdc20
Sister separation Anaphase entry
Clb5, Clb2
Pds1
PPX
Esp1
Mad2
Spindle checkpoint
Bub2
Tem1 Lte1 Cdc15 Net1 Cdc14
Swi5 Sic1,Cdc6
Cdh1 Clb2
Start
MitoticExit

34
Figure 3.3. (a) Cdc20 activation and inactivation modeled here. Clb2 activates an intermediary enzyme IE, which in turn, activates Cdc20. IE is opposing Mad2, monitored by the alignment of chromosomes. (b) In reality, Clb2 phosphorylates elements of the APC, which, once phosphorylated binds more easily to and activates Cdc20. When Mad2 is present, it binds to Cdc20 and prevents the binding of Cdc20 with the APC.
It has been demonstrated that Cdc16, Cdc23 and Cdc27, components of the APC core
facilitate the association with Cdc20 when they are in their phosphorylated form.
Moreover, further observations suggest that these components could be phosphorylated
by Cdc28/Clb2 (Rudner and Murray, 2000). These results are in agreement with IE
model, since IE needs to be phosphorylated by Clb2 to be able to activate Cdc20. Other
experiments have proven that if the phosphorylation sites of the components of the APC
core are altered (APC-A mutants), the cells are viable (Cross, 2003). In the model,
deletions of IE also result in viable cells. The viability of this mutant comes from the
ability of the unphosphorylated form of IE to activate Cdc20 in a less efficient way
(modeled by a background term that represents partial activation of Cdc20 by IE). Since
IEP’s capacity to activate Cdc20 in APC-A mutant is altered, the background activation,
alone, faces the checkpoint signal, Mad2, in Cdc20 activation. In this case, Cdc20 can
only activate when the checkpoint is lifted.
• PPX: Phosphatase X.
There is some evidence that Pds1 inhibits exit from mitosis (Cohen-Fix, 1999). For
example, the mutant PDS1-db∆, a non-degradable form of Pds1, exits from mitosis but
with a significant delay (Yamamoto, 1996) indicating that Pds1 may have an inhibitory
effect on Clb2 degradation, and probably on Cdc14 release itself. However, it is still not
clear how Pds1 can delay Cdc14 release.
Clb2
Cdc20
Cdc20
Mcm1
Mad2 IEP
IE Unattached kinetochore
Cdc20
Mad2
APC-P
Cdc20
APC-P
Mcm1
APC
Clb2
Mad2
Unattached kinetochore (a) (b)
Cdc20

35
Since pieces of the puzzle are missing, we assume the existence of a phosphatase
(called PPX) that keeps Net1 unphosphorylated until PPX activity goes away and until
MEN (Mitotic Exit Network) activates. Thus, PPX opposes MEN in the model. When
introducing PPX in the model, we realized that PPX also needs to be regulated to account
for some mutants. If PPX were an unregulated phosphatase, in the simulation of the
mutant cdc20∆ pds1∆, although it shows a telophase arrest, MEN would activate and
release Cdc14 which is contradictory to experimental results (Shirayama, 1999).
Therefore, we assume that Pds1 inhibits PPX degradation by Cdc20. That way, Pds1
needs to be degraded for PPX to disappear and allow MEN to phosphorylate Net1.
We have no candidate phosphatase to assign to PPX. Its role in the model is
hypothetical and used for simplicity. How is PPX related to release of Cdc14?
Different groups have found that Cdc14 release happens in two steps (Stegmeier,
2002; Visintin, 2003; Jensen, 2002; Cohen-Fix, 2003), through the FEAR (cdc Fourteen
Early Anaphase Release) pathway first and through MEN (Mitotic Exit Network) later.
The FEAR pathway, composed of Cdc5, Esp1, Slk19, and Spo12 (Pereira, 2000),
transiently releases some Cdc14 from the nucleolus during early anaphase (Ulhmann,
1999; Stegmeier, 2002). The release is then maintained by MEN (Stegmeier, 2002). In
the case that MEN is altered, Cdc14 re-sequesters and the cell is stuck in telophase (Shou,
1999; Visintin, 1999). Hence, this early release of the phosphatase, alone, is not enough
to trigger exit of mitosis. Moreover, the FEAR pathway is not essential for the viability of
the cell (neither is PPX). Indeed, individual mutations of its elements delay the release of
the phosphatase and exit from mitosis (Stegmeier, 2002). In reality, Pds1 inhibits the
FEAR pathway (through Esp1) which then releases Cdc14. In the model, Pds1 activates
PPX (or keeps it active), which inhibits the release of Cdc14. Clearly, PPX plays the
opposite role of the FEAR pathway.

36
Figure 3.4. PPX and the FEAR pathway. Cdc14 release modeled here (a). Early release of Cdc14 through the FEAR pathway (b).
3.3. MATHEMATICAL MODEL
Once the new components are added to the Chen (2000) model, we must show that
the extended model is consistent with all the mutants modeled by Chen and for additional
mutants that probe the exit from mitosis mechanism.
To this end, the wiring diagram is translated into 31 nonlinear ordinary differential
equations that describe the fluctuations of the cyclins and their regulatory proteins. There
are also 4 auxiliary differential equations that monitor different events of the budding
yeast cell cycle such as growth, DNA replication, bud emergence and chromosome
alignment (Appendix A). Once the kinetic equations are specified, the parameters are
chosen to fit the experiments (Appendix B). Then, given initial conditions for each
component, the differential equations are solved numerically using a program, WinPP,
created by B. Ermentrout (2002). The numerical solutions must give an accurate
description of wild-type and mutant cells by faithfully describing the cycle time, the
timing of bud emergence, the length of the G1 phase for both daughter and mother cells,
the timing of DNA replication, and the ratios of various cyclins and their inhibitors.
3.3.1. The wild-type cell
Figure 3.5 shows a simulation of a wild-type daughter cell. The first panel tracks the
temporal behavior of ORI, BUD, SPN and mass, differential equations that describe the
Cdc14 Release
Cdc5 Tem1 Cdc15 Dbf2/20 Mob1
MEN
PPX
Pds1
Cdc20
Early Cdc14 release
Late Cdc14
Anaphase
Cdc5 Tem1 Cdc15 Dbf2/20 Mob1
Cdc5 Esp1 Slk19 Spo12
FEAR
MEN
Cdc20
Pds1
(b)(a)

37
state of the bud, the spindle, origins of replication and mass. When ORI reaches 1, it
means that DNA synthesis begins; when BUD reaches 1, it means that the bud emerges;
and when SPN reaches 1, it means that the chromosomes have aligned on the metaphase
plate. The second panel is a plot of Clb5, Clb2 and Pds1. The third panel shows the
concentration of the antagonist proteins of the cyclins: Sic1, Cdc6, and Cdh1. The fourth
panel follows the activity of the helper proteins: Cln2, Cdc20 and Cdc14. Finally, the
fifth panel plots the activity of the transcription factors: Mcm1, SBF, and Swi5.
The cycle time for a daughter cell is 101.2 min (80 min for the mother) with a G1
phase of 36 min (28 min) and an S/G2/M phase of 64 min (52 min) for a mass doubling
time of 90 min. These numbers fit experimental values of Brewer (1994). For a wild-type
diploid cell (A364A D5 strain), he found a cycle time for a daughter cell of 97.5 min (81
min for the mother), a G1 phase of 42 min (22 min), and an S/G2/M phase of 57 min (59
min).
The levels of proteins observed in simulations also match as accurately as possible
experimental data of Cross (2002). In his study, he measured the relative amount of
several proteins in asynchronous cultures. The ratios obtained are the following: (Cln1 +
Cln2) : (Clb5 + Clb6) : (Clb1 + Clb2) : Sic1 = 15: 3.8 : 7.5 : 1. In the model, these ratios
are: 15 : 3.3 : 4.7 : 2.8. These numbers were calculated by integrating the protein over a
cycle in the cases of both the mother and daughter cells and then averaging the two
numbers.

38
Figure 3.5. Simulation of a wild type daughter cell. Five panels show the concentration of proteins as a function of time. The differential equations are solved simultaneously using a program WinPP created by B. Ermentrout.
0
1
2
3
0.0
0.5
1.0
1.5
0.0
0.4
0.8
1.2
0
1
2
0.0
0.2
0.4
0 50 100 150 200 0.0
0.5
1.0
Mass ORI
BUD
SPN
Clb2T
Clb5T Pds1
Cdc6T
Sic1T
Cdh1
Cln2 Cdc20
Cdc14
SBF Mcm1
Swi5

39
3.3.2. How do we know the model is wired properly?
The model also needs to account for the phenotype of 71 mutants in addition to the
60 mutants considered in Chen et al. (2000). As the number of proteins included in the
model increased, the number of mutants nearly doubled to 131. Using the rules described
in the previous model (see chapter 2), we simulate deletions of genes, temperature-
sensitive, over-expressions, and multi-copy mutants. Here, we also model the cases when
the mutants are grown in a different medium. For example, when put in galactose, the
growth rate is slowed down (the parameter representing Mass Doubling Time, MDT, is
increased to 150 whereas MDT=90 in glucose medium). The parameter for growth rate is
inversely proportional to the mass doubling time (kg= ln(2)/MDT).
3.4. MUTANTS
Table 3.1 lists the 131 mutants that the model simulates. Few examples detailed
below show that the global understanding of the consensus picture is accurate.
3.4.1. “Finish” mutants
Several groups showed that a cdc20ts mutant is inviable (Sethi, 1991; Shirayama,
1998; Lim, 1998). The cell arrests in metaphase with high B-type cyclin concentration
and high activity of Pds1. Since Pds1 cannot be degraded, it keeps Esp1 in the complex,
and the glue holding the sister chromatids together cannot dissolve; thus, the sisters
remain attached. Both the absence of Cdc20 and the high level of Pds1 (Pds1 inhibits exit
of mitosis) keep Cdc14 sequestered in the RENT complex, and as a consequence, the
antagonists, CKIs and Cdh1, stay inactive. In the simulation (Figure 3.6 a), Clb2, Clb5
and Pds1 levels are high and the cell never divides.
The double mutant cdc20∆ clb5∆ has a similar phenotype as cdc20ts since in both
mutants, Cdc14 is not released (Shirayama, 1998). Even though Clb5 is absent, Clb2 is
high enough to keep Cdh1 phosphorylated and inactive. As a result, the cell arrests in M
phase. The simulation exhibits a similar behavior (Figure 3.6 b).

40
Cln mutants cln1∆ cln2∆ GAL-CLN2 cln1∆ cln2∆ cln1∆ cln2∆ sic1∆ cln1∆ cln2∆ cdh1∆ GAL-CLN2 cln1∆ cln2∆ cdh1∆ cln3∆ GAL-CLN3 Bck2 mutants bck2∆ Multi-copy BCK2 cln1∆ cln2∆ bck2∆ cln3∆ bck2∆ cln3∆ bck2∆ GAL-CLN2 cln1∆ cln2∆ cln3∆ bck2∆ multi-copy CLN2 cln3∆ bck2∆ sic1∆ cln1 cln2 cln3 strain cln1∆ cln2∆ cln3∆ cln1∆ cln2∆ cln3∆ GAL-CLN2 cln1∆ cln2∆ cln3∆ GAL-CLN3 cln1∆ cln2∆ cln3∆ sic1∆ cln1∆ cln2∆ cln3∆ cdh1∆ cln1∆ cln2∆ cln3∆ multi-copy CLB5 cln1∆ cln2∆ cln3∆ GAL-CLB5 cln1∆ cln2∆ cln3∆ multi-copy BCK2 cln1∆ cln2∆ cln3∆ GAL-CLB2 cln1∆ cln2∆ cln3∆ apcts Cdh1, Sic1 and Cdc6 mutants sic1∆ GAL-SIC1 GAL-SIC1-db∆ GAL-SIC1 cln1∆ cln2∆ GAL-SIC1 GAL-CLN2 cln1∆ cln2∆ GAL-SIC1 cln1∆ cln2∆ cdh1∆
GAL-SIC1 GAL-CLN2 cln1∆ cln2∆ cdh1∆ cdh1∆ Cdh1 constitutively active sic1∆ cdh1∆ (*) sic1∆ cdh1∆ GALL-CDC20 cdc6∆2-49 cdc6∆2-49 sic1∆ cdc6∆2-49 cdh1∆ cdc6∆2-49 sic1∆ cdh1∆(*) cdc6∆2-49 sic1∆ cdh1∆ GALL-CDC20 swi5∆ swi5∆ cdh1∆ swi5∆ cdh1∆ GAL-SIC1 swi5∆ GAL-CLB2 Clb1 Clb2 mutants clb1∆ clb2∆ clb2∆ CLB1 GAL-CLB2 Multi-copy GAL-CLB2 clb2∆ CLB1 cdh1∆ (*) clb2∆ CLB1 pds1∆ (*) GAL-CLB2 sic1∆ (*) GAL-CLB2 cdh1∆ CLB2-db∆ CLB2-db∆ in gal. CLB2-db∆ multi-copy SIC1 CLB2-db∆ GAL-SIC1 CLB2-db∆ multi-copy CDC6 CLB2-db∆ clb5∆ CLB2-db∆ clb5∆ in gal. GAL-CLB2-db∆ Clb5 Clb6 mutants clb5∆ clb6∆ clb5∆ clb6∆ cln1∆ cln2∆ GAL-CLB5 GAL-CLB5 sic1∆ GAL-CLB5 cdh1∆ (*) CLB5-db∆ CLB5-db∆ sic1∆ CLB5-db∆ pds1∆ CLB5-db∆ pds1∆ cdc20∆ GAL-CLB5-db∆
Cdc20 mutants cdc20ts cdc20∆ clb5∆ cdc20∆ pds1∆ cdc20∆ pds1∆ clb5∆ GAL-CDC20 cdc20ts mad2∆ cdc20ts bub2∆ Pds1/Esp1 interaction pds1∆ (*) esp1ts PDS1-db∆ GAL-PDS1-db∆ GAL-PDS1-db∆ esp1ts GAL-ESP1 cdc20ts MEN mutants tem1∆ GAL-TEM1 tem1ts multi-copy CDC15 tem1ts GAL-CDC15 tem1∆ net1ts
tem1∆ multi-copy CDC14 cdc15∆ Multi-copy CDC15
cdc15ts multi-copy TEM1 cdc15∆ net1ts
cdc15ts multi-copy CDC14 Exit-of-mitosis mutants net1ts GAL-NET1 cdc14ts GAL-CDC14 GAL-CDC14 GAL-NET1 net1ts cdc20ts
cdc14ts GAL-SIC1 cdc14ts then GAL-SIC1 cdc14ts sic1∆ at perm. temp.
cdc14ts cdh1∆ at perm. temp. cdc14ts GAL-CLN2 at perm. temp. TAB6-1 TAB6-1 cdc15ts TAB6-1 clb5∆ TAB6-1 clb2∆ CLB1 Checkpoint mutants mad2∆ bub2∆ mad2∆ bub2∆ WT in noc. mad2∆ in noc. mad2∆ GAL-TEM1 in noc. mad2∆ pds1∆ in noc. bub2∆ in noc. (*) bub2∆ pds1∆ in noc. bub2∆ mad2∆ in noc. pds1∆ in noc. net1ts in noc. APC mutants APC-A APC-A cdh1∆ APC-A cdh1∆ in gal. APC-A cdh1∆ multi-copy SIC1 APC-A cdh1∆ GAL-SIC1 APC-A cdh1∆ multi-copy CDC6 APC-A cdh1∆ GAL-CDC6 APC-A cdh1∆ multi-copy CDC20 APC-A sic1∆ APC-A GAL-CLB2 l. in gal. = in galactose 2. in noc. = in nocodazole 3. perm. temp = permissive temperature
Table 3.1. List of mutants simulated by the model. The simulations of the mutants followed by (*) differ from the experimental data. See section 3.5.1 for more details concerning these mutants.
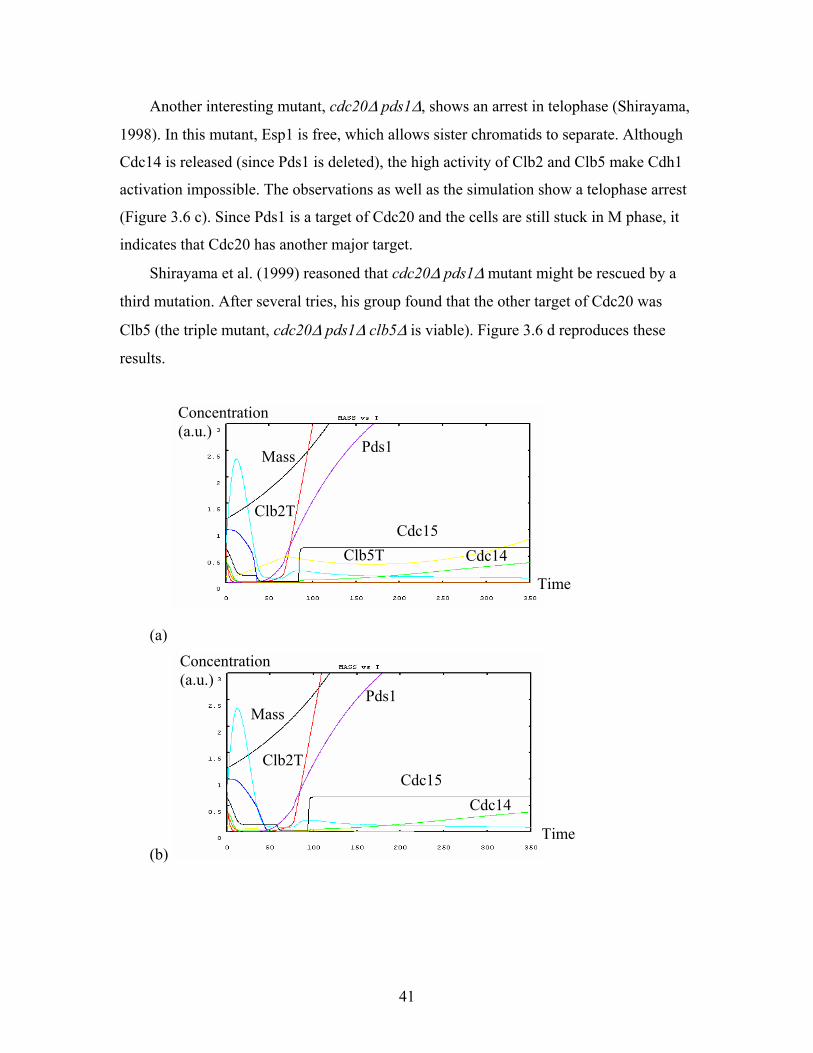
41
Another interesting mutant, cdc20∆ pds1∆, shows an arrest in telophase (Shirayama,
1998). In this mutant, Esp1 is free, which allows sister chromatids to separate. Although
Cdc14 is released (since Pds1 is deleted), the high activity of Clb2 and Clb5 make Cdh1
activation impossible. The observations as well as the simulation show a telophase arrest
(Figure 3.6 c). Since Pds1 is a target of Cdc20 and the cells are still stuck in M phase, it
indicates that Cdc20 has another major target.
Shirayama et al. (1999) reasoned that cdc20∆ pds1∆ mutant might be rescued by a
third mutation. After several tries, his group found that the other target of Cdc20 was
Clb5 (the triple mutant, cdc20∆ pds1∆ clb5∆ is viable). Figure 3.6 d reproduces these
results.
(a)
(b)
Cdc15Cdc14Clb5T
Pds1
Clb2T
Mass
Cdc15Cdc14
Pds1
Clb2T
Mass
Time
Concentration (a.u.)
Time
Concentration (a.u.)

42
(c)
(d) Figure 3.6. Simulations of “Finish” mutants. (a) cdc20ts arrests in metaphase. (b) cdc20∆ clb5∆ arrests in metaphase. (c) cdc20∆ pds1∆ arrests in telophase. (d) cdc20∆ pds1∆ clb5∆ is viable. The legend of the plot is the following: Mass (black), Sic1T (light blue), Cdh1 (dark blue), Clb2T (red), Clb5T (yellow), Pds1 (purple), Cdc15 (black), and Cdc14 (green).
3.4.2. Checkpoint mutants
When treated with nocodazole, wild-type cells arrest with high B-type cyclin and
Pds1 levels. Under these conditions, Mad2 and Bub2 become important proteins. When
functional, Mad2 keeps Cdc20 in its inactive form, and as a result, neither Cdc28/Clbs
nor Pds1 are degraded. Hence, Pds1 binds to and inactivates Esp1 (Esp1 level is low so
sister chromatids are still attached, as shown in Fraschini, 1999). On the other hand,
Bub2 keeps Net1 dephosphorylated. Cdc14 is not released from the complex and cannot
activate Cdh1. Although both Mad2 and Bub2 are altering Clb2 proteolysis, they are
believed to operate through two different pathways (Fraschini, 1999). Mad2 seems to act
upstream of Bub2 (Fraschini, 1999; Krishnan, 2000). This hypothesis was checked by
studying two mutants, mad2∆ and bub2∆ in nocodazole, in order to understand their
respective role in the cell cycle.
Cdc15 Cdc14Clb2T
Mass
Clb5T
Mass
Time
Clb2T
Concentration (a.u.)
Time
Concentration (a.u.)

43
In a mad2∆ mutant in nocodazole (Figure 3.7 a), Cdc20 activates because of the
defective checkpoint gene. Since Pds1 is gone, Esp1 is free and sister chromatids
separate normally. In this mutant, because Bub2 is functional, it binds to Tem1 and
keeps it inactive, and consequently renders MEN inactive. Cdc14 is therefore trapped in
the nucleolus and Clb2 cannot disappear. However, when mad2∆ is kept in nocodazole
for a long time, some unknown mechanism causes the cells to exit from mitosis and to
loose viability (Alexandru, 1999). In the simulation, Cdc14 slowly activates and reaches
a point when the antagonists turn on and Clb2, maintained to a lower level by Cdc20,
can finally be totally degraded.
The behavior of the bub2∆ mutant in nocodazole is different. A study of Fraschini
(1999) shows that Bub2 belongs to a different mechanism than the one in which Mad2 is
involved. The checkpoint is activated when the cell notices an abnormality in the spindle
orientation. Bub2 is located on the spindle pole bodies throughout the cell cycle. In this
mutant, Mad2 is functional, so Cdc20 does not activate, although Pds1 degrades very
slowly (Fraschini, 1999). In the simulation though (Figure 3.7 b), Pds1 is stable. To
explain this behavior, Fraschini argues that Bub2 has a minor effect in the degradation of
Pds1 and therefore in separating sister chromatids. Although MEN is not inhibited (since
Bub2 is deleted) (Krishnan, 2000), Cdc20 does not activate and Pds1 level remains high.
PPX cannot degrade. Thus, Net1 still remains unphosphorylated, and Cdc14 is mostly
trapped in the RENT complex. Moreover, because Clb5 level is high (since Cdc20 is
inactive, Clb5 degradation rate is low), the cells need higher level of free Cdc14 to
activate Cdh1. In this mutant too, when the cells are treated with nocodazole for long
periods, they exit from mitosis, initiate new buds and die. The active form of Cdc20
eventually reaches a critical level and cause both Pds1 degradation and Cdh1 activation.
However, in the model, we were not able to simulate what is observed in experiments.
With the current wiring diagram, there is nothing that can degrade Pds1 in this mutant.
PPX stays high and Cdc14 sequestered in the RENT complex. In our simulation, the
mutant retains viability. There must be a piece of the puzzle missing that could explain
how the cells exit mitosis after a long incubation (More on this mutant in the ‘problems’
section).

44
Finally, when placed in nocodazole, the double mutant mad2∆ bub2∆ shows a more
dramatic checkpoint defect (Alexandru, 1999; Fraschini, 1999). Since Mad2 is deleted,
the sister chromatids can be separated and because of the absence of Bub2, cytokinesis
can occur (Clb2 degradation is not inhibited). The mutant behaves kinetically like a wild
type cell in the absence of nocodazole (Figure 3.7 c) (Li, 1999).
(a)
(b)
(c) Figure 3.7. (a) mad2∆ in nocodazole eventually exits from mitosis. (b) bub2∆ in nocodazole should also exit from mitosis after a long delay but is incapable of it in the simulation. (c) mad2∆ bub2∆ in nocodazole shows major defect.
Cdc20Clb2T
Mass
Concentration (a.u.)
Pds1
MassClb2T
Cdc15
Mass
Clb2T
Clb5T Cdc15
Sic1T
Cdh1
Concentration (a.u.)
Concentration (a.u.)
Time
Time
Time

45
3.4.3. MEN mutants and release of Cdc14
If any element of MEN is deleted, the mutant cell arrests in telophase (budded cells,
elongated spindles and separated DNA, figure 3.8 a). In a paper, Jaspersen and his group
(1999) analyzed various components of MEN (Cdc15, Cdc5, Cdc14, Tem1, and Dbf2)
and determined their order in the cascade through a set of mutations. They deleted or
over-expressed (or introduced multi-copy plasmids of) some of these genes and noted
which ones could rescue the telophase arrests. If a deletion is rescued by over-expression
(or multi-copies) of another gene, it obviously implies that the latter gene is downstream
of the deleted one.
From these experiments, they concluded that the GTP-binding protein, Tem1, was at
the top of the cascade since its defect could be restored by over-expression of any of the
other proteins besides Dbf2. Moreover, multi-copies of TEM1 could not rescue any of the
deleted genes except for cdc5∆. In contrast, Cdc14 can be considered the last element of
the pathway since none of the other proteins can rescue its arrest. Also, multi-copies of
CDC14 allow telophase-arrested cells to exit from mitosis (tem1∆ and cdc15∆ with
additional copies of CDC14 are viable, figure 3.8 b – Jaspersen, 1999). Similarly, Shou
(1999) showed that a temperature-sensitive mutation of NET1 can produce the same
effects as multi-copies of CDC14 (tem1∆ net1-ts and cdc15∆ net1-ts are viable).
The role of the kinase Cdc5 in exit from mitosis is not clear. Cdc5 activity is crucial
at several places in the cascade. First, it plays a part in Tem1 activation (Pereira, 2002) by
phosphorylating and inactivating the complex Baf1/Bub2 which keeps Tem1 inactive.
Nonetheless, it cannot be concluded that Cdc5 is upstream of Tem1 since multi-copies of
CDC5 can also rescue the telophase arrest of tem1∆ (Jaspersen, 1999). Secondly, Cdc5
probably interacts with Dbf2 as well and participates in the final step of Cdc14 release. A
recent paper (Visintin, 2003) suggested that Cdc5 may contribute to Cdc14 release in two
steps. The dissociation of Net1 and Cdc14 (and therefore the release of Cdc14 from the
nucleolus) seems to require that both proteins are phosphorylated. Cdc5 first
phosphorylates Cdc14 and to a lesser extent Net1 in early anaphase (possibly through the
FEAR pathway). This early release of Cdc14 seems to activate MEN more which further
phosphorylates Net1 and liberates more Cdc14.

46
(a)
(b) Figure 3.8. (a) cdc15∆ arrests in telophase, (b) but is rescued by multi-copies of CDC14
3.4.4. APC-A mutants
The APC-A mutation removes all relevant phosphorylation sites of APC
components, thereby reducing its ability to bind with Cdc20. To simulate such mutants,
we set the parameter of IEP activating Cdc20 equal to 0. We also assume the existence of
a background activity representing some low activation of Cdc20 by the inactive
(unphosphorylated) form of IE. Thus, even in the absence of phosphorylation, Cdc20
maintains some weak activity. This result is in accordance with the phenotype of APC-A
observed in experiments. Cross (2003) found the mutant alive but recorded a 40 min
delay in Clb2 degradation. In the simulation, this delay is also modeled.
Since Cdc20 is not functional in APC-A mutants, Cdh1 and CKIs must be entirely
responsible for the reduction of Clb2-kinase activity. Additional mutations reveal the role
played by the antagonist proteins in the exit from mitosis. Cross demonstrated in the
same paper that a deletion of CDH1 in APC-A mutants results in an arrest in telophase in
glucose (mass doubling time is about 90 min) revealing its essential function in this
Clb2TMass
Cdc20
Cdc14
Clb2T
Mass Sic1T
Cdc14
Concentration (a.u.)
Concentration (a.u.)

47
mutant. However, a deletion of either SIC1 or CDC6 (or both) does not affect the
viability of the single mutant. In accordance with Cross’ results, the model shows that in
this mutant, Cdh1 is mainly responsible for degrading Clb2 at the end of M phase
whereas the CKIs essentially control the passage through the Start transition.
In galactose (growth rate is slowed down, mass doubling time is about 150 min),
though, the double mutant APC-A cdh1∆ can form colonies (Cross, 2003). When cells are
put in galactose, the growth rate is reduced (MDT=160 min). As a result, the cells spend
more time in G1 (the mass threshold for the Start transition is reached slightly later).
When Clb2 starts accumulating, mass is lower in galactose than it would be in glucose, so
Clb2 rate of synthesis is also slowed down (the synthesis rate of cyclins is multiplied by
mass). In this case, Cdc20 has a chance to degrade enough Clb2 to allow the CKIs to
drive the cells out of mitosis.
(a)
(b)
Clb2T
Mass Sic1T
Mass Clb2T
Cdc15 Cdc14
Concentration (a.u.)
Concentration (a.u.)
Time
Time

48
(c) Figure 3.9. (a) APC-A cells are viable, (b) but the double mutant APC-A cdh1∆ arrests in telophase whereas (c) APC-A sic1∆ is still viable.
3.4.5. The rest of the mutants
The model can reproduce and explain the phenotype of 121 mutants in table 3.
However, ten of the simulated mutants differ from experimental observations. In some
cases, it is possible to tune the parameters to fit some of these ten mutants but other
mutants of the list then fail. The parameter set that we propose here describes the set of
mutants with the smallest number of discrepancies.
For more details on the mutants, a web page is available at “mpf.biol.vt.edu” with a
library of mutants showing the simulations, along with reference of where the mutant
phenotypes are described in the literature.
3.5. WHAT THE MODEL CANNOT EXPLAIN
3.5.1. Problems of the model
The ten problematic mutants are now described.
(1) bub2∆ in nocodazole
In presence of nocodazole, the checkpoint proteins Mad2 and Bub2 respond to the
spindle damage created by the drug. Wild-type cells in nocodazole arrest in metaphase. If
we delete the BUB2 gene, Mad2 pathway remains functional keeping Cdc20 inactive. As
a consequence, high levels of Clb2, Clb5 and Pds1 are observed. The experiments,
however, show that after a long incubation, the mutant is capable of exiting mitosis, and
re-bud without a proper segregation of the chromosomes (Alexandru, 1999).
Mass
Clb2T
Concentration (a.u.)
Time

49
Our simulation shows a tight arrest in metaphase. According to our wiring diagram,
bub2∆ in nocodazole (with high Clb5 and high Pds1) should have even more difficulty in
exiting mitosis than the mutant pds1∆ in nocodazole (with high Clb5 and low Pds1).
Since pds1∆ in nocodazole arrests in telophase, so must bub2∆ (in our model). In bub2∆
in nocodazole, high levels of Pds1 inhibit Cdc14 release, whereas Cdc14 is free in
pds1∆ in nocodazole. To keep the latter mutant arrested, it is important to choose the
appropriate parameters that would not allow Cdc14 to compete against Clb2 in Cdh1
activation. This choice of parameters renders the exit from mitosis of bub2∆ in
nocodazole impossible.
(2) cdh1∆
cdh1∆ cells are viable but smaller than wild type (Schwab, 1997). They are also
observed to grow slower and to bud at a smaller size than wild type. In our simulation,
the mutant divides at a smaller size than wild-type but does not show an early budding or
slower growth rate. Since CDH1 deletion causes an early budding, Cdh1 might have an
additional role in the initiation of the Start transition that the model does not reproduce.
In the present model, Cdh1 only degrades Clb2 and, with a small efficiency, Pds1.
(3) cdh1∆ cdc6∆2-49
The mutant is viable but larger than wild-type and with a longer G2 phase (Calzada,
2001). In the simulation, the double mutant is viable but is, in fact, smaller than wild-
type. Clb2 is not degraded significantly; therefore entry in S phase is early since Sic1 is
the only inhibitor left.
(4) pds1∆
This mutant is viable (Yamamoto, 1996), but is inviable in the model. The role of
Esp1 is to degrade the glue holding the sister chromatid together. In the model, the only
way to regulate Esp1 is by association with Pds1 into an inactive complex. Therefore,
whenever Pds1 is degraded, Esp1 is free to do its job. In reality, the cleavage of the
proteins keeping sister chromatids attached is a more complicated process. The kinase
Cdc5, activated by Clb2, is needed to separate the sisters (Yamamoto, 1996, Alexandru,

50
2001). When Cdc5 is active, it phosphorylates proteins that can then be cleaved by Esp1.
In the simulation of the mutant pds1∆, Esp1 cannot be inhibited and the sister chromatids
are always separated (since Cdc5 is not included in the model) which is contrary to
observations (Uhlmann, 1999).
(5) clb2∆ CLB1
The single mutant clb2∆ CLB1 is viable (Richardson, 1992). In the mutant
simulation, the rates of synthesis of Clb2 (that really represents Clb1 and Clb2 in the
model) are lowered to 33% of the wild-type values, since CLB1 gene remains intact.
When simulated in this way, the mutant shows some minor defect in the second cycle. At
exit from mitosis, Esp1 level is low (0.085). Our criterion for viability insists on Esp1 to
be above 0.1. A small change of parameters might solve this small problem or permit
some error tolerance in our criterion for viability.
(6) clb2∆ cdh1∆
The double mutant clb2∆ cdh1∆ (with CLB1 intact) is inviable (Cross, 2003). In the
model, the mutant is alive. The reason for this failure might be related again to the
absence of Cdc5 in the model. Cdc5 is phosphorylated and activated by Clb2 (Kotani,
1998; Cheng, 1998). As a result, when deleting Clb2, the activation of Cdc5, which is
tightly involved in the release of Cdc14 (through MEN and FEAR pathway), should be
altered and the release of Cdc14 should be lessened. This low level of Cdc14 should
make exit of mitosis more difficult. This fact is not taken in account in the model. The
introduction of Cdc5 in the mechanism might solve this problem.
(7) clb2∆ pds1∆
The double mutant cells are inviable (Shirayama, 1999). Because of the problems
related to pds1∆ and clb2∆ CLB1 discussed above, the simulation shows an inviable
mutant. However, we expect this inviability to be different than the one observed in
experiments. In other words, the mutant is inviable in the simulation but for the wrong
reasons (defect at exit of mitosis because of clb2∆ CLB1 (problem 5) and mitotic
catastrophe because of pds1∆ (problem 4)).

51
(8) GAL-CLB2 sic1∆
This mutant should arrest in telophase (Toyn, 1997) but in our simulation, it cycles.
By a proper choice of parameters, we could cause GAL-CLB2 sic1∆ to arrest in telophase,
but then so would GAL-CLB2 alone. In the single mutant GAL-CLB2, the negative
feedback is maintained even for high levels of CLB2: Clb2 activates Cdc20 which in
turns degrades Clb2. Besides, deletion of SIC1 helps the viability of the mutant. The cells
get into S phase faster than in the single mutant, activating Cdc20 earlier and as a
consequence, degrading Clb2 earlier. In the simulation, though, the bud never forms
(BUD never reaches 1). One explanation of the lethality of this mutant could be the
presence of checkpoint defects caused by sic1∆ not modeled here.
(9) sic1∆ cdh1∆
Recent results (Wasch and Cross, 2002) showed that, even though inviable, sic1∆
cdh1∆ is capable of exiting from mitosis. Cells exist the first cycle but arrest in the next
cycle with large buds and replicated DNA. The simulation shows that the mutant can exit
from mitosis even though the mutant never forms a bud (BUD never reaches 1). Since
Cdc14 is active, it can still activate Cdc6. The inhibitor can then bind to Clb2 and cells
exit mitosis. Again, the inviability might be caused by the deletion of SIC1 which creates
some checkpoint defect (DNA damage) that would arrest the cells in G2/M phase in the
second cycle.
(10) sic1∆ cdh1∆ cdc6∆2-49
This mutant is inviable (Archambault, 2003). Cells proceed through DNA synthesis
and nuclear division but are incapable of dividing. The mutant arrests in the next cycle
with two nuclei and replicated DNA (4C). At the moment, the model shows a telophase
arrest and cannot explain the phenotype of this mutant. If we keep the criterion that Clb2-
kinase activity needs to drop below a certain value for cell division to occur, the mutant
will never divide no matter which parameter set we choose. Since all the antagonists of
Clb2 are deleted, Clb2 level stays high. Therefore, the requirement for cell division (or
nuclear division; there is no distinction between nuclear and cytoplasmic division in the

52
model) needs to be modified. It is possible that other events, such as the rise of Cdc14
rather than the drop of Clb2-kinase activity, trigger cell division. The next section
describes a "Target" model for an alternate possibility.
3.5.2. The target model
We encountered a mutant cdc6∆2-49 cdh1∆ sic1∆ that, although inviable, is capable
of exiting mitosis with high activity of Clb2-kinase (Archambault, 2003). Its origins of
replication can never relicense (high Clb2 and Clb5), therefore this mutant is considered
inviable (Cross, 2003).
To account for this case, we introduce a "Target" protein. It has been shown
previously that when Cdc14 is released from the nucleolus, it dephosphorylates and
activates Cdh1, Swi5, Sic1 (Visintin, 1998) and Cdc6 (Perkins, 2001). We propose here
that Cdc14 also activates a target protein that allows cells to exit from mitosis in the
absence of the enemies of Cdc28/cyclin dimers. The differential equation describing
[Target] is written as a Goldbeter-Koshland switch (1981) as follows: ' '' ' ''a,tar a,tar i,tar i,tar
a,tar i,tar
( ) (1 [Target]) ( [Clb2]) [Target]d[Target]d 1 [Target] [Target]
k k k kt J J
+ ⋅ − + ⋅ ⋅= −
+ − +
with the corresponding parameters: ' '' ' ''a,tar a,tar i,tar i,tar a,tar i,tar ez,tar0.02, 1, 0.01, 0.6, 0.05, 0.4k k k k J J K= = = = = = =
The cell exits from mitosis when Target reaches a critical value ( ez,tarK ). Introducing
this new requirement for exit from mitosis decreases the robustness of the system and
renders it more sensitive to small changes in parameters. The same set of parameters as
the model presented previously can be used to describe the 131 mutants with the
exception of one value (kasrent = 160 instead of 200: Cdc14 needs to be in greater amount).
These changes allow not only the double mutant cdh1∆ sic1∆ to experience problems in
relicensing their DNA as observed experimentally (Figure 3.10 a, ORI=yellow is no reset
after the first mitosis) but also the triple mutant cdc6∆2-49 cdh1∆ sic1∆ to exit from
mitosis even though the Clb-kinase activity remains high (Figure 3.10 b, also with
relicensing problems). Cdc14 (green curve) is released because MEN can activate (black
curve).

53
a)
(b) Figure 3.10. Simulations of (a) cdh1∆ sic1∆: ORI doesn’t relicense after the first cycle (orange curve). (b) cdc6∆2-49 cdh1∆ sic1∆: Cells exit from mitosis but ORI never relicense (orange curve).
3.6. WHAT THE MODEL CAN PREDICT
One of the roles of a model is to provide a tool to experimentalists to predict
phenotypes of mutants, or suggest ways to rescue an inviable mutant. A list of predictions
can be found in table 3.2.
For predictions 1-7, the model brings into relief the different effects of Sic1 and
Cdc6 on mutants. We mentioned earlier that Cdc6 binds to Clb5 less efficiently than Sic1
does. This assumption, recently confirmed by Archambault (2003), has some
repercussion on the predicted mutants. In most cases, where an additional deletion of
SIC1 causes an arrest, a deletion of CDC6 does not affect the viability of the mutant
(predictions 3 and 4); but where a deletion of SIC1 rescues an arrest, a deletion of CDC6
conserves the inviability of the mutant (Prediction 1). Also, an over-expression (or multi-
copy) of SIC1 is expected to rescue an inviable CLB5 mutant, whereas an over-
Cdc15
Cdc14Clb5T
Clb2T
Mass
ORI
Cdc15
Cdc14
Clb2T
Mass
Time
Concentration (a.u.)
Time
Concentration (a.u.)

54
Mutant Phenotype
1 cln1∆ cln2∆ cln3∆ cdc6∆2-49 Inviable (G1 arrest)
2 cln3∆ bck2∆ cdc6∆2-49 Inviable
3 GAL-CLB5 cdc6∆2-49 Viable (similar to WT)
4 CLB5-db∆ cdc6∆2-49 Viable (similar to WT)
5 GAL-CLB5-db∆ GAL-SIC1 Viable
6 GAL-CLB5-db∆ multicopy SIC1 Viable
7 GAL-CLB5-db∆ GAL-CDC6 Inviable
8 CLB2-db∆ GAL-CDC6 Viable
9 cdc20∆ clb5∆ pds1∆ +50% of Net1 (or -50% of Cdc15 or Cdc14)
Arrest in telophase
10 cdc20∆ clb5∆ pds1∆ sic1∆ (or cdc6∆2-49 or both)
Viable
11 cdc20∆ clb5∆ pds1∆ bub2∆ Arrest in G1
12 cdc20∆ pds1∆ + an extra-copy of CDC15
Viable
13 cdc20∆ pds1∆ TAB6-1 Viable
14 APC-A sic1∆ cdc6∆2-49 Viable
15 sic1∆ cdc6∆2-49 cdh1∆ GALL-CDC20 mad2∆
Inviable (G2 arrest)
16 net1-ts + multicopy CLB5 (or CLB2) in nocodazole
Viability retained (do not
exit)
17 net1-ts + multicopy CLN2 (or CLN3) in nocodazole
Viability lost (exit from
mitosis)
18 net1-ts sic1∆ (or cdc6∆2-49) in nocodazole
Viability lost (exit from
mitosis)
19 cln1∆ cln2∆ clb5∆ clb6∆ cdh1∆ (or GAL-CLB2)
Able to do DNA
synthesis and exit from
mitosis Table 3.2. List of predictions of the model.

55
expression of CDC6 does not alter its phenotype (Predictions 5-7). However, prediction 8
shows that Sic1 and Cdc6 have similar effects on CLB2 mutations. This result is not
surprising since Sic1 and Cdc6 bind with similar efficiency to Clb2. They are both good
inhibitors of the dimers Cdc28/Clb2.
Predictions 9-11 show that the level of Cdc14 is important in maintaining
cdc20∆ clb5∆ pds1∆ alive but the inhibitors do not play a significant role in this mutant.
Deletions of SIC1 or/and CDC6 do not affect the viability of the triple mutant.
The telophase arrest of cdc20∆ pds1∆ is not robust. As shown in predictions 12 and
13, a slight increase in Cdc14 release causes the mutant to exit mitosis.
From prediction 14, we can conclude that the inhibitors are not as important as Cdh1
in exit of mitosis when Cdc20 activity is dramatically reduced (APC-A cdh1∆ is
inviable).
Prediction 15 emphasizes the role of the checkpoint monitored by Mad2 in the
quadruple mutant sic1∆ cdc6∆2-49 cdh1∆ GALL-CDC20.
Finally, in predictions 16-18, it appears that Clb2 and Clb5 levels are critical in
retaining the viability of net1ts in nocodazole.
We propose to explain four of the predictions in detail here.
(1) cln1∆ cln2∆ cln3∆ cannot be rescued by cdc6∆2-49. In a cdc6∆2-49 mutant, Cdc6
loses its ability to inhibit the B-type cyclins but retains its role as a licensing factor. We
showed in the previous version of the model (Chen et al, 2000) that the quadruple mutant
cln1∆ cln2∆ cln3∆ sic1∆ is viable and large. In this mutant, Clb5 is not inhibited and is
able to push the cells in S phase. When deleting the second stoichiometric inhibitor of the
model, CDC6, the triple-cln mutant cannot be rescued and the quadruple mutant,
cln1∆ cln2∆ cln3∆ cdc6∆2-49, remains arrested in G1. This inviability comes from the
fact that Sic1 is still abundant and able to bind to Clb5 tightly, rendering the Start
transition impossible.

56
Figure 3.11. Simulation of the quadruple mutant cln1∆ cln2∆ cln3∆ cdc6∆2-49
(2) cdc20∆ pds1∆ (Shirayama, 1999) can be rescued by two extra copies of CDC15. The
double mutant arrests in telophase but since MEN is active, Cdc14 is released. The high
level of the Cdc28/Clb dimers keeps the mutant blocked, though. If extra genomic copies
of CDC15 are added, more Cdc14 is released and more Cdc28/Clbs can be degraded. The
triple mutant is predicted to be alive.
Figure 3.12. Simulation of cdc20∆ pds1∆ + an extra-copy of CDC15
(3) cdc20∆ pds1∆ (Shirayama, 1999) can be rescued by TAB6-1 (dominant Cdc14
mutation; the binding between Net1 and Cdc14 is reduced -- Shou, 2001). The mutant is
alive, with more Cdc14 released. The result is comparable to but not as dramatic as a
net1ts mutant (viable but with a long G1 phase). For the same reasons described in the
previous prediction, TAB6-1 releases more Cdc14 in the double mutant cdc20∆ pds1∆,
which allows more degradation of the dimers and causes the cells to exit mitosis.
Sic1T
Cdh1 Clb5T
Clb2TMass
Time
Concentration (a.u.)
Time
Mass Sic1T
Clb2T Cdh1
Clb5T
Cdc14
Concentration (a.u.)

57
Figure 3.13. Simulation of cdc20∆ pds1∆ + TAB6-1
(4) cdc20∆ pds1∆ clb5∆ is viable (Shirayama, 1999). Clb2 and Cdc14 compete in Cdh1
activation. In the triple mutant, Cdc14 level is high enough to provoke Cdh1
dephosphorylation and activation. Clb2 is degraded and the cell exits mitosis. If the
activity of Cdc14 were slightly decreased, Clb2-kinase activity would win over Cdc14
and the cell should remain stuck in M phase. Therefore, an increase in the number of
copies of NET1 (+50%) (Figure 3.14) or a decrease in the number of copies of CDC15 or
CDC14 (-50%) arrests the triple mutant in telophase.
Figure 3.14. Simulation of cdc20∆ pds1∆ clb5∆ + 1.5X NET1
The predicted mutants are also simulated on the web page at “mpf.biol.vt.edu”.
Sic1T
Cdc14 Clb5T
Clb2T
Mass
Cdh1
Concentration (a.u.)
Time
Cdc14Cdc15
Clb2T
Mass Sic1T
Time
Concentration (a.u.)

58
Chapter 4: The Web Page
Why is a web page needed? An article describing the model presented in chapter 3
was recently submitted to the journal Molecular Biology of the Cell (Chen et al., 2003).
The article by itself would not be able to answer all the questions that the model raises. I
therefore developed this web page to provide all the necessary information. The web page
was then carefully checked and corrected by Dr. K. Chen.
The web page is designed to accompany the reader in a more in-depth understanding
of the mathematical model, and also to get more familiar with the model and the
techniques to build it. Simulations of all the mutants, references, equations, parameter
values, predictions, problems and an online simulator are available as well.
The web page is supposed to answer the needs of molecular biologists. We therefore
asked some potential users to evaluate the web site and provide us with critical
comments. Drs. Wolfgang Zachariae, Frank Uhlmann, Mike Mendenhall, and Jacky
Snoep reviewed the web site and suggested some improvements.
Some of the criticisms concerned the design. The web page needed to be made a
little easier to read. It was suggested that a similar structure should be maintained
throughout the web site. At first, the main page was used as some kind of navigator by
simply listing the different pages that could be found on the web site along with a
description of who we are and the goals of modeling the cell cycle of the budding yeast.
Each link sent the user to another page. Keeping the same information, I changed it in
such a way that the first page is now composed of three frames. Two of these frames,
namely the title and the navigation bar, never change throughout the whole web site.
Some other comments revolved around the equations and the parameter set. At first
glance, the model and its nomenclature appeared to be confusing. Keeping track of the
parameter names and their role in the equations is not an easy task. Therefore, I added a
page defining each parameter and, when available, the reason of the choice of the value
and its range (for wild-type viability). This page can be accessed directly from “Model”
or by clicking on the parameters themselves on the “Parameters” page.
Another major comment was related to the model itself. When unfamiliar with the
techniques, modifying the model appears to be a challenge. To help the user in this

59
process, I inserted a page where the “ode” and “set” files of the two versions of the model
(the “cell” and the “cell + target” models) are available to download along with guidance
on how to modify the model and how to use WinPP.
A weak point of the web site is the obligation for the user to resize any newly
opened window for better viewing since the latter appears on top of the main one.
The different sections
All the information of the model was gathered and organized into the web site
“Modeling the Budding Yeast Model” at the address “mpf.biol.vt.edu” and accessed by
clicking on “Budding Yeast Model”. What can be found on the web site?
Figure 4.1. First page of the web site “Modeling the budding yeast”.
Several sections give in-depth information about the model.
Introduction: After discussing the biology of the budding yeast, the components of the
model are introduced one by one. The main idea of the basic mechanism controlling the
budding yeast cell cycle on which the full model is based is developed (bistability idea).

60
A last sub-section briefly states the improvements of the model from the previous model
of Chen et al. (2000).
Model: This section is dedicated to the wiring diagram and the mathematical model.
When clicking on “Model” on the navigation bar in the left frame, contents of the
“Model” page are listed.
A text walks the reader through the consensus picture, which can appear in another
window if desired. The justifications of the place of the proteins in the wiring diagram
can be found in a sub-section of “Model” or by clicking on the different components of
the wiring diagram itself. The function, level and activation/inactivation rules of some of
the components or pathways (Cdc20, Cdh1, Cdc14 activation, Mitotic Exit Network,
Pds1/Esp1 interaction, CKI and the checkpoint proteins) are reported here (accompanied
with references).
It is also possible to access the equations, and the parameters from this page. A
WinPP simulation shows a graph of the wild-type daughter cell and gives characteristics
such as cycle time, length of the G1 phase and mass at division for wild-type cells in
glucose and in galactose.
Equations/Parameters: The equations are organized in subgroups such as equations
governing cyclin-dependent kinases where the differential equations of the cyclins are
described, but also equations governing the inhibitors of the cyclins with Sic1, Cdc6, and
their inactive complex forms, etc…
On the “Parameters” page, a verbal description of the parameters can be obtained by
clicking on the parameter itself. If applicable, a reason for the given value is also
available.

61
Figure 4.2. Equations/Parameters
Mutants: In this page, the screen is divided into two frames. The first one gives a list of
mutants arranged in sub-groups (Cln mutants, Bck2 mutants, cln1 cln2 cln3 strain, Cdh1,
Sic1 …). By clicking on each of them, a drop-down list appears and the user can choose
to see a mutant on the list. If the mutant of interest is for instance cdc20ts in the sub-group
Cdc20 mutants, the user chooses mutant 1. On the right frame, a page with all the
information concerning the mutant then appears. First, the simulation shows a graph and
gives details such as the values of the modified parameters dictated by the experiment,
length of G1 phase, mass at division and if the mutant is inviable where it arrests.
Second, the “experiments” part indicates where in the literature the mutant was defined.
If it is possible, the corresponding figure from the paper, where the mutant appears, is
shown.

62
Figure 4.3. The mutant page.
Problems: A table lists the mutants that cannot be simulated properly by the model. A
reason for their failure along with ways to modify the model to fit the experiments is
given for each of them. For more details about each mutant, a link to the mutant page is
available.
Predictions: Here, the reader can find some of the predictions from the model with the
corresponding WinPP simulation.
Robustness: Dr. Fred Cross tested the wild type and few mutants (cdh1, APC-A, cki) for
robustness. Each parameter is increased and decreased by a log 2 factor and a range of
viability for each parameter gives an idea of how the model handles changes.

63
References: The references used anywhere on the webpage are collected here in an
alphabetical order. For each publication, a link to the abstract (in “www.pubmed.org”) is
available and when possible, to the pdf version of the paper itself.
The target model: There exists another version of the model presented here that can
explain the experimental data of the mutant cdc6∆2-49 cdh1∆ sic1∆. Dr. Fred Cross
(2003) found that the triple mutant is able to undergo nuclear division even though
Cdc28/Clb2 level remains high (all its inhibitors are deleted). One reason that would
explain the unexpected phenotype of the mutant could be the presence of an additional
target protein of Cdc14. In this version, Cdc14 is able to phosphorylate other target
proteins that also control exit from mitosis.
Publications: A list of previous publications from both Tyson and Novak’s labs is
available here.
Get WinPP: The “ode” and “set” files can be downloaded from this page. An explanation
on how to modify the model and on how to use WinPP is also available.
Simulator: This online simulator was created by Jason Zwolak. The user is able to plot
directly online the proteins of interest and simulate any mutant by changing the
corresponding parameters. Four windows appear. The first one tells the user what is
being computed. The second one shows the simulation and asks the user for the proteins
that need to be plotted and their color (ten of them are chosen by default). The third one
allows to change values of the parameters to simulate mutants. The fourth and last one is
a small window describing the proteins.
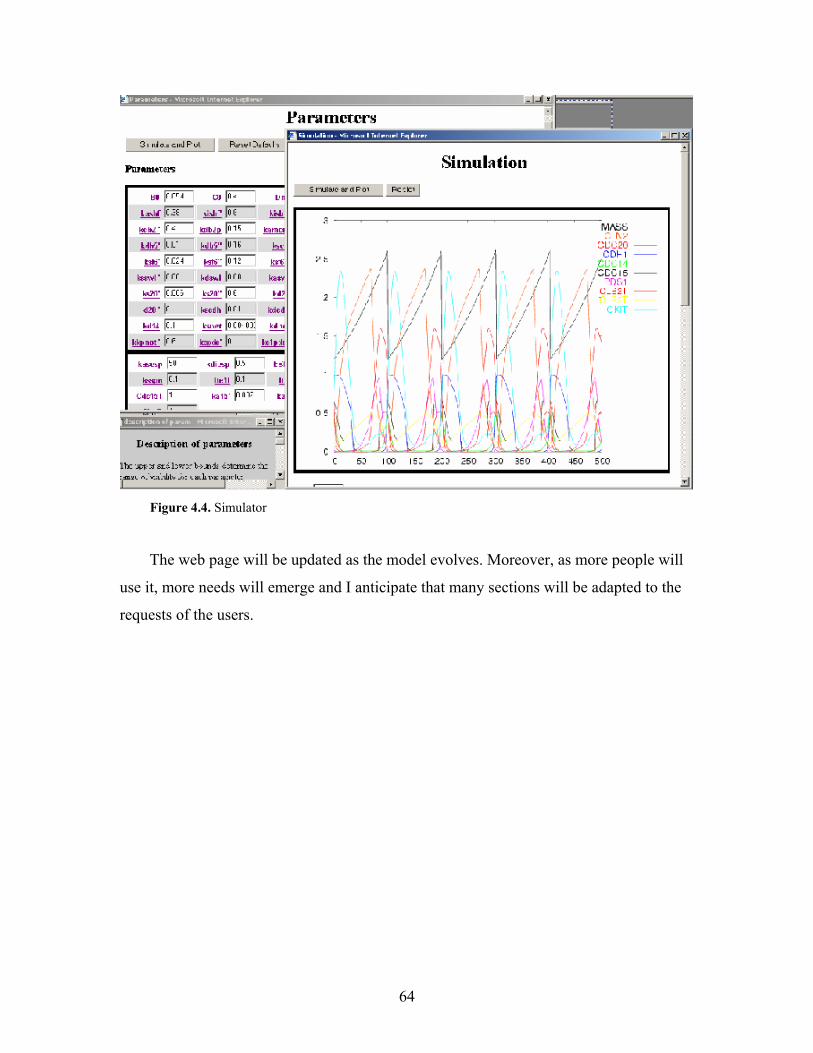
64
Figure 4.4. Simulator
The web page will be updated as the model evolves. Moreover, as more people will
use it, more needs will emerge and I anticipate that many sections will be adapted to the
requests of the users.

65
Chapter 5: The mammalian cell cycle and the MAP kinase pathway
5.1. Similarities between mammalian and budding yeast cell cycle
It was argued in chapter 2 that the budding yeast was a good organism to analyze in
order to understand more complex organisms such as mammalian cells. I propose here to
review some aspects of the mammalian cell cycle on both experimental and
computational points of view. The budding yeast and the mammalian cell cycle share a
lot of similarities in proteins with homologous functions as shown in Table 5.1, modified
from Tyson (1999).
Budding yeast cells Mammalian cell Function
Cln3 CycD Starter kinase
Clb5 CycE G1/S transition
Sic1 Kip1 CKI in G1
SBF Rb/E2F transcription of G1/S
Clb2 CycB mitotic cyclin
Cdh1 Cdh1/APC degradation of cyclins
Cdc20 Fizzy/p55cdc activator of the APC Table 5.1. Homolog proteins of mammalian and budding yeast cells and their function (Tyson, 1999). In most of these homologous proteins, both sequences and functions are conserved.
The amount of information concerning mammalian cells and the numerous cell types
make the study of a general model difficult. As a starting point, Tyson and Novak
developed a model based on Zetterberg’s work on the restriction point.
5.2. Background of mammalian cell cycle
5.2.1. Zetterberg’s experiments
Pardee (1989) first introduced the idea that cells commit themselves to cell cycle
events at a certain point in the G1 phase. He performed experiments in which he treated
cells with cycloheximide (an inhibitor of protein synthesis). He observed that depending
on the time at which the cells were treated, they responded differently. For instance, if
cells were treated during the first 3 hours of the cycle, they arrested. However, when cells

66
were treated approximately 3 hours after division, even if protein synthesis was blocked,
the cells completed the cell cycle. This turning point is called the restriction point.
Supporting Pardee’s idea, Zetterberg (1995) proposed the possibility of a G1 phase
divided into two sub-phases: the G1-pm (post mitotic) and the G1-ps (pre S phase) by
studying pulse treatments.
To do so, growth factors were removed and added back to the cell at different stages
of the cell cycle. If the cells were treated during the first 3 hours following mitosis and
for a period of at least an hour, then mitosis was delayed for 8 hours. In figure 5.1, cells
that were treated for one hour show delay in the first 3 to 4 hours of G1 but cells that
were treated during the rest of the cell cycle finish their cycle on time (Figure 5.1 a).
Figure 5.1 Experimental (a) and simulated (Novak and Tyson, manuscript in preparation) (b) results of the first cycle of cells deprived from growth factors at different points of the cell cycle.
This result can be explained by looking at a simplified wiring diagram showing how
growth factors impinge on the cell cycle (Figure 5.2).
growth
GF MAPK pathway CycD Rb
Cell cycle Cyc A, E, B
Figure 5.2 Growth factors activate the MAPK cascade, which leads to CycD synthesis. CycD phosphorylates Rb and allows growth to proceed and the synthesis of other cyclins. These cyclins can then keep Rb phosphorylated so CycD is not needed anymore.
Experiment
(a) (b)
Cell age (h)0 4 8 12
0
10
20
30
+/- 10%
Simulation
mean cell size

67
When the cells are deprived of growth factors, CycD level drops to zero and it takes
8 hours following the treatment to reproduce CycD necessary to start the cell cycle events
through Rb phosphorylation.
If the same treatment is done after the restriction point, in G1-ps, it has no effect on
the first mitosis and no delay is observed. The cells do no respond because they are
already committed to do DNA synthesis and they advance through the cell cycle
normally. At this point, even if the level of CycD drops to zero, other proteins,
Cdk/cyclins, are capable of keeping Rb phosphorylated and CycD is not needed anymore.
In figure 5.3 a, Zetterberg records the intermitotic time of treated cells in order to
check what the consequences of growth factor deprivation are on the second cycle. The
cells that show a delay in the first mitosis show no delay in the second mitosis. However,
only the cells treated in G2 show a relative delay in the second mitosis. When growth
factors are put back in the cell, CycD is activated again 8 hours later, explaining the delay
in the second mitosis for cells treated in G2.
Figure 5.3. Second cell cycle. Experimental (a) and simulated (Novak and Tyson, manuscript in preparation) (b) results. Intermitotic time (in hours) of the cycle following treatment is measured.
Zetterberg studies 3T3 cells that have a cell cycle of 14 hours, with a G1 phase of 7
hours. The cells in G1-pm do not experience any delay in the second cycle. Cells treated
after the restriction point still need 8 hours to reproduce CycD but depending on the time
of the treatment, this production may not affect the rest of the cell cycle. For example, if a
Experiment Simulation
(a) (b) Cell age (h)
0 4 8 126
10
14
18
22
26
30

68
cell is treated 12 hours after the first mitosis and for an hour (12+1), it divides on time (at
t=14+1=15), but the second mitosis occurs at time 35 (21+14). Since it takes 8 hours for
CycD to reactivate from the moment growth factors are deprived from the cell
(13+8=21), the first cycle is unaffected but the second experiences a delay equal to the
time it takes for CycD to be made again. The following figure (Figure 5.4) shows some
examples of treatment at different times and the effects on the two first cell cycles.
control 0 14 28 treatment at t=1h 0 1 10 23 37 treatment at t=4h 0 4 13 15 29
treatment at t=12h 0 12 15 21 35
Figure 5.4. Cell treated at different times during the cell cycle. (not scaled – in hours) Time of the first and second cycles
The all-or-none character in Zetterberg’s experiments appears very clearly. If the
treatment is done in G1-pm, mitosis occurs with an 8-hour delay; if they are done after
the restriction point, there is no delay. The restriction point adopts the properties of a
threshold that the cell has to pass to commit itself to DNA replication. There is no
intermediate stage in which the cells experience a partial delay. When growth factors are
depleted, CycD activity drops to zero, the system switches to an off state.
In Novak and Tyson model, all these characteristics are simulated (Figures 5.1 b and
5.3 b). When CycD is inactivated early in G1, Rb stays in its hypophosphorylated form
and none of the cyclins can be synthesized. Growth is stopped and the cells get stuck in
G0 until growth factors are added back. When CycD level drops to zero after the
restriction point, in other words, after CycD has started phosphorylating Rb, it has
already started the cell cycle, and other cyclins are able to keep Rb phosphorylated. And
the cell cycle cannot be altered.
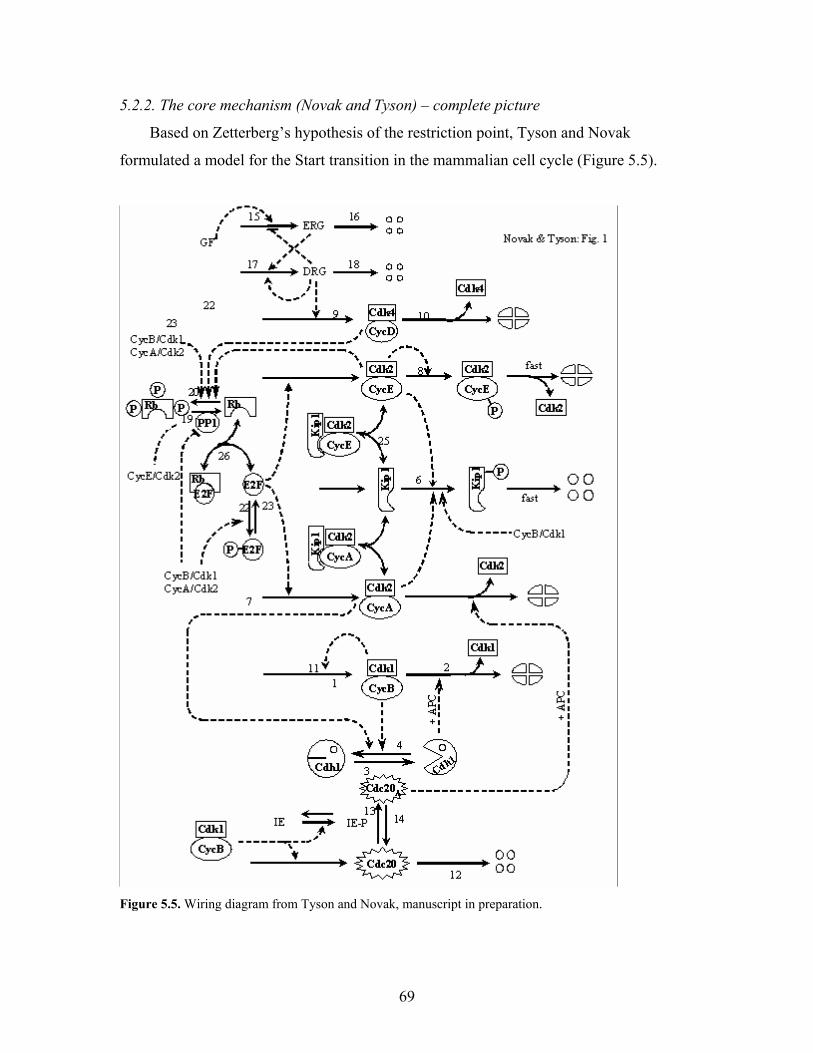
69
5.2.2. The core mechanism (Novak and Tyson) – complete picture
Based on Zetterberg’s hypothesis of the restriction point, Tyson and Novak
formulated a model for the Start transition in the mammalian cell cycle (Figure 5.5).
Figure 5.5. Wiring diagram from Tyson and Novak, manuscript in preparation.

70
At the beginning of the cell cycle, in early G1, CycD/Cdk4 is activated. Rb, the
retinoblastoma protein is in its unphosphorylated and active form. When Rb is active, it
binds to E2F, a transcription factor of CycE/Cdk2. The phosphorylation of Rb by
CycD/Cdk4 frees E2F from the complex it was forming with Rb and the synthesis of
CycE/Cdk2 and CycA/Cdk2 is activated. When CycE and CycA are made, they feed
back on Rb and phosphorylate it more, inducing even more their own synthesis. Even if
CycE/Cdk2 and CycA/Cdk2 syntheses are on, CycE/Cdk2 and CycA/Cdk2 form
immediately an inactive trimer with the kinase inhibitor Kip1. But as the cyclins’ levels
rise, some Kip1 is phosphorylated and degraded by the SCF. Kip1 is completely
degraded with the appearance of CycB/Cdk1. The cyclins make sure that Rb remains
inactive not only by phosphorylating Rb but also by phosphorylating and inactivating its
phosphatase PP1.
When CycB/Cdk1 comes up, it activates its own degradation machinery by
activating an intermediary enzyme that in turns activates Cdc20. Cdc20 not only starts
degrading CycA/Cdk2 but also activates Cdh1, the major protein responsible for CycB
degradation. When CycB goes away, the cell exits from mitosis. CycB/Cdk1 plays a
major role in mitosis.
The Finish transition in mammalian cells is not clearly defined yet. The simplistic
mechanism describing exit from mitosis in the present model is outdated. This process
involves a more complex pathway and requires proteins like the budding yeast Cdc14-
homolog or pathways such as MEN. The budding yeast model could provide some good
ideas on how this process is done in mammalian cells.
5.3. THE MAP KINASE PATHWAY
In response to a signal coming from growth factors, CycD is expressed (CycD/Cdk4
activates) and causes proliferation. This signal is transmitted to the nucleus through the
MAP kinase pathway. However, the details of this process are still unknown, and will
require extensive research and mathematical modeling in order to test different
hypotheses.

71
5.3.1. Definition
The MAP (Mitogen-Activated Protein) kinases are involved in a pathway through
which information is sent to the nucleus. The MAP kinase pathway is composed of 3
consecutive kinases (MAPKKK, MAPKK, and MAPK). MAPKKK phosphorylates and
activates MAPKK, which in turn phosphorylates and activates MAPK. The cascade is
initiated by a signal coming from outside the cell.
stimulus MAPKKK MAPKK MAPK response
cell nuclear membrane membrane Figure 5.6. The MAPK pathway. A stimulus is sent to a membrane receptor that activates the MAPK pathway. When MAPKKK is phosphorylated, it activates MAPKK by phosphorylating it. The same way, MAPKKP activates MAPK. The message is passed on to the nucleus and translated into a response.
The stimulus can be progesterone for frog eggs, pheromones for yeast cells, and
growth factors for mammalian cells. Each type of cell exhibits a different response. In the
case of frog eggs, progesterone stimulates immature oocytes to become mature and ready
for fertilization; for yeast cells, pheromones block the cells in G1 and prepare the cells for
mating; and in mammalian cells, growth factors cause proliferation. Different target
proteins turned on by MAPK kinase pathway define the specificity of the response in
different cells.
This cascade seems to behave like a switch in response to external stimuli (Ferrell,
1996, 1998). The details on how the cell responds to this external signal are still unclear.
What is already known is that small concentrations of the stimulus do not activate the
cascade, but this activation occurs abruptly after the concentration reaches a threshold
value.
To understand the role played by the cascade and relate the stimulus to the response,
we look for a mathematical expression of the behavior of this cascade. The dual
phosphorylation of MAPKK and MAPK gives a nonlinear character to the response.
From this point, experimentalists tried to describe this relation and found different ways
to represent it.
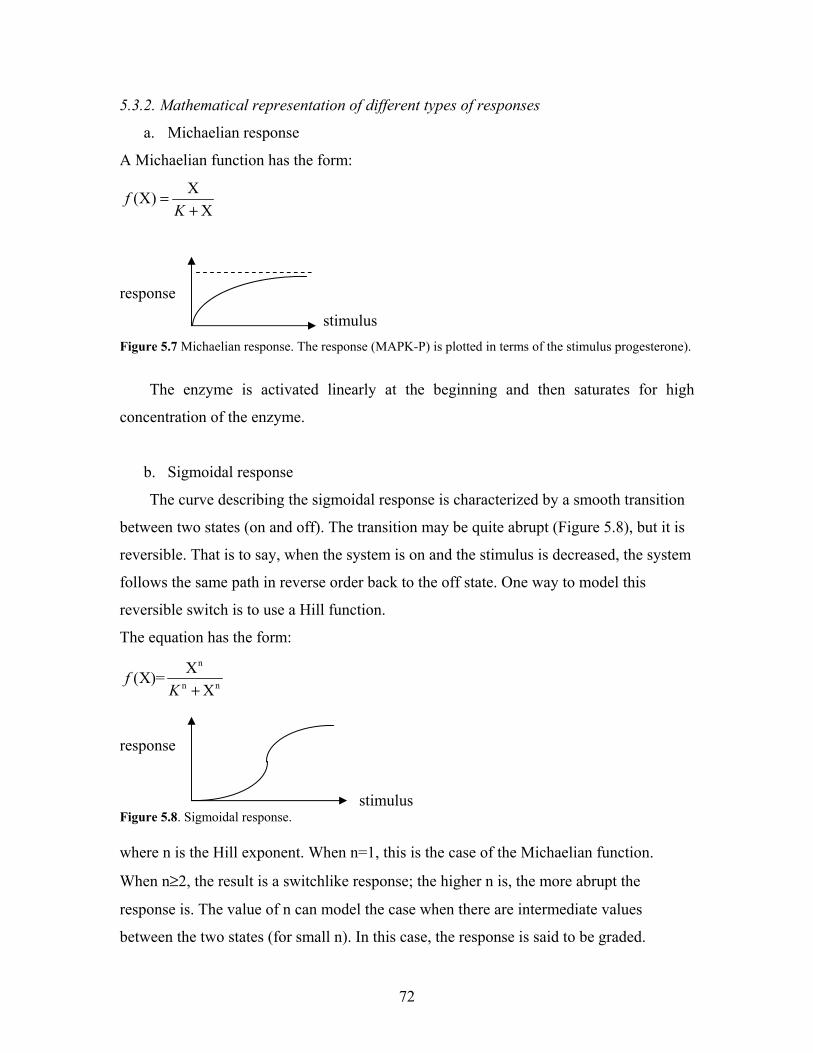
72
5.3.2. Mathematical representation of different types of responses
a. Michaelian response
A Michaelian function has the form:
X(X)X
fK
=+
response
stimulus Figure 5.7 Michaelian response. The response (MAPK-P) is plotted in terms of the stimulus progesterone).
The enzyme is activated linearly at the beginning and then saturates for high
concentration of the enzyme.
b. Sigmoidal response
The curve describing the sigmoidal response is characterized by a smooth transition
between two states (on and off). The transition may be quite abrupt (Figure 5.8), but it is
reversible. That is to say, when the system is on and the stimulus is decreased, the system
follows the same path in reverse order back to the off state. One way to model this
reversible switch is to use a Hill function.
The equation has the form: n
n n
X(X)=X
fK +
response
stimulus Figure 5.8. Sigmoidal response. where n is the Hill exponent. When n=1, this is the case of the Michaelian function.
When n≥2, the result is a switchlike response; the higher n is, the more abrupt the
response is. The value of n can model the case when there are intermediate values
between the two states (for small n). In this case, the response is said to be graded.

73
c. All-or-none response
An all-or-none response is the case when no intermediate activation is observed, as
opposed to a graded response. It is a bistable system with two stable steady states. This
transition can be either irreversible and non-returnable or irreversible and returnable
(Hysteresis).
- Irreversible and non-returnable or “one-way bistability”. Once the system is
active, it cannot be deactivated by reducing the stimulus to zero.
response
stimulus Figure 5.9. One-way bistability.
- Irreversible and returnable or “two-way bistability”. This situation is observed in
mammalian cells with CycD level as the response of the stimulus (GF). It is possible to
remove growth factors (stimulus) and inactivate CycD (response).
response
stimulus Figure 5.10. Two-way bistability
5.3.3. MAP kinase pathway in Ferrell’s experiments
Ferrell’s group (1998; Xiong, 2003) studied the behavior of the MAP kinase
pathway in Xenopus. His elegant experiments show the all-or-none behavior of the
response.
As mentioned earlier, in Xenopus eggs, progesterone triggers oocyte maturation.
Progesterone binds to membrane receptors, and activates the MAP kinase cascade. When
Mos (MAPKKK) is activated, it phosphorylates Mek-1 (MAPKK), which phosphorylates
p42 (MAPK). In his paper, Ferrell investigates the all-or-none character of the MAP

74
kinase pathway by observing the phosphorylation of p42-MAPK as progesterone
concentration varies. More experiments test the role of a possible positive feedback by
injecting the cells with cycloheximide in order to block protein synthesis.
A first set of experiments (Ferrell, 1998) is done on egg extracts. He examines the
activity of the p42-MAPK in response to malE-Mos, a fusion protein, activating the
pathway (simulate effect of progesterone). Ferrell observes that the response is a
sigmoidal function with a Hill exponent of 5.
When the same experiments are done in vivo (population of living oocytes), the
results show a Michaelian response. At this point, Ferrell explores two possible
interpretations: either the population is homogeneous and the response is not switchlike,
or the population is heterogeneous and the response is switchlike in individual oocytes.
Ferrell tests these hypotheses by verifying the state of the last kinase of the cascade in
each individual oocyte as the concentration of the progesterone varies. The p42-MAPK
does not exhibit any intermediate phosphorylation; it seems to be in either its
nonphosphorylated or phosphorylated form (details in Fig1 E-F in Ferrell, 1998), proving
the all-or-none response of the p42 kinase.
Another question arises concerning the all-or-none character of the response. Is it
generated by the cascade alone or does it also require a feedback signal? Ferrell assumed
the existence of a positive feedback because the response in oocytes looked more like a
switch than in extracts. The reason could be a feedback existing in oocytes only but not in
extracts. He decided to investigate the role this possible feedback plays in the MAP
kinase pathway. He used cells injected with malE-Mos (to simulate the effect of
progesterone) and treated them with cycloheximide. That way, if there exists a feedback
acting on the synthesis of Mos and responsible for the switchlike behavior of the
pathway, as expected, the cycloheximide will knock it out, since it blocks protein
synthesis. From these experiments, Ferrell concluded that the response was graded in
cells with cycloheximide with a smaller Hill coefficient than in normal cells, but the
response was all-or-none in normal cells simply injected with malE-Mos. The
immunoblots (or the cumulative data representing the state of phosphorylation of the p42-
MAPK of each individual oocyte), show that it is possible to catch cells with intermediate

75
level of phosphorylation (30 to 70%) at a concentration of 20nM of Mos (details in Fig. 2
A-D in Ferrell, 1998).
When the protein synthesis is blocked, it knocks out the positive feedback. As a
result, the activation of p42-MAPK exhibits a graded response (Ferrell, 1998). Ferrell
assumes from these results that p42-MAPK (or something downstream) positively feeds
back on Mos. However, in this paper, it is not clear if the feedback is directed towards the
synthesis of Mos or its phosphorylation. It could also be argued that the cycloheximide
acts at different stages of the signal transduction pathway. For example, MPF could, as
well, be responsible for the stabilization and accumulation of Mos. From these
experiments, we clearly see the switchlike response but it is hard to say where this
feedback intervenes. Very recently, Ferrell’s group published a paper (Xiong, 2003)
describing where the feedback effects are known.
To better understand the behavior of the system, Ferrell proposes a mathematical
model (2001) supporting the hypotheses that the mechanism needs bistability and a
positive feedback. Consider an enzyme A in its phosphorylated and nonphosphorylated
form, where A promotes its own activation helped by a stimulus S.
Ainactive Aactive
S Figure 5.11. Schematic representation of an irreversible bistable system. The forward reaction is stimulated by S, a stimulus and a nonlinear function of Aactive.
The forward reaction (from inactive to active form) can be represented as a
sigmoidal function of Aactive and S, and the back reaction (from active to inactive form) as
either a linear function or a Michaelian function.

76
ON
ON S>0 rate rate S=0 S=0 saddle
OFF
(A) Aactive (B) Aactive
Figure 5.12 Rate balance plot. (A) S=0, there are two stable steady states separated by a saddle point. (B) As S increases, the saddle point and one of the two stable steady states are lost. The system then moves to the ON state.
For S=0, there are two stable and one unstable steady states. If A is mostly inactive,
it is in its OFF state. As S increases, A activates. When the lower stable steady state and
the unstable steady state collide (Saddle Node bifurcation point), the OFF state is lost and
the system moves into the ON state. In this case, if the stimulus is removed (S=0), the
system remains in the ON state. This is the case of an irreversible and non-returnable all-
or-none situation. The system exhibits “one-way bistability” (Figure 5.9).
This mathematical model is consistent with Ferrell’s experiments and the
observation that once the MAPK is activated, the system stays on. His understanding of
the MAPK pathway and the switchlike response could provide some insights in
organisms that demonstrate similar all-or-none behaviors.
5.3.4. MAPK pathway in mammalian cell cycle
In their paper describing early events in mammalian cell cycle, Tyson and Novak
describe the activation of CycD in a phenomenological manner (Figure 5.13). Growth
factors activate the ERG (early response genes), which activate the LRG (late response
genes). To create a positive feedback, it is assumed that LRG can turn off ERG synthesis
and activate its own transcription. LRG then induces CycD synthesis.

77
(a)
(b)
Figure 5.13. (a) This mechanism is responsive to growth factors. It behaves like a switch and when it is on, it activates CycD (from Tyson and Novak, manuscript in preparation). ERG is activated by growth factors and activates, in turn, LRG. When LRG is on, it inhibits ERG and promotes its own activation through a positive feedback. CycD is then activated. (b) Bifurcation diagram. LRG is a function of the stimulus S (GF here). The diagram shows a “Two-way bistability”.
This model is not realistic though. There are other ways to create a bistability
behavior. Inspired by some work done by other groups (Bhalla, 1999; Shvartsman, 2002;
Bluthgen, 2003), I suggest next one alternative to model the MAPK pathway, which is
closer to what is already known about the pathway.
In Xenopus eggs, we define the system as a “one-way bistability” mechanism,
whereas in mammalian cells, we are in the case of a “two-way bistabilty”. It seems that a
simple change of parameters could illustrate the translation of curve from one system to
another. It is easy to test this idea by simulating the MAPK cascade mathematically. The
diagram of the cascade is the following:
ERG
LRG
GF

78
S
MAPKKK MAPKKKP
MAPKK MAPKKP
MAPK MAPKP Figure 5.14. The MAP kinase cascade.
There are different ways to transcribe this diagram into mathematical notations. One
way to express it is to use the form introduced by Goldbeter and Koshland (1981)
describing a very abrupt switch, called the “zero-order ultrasensitivity” switch.
Let X be an enzyme that can be found in two different forms, active and inactive.
Each form follows Michaelis-Menten kinetics.
V2 Xactive Xinactive
V1
If we assume that X is the active form, the differential equation representing the
switch is as follows:
1 tot 2
1 tot 2
([X] [X]) [X][X]=t [X] [X] [X]
Vd Vd K K
⋅ − ⋅−+ − +
where V1 is the rate of activation, V2, the rate of inactivation, and K1 and K2, the
Michaelis constants.
Using this notation, we can formulate a set of equations describing the cascade and
find the appropriate sets of parameters that fit both the “one-way bistability’ and the
“two-way bistability” systems.

79
'1 1 tot 2
1 tot 2
3 tot 4
3 tot 4
( [MAPKP]) ([MAPKKKP] [MAPKKKP]) [MAPKKKP][MAPKKKP]=t [MAPKKKP] [MAPKKKP] [MAPKKKP]
[MAPKKKP]) ([MAPKKP] [MAPKKP]) [MAPKKP][MAPKKP]=t [MAPKKP] [MAPKKP] [MAPKKP]
k S kd kd J J
kd kd J J
⋅ + ⋅ ⋅ − ⋅−+ − +
⋅ ⋅ − ⋅−+ − +
5 tot 6
5 tot 6
[MAPKKP]) ([MAPKP] [MAPKP]) [MAPKP][MAPKP]=t [MAPKP] [MAPKP] [MAPKP]
k kdd J J
⋅ ⋅ − ⋅−+ − +
Table 5.2. Nonlinear system of differential equations of the MAP kinase cascade with '
1k =3, 1k =5,
2k =2, 3k =2, 4k =1, 5k =2, 6k =1, 1J =0.1, 2J =0.1, 3J =0.1, 4J =0.1, 5J =0.05, 6J =0.05,
tot[MAPKKKP] = tot[MAPKKP] = tot[MAPKP] =1, S =1 When S, the stimulus, is equal to 1, the system activates as follows:
Figure 5.15. MAPKKKP (black), MAPKKP (red), MAPKP (blue). Here, MAPKP is activating more abruptly than MAPKKP and even more than MAPKKKP, as explained in Ferrell’s papers.
To find the minimal value of S for the system to activate, we study different
bifurcation diagrams for different situations. These diagrams provide an illustration and a
thorough understanding of the behavior of the systems mentioned earlier.
When 2k =2, we obtain the “one-way bistability” (Figure 5.9). We plot the MAPK in
its active form as a function of the stimulus S. When the concentration of the stimulus
reaches the threshold value (S=0.4658), it moves to the upper branch. If S is brought back
to a small value (inferior to the threshold value), the system stays on the upper branch.
This set of parameters can be associated to the all-or-none behavior of Xenopus eggs.

80
Figure 5.16. Bifurcation diagram. MAPKP as a function of the stimulus S. “One-way bistability” with
2k =2. When 2k =5, the whole diagram switches to the right. This is the case of a “two-way
bistability” (Figure 5.10). Now the two saddle node bifurcation points appear, and the
system is returnable. When on the upper branch and S is decreased to a very small value,
it is possible to switch back to the lower branch of the bifurcation diagram. This is a
“two-way bistability” situation, as observed in the restriction point of mammalian cells.
Figure 5.17. Bifurcation diagram. MAPKP as a function of the stimulus S. “Two-way bistability” with
2k =5
This interpretation of the MAPK activation could provide another alternative in
modeling CycD activation by growth factors in the mammalian cell cycle.
5.3.5. Conclusions
The goal, here, was to compare two behaviors of the MAP kinase cascade and offer
a better understanding of its all-or-none character. Ferrell showed the irreversible and
non-returnable character of the response in the Xenopus egg maturation, whereas
Zetterberg proved the reversible but returnable character of his system and verified the
81
notion of a restriction point in mammalian cells. A simple change of parameters in the
mathematical model shows that both systems are controlled by similar mechanisms but
exhibit different behaviors (confirmed by Xiong, 2003).

82
Chapter 6: Conclusions 6.1. What mathematical models can do!
In summary, mathematical models can improve our comprehension of complex
biological systems. Through the study of such quantitative models, it is possible to check
the validity of a wiring diagram representing some physiological property of a cell.
Where the model fails, it indicates weaknesses of the proposed mechanism and suggests
ways of improvement. A more interesting aspect of these models is their predictive role.
The models allow one to formulate critical experiments to test the interactions among the
regulatory elements and to predict phenotypes of new mutant combinations (Cross, 2002,
2003; Miller, 2001; Sha et al., 2003; Pomerening et al., 2003). Finally, mathematical
models can integrate information from many experiments and organize the results in a
coherent and logical way.
6.2. Open problems
The complexity of our cell cycle models has increased considerably through the
years. Along with the number of proteins, the difficulty to find an appropriate set of
parameters that describes the physiology of the cell has increased too. Therefore, there is
a great need for automated ways to find the best parameter set based on the experimental
data. Today, modelers require the assistance of good software, and great efforts are being
made to provide these tools. Examples include Virtual Cell (Schaff, 1999), BioSpice
(Allen et al., 2003), Gepasi (Mendes, 1993, 1997), Systems Biology Workbench (Hucka,
2002), and E-cell (Tomita, 1999).
6.3. What is next?
Drosophila melanogaster cell cycle, although comparable to budding yeast (or fission
yeast and mammalian cells), presents interesting challenges. In Drosophila
embryogenesis, four different types of cell cycles are observed: cleavage, post-
cellularization mitosis, neurogenesis and endoreplication.

83
The first type of cell cycle is characterized by 13 cycles during which only nuclear
divisions occur, rapidly and synchronously. These cycles are called syncytial cycles, and
are driven by maternal genes. There are no G1 or G2 phases during these cycles.
The following three cycles gradually extend their cycle time, and a G2 phase can be
observed in some embryonic cells breaking the synchronicity of the cycles. They are
called post-cellularization cycles. A Cdc25 homolog, String, regulates the new G2/M
transition.
Some cells arrest in G2 after mitosis 14, while others, involved in the nervous system,
continue to divide normally approximately 5 to 8 times (Richardson, 1993). A G1 phase
is now introduced in these cycles. The G1/S transition is promoted by CycE.
The final type of cell cycle observed during embryogenesis is the endoreplication
cycle. In this case, several rounds of DNA replication occur without any cell division.
Endoreplication is driven by CycE (Follette and O’Farrell, 1997).
The regulation of these different cycles is still unclear. Some interesting experiments
go against the general belief that these early cycles could be MPF-regulated (complex
formed by the cyclin dependent kinase Cdc2 and a cyclin partner). In Xenopus embryos,
cell cycle divisions depend on the oscillating activity of MPF. However, in Drosophila,
Edgar et al (, 1994, figure 7) showed that the main cyclin, CycB is not oscillating and is
very slowly degraded in the first eight cycles. Even though the slight degradation of
CycB might appear negligible, it seems to play an important role. Some experiments have
showed that if some non-degradable form of CycB is introduced in the embryo, mitotic
cycles are blocked (Su et al., 1998).
Oscillations of MPF activity with increasing amplitude appear after the 8th cycle.
More and more CycB is being degraded at mitosis until the 13th cycle. During this period,
the cycles lengthen gradually. Edgar et al. (, 1994) proposed that this variation in cycle
time was due to the gradual depletion of maternal cyclins. When maternal String/Cdc25
is totally depleted, at mitosis 13, Cdc2/CycB activation is driven by new zygotic
String/Cdc25 from then on.
More experiments from Huang and Raff (1999) raised the question about CycB
localization. They showed that CycB was mainly degraded around the chromosomes, and
this degradation could be due to APC/fzy (Cdc20 homolog) located on the spindle, while

84
APC/fzr (Cdh1 homolog) could degrade the cytoplasmic CycB. In early cycles, APC/fzr
is absent which could explain the slow degradation of CycB in the first 8 cycles.
Based on previous models such as Xenopus or yeast (Novak et al., 1998a, 1998b;
Chen et al., 2000), I plan to build a model of the Drosophila cell cycles in early
developmental stages with the help of Dr. Andrea Ciliberto and Prof. Bela Novak from
the Technical University of Budapest, Hungary.
We will take in consideration the nuclear transport of CycB in the nucleus by
considering two compartments, cytoplasm and nucleus, to account for the unexpected
low variation in CycB level during early stages. The main components of the system are
CycB, Cdc2, APC/fzy, APC/fzr, Wee1 (kinase opposing Cdc25 in yeast and Xenopus)
and String/Cdc25. Cdc2 and CycB associate rapidly to form MPF. When Wee1 is active,
it phosphorylates and inactivates MPF, whereas the reverse reaction is carried by
String/Cdc25. As mentioned earlier, APC/fzy degrades CycB in the nucleus and APC/fzr
degrades CycB in the cytoplasm. We can also include in the model a stoichiometric
inhibitor of CycE, dacapo.
6.4. Last words
The extensive experimental research and the detailed models of the budding yeast
cells presented here offer a better understanding of the networks regulating the cell cycle.
The studies of rather primitive eukaryotes are, in fact, a bridge to approach more complex
organisms such as mammalian cells. However, with the limitations of the current
techniques, it would be presumptuous to pretend to be able to model mammalian cell
cycle in detail. That is why the real aim of these models is not to simulate reality but
provide a supplementary tool to advanced research in molecular biology. In a long term,
the ultimate purpose of the study of such models is to contribute to the research for curing
diseases that are not yet understood such as cancer, HIV, and diabetes.

85
References
Alexandru, G., Zachariae, W., Schleiffer, A., Nasmyth, K. (1999). Sister chromatid separation and chromosome re-duplication are regulated by different mechanisms in response to spindle damage. EMBO J. 18(10):2707-2721.
Alberts, B., D. Bray, et al. (1994). Molecular Biology of the Cell. New York, Garland Publishing, Inc.
Allen, N., Calzone, L., Chen, K.C., Ciliberto, A., Ramakrishnan, N., Shaffer, C.A., Sible, J.C., Tyson, J.J., Vass, M., Watson, L.T., and Zwolak, J. (2003). Modeling regulatory networks at Virginia Tech. OMICS 7(3):285-99.
Amon, A., Tyers, M., Futcher, B., Nasmyth, K. (1993). Mechanisms that help the yeast cell cycle clock tick: G2 cyclins transcriptionally activate G2 cyclins and repress G1 cyclins. Cell. 74(6):993-1007. Archambault V, Li CX, Tackett AJ, Wasch R, Chait BT, Rout MP, Cross FR. (2003). Genetic and biochemical evaluation of the importance of Cdc6 in regulating mitotic exit. Mol Biol Cell. [Epub ahead of print]. Bardin, A., Amon, A., (2001). Men and sin: what's the difference? Nat. Rev. Mol. Cell Biol. 2(11): p. 815-826. Baumer, M., Braus, G.H., and Irniger, S. (2000). Two different models of cyclin Clb2 proteolysis during mitosis in Saccharomyces cerevisiae. FEBS Lett., 468: p. 142-148. Bhalla, U S; Iyengar, R (1999) Emergent properties of networks of biological signaling pathways. Science 283, 5400: 381-387. Bluthgen, N. and H. Herzel (2003). How robust are switches in intracellular signaling cascades? Journal of Theoretical Biology 225(3): 293-300. Botchan, M. (1996). Coordinating DNA replication with cell division: Current status of the licensing concept. Proc. Natl. Acad. Sci. U.S.A. 93: 9997-10000. Brewer, B. J., E. Chlebowicz-Sledziewska, et al. (1984). Cell cycle phases in the unequal mother/daughter cell cycles of Saccharomyces cerevisiae. Mol. Cell Biol. 4: 2529-2531. Bueno, A. and P. Russell (1992). Dual function of CDC6 : a yeast protein required for DNA replication also inhibits nuclear division. EMBO J. 11(6): 2167-2176. Calzada, A., Sacristan, M., Sanchez, E., Bueno, A. (2001). Cdc6 cooperates with Sic1 and Hct1 to inactivate mitotic cyclin-dependent kinases. Nature 412(6844):355-358.

86
Chen, K.C., Csikasz-Nagy, A., Gyorffy, B., Val, J., Novak, B., and Tyson, J.J. (2000) Kinetic analysis of a molecular model of the budding yeast cell cycle. Mol Biol. Cell. 11(1), 369-391. Cheng, L., Hunke, L. et al. (1998). Cell cycle regulation of the Saccharomyces cerevisiae polo-like kinase Cdc5p. Mol. Cell. Biol. 18: 7360-7370. Ciliberto, A., Novak, B. and Tyson, J.J. (2003). Mathematical model of the morphogenesis checkpoint in budding yeast. Journal of Cell Biology Vol. 163, in press. Ciosk, R., Zachariae, W., Michaelis, C., Shevchenko, A., Mann, M., Nasmyth, K. (1998). An ESP1/PDS1 complex regulates loss of sister chromatid cohesion at the metaphase to anaphase transition in yeast. Cell 93(6):1067-1076. Cohen-Fix, O., Peters, J.M., Kirschner, M.W., Koshland, D. (1996). Anaphase initiation in Saccharomyces cerevisiae is controlled by the APC-dependent degradation of the anaphase inhibitor Pds1p. Genes Dev. 10(24):3081-3093. Cohen-Fix, O., Koshland, D. (1999). Pds1p of budding yeast has dual roles: inhibition of anaphase initiation and regulation of mitotic exit. Genes Dev. 13(15):1950-1959. Cohen-Fix O. (2003). Meiosis: polo, FEAR and the art of dividing reductionally. Curr. Biol. 13(15):R603-5. Cross, F.R. (1988) DAF 1, a mutant gene affecting size control, pheromone arrest, and cell cycle kinetics of Saccharomyces cerevisiae. Mol. Cell. Biol. 8, 4675-4684. Cross, F.R., Archambault, V. et al. (2002) Testing a mathematical model for the yeast cell cycle. Mol. Biol. Cell. 13, 52-70. Cross F.R. (2003). Two redundant oscillatory mechanisms in the yeast cell cycle. Dev Cell. 4(5), 741-752. Deshaies RJ, Chau V, Kirschner M. (1995). Ubiquitination of the G1 cyclin Cln2p by a Cdc34p-dependent pathway. EMBO J. 14(2):303-12. Dirick, L., Bohm, T., and Nasmyth, K. (1995). Roles and regulation of Cln/Cdc28 kinases at the start of the cell cycle of Saccharomyces cerevisiae. EMBO J. 14, 4803-4813. Edgar, B., Sprenger, F., Duronio, R.J., Leopold, P., and O’Farrell, P.H. (1994). Distinct molecular mechanism regulate cell cycle timing at successive stages of Drosophila embryogenesis. Genes and Devel. 8:440-452. Edgar, B. (1995). Diversification of cell cycle controls in developing embryos. Curr. Opin. Cell Biol. 7:815-824

87
Elsasser, S., F. Lou, et al. (1996). Interaction between yeast Cdc6 protein and B-type cyclin/Cdc28 kinases. Mol. Biol. Cell 11(7): 1723-1735. Elsasser, S., Y. Chi, et al. (1999). Phosphorylation controls timing of Cdc6p destruction: a biochemical analysis. Mol. Biol. Cell 10: 3263-3267. Ermentrout, B. (2002). Simulating, Analyzing, and Animating Dynamical Systems. SIAM: Society for Industrial and Applied Mathematics. Ferrell, J. Jr (1996). Tripping the switch fantastic: how a protein kinase cascade can convert graded inputs into switch-like outputs. TIBS 21, 460-465. Ferrell, J. Jr, and Eric M. Machleder (1998). The biochemical basis of an all-or-none cell fate switch in Xenopus oocytes. Science 280, 895-898. Ferrell, J. Jr, and Wen Xiong (2001). Bistability in cell signaling: how to make continuous processes discontinuous, and irreversible processes reversible. Chaos 11, 227-236. Follette, P.J., and O’Farrell, P.H. (1997). Cdks and the Drosophila cell cycle. Curr. Opin. Gen. Dev. 7:17-22. Flemming, W. (1882). Zellsubstanz, Kern und Zelltheilung, FCW Vogel, Leipzig. Fraschini, R., E. Formenti, et al. (1999). Budding yeast Bub2 is localized at spindle pole bodies and activates the mitotic checkpoint via different pathway from Mad2. J. Cell Biol. 31: 979-991. Futcher, B. (1996). Cyclins and the wiring of the yeast cell cycle. Yeast. 12(16), 1635-1646. Gardner, R. D. and D. J. Burke (2000). The spindle checkpoint; two transitions, two pathways. Trends Cell Biol 10: 154-158. Goldbeter, A. and Koshland, D. E. Jr. (1981). An amplified sensitivity arising from covalent modification in biological systems. Proc. Natl. Acad. Sci. U.S.A. 78, 6840-6844. Guacci, V., Koshland, D. and Strunnikov, A. (1997). A direct link between sister chromatid cohesion and chromosome condensation revealed through the analysis of MCD1 in S. cerevisiae. Cell, 91: p. 41-57. Hartwell, L. H. (1971). Genetic control of the cell cycle in yeast II. Genes controlling DNA replication and its initiation. J. Mol. Biol. 59, 183-194.

88
Hartwell, L. H. and M. W. Unger (1977). Unequal division in Saccharomyces cerevisiae and its implications for the control of cell division. J. Cell Biol. 75: 422-435. Hu, F., Wang Y., Liu, D., Li, Y., Qin, J., and Elledge, S. (2001). Regulation of the Bub2/Bfa1 GAP comlex by Cdc5 and Cell Cycle Checkpoint. Cell, 107: 655 – 665. Huang, J-Y., and Raff, J.W. (1999). The disappearance of cyclin B at the end of mitosis is regulated spatially in Drosophila cells. EMBO J. 19:4513-4523. Hucka, M., Finney, A., Sauro, H.M., Bolouri, H., Doyle, J., Kitano, H. (2002). The ERATO Systems Biology Workbench: enabling interaction and exchange between software tools for computational biology. Pac Symp Biocomput., 450-461 Jaspersen, S.L., Charles, J.F. and Morgan, D.O. (1999). Inhibitory phosphorylation of the APC regulator Hct1 is controlled by the kinase Cdc28 and the phosphatase Cdc14. Curr. Biol., 11: p. 227-236. Jensen S, Johnston LH. (2002). Complexity of mitotic exit. Cell Cycle 1(5):300-3. Koch, C., and Nasmyth, K. (1994). Cell cycle regulated transcription in yeast. Curr. Opin. Cell Biol. 6(3), 451-459. Koch, C., A. Schleiffer, et al. (1996). Switching transcription on and off during the yeast cell cycle: Cln/Cdc28 kinases activate bound transcription factor SBF (Swi4/Swi6) at Start, whereas Clb/Cdc28 kinase displace it from the promoter in G2. Genes Devel. 9: 129-141. Kohn, K. W. (1999). Molecular interaction map of the mammalian cell cycle control and DNA repair systems. Mol. Biol. Cell. 10, 2703-2734. Kotani, S., S. Tugendreich, et al. (1998). PKA and MPF-activated Polo-like kinase regulate anaphase-promoting complex activity and mitosis progression. Mol. Cell 1: 371-380. Krishnan, R., F. Pangilinan, et al. (2000). Saccharomyces cerevisiae BUB2 prevents mitotic exit in response to both spindle and kinetochore damage. Genetics 156(2): 489-500. Li, Y., and R. Benezra. 1996. Identification of a human mitotic checkpoint gene: hsMAD2. Science. 274: 246-248 Li, Y., C. Gorbea, D. Mahaffey, M. Reichsteiner, and R. Benezra. 1997. MAD2 associates with the cyclosome/anaphase-promoting complex and inhibits its activity. Proc. Natl. Acad. Sci. USA. 94: 12431-12436

89
Liang, C. and B. Stillman (1997). Persistent initiation of DNA replication and chromatin-bound MCM proteins during the cell cycle in cdc6 mutants. Genes Dev. 24(11): 3375-3386. Lord, P. G. and A. E. Wheals (1980). Asymmetrical division of Saccharomyces cerevisiae. J. Bacteriol. 142: 808-818. Mazzarello, P. (1999). A unifying concept: the history of cell theory. Vol. 1, (1) E13-E15. Mendenhall, M. D. (1993). An inhibitor of p34CDC28 protein kinase activity from Saccharomyces cerevisiae. Science 259: 216-219. Mendenhall, M.D., and Hodge, A.E. (1998) Regulation of Cdc28 cyclin-dependent protein kinase activity during the cell cycle of the yeast Saccharomyces cerevisiae. Microbiol. Mol Biol. 62(4), 1191-1243. Mendes, P. (1993) GEPASI: A software package for modelling the dynamics, steady states and control of biochemical and other systems. Comput. Applic. Biosci. 9, 563-571. Mendes, P. (1997) Biochemistry by numbers: simulation of biochemical pathways with Gepasi 3. Trends Biochem. Sci. 22, 361-363. Michaelis, C., Ciosk, R., and Nasmyth, K. (1997). Cohesions: chromosomal proteins that prevent premature separation of sister chromatids. Cell, 91: p. 35-45. Miller M.E., Cross F.R. (2001) Mechanisms controlling subcellular localization of the G(1) cyclins Cln2p and Cln3p in budding yeast. Mol Cell Biol. 21(18):6292-311. Morgan, D. O. (1995). Principles of CDK regulation. Nature 374:131-134 Murray, A. and T. Hunt (1993). The Cell Cycle. An introduction. New York, W. H. Freeman & Co. Nash, R., G. Tokiwa, et al. (1988) The WHI1+ gene of Saccharomyces cerevisiae tethers cell division to cell size and is a cyclin homolog. EMBO J. 7(13), 4335-4346. Nasmyth, K. and L. Dirick (1991). The Role of SWI 4 and SWI 6 in the activity of G1 cyclins in yeast. Cell 66: 995-1013. Nasmyth, K. (1996) At the heart of the budding yeast cell cycle. Trends Genet. 12, 405-412. Novak, B. and Tyson, J.J (not yet published). A model for restriction point control of the mammalian cell cycle.

90
Novak, B., Csikasz-Nagy, A., Gyorffy, B., Chen, K., Tyson, J.J. (1998a). Mathematical model of the fission yeast cell cycle with checkpoint controls at the G1/S, G2/M and metaphase/anaphase transitions. Biophys Chem. 72:185-200. Novak, B., Csikasz-Nagy, A., Gyorffy, B., Nasmyth, K., Tyson, J.J. (1998b). Model scenarios for evolution of the eukaryotic cell cycle. Phil. Trans. Royal Soc. Lond. B. 353:2063-76. Pardee, A. B. (1989) G1 events and regulation of cell proliferation. Science 246 603-608 Piatti, S., C. Lengauer, et al. (1995). Cdc6 is an unstable protein whose de novo synthesis in G1 is important for the onset of S phase and for preventing a 'reductional' anaphase in the budding yeast Saccharomyces cerevisiae. EMBO J. 14: 3788-3799. Pereira, G., T. Hofken, et al. (2000). The Bub2p spindle checkpoint links nuclear migration with mitotic exit. Mol. Cell 6: 1-10. Pines, J. (1995). Cyclins and cyclin-dependent kinases: a biochemical view. Biochem. J. 308:697-711 Pomerening, J.R., Sontag, E.D., Ferrell, J.E. Jr. (2003) Building a cell cycle oscillator: hysteresis and bistability in the activation of Cdc2. Nat Cell Biol. 5(4), 346-351. Prinz, S., et al. (1998). The regulation of Cdc20 proteolysis reveals a role for the APC components Cdc23 and Cdc27 during S phase and early mitosis. Curr. Biol., 8: p. 750-760. Rudner, A.D., Murray, A.W. (2000). Phosphorylation by Cdc28 activates the Cdc20-dependent activity of the anaphase-promoting complex. J. Cell Biol. 149(7):1377-1390. Richardson, H.E., Wittenberg, C., Cross, F., and Reed, S.I. (1989) An essential G1 function for cyclin-like proteins in yeast. Cell 59, 1127-1133. Richardson, H., Lew, D. J. et al. (1992). Cyclin-B homologs in Saccharomyces cerevisiae function in S phase and in G2.Genes Dev. 6: 2021-2034. Schaff, J., Loew, L.M., (1999) The Virtual Cell, Pacific Symposium. Biocomputing 4, 228-239 Schleiden, M. J. (1838). Arch. Anat. Physiol. Wiss. Med. 13, 137-176. Schneider, B.L., Yang, Q.H., Futcher, A.B. (1996). Linkage of replication to start by the Cdk inhibitor Sic1. Science 272(5261):560-562.

91
Schwann, T. (1839). Mikroskopische Untersuchungen über die Übereinstimmung in der Struktur und dem Wachstum der Tiere und Pflanzen (Sander'schen Buchhandlung, Berlin) Schwob, E., Nasmyth, K.(1993). CLB5 and CLB6, a new pair of B cyclins involved in DNA replication in Saccharomyces cerevisiae. Genes Dev. 7(7A):1160-1175. Schwob, E., Bohm, T., Mendenhall, M., and Nasmyth, K. (1994). The B-type cyclin kinase inhibitor p40SIC1 controls the G1 to S transition in S. cerevisiae. Cell 79, 233-244. Sethi N, Monteagudo MC, Koshland D, Hogan E, Burke DJ. (1991). The CDC20 gene product of Saccharomyces cerevisiae, a beta-transducin homolog, is required for a subset of microtubule-dependent cellular processes. Mol Cell Biol. 11(11):5592-602. Sha, W., Moore, J., Chen, K., Lassaletta, A.D., Yi, C.S., Tyson, J.J., Sible, J.C. (2003) Hysteresis drives cell-cycle transitions in Xenopus laevis egg extracts. Proc Natl. Acad. Sci. U S A.100(3), 975-980. Shirayama, M., Zachariae, W., Ciosk, R., Nasmyth, K. (1998). The Polo-like kinase Cdc5p and the WD-repeat protein Cdc20p/fizzy are regulators and substrates of the anaphase promoting complex in Saccharomyces cerevisiae. EMBO J. 17(5):1336-1349. Shirayama, M., Toth, A., Galova, M., Nasmyth, K. (1999). APC(CDC20) promotes exit from mitosis by destroying the anaphase inhibitor Pds1 and cyclin Clb5. Nature 402(6758):203-207. Shou, W., et al.(1999). Exit from mitosis is triggered by Tem1-dependent release of the protein phosphatase Cdc14 from nucleolar RENT complex. Cell, 97: p. 233-244. Shou, W., et al. (2002). Cdc5 influences phosphorylation of Net1 and disassembly of the RENT complex. BMC Mol. Biol., 3: p. 3. Shvartsman, S. Y., Hagan, M. P., Yacoub, A., Dent, P., Wiley, H. S. and Lauffenburger D. A. (2002). Autocrine loops with positive feedback enable context-dependent cell signaling. Am J Physiol Cell Physiol, 282: C545 - 559. Simon, I., et al. (2001). Serial regulation of transcriptional regulators in the yeast cell cycle. Cell, 106: p. 697-708. Spellman, P.T., et al. (1998). Comprehensive identification of cell cycle-regulated genes of the yeast Saccharomyces cerevisiae by microarray hybridization. Mol. Biol. Cell, 9: p. 3273-3297.

92
Stegmeier, F., Visintin, R., Amon, A.. (2002). Separase, polokinase, the kinetochore protein Slk19, and Spo12 function in a network that controls Cdc14 localization during early anaphase. Cell, (108): p. 207-220. Su, T.T., Sprenger, F., DiGregorio, P.J., Campbell, S.D., and O’Farrell, P.H. (1998). Exit from mitosis in Drosophila syncytial embryos requires proteolysis and cyclin degradation, and is associated with localized dephosphorylation. Genes and Dev. 12:1495-1503. Surana, U., Robitsch, H., Price, C., Schuster, T., Fitch, I., Futcher, A.B., Nasmyth, K. (1991). The role of CDC28 and cyclins during mitosis in the budding yeast S. cerevisiae. Cell 65(1):145-161. Tomita, M., Hashimoto, K., Takahashi, K., et al. (1999) E-CELL: software environment for whole-cell simulation. Bioinformatics 15(1), 72-84. Toyn, J.H., Johnson, A.L., Donovan, J.D., Toone, W.M., Johnston, L.H. (1997). The Swi5 transcription factor of Saccharomyces cerevisiae has a role in exit from mitosis through induction of the cdk-inhibitor Sic1 in telophase. Genetics 145(1):85-96. Tyers M, Tokiwa G, Futcher B. (1993). Comparison of the Saccharomyces cerevisiae G1 cyclins: Cln3 may be an upstream activator of Cln1, Cln2 and other cyclins. EMBO J. 12(5):1955-68. Tyers, M. (1996) The cyclin-dependent kinase inhibitor p40SIC1 imposes the requirement for Cln G1 cyclin function at Start. Proc. Natl. Acad. Sci. U S A 93(15), 7772-7776. Tyson, J. J., B. Novak, et al. (1995) Checkpoints in the cell cycle from a modeler's perspective. Progress in Cell Cycle Research. L. Meijer, S. Guidet and H. Y. L. Tung. New York, Plenum Press. 1, 1-8. Tyson, J. J., B. Novak, et al. (1996). Chemical kinetic theory as a tool for understanding the regulation of M-phase promoting factor in the cell cycle. Trends Biochem. Sci. 21: 89-96. Tyson, J.J. (1999). Models of cell cycle control in eukaryotes. J Biotechnol. 71(1-3):239-44. Tyson, J. J. and Novak, B. (2001) Regulation of the eukaryotic cell cycle: molecular antagonism, hysteresis and irreversible transitions. J. Theor. Biol. 210, 249-263. Tyson, J.J. and Novak, B. (2002) Cell Cycle Controls. In: Fall, C.P., Marland, E.S., Wagner, J. M. and Tyson, J.J. (Eds), Computational Cell Biology (Interdisciplinary Applied Mathematics). Springer-Verlag New York Inc., pp. 261-284.

93
Uhlmann, F., Lottspeich, F. and Nasmyth, K. (1999). Sister-chromatid separation at anaphase onset is promoted by cleavage of the cohesin subunit Scc1. Nature, 400: p. 37-42. Verma, R., Annan, R.S., Huddleston, M.J., Carr, S.A., Reynard, G., Deshaies, R.J. (1997). Phosphorylation of Sic1p by G1 Cdk required for its degradation and entry into S phase. Science 278(5337):455-460. Visintin, R., Prinz, S., and Amon, A. (1997). CDC20 and CDH1: a family of substrate-specific activators of APC-dependent proteolysis. Science, 278: p. 460-463. Visintin, R., Craig, K., Hwang, E.S., Prinz, S., Tyers, M., Amon, A. (1998). The phosphatase Cdc14 triggers mitotic exit by reversal of Cdk-dependent phosphorylation. Mol. Cell 2(6):709-718. Visintin, R., Hwang, E.S., Amon, A. (1999). Cfi1 prevents premature exit from mitosis by anchoring Cdc14 phosphatase in the nucleolus. Nature 398(6730):818-823. Visintin R, Stegmeier F, Amon A. (2003). The role of the polo kinase cdc5 in controlling cdc14 localization. Mol Biol Cell. 14(11):4486-98 Wasch, R. and F. Cross (2002). APC-dependent proteolysis of the mitotic cyclin Clb2 is essential for mitotic exit. Nature 418: 556-562. Wittenberg C, Richardson SL, Reed SI. (1990). Subcellular localization of a protein kinase required for cell cycle initiation in Saccharomyces cerevisiae: evidence for an association between the CDC28 gene product and the insoluble cytoplasmic matrix. J Cell Biol. 105(4):1527-38. Wuarin, J. and P. Nurse (1996). Regulating S phase: CDKs, licensing and proteolysis. Cell 85: 785-787. Xiong, W and Ferrel, J. (2003). A positive-feedback-based bistable ‘memory module’ that governs a cell fate decision. Nature 426: 460-465. Yamamoto, A., Guacci, V., Koshland, D. (1996). Pds1p, an inhibitor of anaphase in budding yeast, plays a critical role in the APC and checkpoint pathway(s). J. Cell Biol. 133(1):99-110. Yeong, F.M., et al. (2000). Exit of mitosis in budding yeast: biphasic inactivation of the Cdc28-Clb2 mitotic kinase and the role of Cdc20. Mol. Cell, 5: p. 501-511. Yoshida, S., K. Asakawa, et al. (2002). Mitotic exit network controls the localization of Cdc14 to the spindle pole body in Saccharomyces cerevisiae. Curr. Biol. 12: 944-950.

94
Zetterberg, A., Olle Larsson and Klas G Wiman (1995). What is the restriction point? Current Opinion in Cell Biology 7, 835-842. Zetterberg, A. and Olle Larsson (1995) Cell cycle progression and cell growth in mammalian cells: kinetic aspects of transition events. Frontiers in molecular biology: Cell cycle control. Edited by Hutvhindon C, Glover DM. Oxford University Press, 206-227. Zhu, G., et al., (2000). Two yeast forkhead genes regulate the cell cycle and pseudohyphal growth. Nature, 406: p. 90-94.

95
APPENDIX A: Equations of the model
Equation for growth:
gd mass massd
kt
= ⋅
Equations governing cyclin-dependent kinases:
' ' 's,n2 s,n2 d,n2
' "s,b5 s,b5 d3,c1 di,b5
d3,f6 di,f5 d,b5 as,b5 as,f5
d
d[Cln2] ( [SBF]) mass [Cln2]d
d[Clb5] ( [MBF]) mass ( [C5P] [C5])d
( [F5P] [F5]) ( [Sic1] [Cdc6]) [Clb5]
k k kt
k k k kt
k k V k k
V
= + ⋅ ⋅ − ⋅
= + ⋅ ⋅ + ⋅ + ⋅
+ ⋅ + ⋅ − + ⋅ + ⋅ ⋅' "
,b5 d,b5 d,b5 A
' "s,b2 s,b2 d3,c1 di,b2
d3,f6 di,f2 d,b2 as,b2 as,f2
' "d,b2 d,b2 d,b2
[Cdc20]
d[Clb2] ( [Mcm1]) mass ( [C2P] [C2])d
( [F2P] [F2]) ( [Sic1] [Cdc6]) [Clb2]
[Cdh1]
k k
k k k kt
k k V k k
V k k ⋅
= + ⋅
= + ⋅ ⋅ + ⋅ + ⋅
+ ⋅ + ⋅ − + ⋅ + ⋅ ⋅
= + '''d,b2 A
0 n3
n3 n3
0
T
T
[Cdc20]
mass[Cln3] mass
[Bck2] mass[Clb5] [Clb5] [C5] [C5P] [F5] [F5P][Clb2] [Clb2] [C2] [C2P] [F2] [F2P]
k
C DJ D
B
⋅+
⋅ ⋅=+ ⋅
= ⋅= + + + += + + + +

96
Equations governing the inhibitor of Clb-dependent kinases:
' "s,c1 s,c1 d,b2 di,b2 d,b5 di,b5 pp,c1
as,b2 as,b5 kp,c1
d,b2 d,b5 pp,c1
d[Sic1] ( [Swi5]) ( ) [C2] ( ) [C5] [Cdc14] [Sic1P]d
( [Clb2] [Clb5] ) [Sic1]
d[Sic1P] [C2P] [C5P] [Cdc14]d
k k V k V k kt
k k V
V V kt
= + ⋅ + + ⋅ + + ⋅ + ⋅ ⋅
− ⋅ + ⋅ + ⋅
= ⋅ + ⋅ − ⋅ d3,c1 kp,c1
d2,c1 c1,n3 c1,k2 c1,n2 c1,b5 c1,b2kp,c1 d1,c1
d2,c1 T
[Sic1P] [Sic1P] [Sic1]
( [Cln3] [Bck2] [Cln2] [Clb5] [Clb2])[Sic1]
k V
kV k
Jε ε ε ε ε
⋅ − ⋅ + ⋅
⋅ ⋅ + ⋅ + ⋅ + ⋅ + ⋅= +
+
as,b2 pp,c1 di,b2 d,b2 kp,c1
kp,c1 pp,c1 d3,c1 d,b2
as,b5 pp,c1 di,b5 d,b5 kp,
d[C2] [Clb2] [Sic1] [Cdc14] [C2P] ( ) [C2]d
d[C2P] [C2] ( [Cdc14] ) [C2P]d
d[C5] [Clb5] [Sic1] [Cdc14] [C5P] (d
k k k V Vt
V k k Vt
k k k V Vt
= ⋅ ⋅ + ⋅ ⋅ − + + ⋅
= ⋅ − ⋅ + + ⋅
= ⋅ ⋅ + ⋅ ⋅ − + + c1
kp,c1 pp,c1 d3,c1 d,b5
) [C5]
d[C5P] [C5] ( [Cdc14] ) [C5P]d
V k k Vt
⋅
= ⋅ − ⋅ + + ⋅
' " "'s,f6 s,f6 s,f6 d,b2 di,f2 d,b5 di,f5 pp,f6
as,f2 as,f5 kp,f6
d,b2 d,b5
d[Cdc6] ( [Swi5] [SBF]) ( ) [F2] ( ) [F5] [Cdc14] [Cdc6P]d
( [Clb2]+ [Clb5] ) [Cdc6]
d[Cdc6P] [F2P] [F5Pd
k k k V k V k kt
k k V
V Vt
= + ⋅ + ⋅ + + ⋅ + + ⋅ + ⋅ ⋅
− ⋅ ⋅ + ⋅
= ⋅ + ⋅ pp,f6 d3,f6 kp,f6
d2,f6 f6,n3 f6,k2 f6,n2 f6,b5 f6,b2kp,f6 d1,f6
d2,f6 T
] [Cdc14] [Cdc6P] [Cdc6P] [Cdc6]
( [Cln3] [Bck2] [Cln2] [Clb5] [Clb2])[Cdc6]
k k V
kV k
Jε ε ε ε ε
− ⋅ ⋅ − ⋅ + ⋅
⋅ ⋅ + ⋅ + ⋅ + ⋅ + ⋅= +
+

97
as,f2 pp,f6 di,f2 d,b2 kp,f6
kp,f6 pp,f6 d3,f6 d,b2
as,f5 pp,f6 di,f5 d,b5 kp,
d[F2] [Clb2] [Cdc6] [Cdc14] [F2P] ( ) [F2]d
d[F2P] [F2] ( [Cdc14] ) [F2P]d
d[F5] [Clb5] [Cdc6] [Cdc14] [F5P] (d
k k k V Vt
V k k Vt
k k k V Vt
= ⋅ ⋅ + ⋅ ⋅ − + + ⋅
= ⋅ − ⋅ + + ⋅
= ⋅ ⋅ + ⋅ ⋅ − + + f6
kp,f6 pp,f6 d3,f6 d,b5
) [F5]
d[F5P] [F5] ( [Cdc14] ) [F5P]d
V k k Vt
⋅
= ⋅ − ⋅ + + ⋅
T
T
T T T
[Sic1] [Sic1] [Sic1P] [C2] [C5] [C2P] [C5P][Cdc6] [Cdc6] [Cdc6P] [F2] [F5] [F2P] [F5P][CKI] [Sic1] [Cdc6]
= + + + + += + + + + +
= +
Equations governing the Clb degradation machinery:
a,iep i,iep
a,iep i,iep
' ''Ts,20 s,20 d,20 T
' "Aa,20 a,20 T A mad2 d,20 A
[Clb2] (1 [IEP]) [IEP]d[IEP]d 1 [IEP] [IEP]
d[Cdc20] [Mcm1] [Cdc20]d
d[Cdc20] ( [IEP]) ([Cdc20] [Cdc20] ) ( ) [Cdc20]d
d[Cdh
k kt J J
k k kt
k k k kt
⋅ ⋅ − ⋅= −
+ − +
= + ⋅ − ⋅
= + ⋅ ⋅ − − + ⋅
Ts,cdh d,cdh T
a,cdh T i,cdhs,cdh d,cdh
a,cdh T i,cdh
' "a,cdh a,cdh a,cdh
' "i,cdh i,cdh i,cdh cdh,n3 c
1] [Cdh1]d
([Cdh1] [Cdh1]) [Cdh1]d[Cdh1] [Cdh1]d [Cdh1] [Cdh1] [Cdh1]
[Cdc14]
( [Cln3]
k kt
V Vk k
t J J
V k k
V k k ε ε
= − ⋅
⋅ − ⋅= − ⋅ + −
+ − +
= + ⋅
= + ⋅ ⋅ + dh,n2 cdh,b2 cdh,b5[Cln2] [Clb2] [Clb5])ε ε⋅ + ⋅ + ⋅

98
Equations for the MEN:
1 T bub2
a,tem T i,tem
' " "'a,15 T a,15 a,15 T
i,15
( ([Tem1] [Tem1]) [Tem1]d[Tem1]d [Tem1] [Tem1] [Tem1]
d[Cdc15] ( ([Tem1] [Tem1]) [Tem1] [Cdc14]) ([Cdc15] [Cdc15])d
[Cdc15]
ltek kt J J
k k kt
k
⋅ − ⋅= −+ − +
= ⋅ − + ⋅ + ⋅ ⋅ −
− ⋅
Equations governing the phosphatase:
Ts,14 d,14 T
s,14 d,14 d,net di,rent di,rentp
as,rent as,rentp
d[Cdc14] [Cdc14]d
d[Cdc14] [Cdc14] ([RENT]+[RENTP]) [RENT] [RENTP]d
( [Net1] [Net1P]) [Cdc14]
d
k kt
k k k k kt
k k
= − ⋅
= − ⋅ + ⋅ + ⋅ + ⋅
− ⋅ + ⋅ ⋅
Ts,net d,net T
s,net d,net d,14 di,rent as,rent
pp,net kp,net
d,14 d,net
[Net1] [Net1]d
d[Net1] [Net1]+ [RENT] [RENT] [Cdc14] [Net1]d
[Net1P] [Net1]
d[RENT] ( + )d
k kt
k k k k kt
V V
k kt
= − ⋅
= − ⋅ ⋅ + ⋅ − ⋅ ⋅
+ ⋅ − ⋅
= − ⋅ di,rent as,rent
pp,net kp,net
' "pp,net pp,net pp,net
' "kp,net kp,net kp,net
s,ppx d,ppx
d,ppx d
[RENT] [RENT] [Net1] [Cdc14]
[RENTP] [RENT]
[PPX]
( [Cdc15]) mass
d[PPX] [PPX]d
k k
V V
V k k
V k k
k Vt
V k
− ⋅ + ⋅ ⋅
+ ⋅ − ⋅
= + ⋅
= + ⋅ ⋅
= − ⋅
= pds' '',ppx d,ppx 20,ppx A
pds
( [Cdc20] )+[Pds1]J
k JJ
+ ⋅ + ⋅

99
T
T T
[RENTP] [Cdc14] [RENT] [Cdc14][Net1P] [Net1] [Net1] [Cdc14] [Cdc14]
= − −= − − +
Equations for Pds1 and Esp1 and their interaction:
' " "'s,pds s,pds s,pds di,esp d,pds as,esp
' " "'d,pds d,pds d,pds A d,pds
as,esp di,esp d,pds
d[Pds1] [SBF] [Mcm1] [PE] ( [Esp1]) [Pds1]d
[Cdc20] [Cdh1]
d[Esp1] [Pds1] [Esp1] ( ) [PE]d
[PE] [Es
k k k k V kt
V k k k
k k Vt
= + ⋅ + ⋅ + ⋅ − + ⋅ ⋅
= + ⋅ + ⋅
= − ⋅ ⋅ + + ⋅
= Tp1] [Esp1]−
Equations for DNA synthesis, budding and spindle formation:
s,ori ori,b5 ori,b2 d,ori
s,bud bud,n2 bud,n3 bud,b5 d,bud
s,spn d,spnspn
d[ORI] ( [Clb5] [Clb2]) [ORI]d
d[BUD] ( [Cln2] [Cln3] [Clb5]) [BUD]d
d[SPN] [Clb2] [SPN]d [Clb2]
k kt
k kt
k kt J
ε ε
ε ε ε
= ⋅ ⋅ + ⋅ − ⋅
= ⋅ ⋅ + ⋅ + ⋅ − ⋅
= ⋅ − ⋅+
Goldbeter Function:
( ) ( )2
2( , , , )4
i aa i a i
i a a i i a i a a i i a i a i a
J VG V V J JV V J V J V V V J V J V V V J V
=− + + + − + + − −
Equations governing the transcription factors: ' "
a,sbf i,sbf i,sbf a,sbf i,sbf[SBF] [MBF] ( , [Clb2], , )G V k k J J= = + ⋅
a,sbf a,sbf sbf,n2 sbf,n3 sbf,b5( [Cln2] ([Cln3] [Bck2]) [Clb5])V k ε ε ε= ⋅ ⋅ + ⋅ + + ⋅
a,mcm i,mcm a,mcm i,mcm[Mcm1] ( [Clb2], , , )G k k J J= ⋅
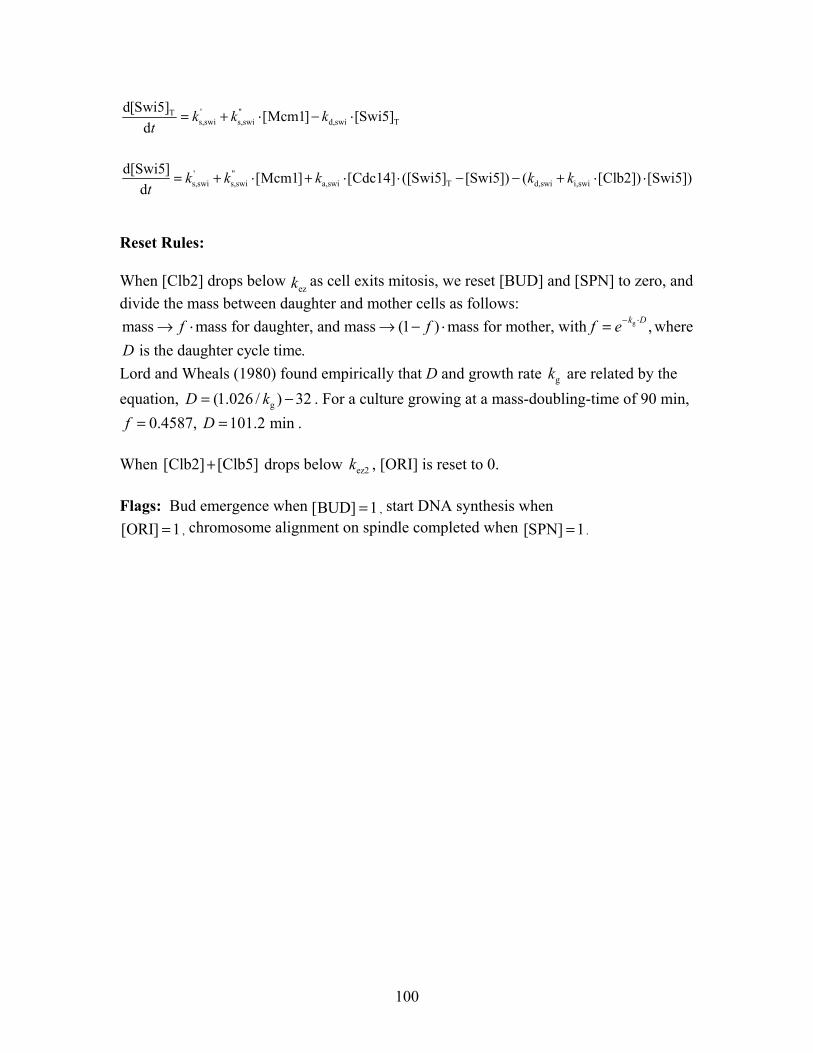
100
' "Ts,swi s,swi d,swi T
' "s,swi s,swi a,swi T d,swi i,swi
d[Swi5] [Mcm1] [Swi5]d
d[Swi5] [Mcm1] [Cdc14] ([Swi5] [Swi5]) ( [Clb2]) [Swi5])d
k k kt
k k k k kt
= + ⋅ − ⋅
= + ⋅ + ⋅ ⋅ − − + ⋅ ⋅
Reset Rules:
When [Clb2] drops below ezk as cell exits mitosis, we reset [BUD] and [SPN] to zero, and divide the mass between daughter and mother cells as follows:
gmass mass for daughter, and mass (1 ) mass for mother, with , where is the daughter cycle time.
k Df f f eD
− ⋅→ ⋅ → − ⋅ =
Lord and Wheals (1980) found empirically that D and growth rate gk are related by the equation, g(1.026 / ) 32D k= − . For a culture growing at a mass-doubling-time of 90 min,
0.4587, 101.2 minf D= = .
When [Clb2] [Clb5]+ drops below ez2k , [ORI] is reset to 0.
Flags: Bud emergence when [BUD] 1= , start DNA synthesis when [ORI] 1= , chromosome alignment on spindle completed when [SPN] 1= .

101
APPENDIX B: Parameters of the model Basal parameter values for the wild-type cell cycle. All parameters that start with a lower case “k” are rate constants (min-1). All other parameters are dimensionless.
g 0.005776k = 's,n2 0k = "
s,n2 0.4k = d,n2 0.12k = 's,b5 0.0015k = "
s,b5 0.005k = 'd,b5 0.01k = "
d,b5 0.15k = 's,b2 0.0015k = ''
s,b2 0.05k = 'd,b2 0.003k = "
d,b2 0.3k =
d,b2p 0.15k = 's,c1 0.012k = ''
s,c1 0.12k = d1,c1 0.01k = d2,c1 1k = d3,c1 1k =
pp,c1 4k = 's,f6 0.024k = "
s,f6 0.12k = d1,f6 0.01k = d2,f6 1k = d3,f6 1k =
pp,f6 4k = as,b5 50k = di,b5 0.05k = as,f5 0.01k = di,f5 0.01k = as,b2 50k =
di,b2 0.05k = as,f2 15k = di,f2 0.5k = 's,swi 0.005k = ''
s,swi 0.1k = d,swi 0.1k =
a,swi 1.8k = i,swi 0.05k = a,iep 0.1k = i,iep 0.15k = 's,20 0.006k = "
s,20 0.6k =
d,20 0.3k = 'a,20 0.04k = "
a,20 0.2k = s,cdh 0.01k = d,cdh 0.01k = 'a,cdh 0.01k =
"a,cdh 0.8k = '
i,cdh 0.001k = ''i,cdh 0.08k = '
a,15 0.002k = ''a,15 1k = a,15p 0.001k =
i,15 0.5k = s,14 0.2k = d,14 0.1k = s,net 0.084k = d,net 0.03k = 'pp,net 0.05k =
''pp,net 3k = '
kp,net 0.018k = ''kp,net 1k = as,rent 200k = as,rentp 1k = di,rent 1k =
di,rentp 2k = s,ppx 0.1k = 'd,ppx 0.15k = "
d,ppx 2k = 's,pds 0k = "
s1,pds 0.03k = "s2,pds 0.055k = '
d1,pds 0.01k = "d2,pds 0.2k = ''
d3,pds 0.04k = as,esp 50k = di,esp 0.5k =
s,ori 2k = d,ori 0.06k = s,bud 0.2k = d,bud 0.06k = s,spn 0.09k = d,spn 0.06k =
a,sbf 0.38k = 'i,sbf 0.6k = ''
i,sbf 8k = a,mcm 1k = i,mcm 0.15k = 'a,tar 0.02k =
''a,tar 1k = '
i,tar 0.01k = ''i,tar 0.6k =
mad2 8 (for [ORI] 1 and [SPN] 1) or 0.01 (otherwise)k = > <
bub2 1 (for [ORI] 1 and [SPN] 1) or 0.2 (otherwise)k = > <
lte1 ez1 (for [SPN] 1 and [Clb2] ) or 0.1 (otherwise)k K= > >
sbf,n2 1ε = sbf,n3 10ε = sbf,b5 4ε = c1,n3 0.3ε = c1,n2 0.03ε = c1,k2 0.03ε =
c1,b5 0.08ε = c1,b2 0.5ε = f6,n3 0.3ε = f6,n2 0.03ε = f6,k2 0.03ε = f6,b5 0.08ε =
f6,b2 0.45ε = cdh,n3 0.25ε = cdh,n2 0.2ε = cdh,b5 10ε = cdh,b2 1.2ε = ori,b5 0.9ε =
ori,b2 0.45ε = bud,n3 0.05ε = bud,n2 0.13ε = bud,b5 1ε = 0 0.4C = n3 1D =
0 0.054B = T[Tem1] 1= T[Cdc15] 1= T[Esp1] 1=
d2,c1 0.05J = d2,f6 0.05J = a,iep 0.1J = i,iep 0.1J = a,cdh 0.05J = i,cdh 0.05J =
a,tem 0.1J = i,tem 0.1J = a,sbf 0.01J = i,sbf 0.01J = a,mcm 0.1J = i,mcm 0.1J =
spn 0.14J = n3 6J = 20,ppx 0.15J = pds 0.04J = a,tar 0.05J = i,tar 0.05J =
ez 0.3K = ez2 0.15K = ez,tar 0.4K =

102
Initial Conditions for a newborn WT daughter cell: [Mass] 1.2060 [Cln2] 0.0650 [Clb5] 0.0504 [Clb2] 0.1399 [Sic1] 0.0238 [Sic1P] 0.0064 [C2] 0.2394 [C5] 0.0713 [C2P] 0.0235 [C5P] 0.0068 [Cdc6] 0.1111 [Cdc6P] 0.0154 [F2] 0.2360 [F5] 7.367e-005 [F2P] 0.0267 [F5P] 7.797e-006 [Swi5]T 0.9753 [Swi5] 0.9553 [IEP] 0.1 [Cdc20]T 1.9067 [Cdc20] 0.4433 [Cdh1]T 1 [Cdh1] 0.9360 [Tem1] 0.9004 [Cdc15] 0.6560 [Cdc14]T 2 [Cdc14] 0.4651 [Net1]T 2.8 [Net1] 0.0188 [RENT] 1.0562 [PPX] 0.1229 [Pds1] 0.0252 [Esp1] 0.3030 [ORI] 0.0068 [BUD] 0.0088 [SPN] 0.0318
mad2k 0.01
bub2k 0.2
lte1k 0.1 The values of the ICs are rounded to the fourth digit.

103
VITA
I was born in Antibes, France. After graduating from high school, I attended a school in
Sophia Antipolis, EAI Tech (Euro-American Institute). I transferred to Virginia Tech and
joined the mathematics department my junior year. I spent one semester trying to find an
application of the mathematics that was taught to me. I was introduced to Dr. John
Tyson’s work my second semester in Virginia Tech and did undergraduate research work
with him. I graduated in December 1999 with a bachelor in mathematics. I continued
working with Dr. Tyson towards a master degree in mathematics. In fall 2000, I started
the Ph.D program in the biology department at Virginia Tech, continuing my research on
the budding yeast cell cycle.