Embed Size (px)
Citation preview

DI
SC
US
SI
ON
P
AP
ER
S
ER
IE
S
Forschungsinstitut zur Zukunft der ArbeitInstitute for the Study of Labor
Temporary Contracts andYoung Workers’ Job Satisfaction in Italy
IZA DP No. 7716
November 2013
Giovanni S. F. BrunoFloro E. CaroleoOrietta Dessy

Temporary Contracts and Young Workers’ Job Satisfaction in Italy
Giovanni S. F. Bruno Bocconi University, Milan
Floro E. Caroleo
University of Naples “Parthenope”, CRISEI and IZA
Orietta Dessy
Cà Foscari University, Venice and Catholic University, Milan
Discussion Paper No. 7716 November 2013
IZA
P.O. Box 7240 53072 Bonn
Germany
Phone: +49-228-3894-0 Fax: +49-228-3894-180
E-mail: [email protected]
Any opinions expressed here are those of the author(s) and not those of IZA. Research published in this series may include views on policy, but the institute itself takes no institutional policy positions. The IZA research network is committed to the IZA Guiding Principles of Research Integrity. The Institute for the Study of Labor (IZA) in Bonn is a local and virtual international research center and a place of communication between science, politics and business. IZA is an independent nonprofit organization supported by Deutsche Post Foundation. The center is associated with the University of Bonn and offers a stimulating research environment through its international network, workshops and conferences, data service, project support, research visits and doctoral program. IZA engages in (i) original and internationally competitive research in all fields of labor economics, (ii) development of policy concepts, and (iii) dissemination of research results and concepts to the interested public. IZA Discussion Papers often represent preliminary work and are circulated to encourage discussion. Citation of such a paper should account for its provisional character. A revised version may be available directly from the author.

IZA Discussion Paper No. 7716 November 2013
ABSTRACT
Temporary Contracts and Young Workers’ Job Satisfaction in Italy
The Italian process of flexibilization of the labour market has created a dual market populated by protected permanent employees and unprotected temporary workers. The latter comprises not only temporary employment relationships but also autonomous collaborations used by firms as low-cost de facto temporary employment relationships. Little is known about the quality of these temporary jobs, particularly widespread among young workers. We estimate a regression model of perceived overall job satisfaction of young workers, based on the ISFOL-PLUS 2006-2008-2010 panel. We control for the various temporary contracts and for perceived satisfactions in nine aspects of the job. We find that lack of job stability is the most serious cause of lower satisfaction for both temporary employees and autonomous collaborators. But while temporary employees compensate concerns of job stability with other job aspects, attaining satisfaction levels comparable to those of permanent employees, autonomous collaborators do not and are thus significantly the least satisfied. JEL Classification: J28, J81 Keywords: flexicurity, job satisfaction, de facto temporary employment Corresponding author: Floro Ernesto Caroleo Department of Business and Economics Studies University of Naples “Parthenope” Via Generale Parisi n. 13, Napoli I-80133 Naples Italy E-mail: [email protected]

2
1. Introduction
In recent decades increasing labour market flexibility has been the main response to the high
structural unemployment problem in all the OECD countries. Implementation of this goal has
followed different strategies in different countries, mainly according to the existing and
desired level of Employment Protection Legislation (EPL): in some countries efforts have
been made to reduce the degree of EPL of existing permanent contracts, whereas in others the
existing high levels of EPL have been joined by new contractual forms of temporary jobs,
namely fixed-term and temporary agency work contracts. Rules regulating temporary
employment have been liberalized in several Mediterranean, Continental and East European
countries. In particular, Germany and Italy have recently relaxed their temporary employment
legislation more than others (Jahn et al., 2012).
Such reforms “at the margin” are widely considered the chief way in which unprotected
people (youth, women, less skilled) may enter the labour market, especially in the presence of
segmented labour markets, and at the very least contribute to increase firms’ profits (Boeri,
2011).
There are two related ways to view the potential effects of flexibility. The first, which is more
traditional, focuses on the labour market outcomes of flexible contracts. The second view,
which has become established more recently, is concerned with the general quality of "new"
jobs.
From the former standpoint the desirable outcome in the labour market both for firms and
workers is employment stability. Therefore in the empirical literature it has been questioned
whether temporary contracts are stepping stones towards a stable occupation or a
precariousness trap especially for the weaker players in the labour market (cfr. Bruno et al.,
2013 and the literature quoted therein). On the other hand, it has been argued that two-tier
reforms have widened the insider-outsider divide making real reforms to deal with the great
recession much harder (Bentolila et al., 2012). From the labour market perspective, most of
the concerns raised from the widespread use of temporary contracts regard job security, based
on the fact that temporary contracts are generally much less protected from job loss than their
permanent counterparts. If some countries (such as Denmark and Netherlands) have combined
policies of EPL reduction with extending unemployment benefits and introducing active
labour market policies, therefore being able to implement the so-called model of flex-security
(European Commission, 2007), in others (such as Italy) temporary workers are still mainly an

3
unprotected category, such that we might say, in the words of Berton et al. (2009), that a flex-
insecurity model has been implemented.
In the last few decades, several international institutions have also considered a different,
multidimensional way to evaluate jobs. Indeed, undertakings have been made not only to
increase employment but also to improve its quality (the United Nations Millennium
Declaration, approved by the UN Assembly in September 2000; ILO, in its school to work
transition survey, as explained in Elder, 2010; Lisbon Agenda, 2000; Eurofound, 2012).
In Italy the flexibilization of the labour market has been implemented through the continuous
proliferation of new temporary contractual work arrangements of a heterogeneous nature,
which increasingly include arrangements peculiar to autonomous work but hide de facto
temporary employment relationships. Temporary contracts are widespread among young
people. They have been effective in helping the young to enter the labour market, but at the
expense of 1) delaying the step to permanent employment, since the rate of permanence in
temporary contracts is about 43%; and 2) facilitating the exit to unemployment as an effect of
the crisis, since 2007 (Mandrone and Marocco, 2012b).
The question therefore arises as to whether this flexibilization process in Italy, beyond the
above effects, has improved the quality of jobs among disadvantaged workers. In this paper
we attempt to answer this question, focussing on the quality of jobs among young workers as
reflected by their own perceived job satisfaction levels.
To our knowledge, this is the first attempt in this sense on somewhat unexplored territory for
Italy, namely that of subjective evaluation of job quality among young workers. Building
upon previous studies in other countries (van Praag et al., 2003, for Germany; de Graaf-Zijl,
2012, for the Netherlands; Booth et al., 2002, Bardasi and Francesconi, 2004, and Green and
Heywood, 2011, for the UK) we estimate a regression model of self-declared job satisfaction
to quantify the relationship between job satisfaction and temporary contract arrangements,
and in particular to what extent, for each category of workers, lower satisfaction with one
aspect of the job is compensated by higher satisfaction with another aspect.
For our analysis we used the 2006-2008-2010 panel collected by the Institute for Workers’
Professional Development (Istituto per lo Sviluppo della Formazione Professionale dei
Lavoratori, ISFOL) in the Participation, Labour, Unemployment Survey (PLUS). This data set
has a number of advantages for the purposes of our research: 1) it is a panel, and as such it
allows us to include individual effects in the specification, which is crucial when working
with models of personal evaluation; 2) it covers a time period that is subsequent to the
introduction of labour market reforms and that includes the beginning of the financial crisis,
4
whose effect on job satisfaction, therefore, can in principle be identified; 3) it follows
individuals, albeit bi-yearly, for five years, which is particularly useful given the persistence
in temporary contracts of young people in Italy; 4) it allows identification of de facto
temporary employment relationships, disaggregated into the two broad categories of
temporary employment and autonomous collaborations; 5) it presents a unique wealth of
information about self-declared satisfactions on an uncommonly large number of job aspects.
More specifically, we observe nine dimensions of job satisfaction, whereas for other
countries’ data far fewer job aspects are available (four in Green and Heywood, 2011; five in
de Graaf-Zijl, 2012). This last feature of ISFOL-PLUS data allows us to estimate a complete
model of job satisfaction, in which all the job aspects are used as explanatory variables, both
separately and in interaction with the contract dummies.
We find that job stability is the most serious cause of lower satisfaction for both temporary
employees and autonomous collaborators. On the other hand, the various categories of
temporary contracts respond quite differently to differences in aspect satisfactions. This
implies that temporary employees get compensated for dissatisfaction with job stability with
more satisfaction from other job aspects, and eventually attain satisfaction levels comparable
to those of permanent employees. By contrast, autonomous collaborators are not
compensated, and are thus, on average, the least satisfied.
The chapter is organised as follows. In Section 2 we review the literature on the relationship
between temporary work and job satisfaction. Section 3 analyses the Italian path to
flexibilization of the labour market. In Section 4 we describe our data and define the variables
used for the empirical analysis. Section 5 explains our econometric strategy. Results are
discussed in Section 6, followed by concluding remarks in Section 7.
2. Temporary work and job satisfaction
Job satisfaction is a subjective measure of how people feel about their job. Broadly speaking,
it can be thought of as a multidimensional construct involving subjective aspirations and
objective opportunities. In this paper we focus on so-called cognitive job satisfaction which is
the extent of the individual’s satisfaction with particular aspects of their jobs, such as the
work environment, work organization, duties, protection against sickness, accident and
industrial injury, career perspectives, pay, competence and skills development, and job
security.
Although workers’ job satisfaction has been widely analysed by sociologists and industrial
psychologists it also conveys useful information about economic life and labour market

5
decisions that should not be ignored (Freeman, 1978; Eurofound, 2007). From this point of
view it is important for at least two reasons: 1) it increases job productivity (Hamermesh,
1997) and therefore firm productivity (Oswald, 1997); and 2) it improves social welfare, as it
is extremely closely correlated to overall individual happiness and well-being (social life,
family, etc.) (Addabbo and Solinas, 2012).
As we have seen, due to the spread of temporary contracts, the potential effects of flexibility
on labour market outcomes have been extensively analysed. However, a growing empirical
literature has recently also studied the impact of flexibility on job satisfaction (see, for
example, Origo and Pagani, 2009).
Specializing in the economic dimension of job satisfaction, the latter can be considered a
proxy of the utility function, and as such is expected to be increasing with wage or income (or
at least with income of reference groups) and decreasing with hours of work (Clark and
Oswald, 1996), all other conditions being equal. In this case, a lower wage of temporary
workers, compared with that of permanent ones, does not mean in theory less job satisfaction
but simply that they are discounting the cost of filling the work experience or skills gap and
the costs of the time needed to gather information in searching for the best match. According
to the stepping stone hypothesis, therefore, the lower satisfaction of temporary workers, found
in the majority of empirical research, is nothing else but the motivation driving them towards
a stable occupation, which is ranked as one of the most important factors of job satisfaction
(European Commission, 2001), or even towards occupations and jobs which ensure the best
match between a worker’s ability and job requirements, as well as with personal requirements
and occupation-specific reward structures (Eurofound, 2007).
We notice, however, that empirical studies show several conflicting findings. According to
Booth et al. (2002), for example, temporary workers have a lower satisfaction with several
aspects of their jobs in the UK. For the same country, Bardasi and Francesconi (2004) report,
on the other hand, no long-term negative effects of limited-duration contracts.
de Graaf-Zijl (2012) studies the case of the Netherlands, analysing different work contracts
(regular, fixed-term, on-call, temporary agency) on five job aspects. She finds that a lack of
job security is responsible for lower job satisfaction of temporary workers compared to that of
permanent workers. However, with the exception of temporary agency workers, the gap
disappears if other job aspects are considered, especially job content. Using British data and
considering four job aspects Green and Heywood (2011) state the opposite: low job
satisfaction associated with less job security is not offset by higher compensation or other job

6
characteristics. One possible explanation is lower coverage against job loss in the UK than in
the Netherlands.
Clark et al. (1996) provide strong evidence for a U-shaped relationship between age and job
satisfaction. Generally, it has been found that women report higher levels of job satisfaction
than do men (gender-job satisfaction paradox) despite their disadvantaged position on the
labour market (Clark, 1997; Sousa-Poza and Sousa-Poza, 2003; Kaiser, 2007). Holding
income constant, satisfaction levels are shown to be strongly declining with the level of
education. An important determinant of job satisfaction, concerning in particular temporary
youth workers, is overeducation or overskilling (Allen and van der Welden, 2001). Finally,
there are also some occupational characteristics that may influence the job satisfaction-work
flexibility relation, such as the difference between managers, blue-collar and white-collar
workers, and sectors. The self-employed in general report greater overall job satisfaction than
employees (Blanchflower, 2000; Bradley and Roberts, 2004).
3. The Italian case
In Italy, the flexibilization process of the labour market has followed the path of reforms at
the margin, without therefore reducing the degree of EPL for employees working with a
permanent job (considered as the “standard” type of contract). A number of new contractual
forms for temporary jobs have been introduced in the form of “atypical” or “non-standard”
jobs1. The first attempt goes back to the 1980s with the implementation of work-and-training
employment contracts, but the main process of labour market flexibilization started in the
second half of the 1990s with the so-called Treu reform (Law 196/1007), that introduced
temporary work agencies as well as temporary contracts, regulated under Legislative Decree
368 /2001, and redefined the part-time contracts. The reform of the Italian labour market
continued with the “Biagi Reform” (Law 30/2003) that introduced other particular contractual
forms of non-standard employment such as: job on call, job sharing, job placement
agreements and an update of apprenticeship contracts. Other contractual arrangements of
labour outsourcing, similar to temporary agency work contracts, were also proposed such as
staff leasing and transfer of undertakings.
Labour reforms have also paid special attention to self-employment, considering that it
traditionally accounts for a large share of the working population in Italy. Some worker
categories have been introduced, such as collaborators, contracting/consulting workers and
1 The concept of “standard” refers to the Fordist model of production in which the work contract of unlimited
duration was the typical contractual form regulating work.

7
occasional workers, who are contracted to execute specific duties for the firm in a fixed time-
limit as free-lancers, coordinated by the employer but not hired as employees. Although
formally “autonomous” or self-employed, insofar as their contracts are continuously renewed,
such workers become a very low cost for firms to implement their goal of flexibility, thus
hiding an employment relationship (lavoro parasubordinato). In other words, although self-
employment could be considered another “typical” form of work, as it is neither of limited
duration nor is it a form of dependent employment, in recent years in Italy it has also tended
to include unprotected “false” autonomous temporary collaborators that de facto are “non-
standard” or “atypical” employees.
These different trends of flexibilization of the Italian labour market, mixed with an
inappropriate use of employment opportunities, especially among young people, have created
profound disarray in the employment world. The multilevel segmentation of working
relationships has made the traditional categories inadequate to understand the current
composition of the Italian labour market. In particular, the distinction between “atypical
employees” and “atypical autonomous” workers is crucial for the analysis of employment
quality linked to the flexibilization process of the Italian labour market. These two categories
not only differ from the contractual point of view, as explained above, but they can also
generate different developments of workers’ skills, career patterns, relationships with
colleagues, time schedules, and (least but not last) wages.
The disaggregation among contracts therefore needs to be sufficiently detailed, as a general
classification of working people into permanent employees, temporary employees and the
self-employed, including “autonomous collaborators”, would be highly distortional in the
Italian context. The pattern becomes even more complicated if we consider that the
flexibilization of work relationships along the line of free-lance collaborations has recently
intensified to the point that in many cases individuals have decided, perhaps pushed by the
contractor, to become formally self-employed with their own VAT code, although working
only for one firm. This is an even cheaper tool than “atypical autonomous” contracts for firms
to implement flexibility, which in some sense ‘perturbs’ to an even greater extent the
definition of the self-employed as “typical” workers.
All of the foregoing reasons help clarify the benefits of the ISFOL-PLUS Panel which,
besides providing otherwise unavailable information on personal evaluations of job
satisfaction, also gives the opportunity to distinguish the contractually different forms of
“typical” and “atypical” jobs, as we explain in the next section.

8
4. Data
Our empirical analysis is based on micro-data collected by ISFOL in the Participation,
Labour, Unemployment Survey (PLUS). This survey, started in 2005, consists in a sample of
about 38,000 working-age people interviewed by telephone. Detailed personal data,
information about education, family background, occupational characteristics and job search
condition are collected. In methodological terms, the representativeness of the sample follows
exactly the same criteria as the national survey carried out by the Italian National Institute of
Statistics (ISTAT): the Labour Force Survey (LFS). But the general purpose of the PLUS
questionnaire is also to record people’s self-perceptions about different aspects of their lives,
and especially of their jobs, thereby completing the canonical information available in the
LFS. In particular, the PLUS allows us to analyse in greater depth both the different
contractual forms of workers and their satisfaction with particular dimensions of their job.
In our analysis we use the longest 2006-2008-2010 panel version available for taking
advantage of the longest working history of individuals. Classification of the contracts in the
long-panel PLUS version allows us to break down de facto temporary employment into its
three components of fixed-term contracts, other temporary contracts and autonomous
collaborations (Mandrone, 2012).
In our analysis we focus on the population of young working people, selecting the sample of
people aged between 15 and 35 years. The choice of this high upper bound for age is due to
the evidence that in Italy exit from school/entrance into the labour market is often delayed,
and hence the category of young workers is wider than in other countries. The sample does
not include immigrants (identified as those without Italian citizenship) and those working for
the armed forces. Table 1 reports the distributions of observations by year and sex, both for
the whole population and for the sample of workers. The average number of observations per
year is 6,700 and the distribution between men and women is constant across years, with
young women more numerous than young men (52% versus 48%). This is due to the fact the
whole population includes the inactive and the unemployed, where women are highly present.
Restricting the sample to the population of the employed, men constitute 55% and women
45% on average every year.
4.1 Evidence on contracts and estimation sample
In the panel version of ISFOL data, the detailed information about contracts sought in the
questionnaire is aggregated into the seven categories shown in Table 2. As explained in

9
Section 3, the two main categories of typical jobs in Italy are Permanent Employment (EP)
and Autonomous activity (A), including business owners–entrepreneurs, partnerships, and the
self-employed (VATs). Aggregation of our data allows us to distinguish, among the broad
variety of atypical temporary contracts, nowadays so pervasive in Italy, those involving an
employment relationship from autonomous or freelance collaborations. In the first group of
atypical contracts we find most of the temporary employment job relationships introduced by
the first reforms of the labour market, namely Employee: Temporary contracts (ET),
including temporary, work/training, apprenticeship, and work-entry contracts; and Employee:
Other-Temporary contracts (EOT), which considers the forms of temporary employment
(agency, job sharing, intermittent/on call works, and work practice, internship, traineeship
experiences2) introduced at a later stage. By contrast, the second group of atypical temporary
contracts, Autonomous Collaborators (AC), includes the recently introduced forms of
temporary autonomous contracts. There are then two residual categories, Employee: Other
contracts (EO) and Autonomous: Other contracts (AO), that include people who do not know
the contractual form or do not answer the question, respectively in the two broad forms of
employment and autonomous work3.
Table 3 shows the distribution of our sample of young people among all the possible job
arrangements. On average 58% of our sample (49% EP and 9% A) work in typical jobs, while
42% are found in “atypical” temporary arrangements. Within the latter, 27% are atypical
employees and about 14% are atypical autonomous collaborators. The total sample consists of
an average 2,874 individuals per year, that is 42% of the total population of young people.
Below, the table also reports the status of people belonging to our balanced panel over time.
From 2006 to 2010 the percentage of students in our sample quite expectedly decreases, while
the percentage of those employed increases. However, since the share of the inactive is almost
constant, if the percentage of unemployed decreases from 2006 to 2008 by 1% in our sample,
it increases by about 3% between 2008 and 2010. As explained in Section 3, AC work
arrangements, as well as cases of self-employment with VAT in A might hide de facto
employment relationships. Mandrone and Marocco (2012a) have made some attempts in this
sense on the ISFOL-PLUS 2010 cross-section, exploiting information on job characteristics
that might shed light on the true nature of the work relationships, finding that the incidence of
‘false’ autonomous is much higher among AC workers, especially if young, than among A
workers (80% versus 17%).
2 Only paid traineeships, internships and work experience are considered.
3 See Mandrone (2008) for detailed definitions.

10
Based on the above considerations, we decided to drop the A workers from our estimation
sample, as well as EO and AO, in order to retain only contract types that with a sufficiently
high degree of confidence share a de-facto employment relationship. Therefore, we end up
using the sample we believe closer to de facto employment, that comprising EP, ET, EOT and
AC.
4.2 Evidence on job satisfaction by contract
In the ISFOL-PLUS 2006-2008-2010 panel, for all workers job satisfaction is evaluated both
overall and in nine dimensions, available as answers to the following questions: “Overall,
what is your level of satisfaction with respect to: 1) work environment (relationships with
colleagues and superiors); 2) work organisation (timetable, shifts, overtime, holidays); 3)
duties; 4) content of job; 5) protection against sickness, accident and industrial injury; 6)
career perspectives; 7) pay; 8) competence and skill development; 9) job-stability”.
Responses were reported at four possible levels, which we re-ordered homogeneously for
increasing intensity as follows: low, medium-low, medium-high, high. The ‘do not know’ and
‘not applicable’ options were eliminated from the sample.
Table 4 shows how contracts differ across overall job satisfaction and its observed aspects.
Columns correspond to a given contract type and show differences in satisfactions between
that contract type and EP for each satisfaction category. The last column contains the average
satisfactions of EP.
We observe significantly lower overall satisfaction levels for EOT and especially AC, while
ET workers seem to be close to EP. All categories of atypical workers state they are more
satisfied than EP with aspects regarding the development of relationships with colleagues and
of skills. Importantly, job security/stability is the only working dimension with which all
atypical workers are significantly less satisfied than EP.
Such initial analysis of the data shows that on average 1) young atypical workers are no more
satisfied than EP; 2) the primary matter of concern among young atypical workers is job
stability. To draw conclusions on differences in job satisfaction across categories of workers,
controlling for differences in aspect satisfactions, personal and job characteristics and
unobserved heterogeneity along various dimensions, we need to implement an econometric
model of perceived satisfaction with appropriate controls and an appropriate error structure.

11
4.3 Explanatory variables
We use the available information on personal and firms’ characteristics. The former group of
variables is standard and comprises sex, age, education (3 levels: primary, secondary and
tertiary), and region of residence (4 macro-areas: north-west, north-east, centre, south and
islands).
The data-set is particularly rich as regards the latter group of variables: we observe
occupations (3 groups: high-medium-low skilled), sectors (5 groups: agriculture-forestry-
fishing, manufacturing, construction, trade and food, services)4, experience, tenure, work
place (firm, at home, moving, other people’s houses, other firms), firm size, annual earnings,
commuting time (in minutes) and over-education (which reports the need/or otherwise of the
educational level required for the activity performed).
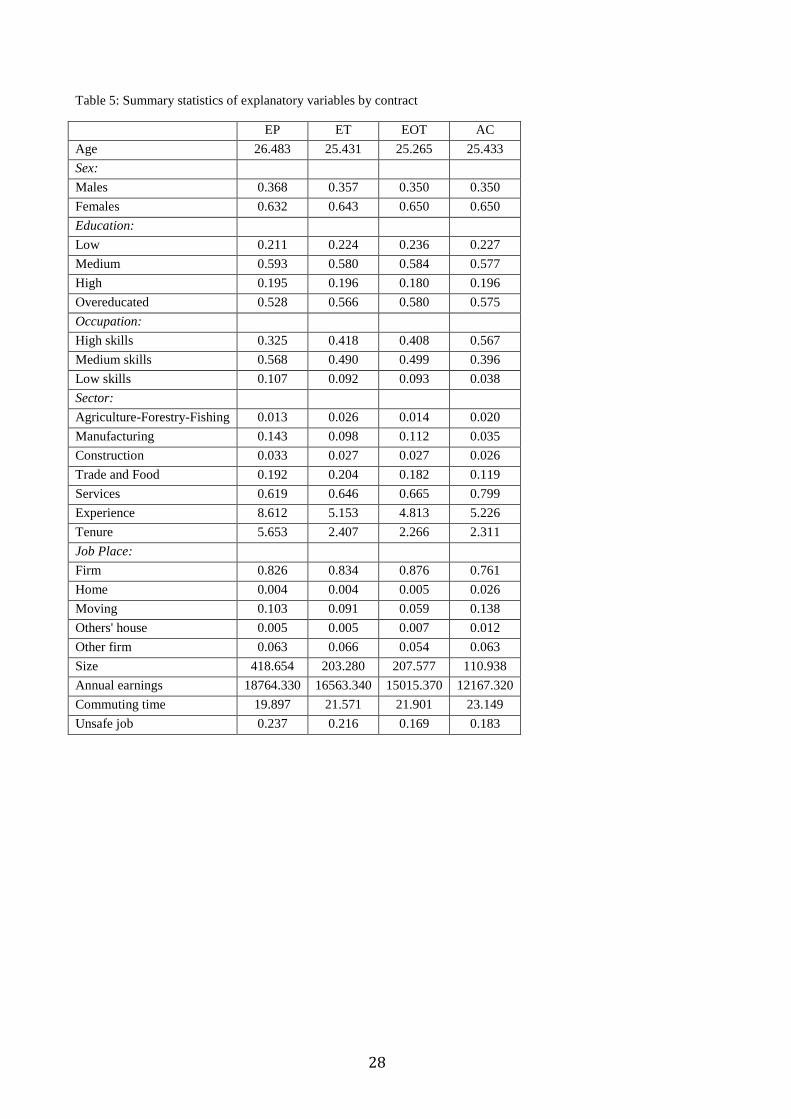
Table 5 displays the averages for the explanatory variables by contract types in the estimation
sample. Individual characteristics are almost equally distributed across contracts. In particular,
60% of young workers have a medium-level education and only 20% are highly educated.
Turning to firm characteristics: high-skill occupations are frequently governed by autonomous
contracts, whereas in medium-low-skilled occupations employment relationships record the
highest frequencies of observations. Also, the occupations where the young work with the
highest frequency are medium-high skilled (50% and 34%). Sectors that are more intensive in
terms of autonomous work are agriculture, construction, trade and food, and services in
general, where the majority of young people find occupation. Employment contracts are
instead more common in manufacturing. As expected, in EP jobs experience and tenure are
higher than in temporary work relationships. The place where the majority of our young
workers carry out their activity is the firm. Surprisingly enough, this also holds for AC
workers, which indicates the improper use that firms make of these contractual forms for
implementing low-cost de-facto employment relationships. Also, the majority of firms using
AC would appear to be small.
5. Econometric strategy
We observe ten categorical variables of job satisfaction. Let stand for overall job
satisfaction and for job satisfaction in aspect of worker at time
. All satisfaction variables take on values ordered from the lowest to
the highest level.
4 Sector (public or private) and Part-time/Full-time controls, although the information is available, were
eliminated due to the limited number of observations.

12
We assume that underlying there is a continuous variable, , thought of as latent job
satisfaction, ranging onto the real line, R, and that R is partitioned into four intervals common
to all individuals ( ) , where and . Thus, through
his/her declared each respondent reveals the interval ( ( ) ( )) in which his/her
happens to lie, with ( ) . We then set up a latent regression model for
,
with five groups of explanatory variables, holding permanent employment, , as the
reference contract type:
1. The job-aspect satisfactions, ,
2. The dummies indicating the three contract types other than permanent, ,
3. The interactions of job-aspect satisfactions and contract type indicators, ( ) ,
4. Time and regional dummies.
5. The vector of personal and job characteristics indicated in Section 4.
Thus the latent regression model, in its more general form, can be written as
∑ ∑ ∑ ∑ ( )
(1)
where is a composite error comprising possibly correlated effects, and an
independent idiosyncratic zero-mean component, . More specifically,
( ), where indicates a worker-specific component, which may accommodate,
among other individual-specific effects, subjective interpretation of the satisfaction questions;
stands for a time-specific component accommodating aggregate transitory shocks, and
( ) is a regional component capturing latent heterogeneity at the region level, with ( )
indicating the region of work for individual i at time t.
A less compact but easier to interpret formulation of Equation (1) is one that explicitly
represents the four possible job satisfaction statuses for a given worker i at year t , depending
on his/her contractual arrangement ( ) , Hence
13
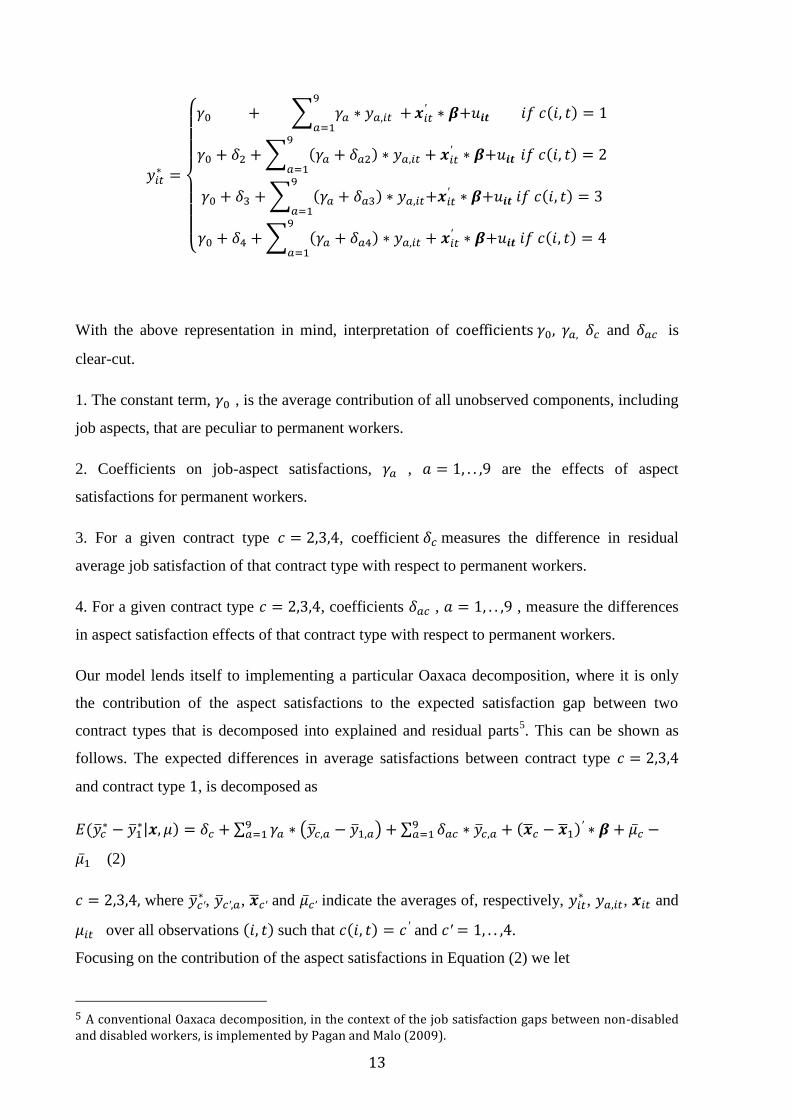
{
∑
( )
∑ ( ) ( )
∑ ( ) ( )
∑ ( )
( )
With the above representation in mind, interpretation of and is
clear-cut.
1. The constant term, , is the average contribution of all unobserved components, including
job aspects, that are peculiar to permanent workers.
2. Coefficients on job-aspect satisfactions, , are the effects of aspect
satisfactions for permanent workers.
3. For a given contract type , coefficient measures the difference in residual
average job satisfaction of that contract type with respect to permanent workers.
4. For a given contract type , coefficients , , measure the differences
in aspect satisfaction effects of that contract type with respect to permanent workers.
Our model lends itself to implementing a particular Oaxaca decomposition, where it is only
the contribution of the aspect satisfactions to the expected satisfaction gap between two
contract types that is decomposed into explained and residual parts5. This can be shown as
follows. The expected differences in average satisfactions between contract type
and contract type , is decomposed as
(
| ) ∑ ( ) ∑
( )
(2)
where , , and indicate the averages of, respectively,
, , and
over all observations ( ) such that ( ) and .
Focusing on the contribution of the aspect satisfactions in Equation (2) we let
5 A conventional Oaxaca decomposition, in the context of the job satisfaction gaps between non-disabled and disabled workers, is implemented by Pagan and Malo (2009).
14
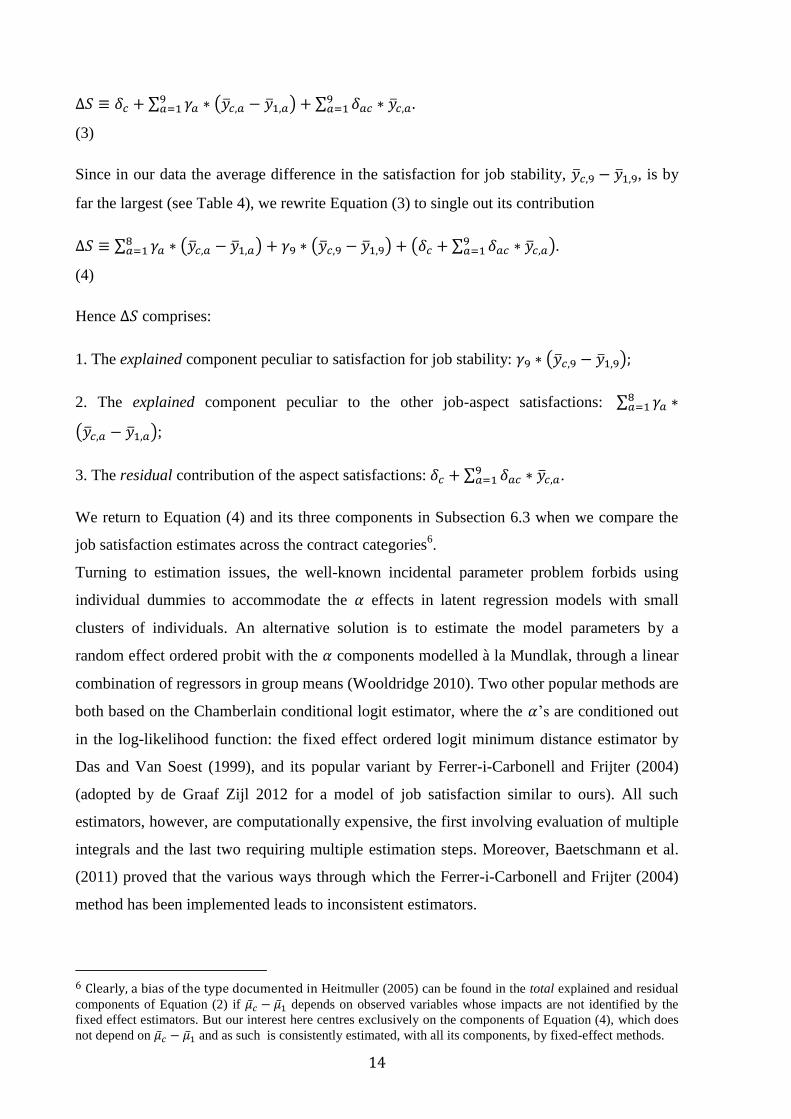
∑ ( ) ∑
(3)
Since in our data the average difference in the satisfaction for job stability, , is by
far the largest (see Table 4), we rewrite Equation (3) to single out its contribution
∑ ( ) ( ) ( ∑
)
(4)
Hence comprises:
1. The explained component peculiar to satisfaction for job stability: ( )
2. The explained component peculiar to the other job-aspect satisfactions: ∑
( );
3. The residual contribution of the aspect satisfactions: ∑ .
We return to Equation (4) and its three components in Subsection 6.3 when we compare the
job satisfaction estimates across the contract categories6.
Turning to estimation issues, the well-known incidental parameter problem forbids using
individual dummies to accommodate the effects in latent regression models with small
clusters of individuals. An alternative solution is to estimate the model parameters by a
random effect ordered probit with the components modelled à la Mundlak, through a linear
combination of regressors in group means (Wooldridge 2010). Two other popular methods are
both based on the Chamberlain conditional logit estimator, where the ’s are conditioned out
in the log-likelihood function: the fixed effect ordered logit minimum distance estimator by
Das and Van Soest (1999), and its popular variant by Ferrer-i-Carbonell and Frijter (2004)
(adopted by de Graaf Zijl 2012 for a model of job satisfaction similar to ours). All such
estimators, however, are computationally expensive, the first involving evaluation of multiple
integrals and the last two requiring multiple estimation steps. Moreover, Baetschmann et al.
(2011) proved that the various ways through which the Ferrer-i-Carbonell and Frijter (2004)
method has been implemented leads to inconsistent estimators.
6 Clearly, a bias of the type documented in Heitmuller (2005) can be found in the total explained and residual
components of Equation (2) if depends on observed variables whose impacts are not identified by the
fixed effect estimators. But our interest here centres exclusively on the components of Equation (4), which does
not depend on and as such is consistently estimated, with all its components, by fixed-effect methods.

15
For all of the above reasons, we follow an alternative estimation strategy based on a fixed
effect extension of the linear approach to ordered response models described in Van Praag et
al. (2004) and (2006), also known as probit OLS (POLS) (Green and Leeves 2011 use POLS
on Australian data). This method is based upon the consideration that ordered probit yields an
OLS-like log-likelihood, with the same set of regressors as in the underlying latent regression
model and a dependent variable given by the conditional mean ( |
). Then,
assuming a standard-normal distribution for , one can estimate (
| )
through sample analogs and implement ordered probit as an OLS regression. In this way the
inconsistent estimates of the elements are separable from the slope estimators, exactly as in
ordinary linear panel data models, so that the latter are consistent for and T fixed.
We implement three different specifications, starting with the most parsimonious one, Model
1, which maintains homogeneous effects of aspect satisfactions across contract types and
excludes personal and job controls, setting , , and . Model
2 provides an intermediate specification setting , while Model 3 carries out
unconstrained estimation. We estimate the three models for the whole sample and, separately,
for the male and female subsamples.
A random effect (RE) POLS can always be implemented as an alternative to fixed effect (FE)
POLS. Indeed,Van Praag et al. (2004) advocate the use of the former for two reasons: 1) if
valid, it is more efficient and 2) it can identify effects of time-constant variables, such as
gender. It must be considered, however, that RE POLS is less robust than FE POLS to
correlated individual effects. In addition, we prefer to assess the impact of gender at the most
general level, by running separate regressions on male and female subsamples. With these
pros and cons in mind, we subjected the choice between the two estimators to a battery of
heteroskedasticity-robust Hausman tests, which led to rejection of the random effect
specification for all models and samples at any conventional level of significance.
Van Praag et al. (2006) show that ordered probit and POLS estimates are almost identical up
to a proportionality coefficient. In other words, both methods provide virtually the same
estimates of coefficient ratios, referred to as trade-off ratios in Van Praag et al. (2006), in the
satisfaction equation. It is not hard to see that the probit analogous of the FE POLS is the RE
Ordered Probit à la Mundlak we mentioned above. Therefore, we also applied this estimator
to our three models to find that RE POLS estimates and the Mundlak RE Ordered Probit
estimates are indeed very close up to a proportionality coefficient with also close t-statistics,
exactly as evidenced by Van Praag et al. (2006) in the case of the simple ordered probit and
POLS estimates. For example, FE POLS and Mundlak RE Ordered Probit applied to Model 1

16
over the whole sample provide an estimate for the trade-off ratio between and of
3.22 and 3.17, respectively; in Model 2 they both yield a trade-off ratio of 3.03; in Model 3
they yield trade-off ratios of 3.10 and 3.14, respectively. Given this substantial equivalence of
results, FE POLS lends itself as a computationally easier alternative to Mundlak RE Ordered
Probit. Therefore, we report and comment results exclusively for the former.
6. Results
6.1 Job-aspect satisfactions
Table 6 shows results for all models and samples. Model 1 assumes homogeneous impacts of
job-aspect satisfactions across contract types. As expected, all dimensions of job satisfaction
are positively significant. Satisfaction with relationships with colleagues and superiors
emerges as the most important determinant of overall job satisfaction, especially for males.
Job stability emerges as the second most important dimension of job satisfaction, especially
for females.
On comparing our results with previous studies on the subject it has to be borne in mind that
we concentrate on the subpopulation of young workers. Nonetheless, our job stability estimate
is consistent with the evidence for the UK (Clark, 1997; Green and Heywood, 2011) and
Australia (Wooden et al., 2004; Green and Leeves, 2013), where job stability has been found
strongly linked to workers’ well-being. The data examined by de Graaf-Zijl (2012), instead,
tells a different story for the Netherlands, where it is happiness with job content which is the
primary aspect and job stability counts for the least. In our data job content has a prominent
position only for the male subsample, but in the whole sample, as well as the female sample,
it seems to be less important than both relations with colleagues and job stability. Such
discrepancy with de Graaf-Zijl (2012) may simply reflect true differences between the
populations of Italian young workers and Dutch workers, and indeed be explained by the
effective flexicurity policies implemented in the Netherlands. However, since we observe
happiness with work relationships, as well as other important dimensions of job satisfaction
that instead are not observed in the Dutch data, the job content and the job stability
coefficients in de Graaf-Zijl (2012) may also capture the impact of the neglected factors.
After job relationships and job stability, there are the following other job aspects, in order of
importance: pay, job content and skills development, and lastly work burden, times and
safety. Focussing on contractual dummies, it seems that, ceteris paribus, ET and EOT are
more satisfied than EP (especially ET males), whereas AC job satisfaction is not significantly
different from EP. The ceteris paribus clause is crucial, since the actual differences in overall

17
satisfaction may be mainly driven by differences in aspect satisfactions across contract
categories. We return to this in Subsection 6.3.
Model 2 includes interaction terms, allowing for separate effects of aspect satisfaction across
contract types. Interestingly, while the interaction terms are jointly significant, contract
dummies are no longer so, indicating that, once interactions are included, there are no residual
unobserved job aspects to explain differences in overall satisfaction across contract types. Not
only does this make interpretation of results more clear-cut, but it is also reassuring in terms
of our model specification, which indeed considers a more complete list of aspect
satisfactions than in previous studies. For example, de Graaf Zijl (2012) notices that
significant coefficients on contract dummies may be explained by turning to neglected job
aspects, such as career opportunities and relationships with co-workers, which are instead
observed in our analysis. Coefficient estimates on job-aspect satisfaction are still significantly
positive and close to those of Model 1.
To fully evaluate the impact of the different domains of satisfaction in Model 2 we also have
to consider interaction coefficients, which permit heterogeneous impacts across contract
types. ET workers seem to be rather homogeneous to EP over almost all job aspects.
Heterogeneity of behaviour with respect to EP seems to characterise EOT and AC to a greater
extent, but often with opposite patterns.
Model 3 adds personal and job characteristics to Model 2. Before discussing results for this
model we observe, as a result of an F test, that such additional regressors are not jointly
significant, which validates the conclusions already drawn for Model 2. In fact, coefficient
estimates here are very close in size to those of Model 2, and have almost always the same
sign. The pattern of statistical significance is also confirmed, with one interesting additional
result: the positive impact of career satisfaction for ET in the whole sample reaches 10%
significance, where the same coefficient in Model 2 presents a larger standard error.
6.2 Time, regional and gender effects
The year 2008 brought about a significantly lower job satisfaction level, compared to 2006
and 2010, for all samples and models. This can be explained with the worsening of
expectations in all categories of workers in the wake of the first year of financial crisis in
Europe. The fact that, in 2010, job satisfaction reverted, on average, to the levels of 2006,
while the Italian youth unemployment rate has increased by 6.5 percentage points from 2008
to 2010, seems to be puzzling. One possible explanation is that those remaining employed in
18
2010, in spite of a worsening macroeconomic background, are relieved that they are able to
keep their jobs in bad times, and so upgrade their current expectations compared to 2008.
In models with fixed effects, regional effects are identified by movers across regions, but
transition frequencies are extremely low in our data, explaining the general insignificant
coefficients on regional dummies.
Male and female intercept estimates reflect average estimated fixed effects for each
subsample. Although their differences are not highly significant (based on coefficient and
standard error estimates in Table 6, we find that Model 3 yields the highest t-test of -1.57), we
observe that the intercept of males is always smaller than that of females, confirming the
gender effect evidenced in the literature (this is the “gender paradox” discussed in Section 2).
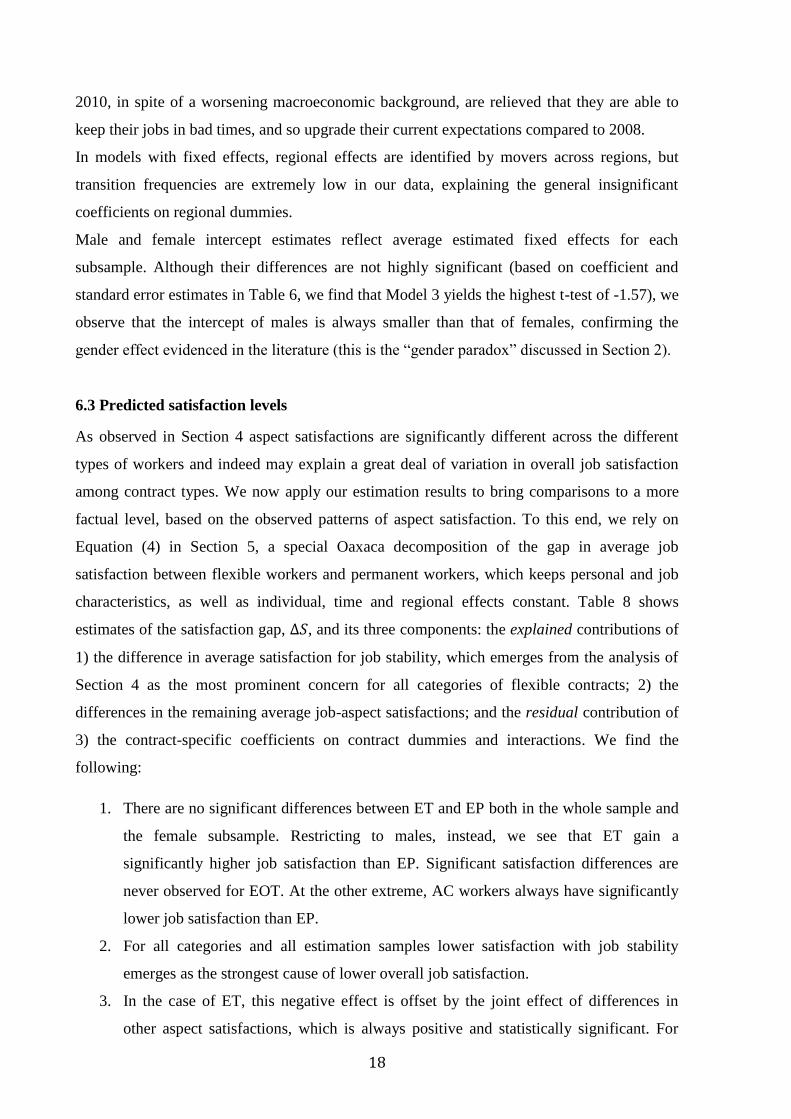
6.3 Predicted satisfaction levels
As observed in Section 4 aspect satisfactions are significantly different across the different
types of workers and indeed may explain a great deal of variation in overall job satisfaction
among contract types. We now apply our estimation results to bring comparisons to a more
factual level, based on the observed patterns of aspect satisfaction. To this end, we rely on
Equation (4) in Section 5, a special Oaxaca decomposition of the gap in average job
satisfaction between flexible workers and permanent workers, which keeps personal and job
characteristics, as well as individual, time and regional effects constant. Table 8 shows
estimates of the satisfaction gap, , and its three components: the explained contributions of
1) the difference in average satisfaction for job stability, which emerges from the analysis of
Section 4 as the most prominent concern for all categories of flexible contracts; 2) the
differences in the remaining average job-aspect satisfactions; and the residual contribution of
3) the contract-specific coefficients on contract dummies and interactions. We find the
following:
1. There are no significant differences between ET and EP both in the whole sample and
the female subsample. Restricting to males, instead, we see that ET gain a
significantly higher job satisfaction than EP. Significant satisfaction differences are
never observed for EOT. At the other extreme, AC workers always have significantly
lower job satisfaction than EP.
2. For all categories and all estimation samples lower satisfaction with job stability
emerges as the strongest cause of lower overall job satisfaction.
3. In the case of ET, this negative effect is offset by the joint effect of differences in
other aspect satisfactions, which is always positive and statistically significant. For

19
male ET there is the additional effect of a significantly positive portion of higher job
satisfaction brought about by differences in coefficients, which eventually bring male
ET onto a higher level of job satisfaction than male EP.
4. In the case of EOT the last two components are barely individually significant.
However, they are always positive, with the last also sizeable, such that the two effects
together offset the job-stability component both in size and in statistical significance.
5. For AC the last two components always go hand in hand with the job-stability
component, contributing to make AC significantly worse off than EP. Using a similar
decomposition, de Graaf Zijl (2012) finds similar results for on-call and agency
workers, although in the latter case dissatisfaction with work content is more
pronounced than dissatisfaction with job stability.
6.4 Sample selection and endogeneity
Since the satisfaction questions are restricted to employees, were the employee status related
to the idiosyncratic part of the regressions, our estimates would be affected by an incidental-
truncation bias.
Testing the correlation of the idiosyncratic error with past and future selection is not hard. In
all models a battery of simple variable addition tests (see Semykina and Wooldridge 2010)
never reject the null of zero correlation between and past or future realizations of the
selection. More specifically, the selection rule is such that if individual i is in the
sample at time t (has the employee status) and otherwise. We estimated equation (1)
adding each time a different pattern of selection among the right-hand-side variables: ,
, ∑ and ∑
. These variables never proved either individually or jointly
significant. For example, in Model 1, for the whole sample, the t-test of is (with a
p-value of 0.185), the t-test of = -1.09 (p-value=0.277), the t-test of ∑ =-0.37
(p-value=0.712) and the t-test of ∑ =0.37 (p-value= 0.712). Similar results are obtained
for the other models and samples.
Testing for contemporaneous selection is more intricate. For example, implementing the two-
step procedure suggested in Semykina and Wooldridge (2010) requires that we take care of
the incidental truncation on a subset of right-hand-side variables, specifically the aspect
satisfaction variables, the contract indicators and, in models 2 and 3, the interactions between
the two groups of variables. In any event, this boils down to an unusually high number of

20
potentially endogenous regressors, which should be matched by an equal number of non-
truncated excluded instruments, a hard task in our sample.
Aware of the above difficulty, we nonetheless attempted to implement the Semykina and
Wooldridge test on our most parsimonious specification, Model 1, using the following
instruments: the number of family members, its square, the number of children, the foregoing
variables interacted with each of the 24 cohort indicators and with the individual height
variable. The t-test for the inverse Mills ratio 2SLS fixed effect estimate is 0.54 (p-
value=0.586), which supports the absence of a selection bias at any conventional level of
significance.
Based on the above findings, we did not attempt to correct our estimate for selection bias. We
believe, though, that testing and correcting contemporaneous sample selection in satisfaction
models with potentially many endogenous variables deserves further effort in the search for
relevant instruments. This will be matter for further research on our part.
7. Conclusions
In this chapter we have investigated job quality from the point of view of young Italian
workers, using self-declared levels of job satisfaction for a sample of young workers extracted
from the ISFOL-panel. We estimated three fixed-effect models of job satisfaction, all
including nine aspects of job satisfaction and three contractual dummies for de facto
temporary employees, ET, EOT and AC, as explanatory variables. We found that, compared
to employment permanent positions (EP), lower satisfaction with job stability is the aspect
with the highest negative, and significant, incidence on the job satisfaction of all three
categories of de facto temporary employment. We also found that ET present patterns of job
satisfaction that are rather homogenous to EP. Heterogeneity of behaviour with respect to EP
seems to characterise more EOT and AC, but often with opposite patterns. Finally, we found
that, while ET and EOT tend to compensate concerns of job stability with other job aspects,
attaining job satisfaction levels not significantly different from EP, AC do not, and so, on
average, stand as the least satisfied.
Our fixed effect estimates are robust to endogeneity of aspect satisfactions due to correlation
with, and sorting of workers into contracts based on, all observables and time-constant
unobservables. We also started to tackle sample selection and endogeneity caused by exits to
unemployment and non-activity that may be related to idiosyncratic shocks, an issue that, to
our knowledge, has received little attention in the empirical literature on job satisfaction. At

21
this stage, based on a battery of selection tests, we found no strong evidence of sample
selection bias in our fixed-effect estimates. Further work is needed, though, especially in the
search for relevant instruments for testing contemporaneous selection in satisfaction models
that, like ours, have potentially many endogenous right-hand-side variables.
A conclusion that can be drawn at this stage is that the picture representing youth temporary
employment in Italy as a homogeneous group of precarious workers with low expectations
needs to be adjusted. ET and, to a lesser extent, EOT contracts seem to ensure satisfaction
patterns comparable to those of permanent workers. This is in accordance also with the
evidence based on the INPS archives in Berton et al. (2011), showing that ET and EOT are
more likely to upgrade to EP positions than AC.
Our analysis shows that the most disadvantaged category of young workers in Italy is
undoubtedly that of AC workers, who are contractually free-lancers, but are mostly used by
firms for implementing flexibility at a lower cost than temporary employees, justifying the
recent policy concerns raised by such contractual arrangements. However, recent policies
have aimed at regulating AC rather than trying to improve the use of ET and EOT, which
instead prove better stepping stones to permanent employment and, according to our study,
the most satisfactory type of temporary job for young people in Italy.

22
References
Addabbo, T. and G. Solinas (2012), Non-standard employment and quality of work: toward
new forms of measurement, in Addabbo T. and G. Solinas (eds.), Non-standard employment
and quality of work: the case of Italy, AIEL Series in Labour Economics, Springer Verlag,
Heidelberg.
Allen, J. and R. van der Velden (2001), Educational mismatches versus skill mismatches:
effects on Wages, job satisfaction and on-the-job search, Oxford Economic Papers, 53(3), pp.
434–52.
Baetschmann, G., Staub, K. and R. Winkelmann (2011), Consistent estimation of the fixed
effects ordered logit model, IZA Discussion Paper no. 5443.
Bardasi, E. and M. Francesconi (2004), The impact of atypical employment on individual
wellbeing: evidence from a panel of British workers, Social Science and Medicine, 58 (9), pp.
1671–1688
Bentolila, S., J. J. Dolado and J. F. Jimeno (2012), Reforming an insider-outsider labor
market, IZA Journal of European Labor Studies, 1:4.
Berton, F., Devicienti, F. and L. Pacelli (2011), Are temporary jobs a port of entry into
permanent employment? Evidence from matched employer-employee data, International
Journal of Manpower, 32(8), pp. 879-899.
Berton, F., Richiardi, M. and S. Sacchi (2009), Flex-insecurity. Perchè in Italia la flessibilità
diventa precarietà, Il Mulino, Bologna.
Blanchflower, D. G. (2000), Self-employment in OECD countries, Labour Economics, 7, pp.
471–505.
Blanchflower, D. G. and A. J. Oswald (1999), Well-being, insecurity and the decline of
American job satisfaction, presented at the Cornell University conference, May 1999,
Dartmouth College, mimeo.
Boeri, T. (2011), Institutional reforms and dualism in European labor markets, in Card, O. and
O. Ashenfelter (eds.), Handbook of Labor Economics, Volume 4, Part B, Chap. 13, pp. 1173-
1236.
Booth, A. L., Francesconi, M. and J. Frank (2002), Temporary jobs: stepping stones or dead
ends? Economic Journal, 112 (480), pp. F189–F213.
Bradley, D. E. and J. A. Roberts (2004), Self-Employment and job satisfaction: Investigating
the role of self-efficacy, depression, and seniority, Journal of Small Business Management,
Vol. 42, 1, pp. 37-58.
Bruno, G. S. F., Caroleo F. E. and O. Dessy (2013), Stepping stones versus dead end jobs:
Exits from temporary contracts in Italy after the 2003 reform, forthcoming in Rivista
Internazionale per le Scienze Sociali, 1.
Clark, A. E. (1996), Job Satisfaction in Britain, British Journal of Industrial Relations, vol.
34, 2, pp. 189-217.
Clark, A. E. and A. J. Oswald (1996), Satisfaction and comparison income, Journal of Public
Economics, 69, pp. 57-81.

23
Clark, A.E. , A. J. Oswald and P. Warr (1996), Is job satisfaction U-shaped in age?, Journal
of Occupational and Organizational Psychology, 60, pp. 57-81.
Clark, A. E. (1997), Job Satisfaction and Gender: Why Are Women So Happy at Work,
Labour Economics, 4, pp. 189–217.
Das, M. and A. Van Soest (1996), A panel data model for subjective information on
household income growth, Journal of Economic Behavior and Organization, 40, pp. 409-426.
de Graaf-Zijl, M. (2012), Job satisfaction and contingent employment, De Economist, 160, pp.
197–218.
Elder, S. (2009), ILO school-to-work transitions, International Labour Office, Geneva.
Eurofound (2007), Job satisfaction and labour market mobility, Dublin.
Eurofound (2012), Trends in job quality in Europe, Publications Office of the European
Union, Luxembourg.
European Commission (2001), Employment in Europe, Employment and social affairs
directorate. Office for Official Publications of the European Union, Luxemburg.
European Commission (2007), Toward common principles of flexicurity: More and better
jobs through flexibility and security, Office for Official Publications of the European
Communities, Luxemburg.
Ferrer-i-Carbonell, A. and P. Frijters (2004), How important is methodology for the estimates
of the determinants of happiness?, The Economic Journal, 114, pp. 641-659.
Freeman, R. (1978), Job satisfaction as an economic variable, American Economic Review,
68, p. 135-141.
Gottschalk, P. and T. Maloney (1985), Involuntary terminations, unemployment and job
matching: a test of job search theory, Journal of Labor Economics, pp. 109-123.
Green, C. and J. S. Heywood (2011), Flexible contracts and subjective well-being, Economic
Inquiry, 49, pp. 716–29.
Green, C. and G. D. Leeves (2013), Job security, financial security and worker well-being.
New evidence on the effects of flexible employment, Scottish Journal of Political Economy,
Vol. 60, 2, pp. 121-138.
Green, F. (2007), Demanding work: The paradox of job quality in the affluent economy,
Princeton University Press, Princeton.
Hamermesh, D. (1997), Economic aspects of job satisfaction, in Ashenfelter, O. and W. Oates
(eds.), Essays in Labor market Analysis, Wiley, Oxford.
Heitmüller, A. (2005) "A Note on Decompositions in Fixed Effects Models in the Presence of
Time-Invariant Characteristics." IZA DP no. 1886
Jahn, E. J., Riphahn, R. T. and C. Schnabel (2012), “Feature: Flexible forms of employment:
boon and bane”, The Economic Journal, 122, pp. F115–F124.
Kaiser, L. C (2007), Gender-Job Satisfaction Differences across Europe: An Indicator for
Labor Market Modernization, International Journal of Manpower, 28 (1), pp. 75-94.

24
Mandrone, E. (2008), La riclassificazione del lavoro tra occupazione standard e atipica:
l’indagine Isfol-Plus 2006, Collana studi Isfol n. 2008/1.
Mandrone, E. (ed) (2012), Labour Economics PLUS Empirical Studies, ISFOL Temi e
Ricerche n. 3, Rome.
Mandrone, E and M. Marocco (2012a), Atipicità, flessibilità e precarietà: una lettura
economica e giuridica attraverso l’indagine ISFOL-PLUS, ISFOL Working Paper.
Mandrone, E and M. Marocco (2012b), L’atipicità e i suoi derivati, www.lavoce.info.
Origo, F. and L. Pagani (2009), Flexicurity and job satisfaction in Europe: The importance of
perceived and actual job stability for well-being ay work, Labour Economics, 16(5), pp. 547-
555.
Oswald, A. J. (1997), Happiness and economic performance, Economic Journal, 107(445),
pp. 1815-31.
Pagan, R. and M. A. Malo (2009), Job satisfaction and disability: lower expectations about
jobs or a matter of health?, The Spanish Economic Review, 11, pp. 51-74. Ricardo Pagán · Miguel Ángel Malo
Semykina, A., & Wooldridge, J. M. (2010). Estimating panel data models in the presence of
endogeneity and selection. Journal of Econometrics, 157, 375-380.
Sousa-Poza, A. and Sousa-Poza A. A. (2003), Gender differences in job satisfaction in Great
Britain, 1991-2000: permanent or transitory?, Applied Economics Letters, 10(11), pp. 691-
694.
Van Praag, B. M. S. and A. Ferrer-i-Carbonell (2004), Happiness quantified: A satisfaction
calculus approach, Oxford Universty Press, Oxford.
Van Praag, B. M. S. and A. Ferrer-i-Carbonell (2006), An almost integration-free approach to
ordered response models, Tibergen Institute Discussion Paper. 2006-047/3.
Van Praag, B. M. S. and A. Ferrer-i-Carbonell (2008), A multi- dimensional approach to
subjective poverty’, in: Kakwani, N. and J. Silber (eds.), Quantitative Approaches to
Multidimensional Poverty Measurement, Palgrave, Macmillan, NY.
Wooden, M. and D. Warren (2004), Non-standard employment and job satisfaction: evidence
from the HILDA survey, The Journal of Industrial Relations, 46(3), pp. 275-297.
Wooldridge, J. M. (2010), Econometric Analysis of Cross Section and Panel Data, The MIT
Press, Cambridge, MA.

25
Table 1: Distribution of the sample (aged between 15 and 35) by sex
2006 2008 2010
WHOLE POPULATION
males 3,237 3,229 3,225
% 47.81 47.74 47.72
females 3,534 3,535 3,533
% 52.19 52.26 52.28
Total 6,771 6,764 6,758
EMPLOYED
males 1,179 1,666 1,874
% 55.13 55.02 54.25
females 959 1,363 1,581
% 44.87 44.98 45.75
Total 2,138 3,029 3,455

26
Table 2: Definition of contract aggregates in the ISFOL-PLUS 2006-2008-2010 panel
CONTRACT CATEGORY: TYPICAL ATYPICAL
1. EMPLOYEE: PERMANENT (EP) permanent job
2. EMPLOYEE: TEMPORARY (ET) temporary job
work and training
apprenticeship
starter contract
3. EMPLOYEE: OTHER TEMPORARY (EOT) agency temporary
job sharing/on call
stage
professional training
4. AUTONOMOUS (A) entrepreneur
cooperative members
self-employed (VAT)
family co-worker
5. AUTONOMOUS COLLABORATORS (AC) contracting job
occasional job
consulting job
6. EMPLOYEE: OTHER (EO) do not know/do not answer
7. AUTONOMOUS: OTHER (AO) do not know/do not
answer

27
Table 3: Distribution of young workers by contract and status
2006 2008 2010 (2006-2010
Contract (%) (averages)
EP 48.22 48.6 50.71 49.18
ET 19.64 20.47 19.39 19.83
EOT 5.8 5.28 4.6 5.23
A 8.84 9.21 10.16 9.40
AC 13.56 12.91 11.69 12.72
EO 3.37 1.98 2.46 2.60
AO 0.56 1.55 0.98 1.03
Total 2,138 3,029 3,455 2,874.00
Status (%)
EMPLOYED 31.58 44.78 51.12 42.49
UNEMPLOYED 15.64 14.84 17.39 15.96
INACTIVE 6.91 6.14 5.09 6.05
STUDENT 45.87 34.24 26.4 35.50
Total 6,771 6,764 6,758 6,764.33
Table 4: Dimensions of job satisfaction by contract
ET EOT AC EP
JS aspects:
Relationships 0.11*** 0.12** 0.12*** 3.11***
Times -0.01 -0.07 0.01 3.10***
Burden 0.11*** -0.01 0.04 2.90***
Content 0.09*** -0.02 0.01 3.03***
Safety 0.02 -0.05 -0.15*** 3.11***
Career 0.05 -0.06 -0.21*** 2.44***
Pay 0.03 -0.13* -0.22*** 2.51***
Skills 0.14*** 0.14*** 0.09** 2.80***
Stability -0.62*** -1.00*** -1.11*** 3.26***
Overall -0.03 -0.13*** -0.25*** 2.97***
p<0.05; ** p<0.01; *** p<0.001
28
Table 5: Summary statistics of explanatory variables by contract
EP ET EOT AC
Age 26.483 25.431 25.265 25.433
Sex:
Males 0.368 0.357 0.350 0.350
Females 0.632 0.643 0.650 0.650
Education:
Low 0.211 0.224 0.236 0.227
Medium 0.593 0.580 0.584 0.577
High 0.195 0.196 0.180 0.196
Overeducated 0.528 0.566 0.580 0.575
Occupation:
High skills 0.325 0.418 0.408 0.567
Medium skills 0.568 0.490 0.499 0.396
Low skills 0.107 0.092 0.093 0.038
Sector:
Agriculture-Forestry-Fishing 0.013 0.026 0.014 0.020
Manufacturing 0.143 0.098 0.112 0.035
Construction 0.033 0.027 0.027 0.026
Trade and Food 0.192 0.204 0.182 0.119
Services 0.619 0.646 0.665 0.799
Experience 8.612 5.153 4.813 5.226
Tenure 5.653 2.407 2.266 2.311
Job Place:
Firm 0.826 0.834 0.876 0.761
Home 0.004 0.004 0.005 0.026
Moving 0.103 0.091 0.059 0.138
Others' house 0.005 0.005 0.007 0.012
Other firm 0.063 0.066 0.054 0.063
Size 418.654 203.280 207.577 110.938
Annual earnings 18764.330 16563.340 15015.370 12167.320
Commuting time 19.897 21.571 21.901 23.149
Unsafe job 0.237 0.216 0.169 0.183

29
Table 6: Job Satisfaction – Fixed effects POLS
Model 1 Model 2 Model 3
VARIABLES Whole sample Males Females Whole sample Males Females Whole sample Males Females
sat relationships 0.194*** 0.208*** 0.182*** 0.202*** 0.205*** 0.196*** 0.204*** 0.208*** 0.198***
sat times 0.0603*** 0.0500* 0.0678*** 0.0665*** 0.0611* 0.0710** 0.0650*** 0.0608* 0.0723**
sat burden 0.0694*** 0.0614** 0.0779*** 0.0709*** 0.0499 0.0874*** 0.0727*** 0.0542 0.0881***
sat content 0.137*** 0.203*** 0.0918*** 0.124*** 0.197*** 0.0688** 0.123*** 0.192*** 0.0675*
sat safety 0.0386*** 0.0412** 0.0374** 0.0282* 0.0238 0.0348* 0.0298* 0.0248 0.0342
sat career 0.110*** 0.143*** 0.0867*** 0.0844*** 0.116*** 0.0637*** 0.0803*** 0.111*** 0.0612***
sat pay 0.140*** 0.121*** 0.156*** 0.150*** 0.154*** 0.148*** 0.149*** 0.159*** 0.144***
sat skills 0.114*** 0.105*** 0.119*** 0.130*** 0.138*** 0.119*** 0.129*** 0.130*** 0.124***
sat stability 0.166*** 0.132*** 0.186*** 0.150*** 0.114*** 0.174*** 0.147*** 0.109*** 0.174***
Ref. PE
ET 0.0753** 0.113** 0.0315 0.123 0.0566 0.0911 0.137 0.0785 0.113
EOT 0.131* 0.121 0.107 -0.354 -0.111 -0.576 -0.447 -0.302 -0.537
AC -0.00978 -0.0211 -0.00560 -0.244 0.0598 -0.478 -0.205 0.0752 -0.385
Controls no no no no no no yes yes yes
ET*relationships 0.0114 0.0643 -0.0288 0.0130 0.0590 -0.0265
EOT*relationships -0.0800 -0.131 -0.0718 -0.0494 -0.0884 -0.0503
AC*relationships -0.0504 -0.0910 -0.0258 -0.0613 -0.101 -0.0463
ET*times -0.00235 -0.0405 0.0219 -0.000692 -0.0340 0.0178
EOT*times 0.174** 0.232 0.152 0.179** 0.224 0.135
AC*times -0.105** -0.0814 -0.118* -0.101* -0.0979 -0.111*
ET* burden -0.00128 0.0506 -0.0310 -0.00447 0.0475 -0.0123
EOT* burden -0.0767 -0.268* 0.00539 -0.0616 -0.206 -0.00791
AC* burden 0.0446 0.0947 0.0109 0.0406 0.109 0.00491
ET*content 0.00551 0.0344 -0.0133 0.00759 0.0252 -0.00626
EOT* content 0.288** 0.343** 0.258* 0.269** 0.267 0.268*
AC* content -0.0263 -0.252** 0.109 -0.0252 -0.246** 0.105
ET*safety -0.0100 0.0167 -0.0307 -0.0125 0.0186 -0.0370
EOT* safety -0.000244 0.0152 0.0521 0.0242 0.0378 0.0707
AC* safety 0.0651 0.153** 0.0199 0.0621 0.149** 0.0212
ET*career 0.0554 0.0401 0.0467 0.0607* 0.0419 0.0518
EOT* career 0.123 0.143 0.0544 0.118 0.128 0.0765
AC* career 0.0839* 0.0696 0.105* 0.0871* 0.0719 0.0994
ET*pay -0.0541 -0.105* 0.00895 -0.0592 -0.119* 0.00886

30
EOT* pay -0.113 -0.190* -0.0616 -0.132* -0.175 -0.0922
AC* pay 0.0743 0.0461 0.101 0.0716 0.0654 0.0917
ET*skills -0.0656 -0.0932 -0.0283 -0.0729 -0.0873 -0.0479
EOT* skills -0.151 -0.154 -0.118 -0.162 -0.165 -0.119
AC* skills 0.0250 0.0345 0.0188 0.0279 0.0131 0.0318
ET*stability 0.0455 0.0302 0.0514 0.0470 0.0434 0.0371
EOT* stability -0.0185 0.0548 -0.0558 -0.0137 0.0963 -0.0807
AC* stability 0.00272 0.0314 -0.0265 -0.00156 0.0395 -0.0344
Ref. North West
North – East -0.210 0.301 -0.779 -0.130 0.390* -0.693 -0.131 0.420* -0.618
Center 0.397 -0.240 0.855 0.330 -0.245 0.660 0.309 -0.211 0.633
South-Isles -0.293 -0.603* 0.0178 -0.305 -0.461* -0.0709 -0.301 -0.513* -0.131
Ref. 2006
2008 -0.0842*** -0.0689** -0.0922*** -0.0878*** -0.0743** -0.0894*** -0.103*** -0.103*** -0.0928***
2010 0.0220 0.0327 0.00977 0.0199 0.0345 0.00943 - - -
Constant -2.916*** -2.995*** -2.817*** -2.845*** -3.012*** -2.667*** -3.349*** -4.802*** -2.640***
Observations 6,860 2,827 4,033 6,860 2,827 4,033 6,794 2,804 3,990
R-squared 0.316 0.346 0.302 0.326 0.365 0.315 0.330 0.372 0.320
Individuals 3,469 1,395 2,074 3,469 1,395 2,074 3,435 1,383 2,052
F-test ASatisf§ 0.000 0.000 0.000 0.000 0.000 0.000 0.000 0.000 0.000
F-test Contracts§ 0.048 0.086 0.628 0.400 0.991 0.181 0.336 0.943 0.296
F-test interactions§ - - - 0.016 0.046 0.062 0.012 0.073 0.096
F-test X p-value § - - - - - - 0.495 0.255 0.741
Cluster *** p<0.01, ** p<0.05, * p<0.1
§ p-values

31
Table 7. Average differences in satisfaction with respect to PE
(Equation (4) decomposition - based on Model 3 estimates for constant personal and job characteristics)
ET EOT AC
Whole sample
Difference in job satisfaction1 0.036 -0.033 -0.230***
due to differences in satisfaction with security2
-0.091*** -0.147*** -0.163***
due to differences in other aspect satisfaction y3 0.068*** 0.011* -0.013*
due to differences in coefficients4 0.059 0.104 -0.053
Males
Difference in job satisfaction 0.116** -0.070 -0.226***
due to differences in satisfaction with security -0.054*** -0.103*** -0.113***
due to differences in other aspect satisfaction 0.047*** 0.001 -0.025*
due to differences in coefficients 0.123** 0.032 -0.088
Females
Difference in job satisfaction 0.033 -0.023 -0.243***
due to differences in satisfaction with security -0.123*** -0.181*** -0.202***
due to differences in other aspect satisfaction 0.079*** 0.010 -0.009
due to differences in coefficients 0.012 0.148 -0.032
*** p<0.01, ** p<0.05, * p<0.1 1 .
2 ( ). 3∑ ( )
.
4 ∑ .