Embed Size (px)
Citation preview

4th International Conference on Earthquake Geotechnical Engineering
June 25-28, 2007 Paper No. 1188
ACCUMULATION OF RESIDUAL STRAINS IN SOFT ROCKS DURING IRREGULAR CYCLIC LOADING
Daniel PECKLEY Jr. 1 and Taro UCHIMURA2
ABSTRACT The accumulation of residual deformations in soft rocks due to irregular cyclic loading was simulated using a fatigue model from uniform amplitude cyclic loading tests. The results revealed that such simulation procedure may not be appropriate for these soft rocks, because it fails to take into account a softening behavior that is strongly correlated to the sum of the magnitudes of strain increment due to the preceding 2 half cycles, which is referred in this study as P2S. This behavior was found to be more prominent in irregular cyclic loading than in uniform amplitude cyclic loading. Keywords: soft rocks, cyclic loading, residual strains, softening, P2S effect
INTRODUCTION Cost-effective design is the primary motivation for adopting the performance-based design approach. This approach, however, requires that deformations be reliably estimated. While soft rocks are known to be competent foundation materials for large-scale structures, the deformation characteristics of this material when subjected to large cyclic loading still have to be understood. The forward calculations of the settlements of the piers of the Akashi-Kaikyo Bridge after the 1995 Kobe Earthquake carried out by Koseki et al. (2001) and Kashima et al. (2000) underscored this point. In these calculations, discrepancies between calculated and measured settlements ranged from a factor of at least 2.5 times (Koseki et al., 2001) to as much as 8 times (Kashima et al., 2000). In heavily populated metropolitan areas that are underlain by soft rock formations and are known to be seismically active like Tokyo, Japan (Tatsuoka et al., 2003) and Metro Manila, Philippines (Peckley and Uchimura, 2006a), to understand the deformation characteristics of soft rocks under cyclic loading is imperative. In Metro Manila’s case, almost 70% of the metropolis is directly underlain by the soft rock formation called the Guadalupe Tuff Formation (GTF). One boundary of this formation is an active fault that can generate an earthquake with a magnitude of 7.2 (Bautista, 2004). A paleoseismic study on the fault that was jointly conducted by the USGS and the Philippine Institute of Volcanology and Seismology or PHIVOLCS (Nelson et al., 2000) indicated a recurrence interval of 200-400 years for magnitude 6-7 earthquakes over the past 1500 years. Presented in this paper are results of triaxial cyclic loading tests conducted on soft rock samples obtained from the Guadalupe Tuff Formation in Metro Manila. One objective of these tests is to review the present procedure for estimating residual deformations due to irregular cyclic loading using a fatigue model from uniform amplitude cyclic loading tests.
1 PhD Student, Geotechnical Engineering Laboratory, University of Tokyo, Japan, Email: [email protected] 2 Associate Professor, Department of Civil Engineering, University of Tokyo, Japan, Email: [email protected]

FATIGUE MODELING FOR IRREGULAR CYCLIC LOADING OF SOFT ROCKS The basic assumption in fatigue modeling is that the accumulation of residual deformation due to an irregular cyclic loading history can be extrapolated from the evolution of deformations under a series of uniform amplitude cyclic loading tests. The use of fatigue models to evaluate the behavior of geomaterials due to irregular cyclic loading already has a long history and has been described in detail by a number researchers, among them are Ishihara and Yasuda (1975), Seed et al. (1975), Tatsuoka and Silver (1981), Allotey and El Naggar (2006). Thus, the reader is requested to refer to the works of these researchers for a more detailed treatment on the subject. For this specific research, the procedure described by Tatsuoka and Silver (1981) to develop a fatigue model is employed. Staged uniform cyclic loading (UCL) test results and fatigue modeling The GTF soft rock samples, which were tested for this study, were obtained from an excavation for the basement floors of a multi-story building now under construction in Fort Bonifacio, Taguig City, Metro Manila, Philippines. These were extracted by block sampling from a sandstone layer at a depth of around 12 meters from the existing ground elevation. The block samples were then packaged and shipped to the Geotechnical Engineering Laboratory of the University of Tokyo, Japan following the recommendations of ASTM D 5079-90 (ASTM, 2000) for critical care to minimize moisture loss and damage in the microstructure of the samples. The samples were cut and trimmed to L100mm x W60mm x H150mm nominal sizes using a rotary cutter. The unit weight of the samples was around 1.85g/cm3; moisture content was around 30%; and the mean diameter D50 was from 0.16mm to 0.25mm (after thorough crushing). The maximum deviator stress qmax of the samples at 200kPa confining pressure and at 1% monotonic loading rate is around 3,200kPa. In the tests, Local Deformation Transducers or LDTs (Goto et al., 1991) were used to measure longitudinal and lateral deformations. Two 120mm LDTs were used to measure longitudinal (axial) deformations and were attached on the 60mm-wide faces of the specimen. Six 70mm LDTs were used to measure lateral (horizontal) deformations and were arranged such that each of the 100mm-wide faces of the specimen had three of these LDTs. On each of these faces one LDT was placed at the specimen mid-height and the other two, 45mm above and below mid-height. The LDTs were attached to the specimen following the procedure described by Hayano et al. (2001). To measure longitudinal (axial) load, a 50KN-capacity load cell installed inside the triaxial cell was used to minimize errors due to friction along the loading shaft. Cyclic loading was applied using an oil-hydraulic loading system at the Koseki Laboratory of the Institute of Industrial Science (IIS), University of Tokyo. To simulate actual loading rates during earthquakes, loading frequencies between 0.3Hz and 1Hz were applied. Previous tests showed that loading rate has a significant effect on the accumulation of residual strains in soft rocks (Peckley and Uchimura, 2006a and 2006b). Prior to loading, each specimen was consolidated at an isotropic pressure of 200kPa, the estimated in-situ overburden pressure. The tests were unsaturated because the samples were taken above the water table, which was 20m below the existing ground surface. In the previous uniform amplitude cyclic loading tests that were performed on this material (Peckley and Uchimura, 2006a and 2006b), it was observed that the accumulation of residual strain is almost linear with the number of cycles applied, especially at higher loading amplitudes. Thus, for the tests that were conducted for this study, staged uniform cyclic loading with increasing amplitude for every loading stage was employed. The loading period was at T = 1s. Test results on two samples designated as GTF30 and GTF34 are shown in Figure 1. In coming up with a fatigue model from these results, the definitions presented in Figure 2 for residual strain ∆εar for one cycle, the amplitude qd and static condition q0 are used. Figure 3 presents the accumulation of residual strains with the number of cycles applied at certain load amplitude, which is presented in a non-dimensional form as stress ratio SR (See figure for definition of SR). As can be observed from the figure, residual deformations due to stress ratios below

0.5 are very small. It can also be inferred that the accumulation of residual strains is practically linear with the number of cycles applied (CN), but highly nonlinear with stress ratio SR. As shown, the fatigue model that was derived from these tests by nonlinear curve fitting reflects these observations. Note that given the linear relationship between residual strain accumulation and CN it is implicitly assumed that there is one-to-one correspondence between the increment in residual strain and SR. That is, when the fatigue model is differentiated with respect to CN, the increment in residual strain at every cycle number is a unique function of SR only.
0.0 0.5 1.0 1.5 2.0 2.5 3.00
500
1000
1500
2000
2500
3000
stage s
qd of stage s
Dev
iato
r stre
ss q
= σ
a-σ c (
kPa)
Axial strain (%)
σc = 200kPa
q0
0.0 0.5 1.0 1.5 2.0 2.5 3.00
500
1000
1500
2000
2500
3000
Dev
iato
r stre
ss q
= σ
a - σ c (k
Pa)
Axial strain (%)
σc = 200kPa
(b) (a)
Figure 1. Stress-strain curves from staged uniform amplitude cyclic loading (UCL) of soft rocks:
(a) sample GTF 30 and (b) sample GTF34
268761.5 268762.00
500
1000
1500
2000
2500
3000
0.8
0.9
1.0
1.1
1.2
1.3
q0
qd
Axi
al s
train
(%)
q (k
Pa)
Time(s)
q time history
∆εar
strain time history
Figure 2. Definition of residual strain ∆εar in one cycle of loading
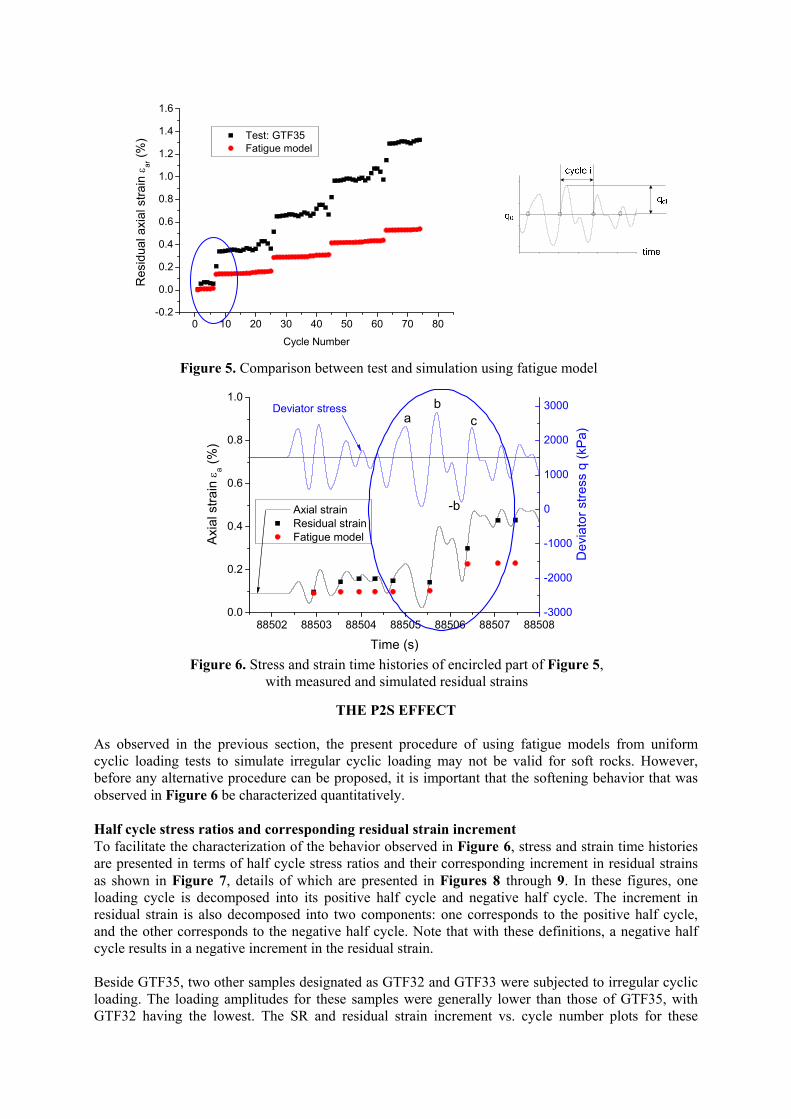
Simulation of irregular cyclic loading test using fatigue model Figure 4 shows the irregular cyclic loading (stress) time history that was applied on another sample designated as GTF35. The amplitude spectrum of this loading history is a narrow band between 1Hz and 3Hz. Also shown is the measured axial strain time history due to this loading. The accumulation of residual strain for every cycle is presented in Figure 5. Note that for this study one cycle in an irregular cyclic loading history is defined as shown in the inset figure. The stress ratio SR for one cycle ‘i’ is calculated using the amplitude of the positive half-cycle ‘qdi’. Also shown in Figure 5 is the simulated accumulation of residual strain using the fatigue model in Figure 3. While the trend in the accumulation of residual strain is similar to the test data, the discrepancy between simulation results and test data is quantitatively quite significant.

0 5 1015
2025
30
0.0
0.2
0.4
0.6
0.8
1.0
0.00.2
0.40.6
0.81.0
Tests: GTF30, GTF31, GTF34 Fatigue model: εar = k (1-elSR) CN SR(m+nSR)
Res
idua
l axi
al s
train
εar(%
)
Stress
ratio SRCycle Number CN
Fatigue Model εar = k (1- elSR) CN SR(m + nSR) where k = 1.23, l = -5.50 m = 1.81, n = 14.85 all of which determined by nonlinear curve fitting.
Note: qmax is the maximum deviator stress
obtained from monotonic loading test.
Figure 3. Fatigue model from staged uniform amplitude cyclic loading of GTF30, GTF31 and GTF34
An attempt to accohistories of the enstrains, are shown.the increase or incand ‘-b’ is reasonaalso be observed corresponding incrimplicit assumptioand provides a clue
88500 88510 88520 88530 885400
1000
2000
3000
88500 88510 88520 88530 885400.0
0.5
1.0
1.5
Dev
iato
r stre
ss q
(kP
a)A
xial
stra
in ε
a (%)
Time (s)
σc = 200kPa
Figure 4. GTF 35 stress and strain time histories
unt for the discrepancy is presented in Figure 6. In this figure, the stress and time circled portion of Figure 5, together with the measured and simulated residual
Referring to the half cycles indicated as ‘a’, ‘b’ and ‘c’, one can observe that while rement in the residual strain due to the loading cycle composed of half cycles ‘b’ bly simulated, the increment in residual strain due to the next cycle is not. It can that while the amplitudes of half cycles ‘a’ and ‘c’ are almost the same, the ements in residual strain are not at all the same. This observation undermines the n that there is one-to-one correspondence between residual strain increment and SR that behavior should be analyzed in terms of half-cycle stress and strain increment.
0 10 20 30 40 50 60 70 80-0.2
0.0
0.2
0.4
0.6
0.8
1.0
1.2
1.4
1.6
Test: GTF35 Fatigue model
Res
idua
l axi
al s
train
εar (%
)
Cycle Number
Figure 5. Comparison between test and simulation using fatigue model
88502 88503 88504 88505 88506 88507 885080.0
0.2
0.4
0.6
0.8
1.0
-3000
-2000
-1000
0
1000
2000
3000c
-b
ba
Dev
iato
r stre
ss q
(kP
a)
Axi
al s
train
εa (
%)
Time (s)
Axial strain Residual strain Fatigue model
Deviator stress
Figure 6. Stress and strain time histories of encircled part of Figure 5,
with measured and simulated residual strains
THE P2S EFFECT As observed in the previous section, the present procedure of using fatigue models from uniform cyclic loading tests to simulate irregular cyclic loading may not be valid for soft rocks. However, before any alternative procedure can be proposed, it is important that the softening behavior that was observed in Figure 6 be characterized quantitatively. Half cycle stress ratios and corresponding residual strain increment To facilitate the characterization of the behavior observed in Figure 6, stress and strain time histories are presented in terms of half cycle stress ratios and their corresponding increment in residual strains as shown in Figure 7, details of which are presented in Figures 8 through 9. In these figures, one loading cycle is decomposed into its positive half cycle and negative half cycle. The increment in residual strain is also decomposed into two components: one corresponds to the positive half cycle, and the other corresponds to the negative half cycle. Note that with these definitions, a negative half cycle results in a negative increment in the residual strain. Beside GTF35, two other samples designated as GTF32 and GTF33 were subjected to irregular cyclic loading. The loading amplitudes for these samples were generally lower than those of GTF35, with GTF32 having the lowest. The SR and residual strain increment vs. cycle number plots for these

samples are shown in Figures 10 to 12, with Figure 10 showing the entire loading history of GTF33 and Figure 12, that of GTF32.
0 10 20 30 40 50 60 70-1.0-0.8-0.6-0.4-0.20.00.20.40.60.81.0
-0.4
-0.3
-0.2
-0.1
0.0
0.1
0.2
0.3
0.4
Incr
emen
t in
resi
dual
axi
al s
train
∆ε ar
(%)
Stre
ss ra
tio S
R
Cycle Number
SR ∆εar
3 4 5 6 7 8 9 10 11 12 13-1.0-0.8-0.6-0.4-0.20.00.20.40.60.81.0
-0.4
-0.3
-0.2
-0.1
0.0
0.1
0.2
0.3
0.4
Incr
emen
t in
resi
dual
axi
al s
train
∆ε ar
(%)
Stre
ss ra
tio S
R
Cycle Number
SR ∆εar
15 16 17 18 19 20 21 22 23 24 25-1.0-0.8-0.6-0.4-0.20.0
0.20.40.60.81.0
-0.4
-0.3
-0.2
-0.1
0.0
0.1
0.2
0.3
0.4
Incr
emen
t in
resi
dual
axi
al s
train
∆ε ar
(%)
Stre
ss ra
tio S
R
Cycle Number
SR ∆εar
-b
cb
a
Figure 9. GTF35 stress ratio SR and increment in residual strain ∆εar for every half-cycle:
CN15 to CN 25
-b
cb
a
Figure 8. GTF35 stress ratio SR and increment in residual strain ∆εar for every half-cycle:
CN3 to CN 13
Figure 7. GTF 35 stress ratio SR and increment in residual strain ∆εar for every half-cycle, encircled
portion correspond to Figure 5.

0 10 20 30 40 50 60 70-1.0-0.8-0.6-0.4-0.20.0
0.20.40.60.81.0
-0.10-0.08-0.06-0.04-0.020.00
0.020.040.060.080.10
Incr
emen
t in
resi
dual
axi
al s
train
∆ε ar
(%)
Stre
ss ra
tio S
R
Cycle Number
SR ∆εar
σc = 200kPa
0 5 10 15 20 25 30 35 40-1.0-0.8-0.6-0.4-0.20.0
0.20.40.60.81.0
-0.08
-0.06
-0.04
-0.02
0.00
0.02
0.04
0.06
0.08
Incr
emen
t in
resi
dual
axi
al s
train
∆ε ar
(%)
Stre
ss ra
tio S
R
Cycle Number
SR
σc = 200kPa
∆εar
13 14 15 16 17 18 19 20 21 22 23-1.0-0.8-0.6-0.4-0.20.0
0.20.40.60.81.0
-0.10-0.08-0.06-0.04-0.020.00
0.020.040.060.080.10
Incr
emen
t in
resi
dual
axi
al s
train
∆ε ar
(%)
Stre
ss ra
tio S
R
Cycle Number
SR ∆εar
-b
cb
a
cb
a
Figure 11. GTF33 stress ratio SR and increment in residual strain ∆εar for every half-cycle:
CN13 to CN 23
Figure 12. GTF32 stress ratio SR and increment in residual strain ∆εar for every half-cycle
Figure 10. GTF 33 stress ratio SR and increment in residual strain ∆εar for every half-cycle

Referring to Figures 7 to 12, it can be observed that there is indeed no one-to-one correspondence between SR and residual strain increment. The trend that the higher the stress ratio SR, the higher the increment in residual strain ∆εar, is not necessarily true for this material. In Figure 9, for example, the trend in terms of SR for half cycles ‘a’, ‘b’ and ‘c’ is high-low-high, but for their corresponding ∆εar, the trend is small-large-larger. The behavior just described was also observed with oven-dried natural soft rock samples and artificial soft rock samples (Peckley and Uchimura, 2006b). The tests conducted on these samples shall be reported later. Relationships between residual strain increment and other stress-strain parameters To identify the parameter or parameters with which the increment in residual strain is most strongly linked, all half cycles in which the one-to-one correspondence between SR and residual strain increment clearly do not hold true in the time histories of GTF35, GTF33 and GTF32, such as those shown in Figures 8, 9 and 11, were identified. In a series of 3 cycles, these half cycles were designated as ‘c’, as illustrated in these figures. Residual strain increments due to these half cycles were then plotted vs. the current and previous SR parameters, and vs. previous residual strain increments, as shown in Figures 13 to 16.
0.1 0.2 0.3 0.4 0.5 0.6 0.7
0.00
0.02
0.04
0.06
0.08
0.10
0.12
0.14
0.16
SRc/(Srb-Sr-b)
GTF35 GTF33 GTF32
Res
idua
l stra
in in
crem
ent ∆
earc (%
)du
e to
hal
f cyc
le 'c
'
Figure 14. Increment in residual strain due to half-cycle ‘c’ ∆εarc
vs. the ratio (half cycle SRc / (half cycle SRb – half cycle SR-b)
0.1 0.2 0.3 0.4 0.5 0.6 0.7
0.00
0.02
0.04
0.06
0.08
0.10
0.12
0.14
0.16 GTF35 GTF33 GTF32
Res
idua
l stra
in in
crem
ent ∆
earc (%
)du
e to
hal
f cyc
le 'c
'
Stress ratio SRc of half cycle 'c'
Figure 13. Increment in residual strain ∆εarc due to half cycle ‘c’ vs. stress ratio SRc (refer to Figures 5, 8, 9 and 11 for the definition of half pulse ‘a’, ‘b’, ‘-b’ and ‘c’)

0.6 0.7 0.8 0.9 1.0 1.1 1.2 1.3 1.4 1.5 1.6 1.7 1.8
0.00
0.02
0.04
0.06
0.08
0.10
0.12
0.14
0.16
ISrbI + ISr-bI
GTF35 GTF33 GTF32
Res
idua
l stra
in in
crem
ent ∆
earc (%
)du
e to
hal
f cyc
le 'c
'
Figure 15. Increment in residual strain ∆εarc due to half cycle ‘c’
vs. the sum of the two preceding stress ratios
0.0 0.1 0.2 0.3 0.4
0.00
0.02
0.04
0.06
0.08
0.10
0.12
0.14
0.16
P2S = l∆εarbl + l∆εar-bl
GTF35 GTF33 GTF32
Res
idua
l stra
in in
crem
ent ∆
earc (%
)du
e to
hal
f cyc
le 'c
'
Figure 16. Increment in residual strain due to half-cycle ‘c’ ∆εarc vs. P2S = ∣ ∆εarb∣ + ∣ ∆εar-b∣
0.01 0.1
10
P2S = l∆εarj-1l + l∆εarj-2l
GTF35 GTF33 GTF32
S
RI c =
SR
c / ∆ ea
rc
Figure 17. SRI modulus vs. P2S from irregular cyclic loading tests
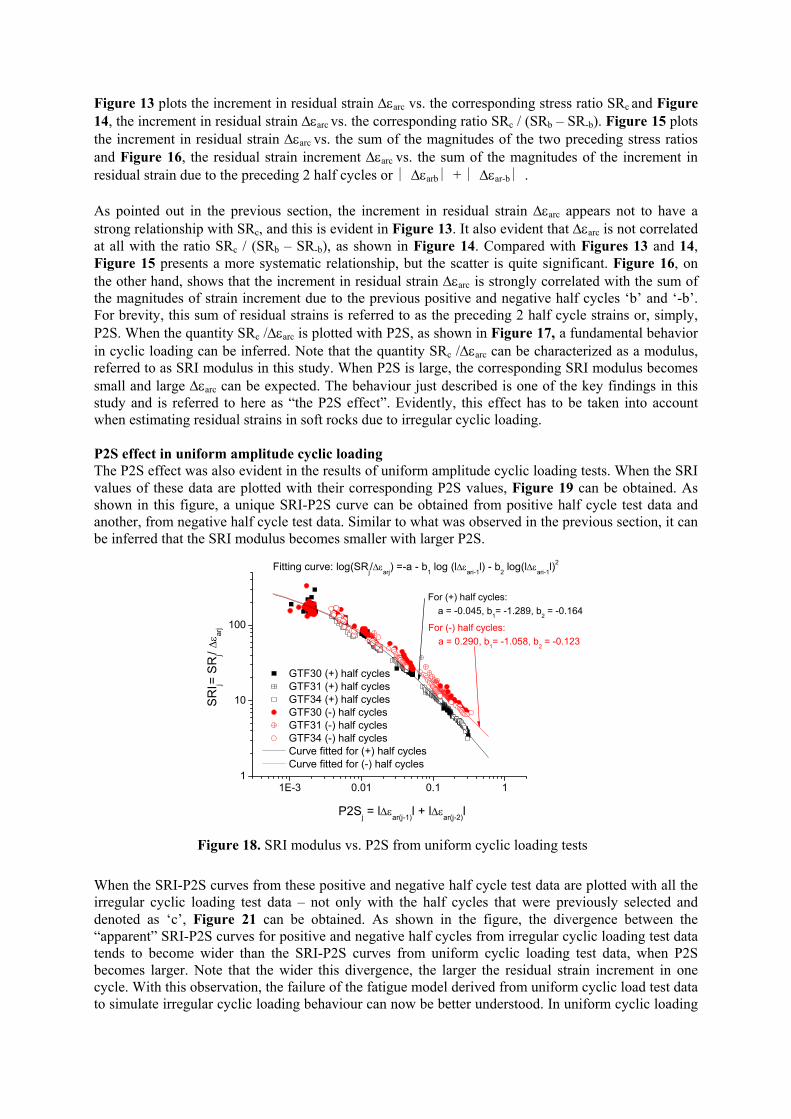
Figure 13 plots the increment in residual strain ∆εarc vs. the corresponding stress ratio SRc and Figure 14, the increment in residual strain ∆εarc vs. the corresponding ratio SRc / (SRb – SR-b). Figure 15 plots the increment in residual strain ∆εarc vs. the sum of the magnitudes of the two preceding stress ratios and Figure 16, the residual strain increment ∆εarc vs. the sum of the magnitudes of the increment in residual strain due to the preceding 2 half cycles or ∣ ∆εarb∣ + ∣ ∆εar-b∣ . As pointed out in the previous section, the increment in residual strain ∆εarc appears not to have a strong relationship with SRc, and this is evident in Figure 13. It also evident that ∆εarc is not correlated at all with the ratio SRc / (SRb – SR-b), as shown in Figure 14. Compared with Figures 13 and 14, Figure 15 presents a more systematic relationship, but the scatter is quite significant. Figure 16, on the other hand, shows that the increment in residual strain ∆εarc is strongly correlated with the sum of the magnitudes of strain increment due to the previous positive and negative half cycles ‘b’ and ‘-b’. For brevity, this sum of residual strains is referred to as the preceding 2 half cycle strains or, simply, P2S. When the quantity SRc /∆εarc is plotted with P2S, as shown in Figure 17, a fundamental behavior in cyclic loading can be inferred. Note that the quantity SRc /∆εarc can be characterized as a modulus, referred to as SRI modulus in this study. When P2S is large, the corresponding SRI modulus becomes small and large ∆εarc can be expected. The behaviour just described is one of the key findings in this study and is referred to here as “the P2S effect”. Evidently, this effect has to be taken into account when estimating residual strains in soft rocks due to irregular cyclic loading. P2S effect in uniform amplitude cyclic loading The P2S effect was also evident in the results of uniform amplitude cyclic loading tests. When the SRI values of these data are plotted with their corresponding P2S values, Figure 19 can be obtained. As shown in this figure, a unique SRI-P2S curve can be obtained from positive half cycle test data and another, from negative half cycle test data. Similar to what was observed in the previous section, it can be inferred that the SRI modulus becomes smaller with larger P2S.
1E-3 0.01 0.1 11
10
100
Fitting curve: log(SRj/∆εarj) =-a - b1 log (l∆εari-1l) - b2 log(l∆εari-1l)2
GTF30 (+) half cycles GTF31 (+) half cycles GTF34 (+) half cycles GTF30 (-) half cycles GTF31 (-) half cycles GTF34 (-) half cycles Curve fitted for (+) half cycles Curve fitted for (-) half cycles
SR
I j= S
Rj/ ∆
ε arj
P2Sj = l∆εar(j-1)l + l∆εar(j-2)l
For (-) half cycles:a = 0.290, b
1= -1.058, b
2 = -0.123
For (+) half cycles:a = -0.045, b1= -1.289, b2 = -0.164
Figure 18. SRI modulus vs. P2S from uniform cyclic loading tests When the SRI-P2S curves from these positive and negative half cycle test data are plotted with all the irregular cyclic loading test data – not only with the half cycles that were previously selected and denoted as ‘c’, Figure 21 can be obtained. As shown in the figure, the divergence between the “apparent” SRI-P2S curves for positive and negative half cycles from irregular cyclic loading test data tends to become wider than the SRI-P2S curves from uniform cyclic loading test data, when P2S becomes larger. Note that the wider this divergence, the larger the residual strain increment in one cycle. With this observation, the failure of the fatigue model derived from uniform cyclic load test data to simulate irregular cyclic loading behaviour can now be better understood. In uniform cyclic loading

the divergence between SRI-P2S curves is less pronounced than in irregular cyclic loading. Evidently, the P2S effect is more prominent in irregular cyclic loading than in uniform cyclic loading.
1E-3 0.01 0.1 1 100.01
0.1
1
10
100
1000 Uniform (+) half cycles Uniform (-) half cycles
Irregular (-) half cycles: GTF35 (-) half cycles GTF33 (-) half cycles GTF32 (-) half cycles apparent trend
Irregular (+) half cycles: GTF35 (+) half cycles GTF33 (+) half cycles GTF33 (+) half cycles apparent trend
SR
I j = S
Rj/ ∆
ε arj
P2Sj = l∆εar(j-1)l + l∆εar(j-2)l Figure 19. SRI-P2S plot of uniform cyclic loading test data
and all irregular cyclic loading test data
One important implication of the above observation is that soft rock testing programs should not be limited only to uniform cyclic loading tests. Irregular cyclic loading tests are as, if not more, important as uniform cyclic loading tests. From the data analyses that have been presented so far, it can also be argued that the use of half cycle stress ratio and corresponding increment in residual strain can be a convenient and better approach in analyzing softening behavior especially in irregular cyclic loading behavior. Another specific reason why the fatigue model failed to simulate irregular cyclic loading behavior is that by defining residual strain as the strain increment due to a full cycle of loading, the softening behaviour in irregular cyclic loading, in which the P2S effect plays a prominent role, was not fully taken into account.
SUMMARY AND CONCLUSIONS The accumulation of residual deformations in soft rocks due to irregular cyclic loading was simulated using a fatigue model from uniform amplitude cyclic loading tests. The results, however, poorly simulated the test data. To account for the discrepancy between the simulation and test results, a detailed analysis of the irregular stress and strain time histories in terms of half cycle stress ratios and their corresponding increment in residual strains was performed. The analysis results revealed that in irregular cyclic loading the increment in residual strain is strongly correlated with the parameter referred to here as P2S, which is defined as the sum of the magnitudes of residual strain increments due to the preceding positive and negative half cycles of loading. When P2S is large, a large residual strain increment can be expected. The effect of P2S was also evident uniform cyclic loading; however, this effect was observed to be more subdued than in irregular cyclic loading. In other words, the P2S effect is more prominent in irregular cyclic loading. One important implication of this finding is that soft rock testing programs should not be limited only to uniform cyclic loading tests. Irregular cyclic loading tests are as, if not more, important as uniform cyclic loading tests. One reason the fatigue model that was derived from uniform cyclic loading tests failed to simulate irregular cyclic loading behavior is that by defining residual strain as the strain increment due to a full cycle of loading, the softening behaviour in irregular cyclic loading, in which the P2S effect plays a prominent role, was not fully taken into account.
ACKNOWLEDGMENTS
The present research has been made possible through a scholarship grant that was awarded to the first author by the Japan Ministry of Education, Culture, Sport, Science, and Technology (MEXT). The authors are also grateful for the assistance of Engr. Wilson A. Sy of Aromin & Sy + Associates, Inc. in obtaining GTF soft rock samples from Fort Bonifacio, Metro Manila. Special appreciation is also extended to Prof. Junichi Koseki for allowing the authors to use the sample preparation equipment and oil hydraulic testing apparatus at the Koseki Laboratory, IIS, University of Tokyo.
REFERENCES Allotey, N. and El Naggar, M.H. Cyclic soil degradation/hardening models: A critique, Proc. 2005
International Conference on Soil Mechanics and Geotechnical Engineering, Osaka, Japan, 785-790, 2005
ASTM, D 5079-90. Standard Practices for Preserving and Transporting Rock Core Samples, Annual Book of ASTM Standards, Vol. 04.08 Soil and Rock, 971-976, 2000.
Bautista, M. P. Overview of the MMEIRS Project. www.phivolcs.dost.gov.ph/clarification/ Leyo's Letter.pdf, 2004
Goto, S., Tatsuoka, F., Shibuya, S., Kim, Y. S., and Sato, T. A simple gauge for local small strain measurements in the laboratory, Soils and Foundations, 31 (1), 169-180, 1991.
Hayano, K., Matsumoto, M., Tatsuoka, F. and Koseki, J. Evaluation of Time-dependent Deformation Properties of Sedimentary Soft Rock and their Constitutive Modeling, Soils and Foundations, 41 (2), 21-38, 2001.
Ishihara, K. and Yasuda, S. Undrained deformation and liquefaction of sand under cyclic stresses, Soils and Foundations, 15 (1), 45-59, 1975.
Kashima, N., Fukunaga, S., Saeki, M., and Koseki, J. Study on procedures to estimate earthquake-induced residual settlement of large scale bridge foundations (part 2), Proc. 55th Annual Conference of Japan Society of Civil Engineers, Section 1, 2000. (in Japanese)
Koseki, J., Moritani, T., Fukunaga, S., Tatsuoka, F. and Saeki, M. Analysis on Seismic Performance of Foundation for Akashi Kaikyo Bridge, Proc. 2nd Int. Symposium Pre-failure Deformation Characteristics of Geomaterials (Jamiolowski et al. eds), Balkema, 1405-1412, 2001.
Nelson, A. R., Personius, S. F., Rimando, R. E., Punongbayan, R. S., Tuñgol, N., Mirabueno, H. and Rasdas, A. Multiple large earthquakes in the past 1500 years on a fault in metropolitan Manila, The Philippines. Bulletin of Seismological Society of America, 90, 73-85, 2000.
Peckley, D. C. and Uchimura, T. Strength and Deformation Characteristics of Soft Rocks from the Guadalupe Tuff Formation in Metro Manila when Subjected to Large Cyclic Loading. Proc. 3rd International Conference on Urban Earthquake Engineering , Tokyo Institute of Technology, Japan, 2006a.
Peckley, D. C. and Uchimura, T. Rate effects on deformation characteristics of soft rocks under large cyclic loading. Proc. 1st European Conference on Earthquake Engineering and Seismology, Geneva, Switzerland, 2006b.
Seed, H. B., Idriss, I.M., Makdisi, F. and Banerjee, N. Representation of irregular stress time histories by equivalent uniform stress series in liquefaction analysis, Report No. EERC 75-29, Univ. of California, EERC, Berkeley, 1975.
Tatsuoka, F. and Silver, M. Undrained stress-strain behavior of sand under irregular loading, Soils and Foundation, 21 (1), 51-66, 1981.
Tatsuoka, F., Hayano, K. Koseki, J. Strength and Deformation Characteristics of Sedimentary Soft Rocks in the Tokyo Metropolitan Area, Characterization and Engineering Properties of Natural Soils (Tan et al. eds), Swets and Zeitlinger, 1461-1525, 2003.