Embed Size (px)
Citation preview

Ten-YearFinancial Plan
Nondepartmental
1
2019/20 through 2028/29 Ten-Year Financial Plan
June 2018
ABOUT THIS REPORT
The purpose of the Ten-Year Financial Plan (Plan) is to provide policy-makers and the public an updated assessment of the City’s fiscal health that takes into account the latest economic developments. The report includes historical perspective on revenues and expenditures and a ten-year financial outlook beyond the adopted budget year. The value of this type of analysis is to give the City Council, staff, and the public a tool to assist with strategic decision-making as they work to adopt the budget for the coming year. The Plan is a collaborative effort between the City Manager’s Office, Finance Department, and City departments. Individual projections of revenues and expenditures are developed based on trend analyses, input from available economic reports, consultant recommendations (e.g., our sales tax consultant MuniServices and property tax consultant HdL), and input from other subject matter experts. The most current information available is incorporated into the Plan and refined on a moving forward basis as part of the City’s commitment to fiscal responsibility. EXECUTIVE SUMMARY
The combination of an improved economy, careful management of limited resources, development and redevelopment projects happening throughout the City, and monies flowing to the City from events at Levi’s Stadium have generated General Fund budget surpluses the last several years which have allowed the City to fully fund its Budget Stabilization Reserve (formerly Working Capital Reserve), make additional contributions to the Capital Projects Reserve, which funded an increase in capital project funding, and allocate funding to the recently established Pension Trust Program to pre-fund pension obligations. Looking to fiscal year 2018/19 and beyond, the City is projecting that the regional economy will continue to grow at a moderate rate. However, due to rising pension costs it is projected that the City’s expenditures will begin to outpace revenues in the next ten years. As with any multi-year forecast, the accuracy of the results are only as good as the assumptions upon which they are based. While this Plan has been based on the primary assumption that the economy will continue to grow at a moderate rate, an appropriate amount of conservatism has been built into the projections given the typical amount of economic volatility in the local and regional economies. For example, although there are several large development projects currently under review that are likely to begin construction in the next couple of years, the forecast does not include the likely positive impact that these projects will have on General Fund tax collections.
2
ECONOMIC OUTLOOK
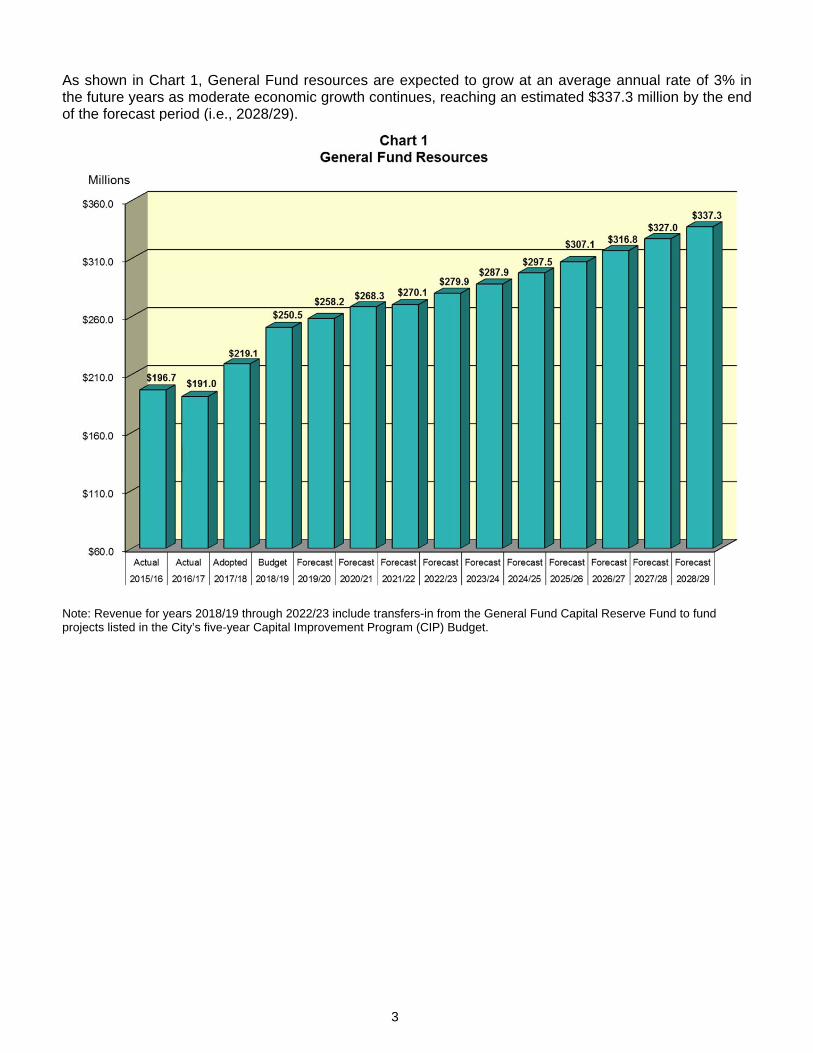
Summing up Silicon Valley’s economy and community is not an easy task. On the positive side, Santa Clara has experienced strong revenue growth and development activity. Unemployment is at a historic low with job growth outpacing the rest of the state and the nation, with mixed opinions on the result of rising housing prices and a significant increase in commercial and residential development activity. Looking to 2018/19 and beyond, the City is projecting that the regional economy will continue to grow. However a word of caution, the probability of a change to the local economy resulting in an economic slowdown, or another recession, increases as this growth continues. The U.S. Economy is in its ninth consecutive year of expansion and most economists believe that the economic recovery will continue for the next few years. The Department of Commerce records show that the nation’s Gross Domestic Product (GDP), the broadest measure of economic activity, has continued to rise over the last four years. In addition soaring consumer confidence, a healthy job market and improving retail sales are giving the U.S. economy a further boost. Over the last five years, job growth picked up significantly and unemployment rates have continued to decline to more healthy levels, particularly in Silicon Valley. According to data from the Bureau of Labor Statistics, the national unemployment rate peaked at 10.0% in October 2009, the first time the rate had been at 10% or above since 1983. Over the last 12 months, the U.S. unemployment rate has declined from 4.4% in April 2017 to 3.8% in May 2018. California’s economy is projected to remain strong with continued job growth, pressure to raise salaries and hourly rates of pay, and a robust technology industry. The Employment Development Department reported California’s unemployment rate rose past the 10% level in February 2009, reached a peak of 12.4% in early 2010, and began declining in late 2010. In the last year, the California unemployment rate declined from 5.2% in March 2017 to 4.3% in March 2018. Santa Clara County’s and the City of Santa Clara’s experience over the last year have been similar with March unemployment rates declining from 3.4% to 2.6% and 2.7% to 2.5%, respectively. CITY OF SANTA CLARA’S GENERAL FUND Total General Fund resources are estimated at $250.5 million in 2018/19, representing an increase of $31.4 million or 14.3% when compared to the adopted 2017/18 budget (see Chart 1). The primary reason for this increase is due to a restructuring in budgeting the way transfers are shown in the 2018/19 budget; previously transfers were shown as net transfers in the revenue section of the budget. This budget reflects transfers-in as a revenue and transfers-out as an expenditure. In addition, there were increases in Property Tax, due to rising home prices and in Contribution In-Lieu of Taxes received from Silicon Valley Power based on projected increases in customer service charges for electric usage.
3
As shown in Chart 1, General Fund resources are expected to grow at an average annual rate of 3% in the future years as moderate economic growth continues, reaching an estimated $337.3 million by the end of the forecast period (i.e., 2028/29).
Note: Revenue for years 2018/19 through 2022/23 include transfers-in from the General Fund Capital Reserve Fund to fund projects listed in the City’s five-year Capital Improvement Program (CIP) Budget.
4
Sources of General Fund Revenues
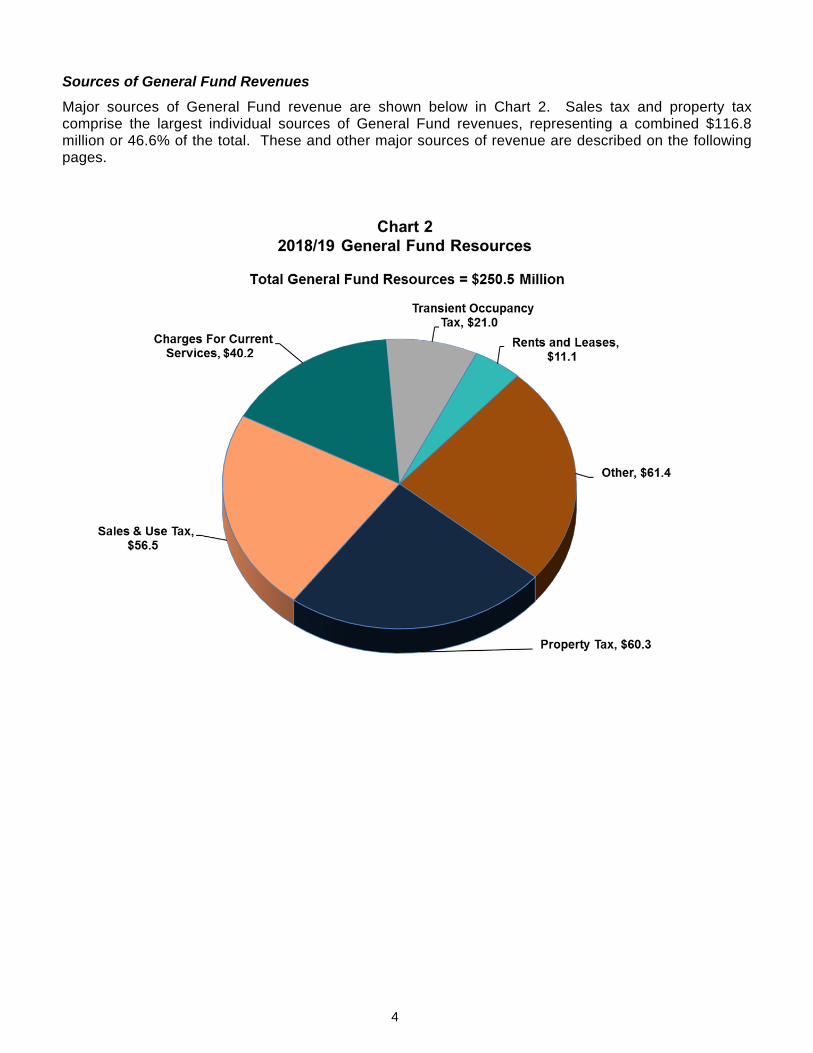
Major sources of General Fund revenue are shown below in Chart 2. Sales tax and property tax comprise the largest individual sources of General Fund revenues, representing a combined $116.8 million or 46.6% of the total. These and other major sources of revenue are described on the following pages.
5
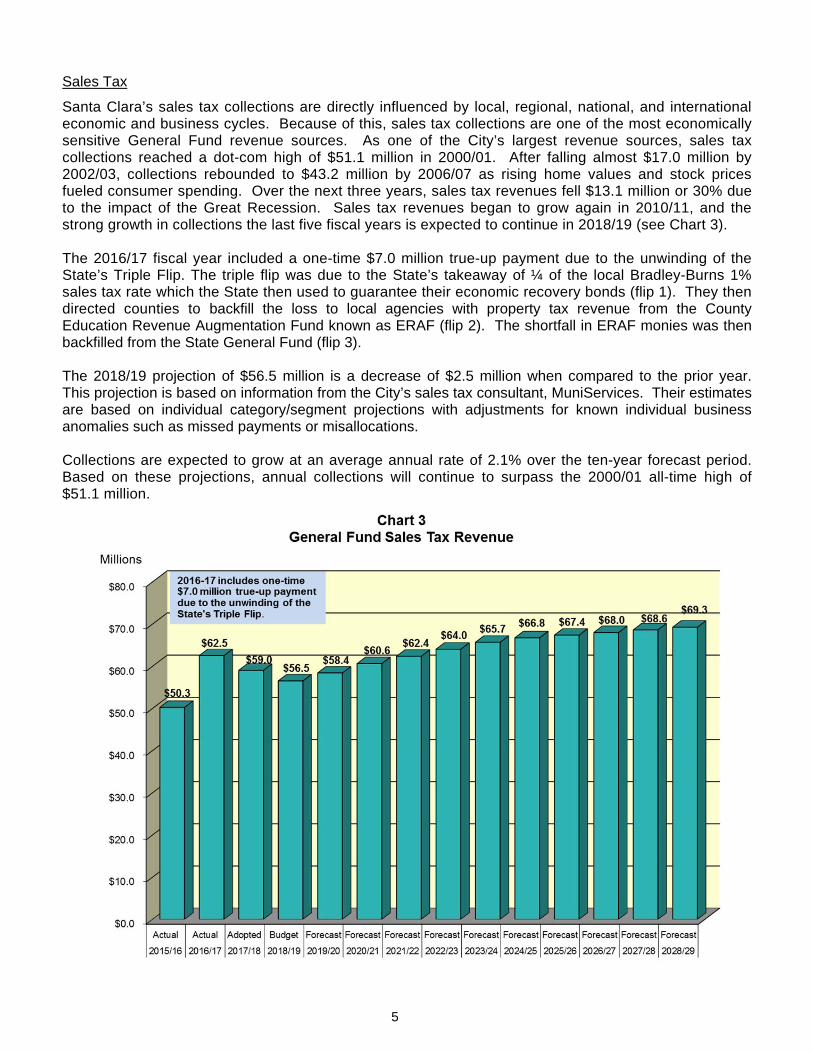
Sales Tax
Santa Clara’s sales tax collections are directly influenced by local, regional, national, and international economic and business cycles. Because of this, sales tax collections are one of the most economically sensitive General Fund revenue sources. As one of the City’s largest revenue sources, sales tax collections reached a dot-com high of $51.1 million in 2000/01. After falling almost $17.0 million by 2002/03, collections rebounded to $43.2 million by 2006/07 as rising home values and stock prices fueled consumer spending. Over the next three years, sales tax revenues fell $13.1 million or 30% due to the impact of the Great Recession. Sales tax revenues began to grow again in 2010/11, and the strong growth in collections the last five fiscal years is expected to continue in 2018/19 (see Chart 3). The 2016/17 fiscal year included a one-time $7.0 million true-up payment due to the unwinding of the State’s Triple Flip. The triple flip was due to the State’s takeaway of ¼ of the local Bradley-Burns 1% sales tax rate which the State then used to guarantee their economic recovery bonds (flip 1). They then directed counties to backfill the loss to local agencies with property tax revenue from the County Education Revenue Augmentation Fund known as ERAF (flip 2). The shortfall in ERAF monies was then backfilled from the State General Fund (flip 3). The 2018/19 projection of $56.5 million is a decrease of $2.5 million when compared to the prior year. This projection is based on information from the City’s sales tax consultant, MuniServices. Their estimates are based on individual category/segment projections with adjustments for known individual business anomalies such as missed payments or misallocations. Collections are expected to grow at an average annual rate of 2.1% over the ten-year forecast period. Based on these projections, annual collections will continue to surpass the 2000/01 all-time high of $51.1 million.
6
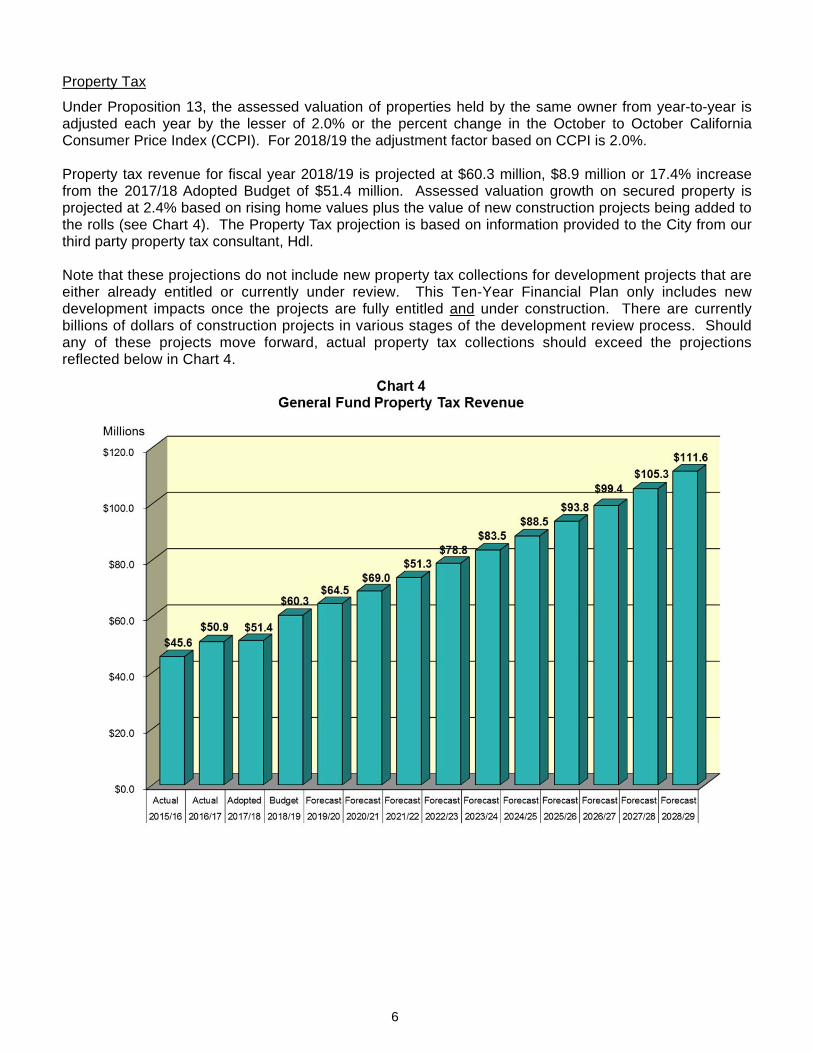
Property Tax
Under Proposition 13, the assessed valuation of properties held by the same owner from year-to-year is adjusted each year by the lesser of 2.0% or the percent change in the October to October California Consumer Price Index (CCPI). For 2018/19 the adjustment factor based on CCPI is 2.0%. Property tax revenue for fiscal year 2018/19 is projected at $60.3 million, $8.9 million or 17.4% increase from the 2017/18 Adopted Budget of $51.4 million. Assessed valuation growth on secured property is projected at 2.4% based on rising home values plus the value of new construction projects being added to the rolls (see Chart 4). The Property Tax projection is based on information provided to the City from our third party property tax consultant, Hdl. Note that these projections do not include new property tax collections for development projects that are either already entitled or currently under review. This Ten-Year Financial Plan only includes new development impacts once the projects are fully entitled and under construction. There are currently billions of dollars of construction projects in various stages of the development review process. Should any of these projects move forward, actual property tax collections should exceed the projections reflected below in Chart 4.

7
Transient Occupancy Tax
Transient Occupancy Tax (TOT), also known as hotel/motel tax, is another key revenue source for the General Fund. As with sales tax, TOT is sensitive to business cycles and therefore prone to volatility. After reaching a pre-recession peak of $11.3 million in 2007/08, this revenue source fell to $8.1 million in 2009/10. Collections began to grow again in 2010/11 due to the combination of higher occupancy levels and increases in the average daily rate (ADR) and strong growth occurred each year through 2017/18 with year-end collections expected to reach over $20.0 million (influenced by high weekday demand from tech companies, Convention and Visitors Bureau bookings, and Levi’s Stadium events). Transient Occupancy Tax (TOT) is calculated as a percentage of City hotel/motel room charges. The City's current TOT rate is 9.5%. This revenue stream is extremely sensitive to changes in economic conditions and can vary greatly from year-to-year based on occupancy and room rates. TOT revenue is budgeted to remain relatively flat at $21.0 million for 2018/19; this is slightly above the 2017/18 Adopted Budget of $20.6 million (see Chart 5). The forecast model projects that future TOT collections will grow at a rate of 3.2% per year from 2018/19 through the end of the Plan horizon in 2028/29. Although new hotels have been proposed in the Stadium area, they will not be included in the forecast until they start construction.

8
Charges for Current Services
Charges for Current Services are estimated at $40.2 million in 2018/19, down by $1.1 million or 2.7% over the 2017/18 budget of $41.3 million. This decrease is primarily due to moving Fire prevention fee revenue from Charges for Current Services to Business Tax revenue to accurately reflect the correct revenue category. Major sources of revenue within this category include charges for services provided to outside entities and other funds, such as the City’s utility enterprise funds of ($18.9 million), HazMat charges ($2.9 million), planning and engineering fees ($8.0 million), and various other customer service fees. The amount charged to outside entities and other funds also includes $5.7 million to reimburse the General Fund for stadium-related services provided to the San Francisco 49ers and the Santa Clara Stadium Authority. Contribution In-Lieu of Taxes
In accordance with the City’s charter, Silicon Valley Power pays 5.0% of gross revenues to the General Fund as contribution-in-lieu of taxes (CLT). For 2018/19, CLT is projected to total $23.1 million. The forecast is that CLT will increase to $33.9 million by the end of the forecast period. The forecast is primarily driven by market projections for electric consumption and any rate increases assumed in the Electric Ten-Year Financial Plan. Rents and Leases
In 2018/19, revenue recorded as Rents and Leases is estimated to total $11.1 million. The amount projected for 2018/19 includes the ground lease with the Santa Clara Stadium Authority for the Levi’s Stadium site (includes ground rent and performance rent totaling $3.0 million), right-of-way rental fees charged to the water and sewer utilities ($3.3 million), and other smaller leases ($4.6 million). Growth projections for the Ten-Year Financial Plan are based on individual lease agreements.
Interest Income
The City invests all funds not needed for current cash requirements in accordance with the City Council approved Investment Policy. These funds are invested in securities having a maximum maturity of five years. The factors that directly influence General Fund interest income include prevailing interest rates, the size of the portfolio, and the relative percentage of the portfolio allocated to the General Fund. Over the last several fiscal years, the return on the City’s portfolio declined from 4.92% in 2005/06 to a low of 0.68% in August 2014. These declines are primarily due to the extraordinary actions by the Federal Reserve to hold interest rates low. The City’s portfolio return has increased over the last year with the April 2018 earnings return at 1.55%. Based on the expectation that the Federal Reserve will gradually increase interest rates over the next couple of years, the General Fund is expected to receive $4.0 million in interest in 2018/19.
9
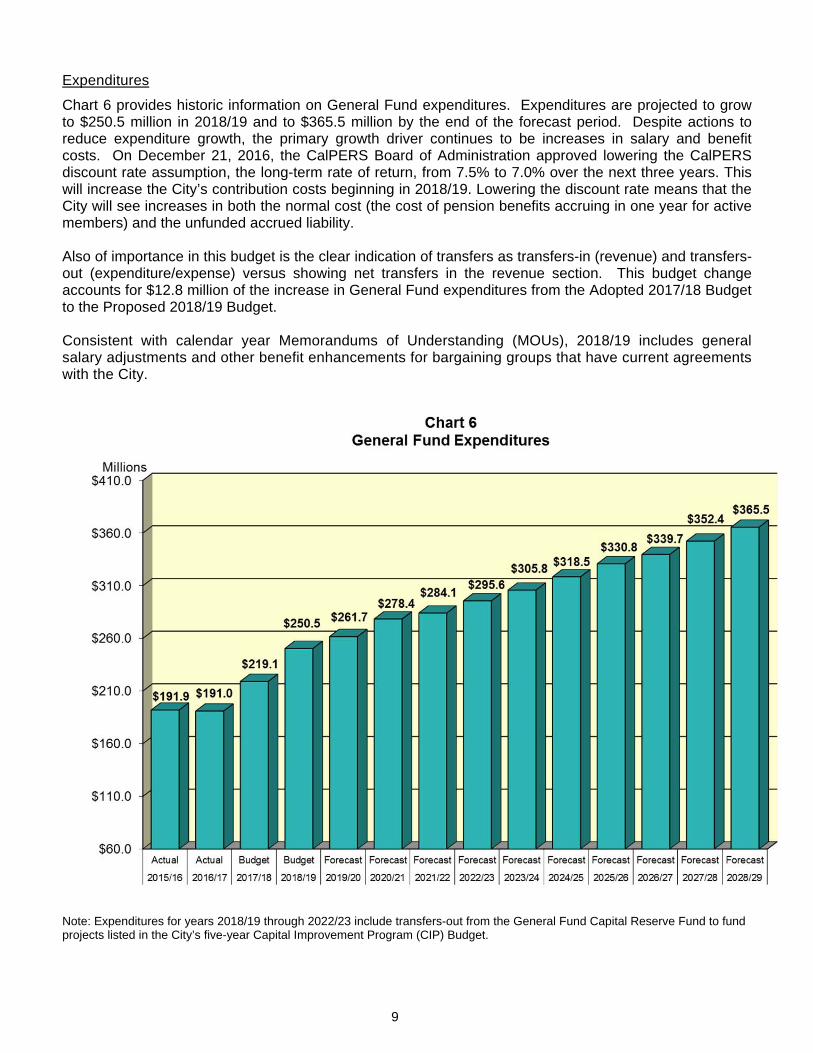
Expenditures
Chart 6 provides historic information on General Fund expenditures. Expenditures are projected to grow to $250.5 million in 2018/19 and to $365.5 million by the end of the forecast period. Despite actions to reduce expenditure growth, the primary growth driver continues to be increases in salary and benefit costs. On December 21, 2016, the CalPERS Board of Administration approved lowering the CalPERS discount rate assumption, the long-term rate of return, from 7.5% to 7.0% over the next three years. This will increase the City’s contribution costs beginning in 2018/19. Lowering the discount rate means that the City will see increases in both the normal cost (the cost of pension benefits accruing in one year for active members) and the unfunded accrued liability. Also of importance in this budget is the clear indication of transfers as transfers-in (revenue) and transfers-out (expenditure/expense) versus showing net transfers in the revenue section. This budget change accounts for $12.8 million of the increase in General Fund expenditures from the Adopted 2017/18 Budget to the Proposed 2018/19 Budget. Consistent with calendar year Memorandums of Understanding (MOUs), 2018/19 includes general salary adjustments and other benefit enhancements for bargaining groups that have current agreements with the City.
Note: Expenditures for years 2018/19 through 2022/23 include transfers-out from the General Fund Capital Reserve Fund to fund projects listed in the City’s five-year Capital Improvement Program (CIP) Budget.

10
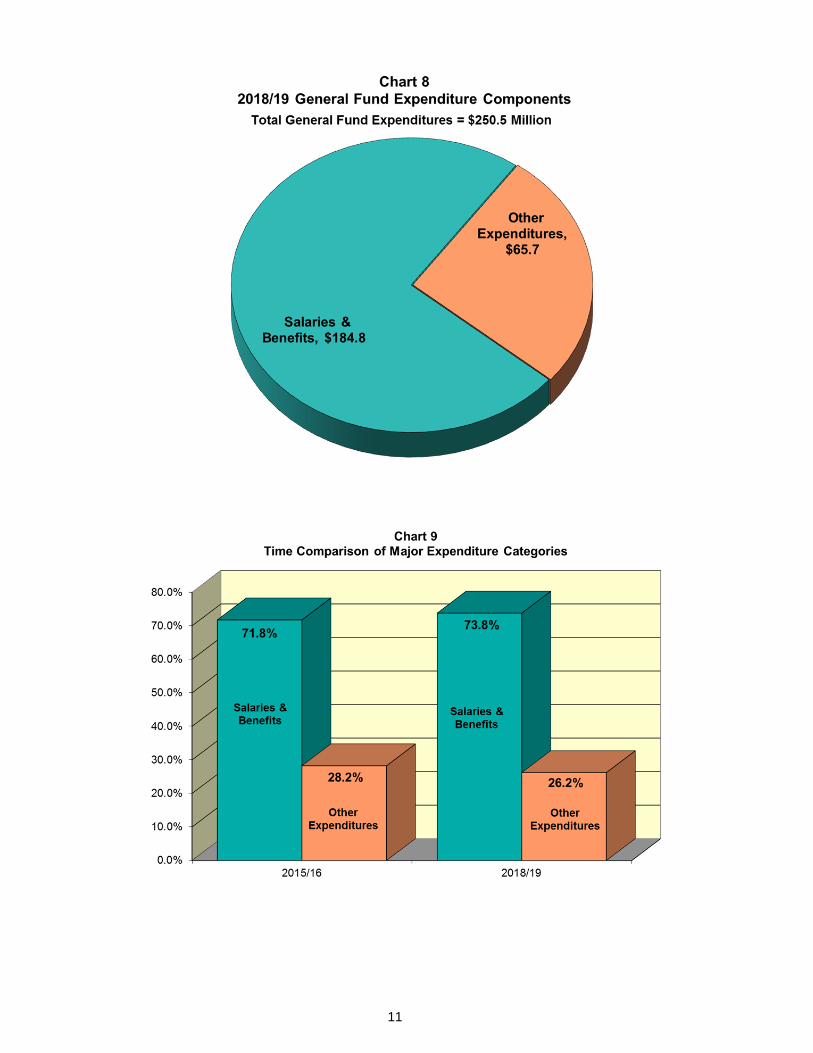
As shown in Charts 7 and 8, Salary & Benefit costs represent the majority ($184.8 million) of budgeted 2018/19 operating expenditures. Salary & Benefit costs as a percentage of total operating expenditures grew from 71.8% in 2015/16 to 73.8% in 2018/19 (see Chart 9). Significant factors driving this growth include the addition of new funded positions, negotiated labor agreements, and rising pension costs.
11
12
Retirement Costs
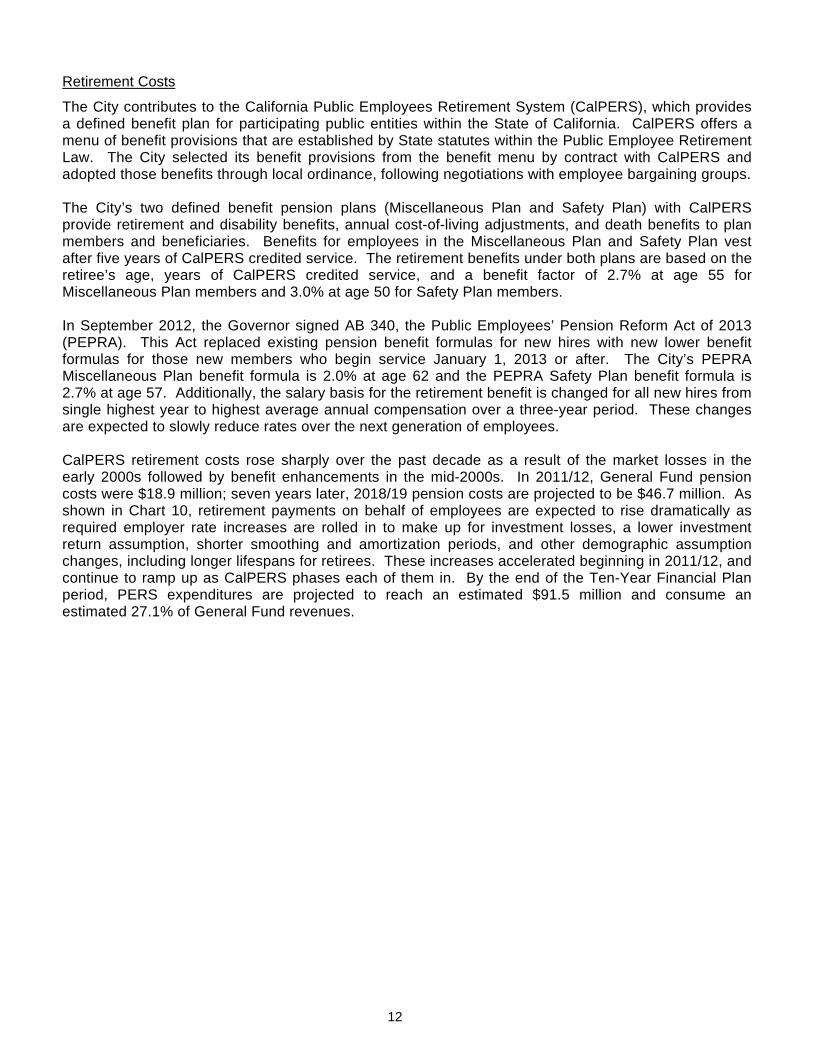
The City contributes to the California Public Employees Retirement System (CalPERS), which provides a defined benefit plan for participating public entities within the State of California. CalPERS offers a menu of benefit provisions that are established by State statutes within the Public Employee Retirement Law. The City selected its benefit provisions from the benefit menu by contract with CalPERS and adopted those benefits through local ordinance, following negotiations with employee bargaining groups. The City’s two defined benefit pension plans (Miscellaneous Plan and Safety Plan) with CalPERS provide retirement and disability benefits, annual cost-of-living adjustments, and death benefits to plan members and beneficiaries. Benefits for employees in the Miscellaneous Plan and Safety Plan vest after five years of CalPERS credited service. The retirement benefits under both plans are based on the retiree’s age, years of CalPERS credited service, and a benefit factor of 2.7% at age 55 for Miscellaneous Plan members and 3.0% at age 50 for Safety Plan members. In September 2012, the Governor signed AB 340, the Public Employees’ Pension Reform Act of 2013 (PEPRA). This Act replaced existing pension benefit formulas for new hires with new lower benefit formulas for those new members who begin service January 1, 2013 or after. The City’s PEPRA Miscellaneous Plan benefit formula is 2.0% at age 62 and the PEPRA Safety Plan benefit formula is 2.7% at age 57. Additionally, the salary basis for the retirement benefit is changed for all new hires from single highest year to highest average annual compensation over a three-year period. These changes are expected to slowly reduce rates over the next generation of employees. CalPERS retirement costs rose sharply over the past decade as a result of the market losses in the early 2000s followed by benefit enhancements in the mid-2000s. In 2011/12, General Fund pension costs were $18.9 million; seven years later, 2018/19 pension costs are projected to be $46.7 million. As shown in Chart 10, retirement payments on behalf of employees are expected to rise dramatically as required employer rate increases are rolled in to make up for investment losses, a lower investment return assumption, shorter smoothing and amortization periods, and other demographic assumption changes, including longer lifespans for retirees. These increases accelerated beginning in 2011/12, and continue to ramp up as CalPERS phases each of them in. By the end of the Ten-Year Financial Plan period, PERS expenditures are projected to reach an estimated $91.5 million and consume an estimated 27.1% of General Fund revenues.
13
The first major driver behind current and future rising retirement costs is the steep market losses experienced during the Great Recession. The CalPERS investment portfolio lost 4.9% in 2007/08 and 24.0% in 2008/09. CalPERS’ actuarial assumption at that time was that it would earn a 7.75% annual investment return; this is the rate of growth needed to keep employer rates stable, all other things being equal. Given this assumption, CalPERS fell short of its actuarial estimate by 44.4% over this two year period, placing significant upward pressure on future rates. Rate increases to make up for these losses were phased in over three years beginning in 2011/12. The second major driver behind pension rate increases are decisions made by the CalPERS Board. In 2012, the CalPERS Board revised their investment earnings assumption downward from 7.75% to 7.5% and in 2013 the Board modified smoothing policies from 15-year rolling average to five-year direct smoothing and changed the amortization period for investment gains and losses from a rolling to a fixed 30-year period. These changes were designed to help agencies move toward 100% funding faster than under the prior policies. The lower investment earnings assumption was incorporated into the calculation of rates beginning in 2014/15. The smoothing and amortization policy changes were implemented beginning in 2015/16. In 2014, the CalPERS Board approved new actuarial assumptions including mortality assumptions which show that retirees and their beneficiaries are expected to live longer than previously assumed, necessitating higher rates to fund higher lifetime pension payouts. These changes were implemented over a five year period beginning in 2016/17.

14
On December 21, 2016, the CalPERS Board approved lowering the investment earnings assumption (discount rate) downward from 7.5% to 7.0% over the next three years. This change will increase rates beginning in Fiscal Year 2018/19. Most recently, in February 2018, the CalPERS Board approved shortening the period over which actuarial gains and losses are amortized from 30 years to 20 years for new pension liabilities. This policy will become effective as of the June 30, 2019 CalPERS actuarial valuations. Year-by-year pension rate projections are shown below in Table 1.
Fiscal YearMiscellaneous
PlanSafety Plan
2015/16 29.562% 41.948%
2016/17 32.267% 44.431%
2017/18 33.430% 47.317%
2018/19 35.928% 51.348%
2019/20 40.100% 56.200%
2020/21 42.800% 60.300%
2021/22 45.000% 64.300%
2022/23 46.900% 67.600%
2023/24 48.000% 69.600%
2024/25 49.000% 71.500%
2025/26 49.600% 72.600%
2026/27 45.100% 73.400%
2027/28 45.400% 74.100%
2028/29 45.800% 74.700%
Percent of Salary:
Table 1Projected CalPERS Employer Rates

15
Chart 11 examines the City’s unfunded PERS liability. In 2000/01, after years of double-digit returns on PERS investments, the value of the City’s assets held by CalPERS actually exceeded projected liabilities, resulting in a super-funded scenario that allowed rates for the Miscellaneous Plan to drop to zero. However, due to investment losses, changes in actuarial assumptions, and benefit enhancements, by June 30, 2016 (the most recent actuarial valuation date) the unfunded liability increased to $504.7 million with the funded status decreasing to 60.4% for the Miscellaneous Plan and 64.6% for the Safety Plan.
16
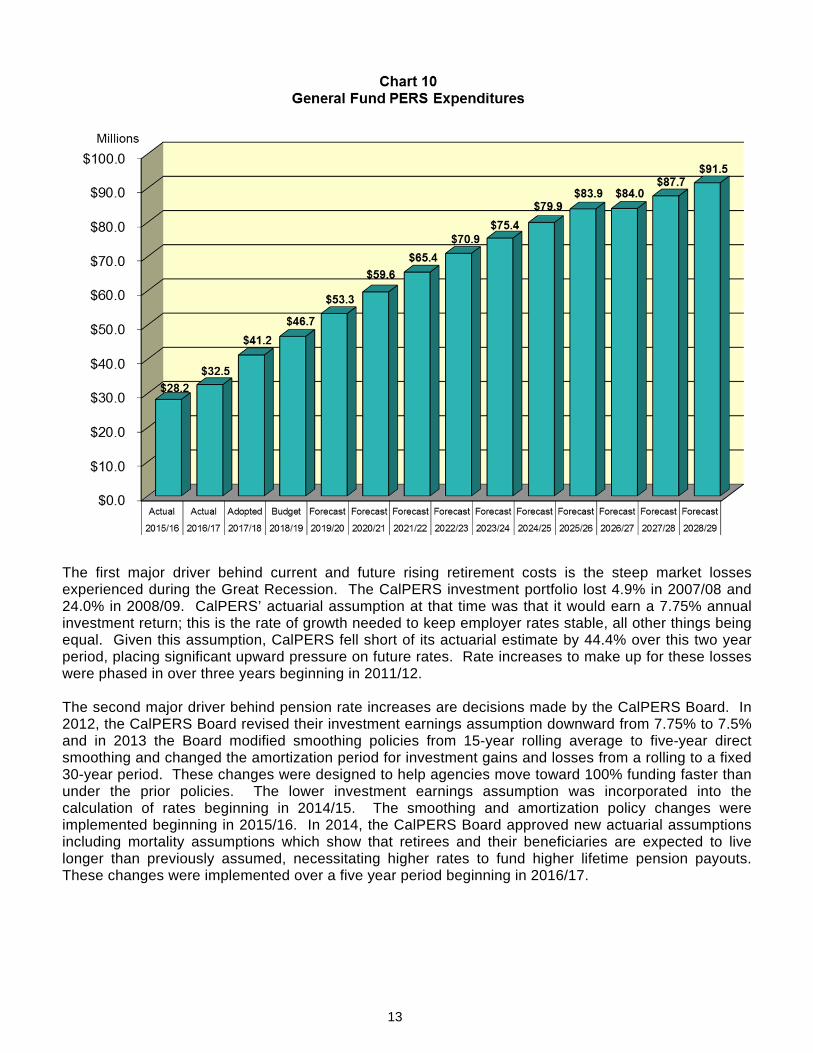
Budget Deficits Projected for the Forecast Horizon
The Plan shows a General Fund budget deficit beginning in 2019/20 and continuing to grow throughout the forecast (as shown in Chart 13). While revenues are anticipated to continue to grow at a moderate pace during the ten-year forecast, expenditures are projected to outpace revenues beginning in 2019/20. The primary drivers behind the higher growth rate for expenditures continue to be rising pension costs and increases in salary and other benefit costs. The 2018/19 General Fund budget is balanced. However, there was not sufficient funding to budget for transfers to the Budget Stabilization Reserve (formerly the Working Capital Reserve) or to the Capital Projects Reserve. It is anticipated that staff will bring forward a recommendation to allocate funding towards these reserve funds if the FY 2017/18 General Fund includes a surplus at year-end. It is important to note that revenue projections assume a moderately growing economy throughout the forecast period, but do not include project specific revenues that may result from several large commercial and residential development projects currently under review or entitled but not yet under construction. If any of the development projects are completed and yield positive economic benefit, the outlook would improve. In addition, this forecast does not include a possible recession scenario.
17
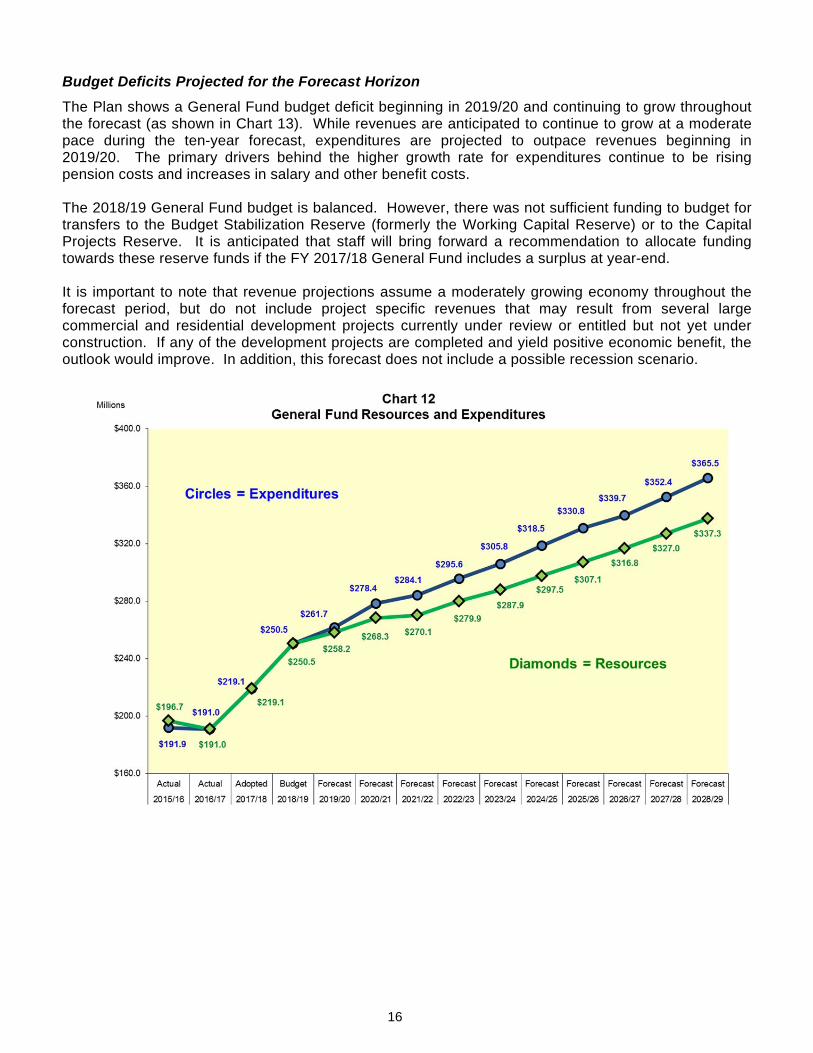
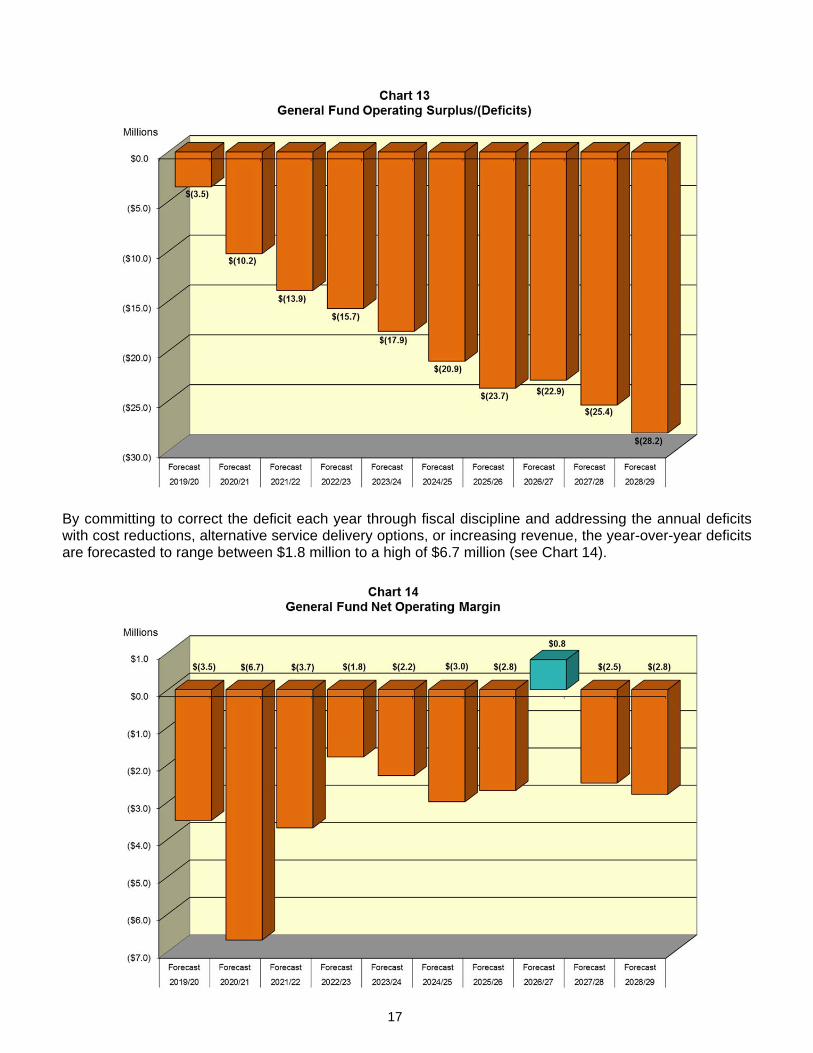
By committing to correct the deficit each year through fiscal discipline and addressing the annual deficits with cost reductions, alternative service delivery options, or increasing revenue, the year-over-year deficits are forecasted to range between $1.8 million to a high of $6.7 million (see Chart 14).
18
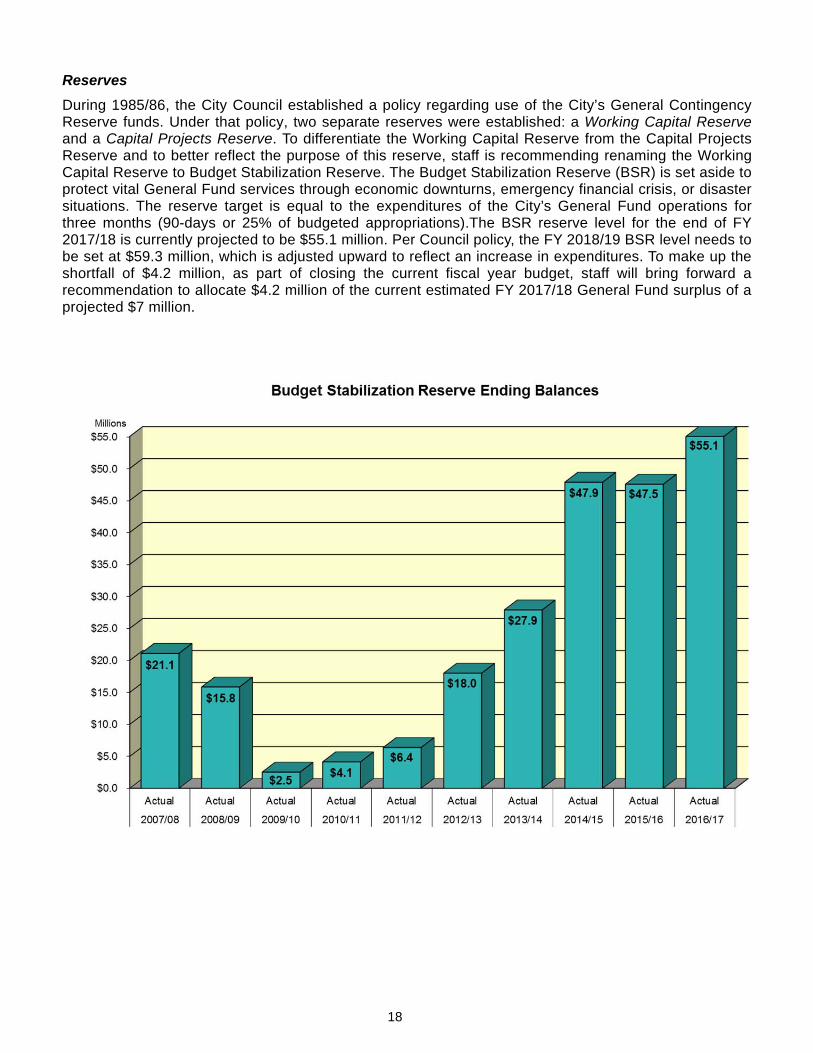
Reserves
During 1985/86, the City Council established a policy regarding use of the City’s General Contingency Reserve funds. Under that policy, two separate reserves were established: a Working Capital Reserve and a Capital Projects Reserve. To differentiate the Working Capital Reserve from the Capital Projects Reserve and to better reflect the purpose of this reserve, staff is recommending renaming the Working Capital Reserve to Budget Stabilization Reserve. The Budget Stabilization Reserve (BSR) is set aside to protect vital General Fund services through economic downturns, emergency financial crisis, or disaster situations. The reserve target is equal to the expenditures of the City’s General Fund operations for three months (90-days or 25% of budgeted appropriations).The BSR reserve level for the end of FY 2017/18 is currently projected to be $55.1 million. Per Council policy, the FY 2018/19 BSR level needs to be set at $59.3 million, which is adjusted upward to reflect an increase in expenditures. To make up the shortfall of $4.2 million, as part of closing the current fiscal year budget, staff will bring forward a recommendation to allocate $4.2 million of the current estimated FY 2017/18 General Fund surplus of a projected $7 million.
19
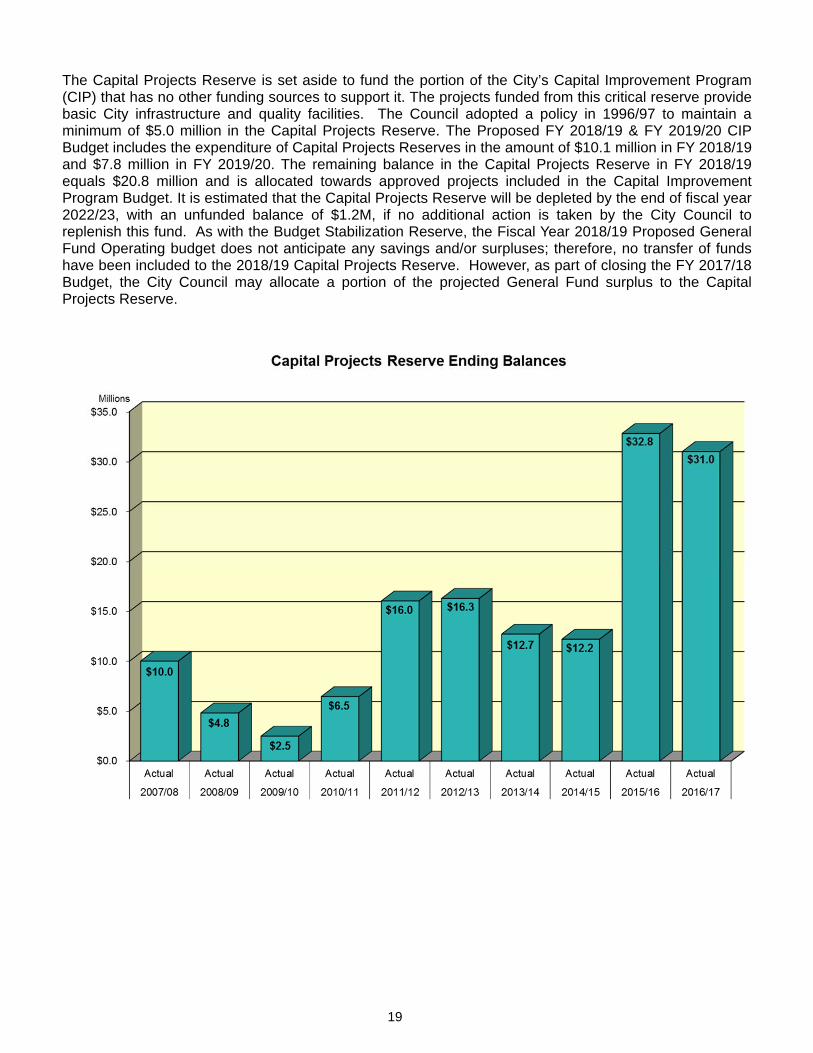
The Capital Projects Reserve is set aside to fund the portion of the City’s Capital Improvement Program (CIP) that has no other funding sources to support it. The projects funded from this critical reserve provide basic City infrastructure and quality facilities. The Council adopted a policy in 1996/97 to maintain a minimum of $5.0 million in the Capital Projects Reserve. The Proposed FY 2018/19 & FY 2019/20 CIP Budget includes the expenditure of Capital Projects Reserves in the amount of $10.1 million in FY 2018/19 and $7.8 million in FY 2019/20. The remaining balance in the Capital Projects Reserve in FY 2018/19 equals $20.8 million and is allocated towards approved projects included in the Capital Improvement Program Budget. It is estimated that the Capital Projects Reserve will be depleted by the end of fiscal year 2022/23, with an unfunded balance of $1.2M, if no additional action is taken by the City Council to replenish this fund. As with the Budget Stabilization Reserve, the Fiscal Year 2018/19 Proposed General Fund Operating budget does not anticipate any savings and/or surpluses; therefore, no transfer of funds have been included to the 2018/19 Capital Projects Reserve. However, as part of closing the FY 2017/18 Budget, the City Council may allocate a portion of the projected General Fund surplus to the Capital Projects Reserve.
20
ENTERPRISE TYPE ACTIVITIES
The City owns and operates various enterprise type activities including the Electric, Water and Sewer Utilities, City Cemetery, and Solid Waste program. A five-year projection of major enterprise fund revenues and expenses is included in the attached schedules. The projections were prepared by the respective entities with underlying economic and other pertinent assumptions that may differ from those outlined in this Plan. Presentation of enterprise fund information in this plan is designed to draw attention to their financial relationship to the City’s General Fund. Silicon Valley Power Silicon Valley Power (SVP) provides electric power and services to over 55,000 City customer accounts. In calendar year 2017, the SVP served approximately 1,660 industrial accounts that comprised 90% of the City's load and more than 88% of customer service revenues. The Electric Department provides diverse services including operating, maintaining and dispatching electric service, engineering, system design and planning, administrative and financial management, marketing, customer services, wholesale power trading, free outdoor Wi-Fi (powered by SVP Meter Connect) and dark fiber leasing services -- all of which makes SVP a successful and reliable resource for the City and its citizens. SVP owns power generation facilities, invests in joint ventures on generation and transmission projects, and trades wholesale power on the open market. Its primary goals are to provide safe, reliable service while remaining competitive in the marketplace and placing a premium on a high level of customer satisfaction. While the business environment has changed due to high-tech load growth, SVP remains dedicated to responsive, low cost and reliable customer service. Over the next ten years, SVP will continue to build and expand its state-of-the-art power and communications infrastructure. SVP’s mission is to be a progressive, service-oriented utility, and to offer reliable, competitively priced energy services for the benefit of Santa Clara and its customers. This means implementing energy efficiency programs, green technologies, ensuring reliable service, streamlining operations, and improving communications. SVP continually works with Santa Clara customers to enhance the value they receive from municipal ownership of their electric utility. Also, over the coming years, SVP will take significant measures to proactively comply with continually increasing legislative and regulatory mandates such as California’s Renewable Portfolio Standard (RPS) and the Cap-and-Trade Program. The State’s RPS program requires electric service providers to increase procurement of eligible renewable resources to 33% of total procurement by 2020, and in 2015 the Governor signed Senate Bill 350 increasing that to 50% of total procurement by 2030. While SVP already exceeded state-wide RPS goals for Compliance Period 1 and 2 (2011-2016) and expects to fulfill the requirement for Compliance period 3 (2017-2020), the RPS requires SVP to continue its support of this broad range of programs encouraging wise use of energy resources, especially renewable energy generation. The California Cap-and-Trade Program began in mid-2012 and intends to cap and reduce CO2 emissions by auctioning emission allowances and investing the proceeds in consumer benefits such as energy efficiency, renewable energy, and other clean energy technologies. At the Federal level, the North American Electric Reliability Corporation (NERC) has issued new reliability standards with mandatory requirements to ensure power system reliability throughout the country. SVP has established a framework to assure that the City is in and stays in compliance with NERC mandatory standards. Furthermore, Fitch Ratings upgraded the rating on SVP’s revenue bonds to AA- from A+ and Standard and Poor’s Global Ratings revised SVP’s outlook to stable from negative, reinforcing the need to maintain a positive net income during normal operating years and keep Electric Utility reserves over the $120 million target. The cost of producing and procuring energy is projected to increase primarily due to higher electric transmission costs, increased gas transportation costs, and higher power purchase and generation expenses to serve the projected increase in retail load. Because the additional renewable resources were acquired to meet future state mandates and are not immediately needed for current period compliance, the higher costs are being partially offset by wholesale sales of the bundled renewable energy. Special
21
efforts are made to assure that costs for the procurement of natural gas and emissions allowances for carbon are properly projected. To ensure safety and comply with reliability requirements, SVP continues its multi-year substation rebuilding projects. The forecast assumes capital expenditures including substation upgrades, equipment replacement, new technology deployment, and economic development projects. The Phase Shifting Transformer has been reducing the operating costs as well as improving the Utility’s reliability. This project was funded by a short-term loan, which will be repaid through the operating cost savings. In other ongoing capital projects, the Electric Department continues to improve, demonstrate, and implement new technologies to support tomorrow’s power grid. Some key projects being deployed in this area are the continuing development of an Advanced Metering Infrastructure (AMI) Project; the SVP Meter Connect program (which powers the City’s free outdoor Wi-Fi); the ongoing Operational and Technology Project, updating the power scheduling and back office systems required to schedule, track and settle power purchase and sales transactions; LED streetlight upgrade projects; and the improvement of the electric system cyber and physical security as required by mandatory federal reliability standards. SVP continues to improve electric infrastructure to provide a reliable and low-cost business environment so Santa Clara’s economy can grow and thrive. Rapid growth in energy demand, aging grids, communication technologies, and environmental impacts are driving change in how utilities do business and operate. New services, customer demand, and regulatory requirements continue to drive the need for advanced technology solutions to improve customer energy services. The Electric Department’s Ten-Year Financial Plan assumes a 2% rate increase in each of the next three fiscal years, 2018/19 through 2020/21, subject to further review and City Council approval. The inflationary rate increase is needed to cover increasing transmission and gas transportation costs. Additionally, it is important that we maintain our current reserve levels at the $120 million target in the event there is a market disruption causing prices to increase beyond what was projected. Santa Clara’s Electric Utility continues to offer among the lowest electric rates in the State of California while maintaining a strong balance sheet. Water and Sewer Utilities Water Utility expenditures are projected to increase by 14% between 2017/18 and 2018/19 and increase up to 7% per year over the ten-year planning period, primarily due to projected increases in the wholesale cost of water. Moderate increases are also projected in salaries and benefits, right-of-way fees, other operating expenditures, and Internal Service Fund allocations. Sewer Utility expenditures are projected to increase 8% between 2017/18 and 2018/19 and approximately 3% per year for the duration of the ten-year forecast period. Increases are driven primarily by increases in operations and maintenance (O&M) costs for the San Jose/Santa Clara Regional Wastewater Facility (RWF), as well as moderate increases in salaries and benefits, right-of-way fees, and Internal Service allocations. The exceptions to the 3% per year increase occur in Fiscal Years 2019/20 and 2021/22, during which there is an expected 15% increase in expenditures over the previous years. These increases are driven primarily by debt service payments on expected debt issuance in 2018/19 and 2020-21, respectively. This debt is being issued to keep rates from increasing significantly to cover capital expenditures at the RWF, as well as to spread the cost of RWF improvements over a 25-year period. Recycled Water Utility expenditures are projected to increase by 9% between 2017/18 and 2018/19, and by 8% per year over the remainder of the planning period. Increasing demand for and sale of, recycled water, as well as wholesale purchase costs of recycled water, are the primary components of the projected increases. Even with the projected increases in expenditures, the Utilities anticipate maintaining combined water, ewer, and recycled water rates at a competitive level that is affordable for residents and attractive for businesses.
22
Parks and Recreation Department - Cemetery Division In continuous operation since 1864, Mission City Memorial Park (MCMP) is a 25+ acre historic property, a place of reverence and peace. Parks and Recreation staff honors the Park’s past and are positioning MCMP for the future. Fees for interment rights and services are reviewed annually to ensure they are set appropriately. The inventory of available graves, niches, and crypts is managed to ensure residents have continued choices. Marketing strategies are employed to ensure Santa Clara residents are aware of MCMP as an excellent choice for their final resting place. Expenses are continuously evaluated to ensure resources are used efficiently and effectively, while maintaining MCMP in optimal condition. In fiscal year 2016/17 a fee study was performed. As a result of the study some components of burial fees were reduced and/or combined in fiscal year 2017/18, resulting in greater affordability and a more clear process for the resident-customer. While the trend for the previous three years showed increased revenue of 5%, the near term forecast projects flat revenues, except for interment rights and perpetual care which will need to increase as a function of maintaining cost recovery levels. The categories of sales (components of burial) are as follows:
1. Interment rights (facilities) are a one-time fee which reserves a person’s space in a grave, niche, or crypt;
2. Perpetual care (endowment) is a one-time fee collected for each person interred and whose principal and growth is reserved and portion of interest on growth is used to support future maintenance of the grounds and buildings;
3. Materials sold include burial vaults, flower vases and rings, niche plaques, and mono-bars; 4. Marker setting fees include the permanent placement of a personalized stone marker onto a grave; 5. Site preparation (labor) includes staff time required to prepare a site for burial, it is collected only at
time of need, and each time the site is accessed. To assure funds are available to support the maintenance grounds and buildings, a 25% increase was applied to interment rights and perpetual care (endowment) in fiscal year 2018/19. The Cemetery’s salaries and benefits are projected to increase 3.5% - 5.0% during the ten-year forecast period. Other operating expenditures and Internal Service Fund allocations are projected to increase by 3.2% annually during the same period. CONCLUSION
The Ten-Year Financial Plan provides policy-makers and the public an updated assessment of the City’s financial condition that takes into account the latest projections of economic conditions. The benefit of the Ten-Year Financial Plan is to provide the City Council, staff, and community a clear assessment of the City’s finances and facilitate an informed discussion during budget deliberations. The Plan serves as a starting point to provide perspective and analysis of what will happen if current financial decisions and operating practices continue into the future.
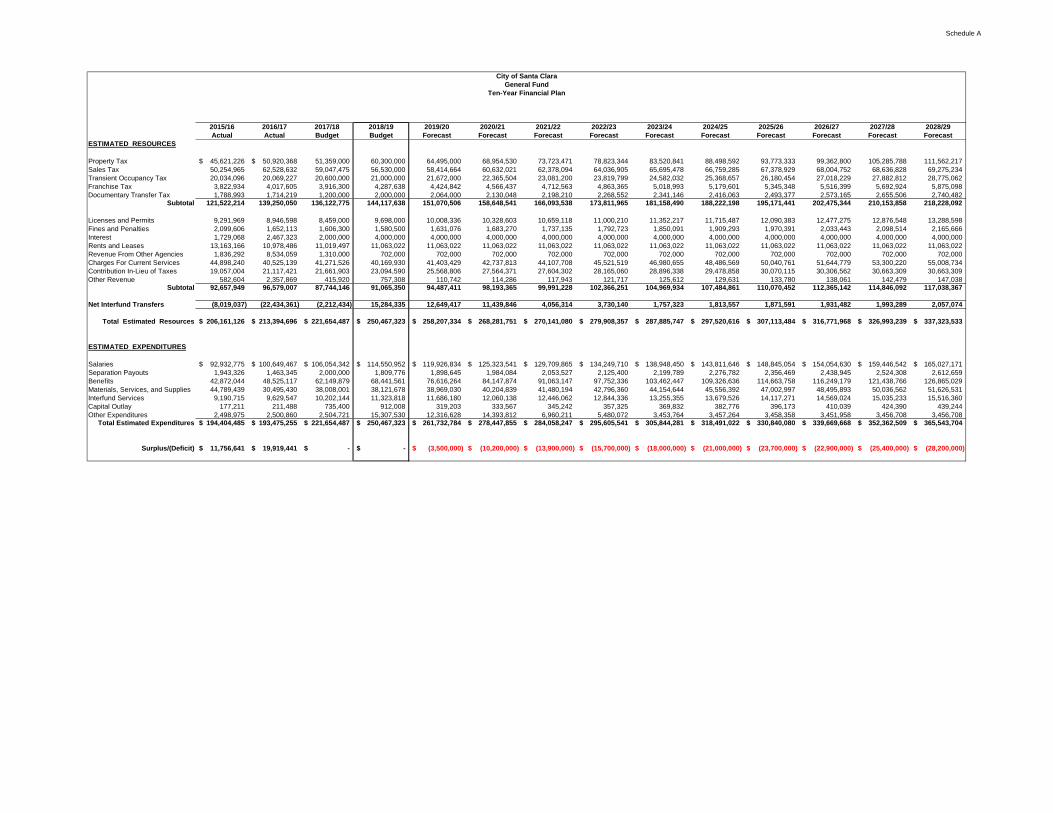
Schedule A
2015/16 2016/17 2017/18 2018/19 2019/20 2020/21 2021/22 2022/23 2023/24 2024/25 2025/26 2026/27 2027/28 2028/29Actual Actual Budget Budget Forecast Forecast Forecast Forecast Forecast Forecast Forecast Forecast Forecast Forecast
ESTIMATED RESOURCES
Property Tax 45,621,226$ 50,920,368$ 51,359,000 60,300,000 64,495,000 68,954,530 73,723,471 78,823,344 83,520,841 88,498,592 93,773,333 99,362,800 105,285,788 111,562,217 Sales Tax 50,254,965 62,528,632 59,047,475 56,530,000 58,414,664 60,632,021 62,378,094 64,036,905 65,695,478 66,759,285 67,378,929 68,004,752 68,636,828 69,275,234 Transient Occupancy Tax 20,034,096 20,069,227 20,600,000 21,000,000 21,672,000 22,365,504 23,081,200 23,819,799 24,582,032 25,368,657 26,180,454 27,018,229 27,882,812 28,775,062 Franchise Tax 3,822,934 4,017,605 3,916,300 4,287,638 4,424,842 4,566,437 4,712,563 4,863,365 5,018,993 5,179,601 5,345,348 5,516,399 5,692,924 5,875,098 Documentary Transfer Tax 1,788,993 1,714,219 1,200,000 2,000,000 2,064,000 2,130,048 2,198,210 2,268,552 2,341,146 2,416,063 2,493,377 2,573,165 2,655,506 2,740,482
Subtotal 121,522,214 139,250,050 136,122,775 144,117,638 151,070,506 158,648,541 166,093,538 173,811,965 181,158,490 188,222,198 195,171,441 202,475,344 210,153,858 218,228,092
Licenses and Permits 9,291,969 8,946,598 8,459,000 9,698,000 10,008,336 10,328,603 10,659,118 11,000,210 11,352,217 11,715,487 12,090,383 12,477,275 12,876,548 13,288,598 Fines and Penalties 2,099,606 1,652,113 1,606,300 1,580,500 1,631,076 1,683,270 1,737,135 1,792,723 1,850,091 1,909,293 1,970,391 2,033,443 2,098,514 2,165,666 Interest 1,729,068 2,467,323 2,000,000 4,000,000 4,000,000 4,000,000 4,000,000 4,000,000 4,000,000 4,000,000 4,000,000 4,000,000 4,000,000 4,000,000 Rents and Leases 13,163,166 10,978,486 11,019,497 11,063,022 11,063,022 11,063,022 11,063,022 11,063,022 11,063,022 11,063,022 11,063,022 11,063,022 11,063,022 11,063,022 Revenue From Other Agencies 1,836,292 8,534,059 1,310,000 702,000 702,000 702,000 702,000 702,000 702,000 702,000 702,000 702,000 702,000 702,000 Charges For Current Services 44,898,240 40,525,139 41,271,526 40,169,930 41,403,429 42,737,813 44,107,708 45,521,519 46,980,655 48,486,569 50,040,761 51,644,779 53,300,220 55,008,734 Contribution In-Lieu of Taxes 19,057,004 21,117,421 21,661,903 23,094,590 25,568,806 27,564,371 27,604,302 28,165,060 28,896,338 29,478,858 30,070,115 30,306,562 30,663,309 30,663,309 Other Revenue 582,604 2,357,869 415,920 757,308 110,742 114,286 117,943 121,717 125,612 129,631 133,780 138,061 142,479 147,038
Subtotal 92,657,949 96,579,007 87,744,146 91,065,350 94,487,411 98,193,365 99,991,228 102,366,251 104,969,934 107,484,861 110,070,452 112,365,142 114,846,092 117,038,367
Net Interfund Transfers (8,019,037) (22,434,361) (2,212,434) 15,284,335 12,649,417 11,439,846 4,056,314 3,730,140 1,757,323 1,813,557 1,871,591 1,931,482 1,993,289 2,057,074
Total Estimated Resources 206,161,126$ 213,394,696$ 221,654,487$ 250,467,323$ 258,207,334$ 268,281,751$ 270,141,080$ 279,908,357$ 287,885,747$ 297,520,616$ 307,113,484$ 316,771,968$ 326,993,239$ 337,323,533$
ESTIMATED EXPENDITURES
Salaries 92,932,775$ 100,649,467$ 106,054,342$ 114,550,952$ 119,926,834$ 125,323,541$ 129,709,865$ 134,249,710$ 138,948,450$ 143,811,646$ 148,845,054$ 154,054,630$ 159,446,542$ 165,027,171$ Separation Payouts 1,943,326 1,463,345 2,000,000 1,809,776 1,898,645 1,984,084 2,053,527 2,125,400 2,199,789 2,276,782 2,356,469 2,438,945 2,524,308 2,612,659 Benefits 42,872,044 48,525,117 62,149,879 68,441,561 76,616,264 84,147,874 91,063,147 97,752,336 103,462,447 109,326,636 114,663,758 116,249,179 121,438,766 126,865,029 Materials, Services, and Supplies 44,789,439 30,495,430 38,008,001 38,121,678 38,969,030 40,204,839 41,480,194 42,796,360 44,154,644 45,556,392 47,002,997 48,495,893 50,036,562 51,626,531 Interfund Services 9,190,715 9,629,547 10,202,144 11,323,818 11,686,180 12,060,138 12,446,062 12,844,336 13,255,355 13,679,526 14,117,271 14,569,024 15,035,233 15,516,360 Capital Outlay 177,211 211,488 735,400 912,008 319,203 333,567 345,242 357,325 369,832 382,776 396,173 410,039 424,390 439,244 Other Expenditures 2,498,975 2,500,860 2,504,721 15,307,530 12,316,628 14,393,812 6,960,211 5,480,072 3,453,764 3,457,264 3,458,358 3,451,958 3,456,708 3,456,708
Total Estimated Expenditures 194,404,485$ 193,475,255$ 221,654,487$ 250,467,323$ 261,732,784$ 278,447,855$ 284,058,247$ 295,605,541$ 305,844,281$ 318,491,022$ 330,840,080$ 339,669,668$ 352,362,509$ 365,543,704$
Surplus/(Deficit) 11,756,641$ 19,919,441$ -$ -$ (3,500,000)$ (10,200,000)$ (13,900,000)$ (15,700,000)$ (18,000,000)$ (21,000,000)$ (23,700,000)$ (22,900,000)$ (25,400,000)$ (28,200,000)$
City of Santa ClaraGeneral Fund
Ten-Year Financial Plan
Budget2018-19 2019-20 2020-21 2021-22 2022-23 2023-24 2024-25 2025-26 2026-27 2027-28 2028-29
REVENUEInterest & Rents 6,525,404$ 8,118,855$ 9,169,339$ 9,804,224$ 10,070,986$ 10,456,074$ 10,913,102$ 11,330,657$ 11,643,317$ 11,932,158$ 12,183,888$ Charges for Services 442,466,956 492,355,119 534,484,779 556,154,586 569,303,285 583,972,801 594,722,631 609,403,045 623,642,413 640,851,418 660,181,726 Other Revenue 1,100,000 1,100,000 1,100,000 1,100,000 1,100,000 1,100,000 1,100,000 1,100,000 1,100,000 1,100,000 1,100,000
Total Revenue 450,092,360$ 501,573,975$ 544,754,118$ 567,058,811$ 580,474,271$ 595,528,875$ 606,735,733$ 621,833,702$ 636,385,730$ 653,883,576$ 673,465,614$
EXPENDITURESSalaries and Benefits 43,764,014$ 46,817,530$ 48,902,005$ 50,384,219$ 51,804,181$ 52,818,690$ 53,778,862$ 54,700,632$ 54,471,226$ 55,307,161$ 57,390,911$ Mat/Serv/Sup 35,703,060 37,763,392 39,612,344 40,927,636 42,018,876 43,203,561 44,285,763 45,380,183 46,315,033 47,324,767 49,574,840 Resource and Production 285,144,875 317,467,043 345,630,749 366,939,235 383,678,200 384,825,544 399,166,464 415,109,367 427,232,175 442,231,733 461,995,173 Interfund Services 12,438,634 13,861,289 15,065,145 16,174,556 17,276,765 18,249,991 19,255,482 20,241,873 20,359,438 21,344,114 22,841,151 Contribution In Lieu of Taxes 23,094,590 25,763,699 28,280,206 28,642,941 29,221,214 29,978,944 30,536,787 31,291,685 32,019,287 32,894,179 33,873,281 Capital Outlay 482,000 496,460 511,354 526,694 542,495 558,770 575,533 592,799 610,583 628,901 647,768 Debt Service 20,998,844 20,990,145 20,983,670 20,958,059 20,947,325 20,948,766 20,821,668 16,670,603 16,597,719 16,750,369 8,509,705 CIP Expenditures 22,294,484 27,410,190 31,949,718 28,539,162 19,631,303 25,451,873 26,539,254 27,748,012 29,192,656 30,674,347 36,025,574
Transfers (From) To Reserves2 6,171,860 11,004,226 13,818,927 13,966,309 15,353,912 19,492,735 11,775,921 10,098,546 9,587,613 6,728,006 2,607,211
Total Expenditures 450,092,360$ 501,573,975$ 544,754,118$ 567,058,811$ 580,474,271$ 595,528,875$ 606,735,733$ 621,833,702$ 636,385,730$ 653,883,576$ 673,465,614$
1. Assumes 2% rate increase January 2019 to 2021 and 2026 to 2029, subject to further review and to City Council approval.2. Includes contributions to Rate Stabilization, which includes the Cost Reduction Fund.
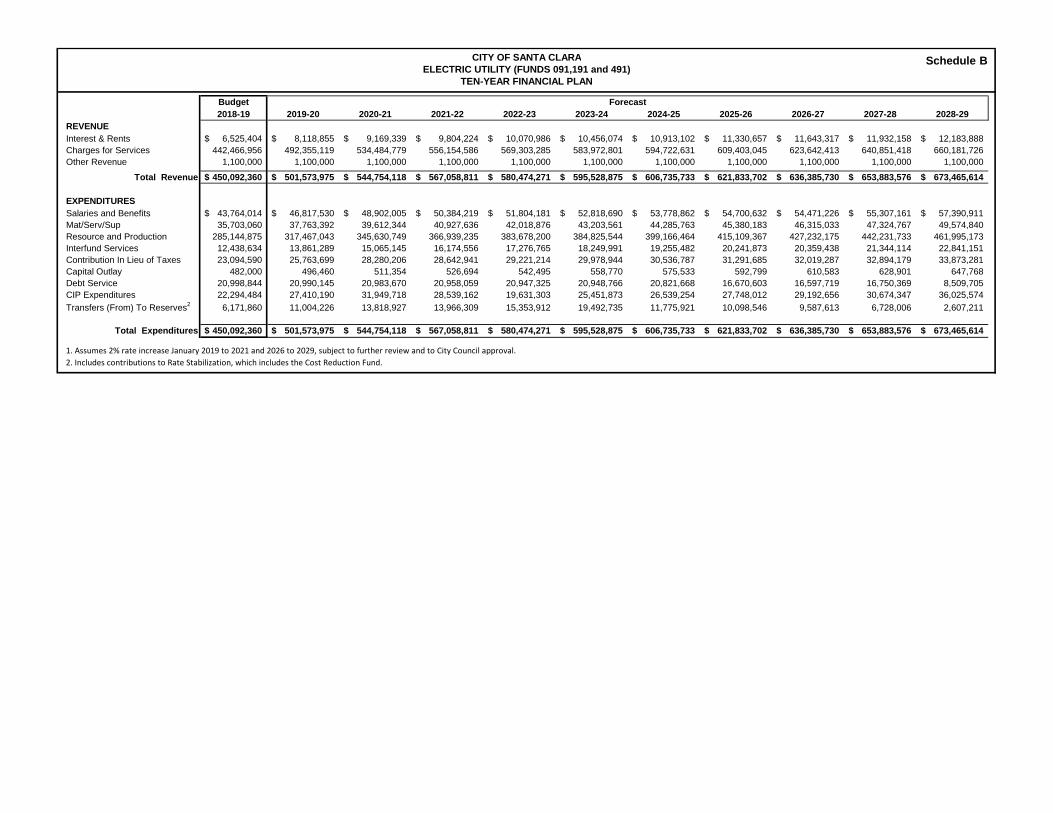
CITY OF SANTA CLARAELECTRIC UTILITY (FUNDS 091,191 and 491)
TEN-YEAR FINANCIAL PLAN
Forecast
Schedule B

Budget2018/19 2019/20 2020/21 2021/22 2022/23 2023/24 2024/25 2025/26 2026/27 2027/28 2028/29
REVENUE
Cust. Serv. Charges & Fees1 48,755,900 52,478,413 56,377,034 60,623,352 65,189,503 68,814,040 72,640,100 76,678,890 80,942,236 85,442,625 90,193,235 Other Revenue 1,400,984 1,400,984 1,400,984 1,400,984 1,400,984 1,400,984 1,400,984 1,400,984 1,400,984 1,400,984 1,400,984
Use of Money and Property2 180,000 183,600 187,272 191,017 194,838 198,735 202,709 206,763 210,899 215,117 219,419
Total Revenue 50,336,884$ 54,062,997$ 57,965,290$ 62,215,354$ 66,785,325$ 70,413,758$ 74,243,794$ 78,286,637$ 82,554,119$ 87,058,725$ 91,813,638$
EXPENDITURES
Salaries and Benefits3 8,438,473$ 8,776,012$ 9,127,052$ 9,492,134$ 9,871,820$ 10,266,693$ 10,677,360$ 11,104,455$ 11,548,633$ 12,010,578$ 12,491,001$
Other Operating Expenditures3 2,875,517 2,990,538 3,110,159 3,234,566 3,363,948 3,498,506 3,638,446 3,783,984 3,935,344 4,092,757 4,256,468
Resource and Production4 27,174,927 25,872,590 29,681,611 31,862,304 35,108,307 38,608,259 42,083,002 45,870,473 49,998,815 54,498,708 59,403,592
Internal Service Fund Allocations3 4,134,494 4,299,874 4,471,869 4,650,743 4,836,773 5,030,244 5,231,454 5,440,712 5,658,341 5,884,674 6,120,061
Right-of-Way Fee5 1,808,000 1,898,400 1,993,320 2,092,986 2,197,635 2,307,517 2,422,893 2,544,038 2,671,239 2,804,801 2,945,041
Inter/Intra Transfers Out6 5,905,473 10,225,584 9,581,279 10,882,620 11,406,842 10,702,539 10,190,638 9,542,976 8,741,747 7,767,206 6,597,474
Total Expenditures 50,336,884$ 54,062,997$ 57,965,290$ 62,215,354$ 66,785,325$ 70,413,758$ 74,243,794$ 78,286,637$ 82,554,119$ 87,058,725$ 91,813,638$
Operating Suplus/(Deficit) -$ -$ -$ -$ -$ -$ -$ -$ -$ -$ -$
2. Assumes 2% per year increase.3. Assumes 4% per year increase.4. Assumes agency projections for wholesale rates.5. Assumes 5% per year increase.6. Includes Transfers to ReservesNote that a portion of Transfers to Reserves is slated to fund project expenditures based on rate model. The remainder will fund Operating Reserves, Capital Reserves, and a Rate Stabilization Reserve
1. Assumes 3% increase in sales each year for the first 5 years of the planning period followed by 1.5% for each remaining year; also assumes 5.1% rate increase in 2018‐19, and a 4.5%, 4.3%, 4.4% and 4.4% rate increase respectively for the remainder of first 5 years of the planning period. A 4 % rate increase is assumed from FY2023‐24 through the end of the 10 year plan.
CITY OF SANTA CLARAWATER UTILITY (FUND 092)TEN-YEAR FINANCIAL PLAN
Forecast
Schedule C
Budget2018/19 2019/20 2020/21 2021/22 2022/2023 2023/24 2024/25 2025/26 2026/27 2027/28 2028/29
REVENUE
Cust. Serv. Charges & Fees1 40,911,800 42,139,154 43,403,329 45,964,125 48,951,793 51,399,383 53,969,352 56,667,820 59,501,211 62,476,271 65,600,085 Other Misc. Revenue 230,275 239,486 249,065 259,028 269,389 280,165 291,371 303,026 315,147 327,753 340,863
Inter/Intra Transfers6 2,991,962 - - - - - - - - - - Use of Money and Property 600,000 612,000 624,240 636,725 649,459 662,448 675,697 689,211 702,996 717,056 731,397
Other Financing-Proceeds2 - 50,000,000 - 25,000,000 - - - - - - -
Total Revenue 44,734,037$ 92,990,640$ 44,276,634$ 71,859,878$ 49,870,642$ 52,341,996$ 54,936,421$ 57,660,057$ 60,519,353$ 63,521,080$ 66,672,344$
EXPENDITURES
Salaries and Benefits3 4,250,023$ 4,420,024$ 4,596,825$ 4,780,698$ 4,971,926$ 5,170,803$ 5,377,635$ 5,592,740$ 5,816,450$ 6,049,108$ 6,291,072$ Other Operating Expenditures 525,552 546,574 568,437 591,175 614,822 639,414 664,991 691,591 719,254 748,024 777,945
Resource and Production4 16,577,982 16,160,801 16,726,429 17,311,854 17,917,768 18,544,890 16,160,801 16,726,429 17,311,854 17,917,768 18,544,890
Internal Service Fund Allocations3 2,209,680 2,298,067 2,389,990 2,485,589 2,585,013 2,688,414 2,795,950 2,907,788 3,024,100 3,145,064 3,270,866
Right-of-Way Fee5 1,513,900 1,559,317 1,606,097 1,700,856 1,811,412 1,901,982 1,997,082 2,096,936 2,201,782 2,311,872 2,427,465 Debt Service 937,450 4,937,450 4,937,450 8,537,450 8,537,450 8,537,450 8,537,450 8,537,450 8,537,450 8,537,450 8,537,450
Inter/Intra Transfers Out7 18,719,450 63,068,407 13,451,407 36,452,256 13,432,251 14,859,043 19,402,512 21,107,123 22,908,463 24,811,794 26,822,656
Total Expenditures 44,734,037$ 92,990,640$ 44,276,634$ 71,859,878$ 49,870,642$ 52,341,996$ 54,936,421$ 57,660,057$ 60,519,353$ 63,521,080$ 66,672,344$
Operating Suplus/(Deficit) -$ -$ -$ -$ -$ -$ -$ -$ -$ -$ -$
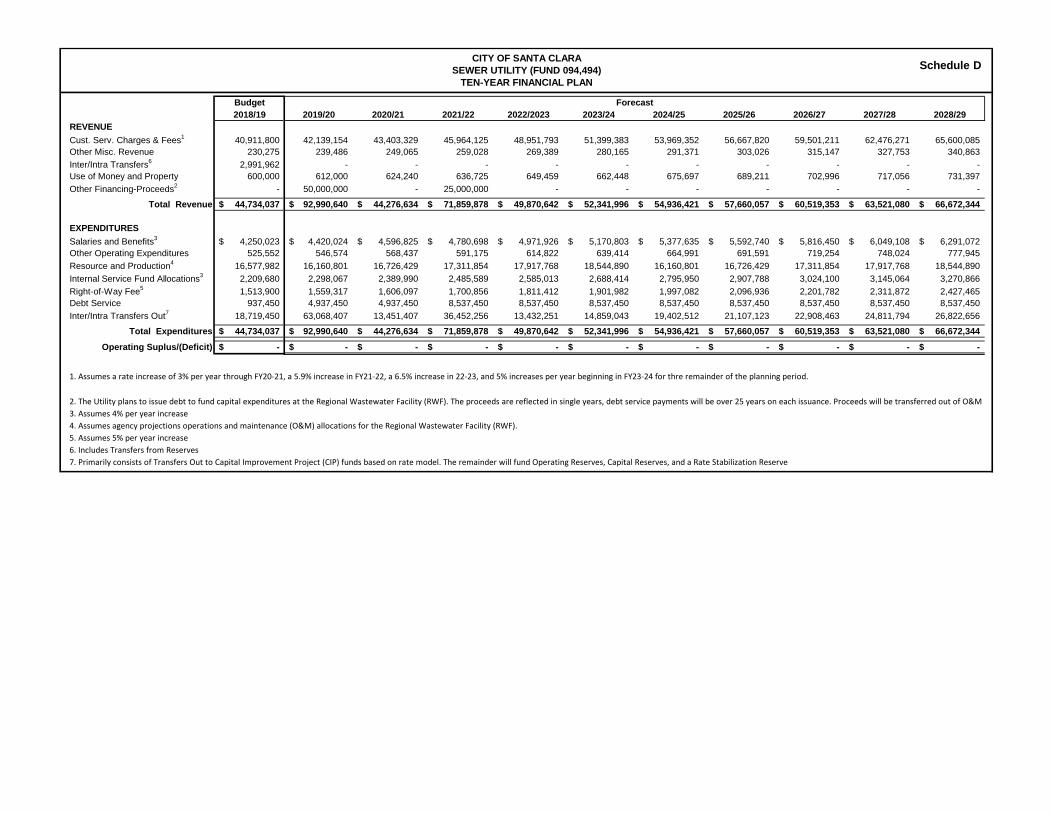
1. Assumes a rate increase of 3% per year through FY20‐21, a 5.9% increase in FY21‐22, a 6.5% increase in 22‐23, and 5% increases per year beginning in FY23‐24 for thre remainder of the planning period.
3. Assumes 4% per year increase4. Assumes agency projections operations and maintenance (O&M) allocations for the Regional Wastewater Facility (RWF).5. Assumes 5% per year increase6. Includes Transfers from Reserves7. Primarily consists of Transfers Out to Capital Improvement Project (CIP) funds based on rate model. The remainder will fund Operating Reserves, Capital Reserves, and a Rate Stabilization Reserve
CITY OF SANTA CLARASEWER UTILITY (FUND 094,494)
TEN-YEAR FINANCIAL PLAN
Forecast
2. The Utility plans to issue debt to fund capital expenditures at the Regional Wastewater Facility (RWF). The proceeds are reflected in single years, debt service payments will be over 25 years on each issuance. Proceeds will be transferred out of O&M
Schedule D
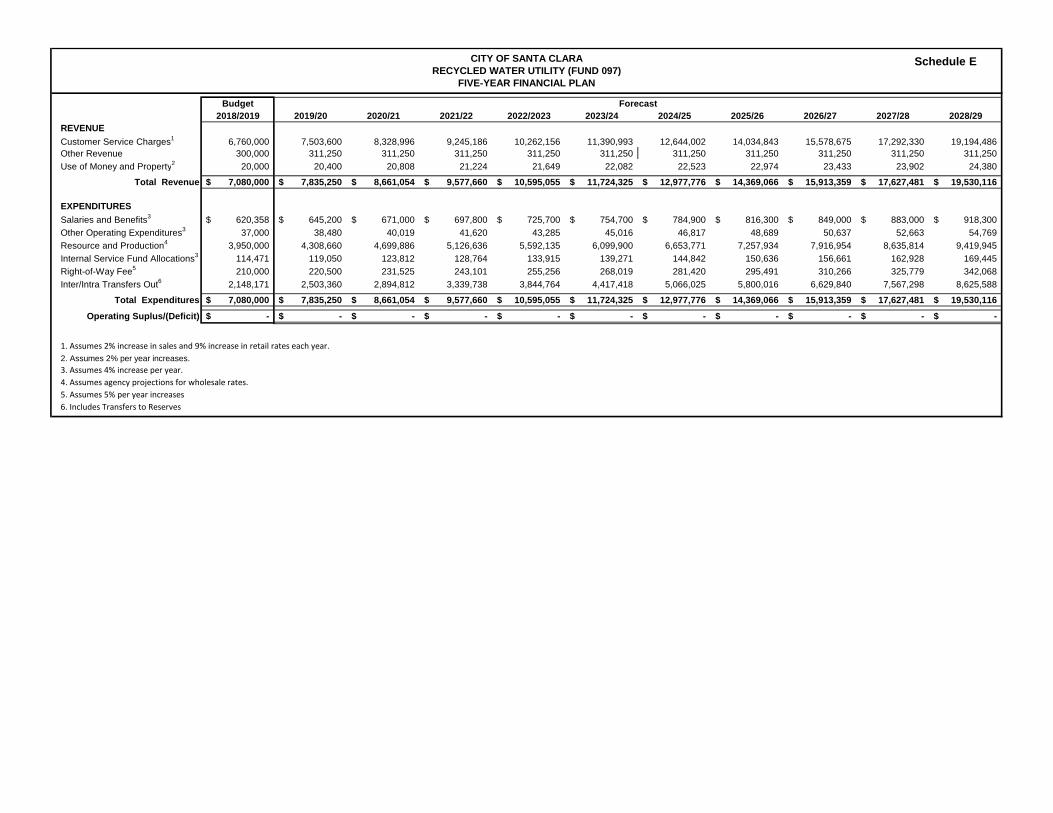
Budget2018/2019 2019/20 2020/21 2021/22 2022/2023 2023/24 2024/25 2025/26 2026/27 2027/28 2028/29
REVENUE
Customer Service Charges1 6,760,000 7,503,600 8,328,996 9,245,186 10,262,156 11,390,993 12,644,002 14,034,843 15,578,675 17,292,330 19,194,486 Other Revenue 300,000 311,250 311,250 311,250 311,250 311,250 311,250 311,250 311,250 311,250 311,250
Use of Money and Property2 20,000 20,400 20,808 21,224 21,649 22,082 22,523 22,974 23,433 23,902 24,380
Total Revenue 7,080,000$ 7,835,250$ 8,661,054$ 9,577,660$ 10,595,055$ 11,724,325$ 12,977,776$ 14,369,066$ 15,913,359$ 17,627,481$ 19,530,116$
EXPENDITURES
Salaries and Benefits3 620,358$ 645,200$ 671,000$ 697,800$ 725,700$ 754,700$ 784,900$ 816,300$ 849,000$ 883,000$ 918,300$
Other Operating Expenditures3 37,000 38,480 40,019 41,620 43,285 45,016 46,817 48,689 50,637 52,663 54,769
Resource and Production4 3,950,000 4,308,660 4,699,886 5,126,636 5,592,135 6,099,900 6,653,771 7,257,934 7,916,954 8,635,814 9,419,945
Internal Service Fund Allocations3 114,471 119,050 123,812 128,764 133,915 139,271 144,842 150,636 156,661 162,928 169,445
Right-of-Way Fee5 210,000 220,500 231,525 243,101 255,256 268,019 281,420 295,491 310,266 325,779 342,068
Inter/Intra Transfers Out6 2,148,171 2,503,360 2,894,812 3,339,738 3,844,764 4,417,418 5,066,025 5,800,016 6,629,840 7,567,298 8,625,588
Total Expenditures 7,080,000$ 7,835,250$ 8,661,054$ 9,577,660$ 10,595,055$ 11,724,325$ 12,977,776$ 14,369,066$ 15,913,359$ 17,627,481$ 19,530,116$
Operating Suplus/(Deficit) -$ -$ -$ -$ -$ -$ -$ -$ -$ -$ -$
6. Includes Transfers to Reserves
3. Assumes 4% increase per year.4. Assumes agency projections for wholesale rates.5. Assumes 5% per year increases
1. Assumes 2% increase in sales and 9% increase in retail rates each year.2. Assumes 2% per year increases.
CITY OF SANTA CLARARECYCLED WATER UTILITY (FUND 097)
FIVE-YEAR FINANCIAL PLAN
Forecast
Schedule E

Budget2018/19 2019/20 2020/21 2021/22 2022/23 2023/24 2024/25 2025/26 2026/27 2027/28 2028/29
REVENUE
Sales-Facilities1 250,000$ 258,000$ 266,256$ 274,776$ 283,569$ 292,643$ 302,008$ 311,672$ 321,646$ 331,938$ 342,560$
Sales-Labor2 250,000 258,000 266,256 274,776 283,569 292,643 302,008 311,672 321,646 331,938 342,560
Sales-Material3 100,000 103,200 106,502 109,910 113,428 117,057 120,803 124,669 128,658 132,775 137,024
Operating Transfers4 31,150 32,147 33,175 34,237 35,333 36,463 37,630 38,834 40,077 41,360 42,683
General Fund Subsidy5 618,082 651,587 682,847 707,208 732,437 758,564 785,621 813,642 842,660 872,710 903,831
Total Revenue 1,249,232$ 1,302,934$ 1,355,037$ 1,400,908$ 1,448,336$ 1,497,371$ 1,548,070$ 1,600,489$ 1,654,686$ 1,710,722$ 1,768,659$
EXPENDITURESSalaries and Benefits 762,580$ 800,709$ 836,741$ 866,027$ 896,338$ 927,710$ 960,179$ 993,786$ 1,028,568$ 1,064,568$ 1,101,828$ Other Operating Expenditures 268,143 276,724 285,579 294,717 304,148 313,881 323,925 334,291 344,988 356,028 367,421 Internal Service Fund Allocations 189,509 195,573 201,832 208,290 214,956 221,834 228,933 236,259 243,819 251,621 259,673 Capital Outlay 29,000 29,928 30,886 31,874 32,894 33,947 35,033 36,154 37,311 38,505 39,737
Total Expenditures 1,249,232$ 1,302,934$ 1,355,037$ 1,400,908$ 1,448,336$ 1,497,371$ 1,548,070$ 1,600,489$ 1,654,686$ 1,710,722$ 1,768,659$
Operating Suplus/(Deficit) -$ -$ -$ -$ -$ -$ -$ -$ -$ -$ -$
1. Pre-need sales throughout the Park (primarily internment rights).2. Fees for labor services related to internment3. Sales of burial materials4. Transfers from Endowment Fund of interest earnings to be used for operations 5. Loan from Budget Stabilization Fund to cover revenue shortfalls.
CITY OF SANTA CLARACEMETERY (FUND 093)
TEN-YEAR FINANCIAL PLAN
Forecast
Schedule F