Embed Size (px)
DESCRIPTION
How much are tenants paying in deposits? Why are tenants and landlords in dispute? Are landlords complying with the law? Just some of the questions answered in the Tenancy Deposit Schemes regular Digest of Statistics. This edition contains figures up to March 2014. http://www.tds.gb.com
Citation preview
a digest of statisticsto March 2014 Steve Harriott, Chief Executive July 2014
Tenancy Deposit Protection in England & Wales
3
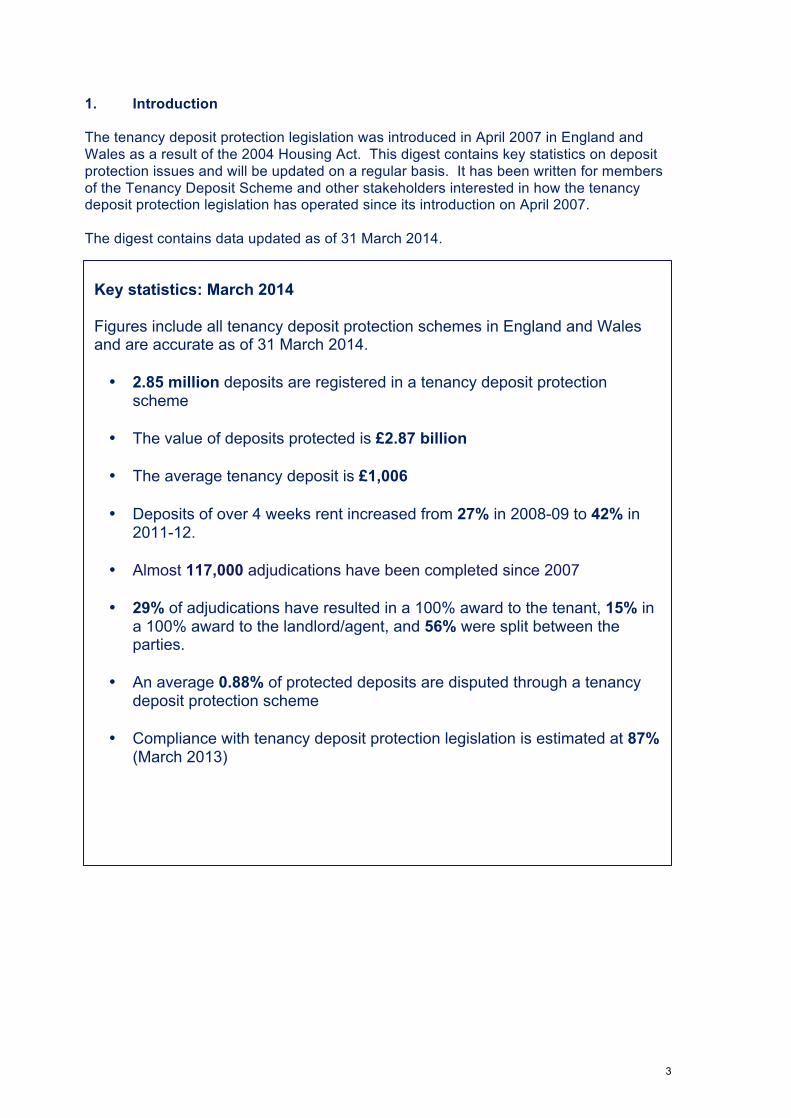
1. Introduction The tenancy deposit protection legislation was introduced in April 2007 in England and Wales as a result of the 2004 Housing Act. This digest contains key statistics on deposit protection issues and will be updated on a regular basis. It has been written for members of the Tenancy Deposit Scheme and other stakeholders interested in how the tenancy deposit protection legislation has operated since its introduction on April 2007. The digest contains data updated as of 31 March 2014.
Key statistics: March 2014 Figures include all tenancy deposit protection schemes in England and Wales and are accurate as of 31 March 2014. • 2.85 million deposits are registered in a tenancy deposit protection
scheme
• The value of deposits protected is £2.87 billion
• The average tenancy deposit is £1,006
• Deposits of over 4 weeks rent increased from 27% in 2008-09 to 42% in 2011-12.
• Almost 117,000 adjudications have been completed since 2007
• 29% of adjudications have resulted in a 100% award to the tenant, 15% in a 100% award to the landlord/agent, and 56% were split between the parties.
• An average 0.88% of protected deposits are disputed through a tenancy
deposit protection scheme
• Compliance with tenancy deposit protection legislation is estimated at 87% (March 2013)
4
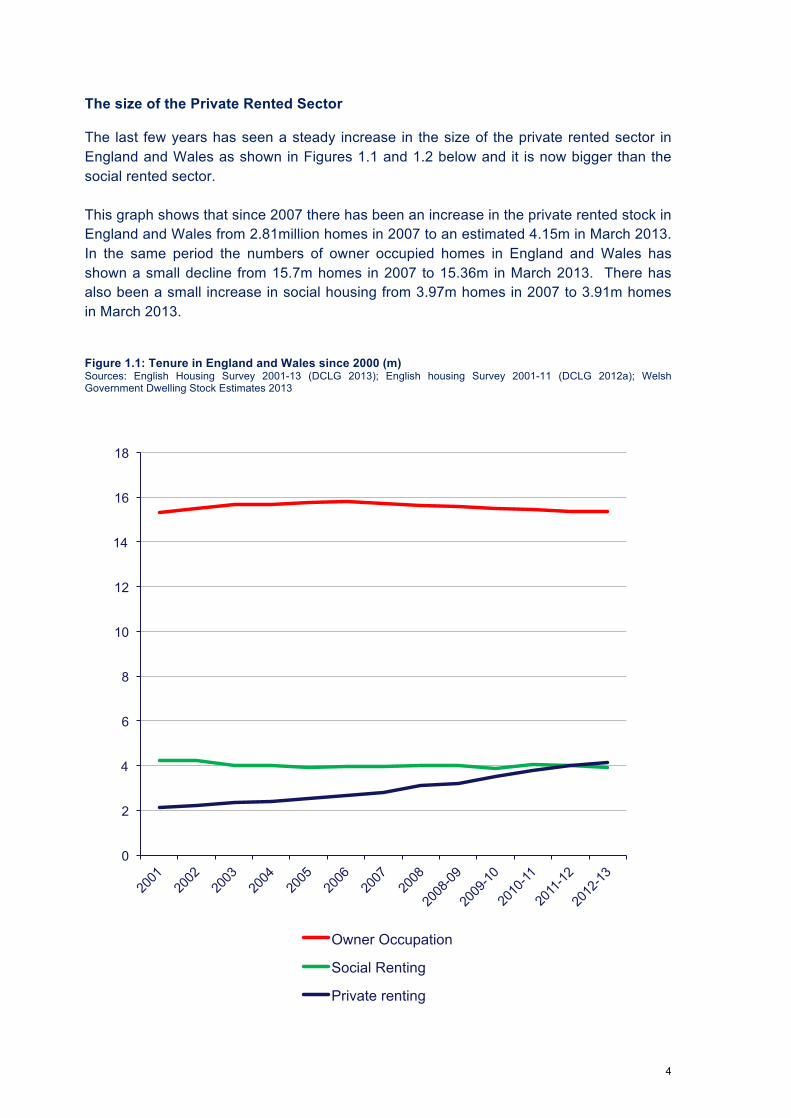
The size of the Private Rented Sector The last few years has seen a steady increase in the size of the private rented sector in England and Wales as shown in Figures 1.1 and 1.2 below and it is now bigger than the social rented sector. This graph shows that since 2007 there has been an increase in the private rented stock in England and Wales from 2.81million homes in 2007 to an estimated 4.15m in March 2013. In the same period the numbers of owner occupied homes in England and Wales has shown a small decline from 15.7m homes in 2007 to 15.36m in March 2013. There has also been a small increase in social housing from 3.97m homes in 2007 to 3.91m homes in March 2013. Figure 1.1: Tenure in England and Wales since 2000 (m) Sources: English Housing Survey 2001-13 (DCLG 2013); English housing Survey 2001-11 (DCLG 2012a); Welsh Government Dwelling Stock Estimates 2013
0
2
4
6
8
10
12
14
16
18
Owner Occupation
Social Renting
Private renting
5
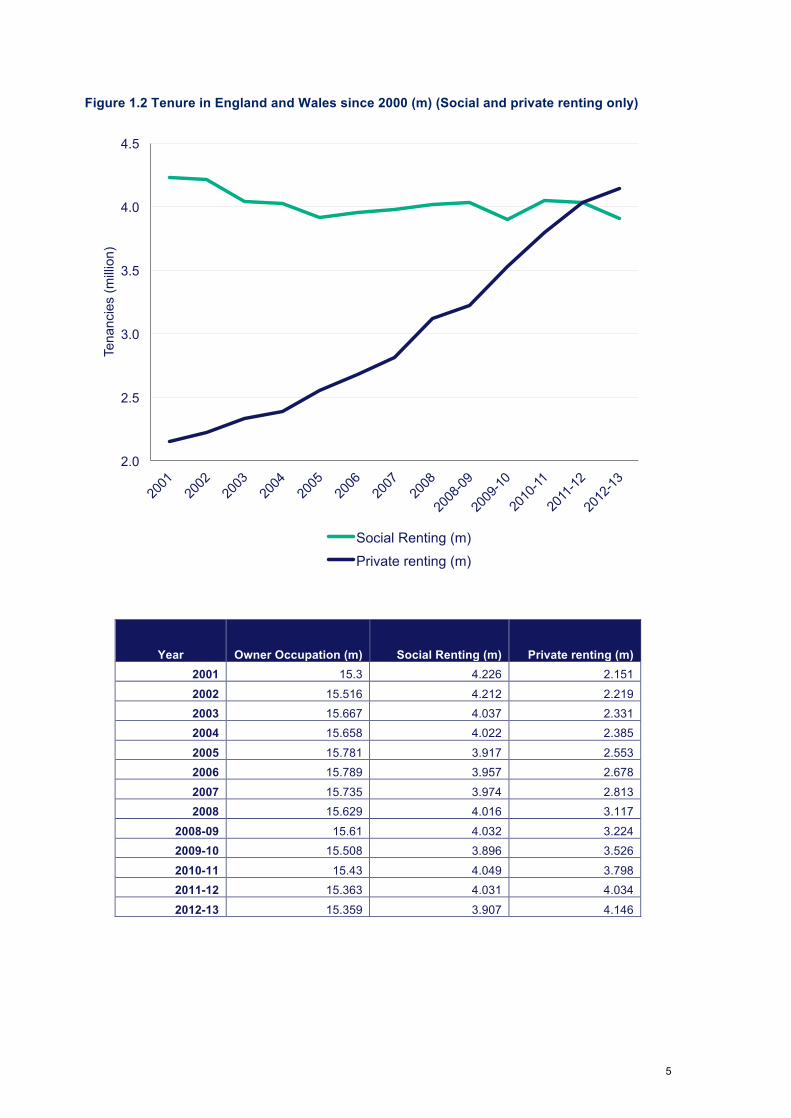
Figure 1.2 Tenure in England and Wales since 2000 (m) (Social and private renting only)
2.0
2.5
3.0
3.5
4.0
4.5
Tena
ncie
s (m
illio
n)
Social Renting (m)
Private renting (m)
Year Owner Occupation (m) Social Renting (m) Private renting (m) 2001 15.3 4.226 2.151
2002 15.516 4.212 2.219 2003 15.667 4.037 2.331 2004 15.658 4.022 2.385
2005 15.781 3.917 2.553 2006 15.789 3.957 2.678
2007 15.735 3.974 2.813 2008 15.629 4.016 3.117
2008-09 15.61 4.032 3.224 2009-10 15.508 3.896 3.526
2010-11 15.43 4.049 3.798 2011-12 15.363 4.031 4.034
2012-13 15.359 3.907 4.146
6
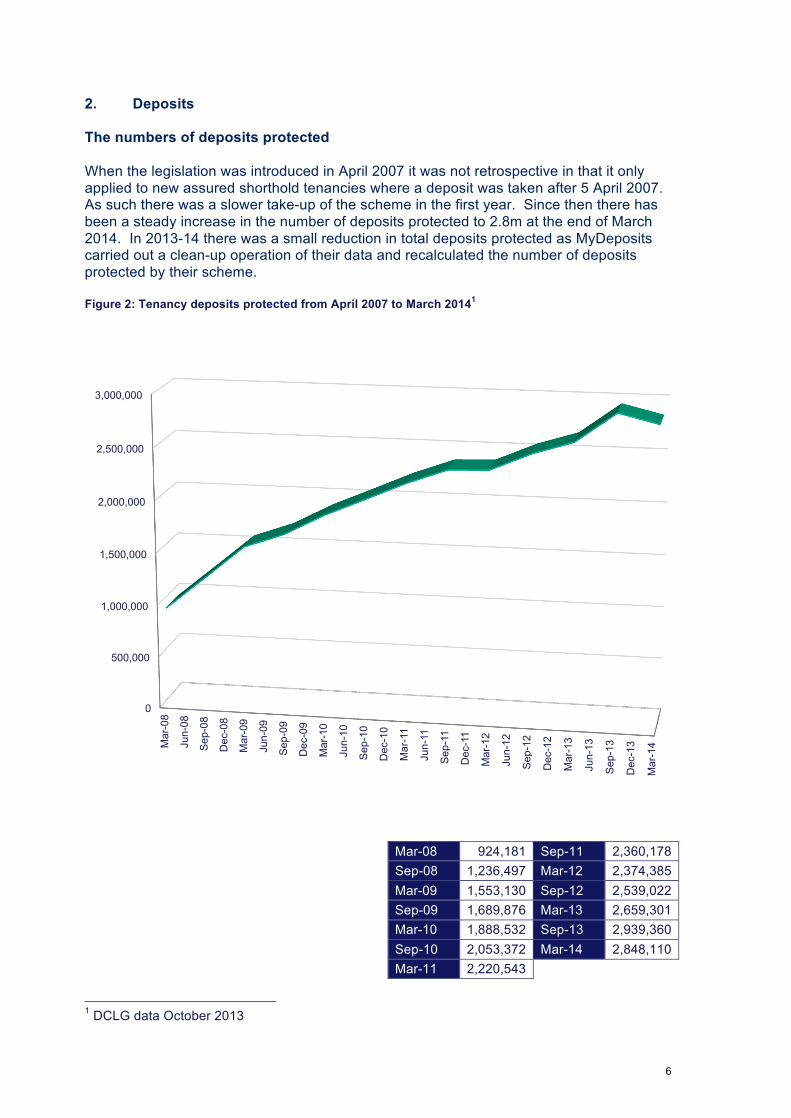
2. Deposits The numbers of deposits protected When the legislation was introduced in April 2007 it was not retrospective in that it only applied to new assured shorthold tenancies where a deposit was taken after 5 April 2007. As such there was a slower take-up of the scheme in the first year. Since then there has been a steady increase in the number of deposits protected to 2.8m at the end of March 2014. In 2013-14 there was a small reduction in total deposits protected as MyDeposits carried out a clean-up operation of their data and recalculated the number of deposits protected by their scheme. Figure 2: Tenancy deposits protected from April 2007 to March 20141
Mar-08 924,181 Sep-11 2,360,178 Sep-08 1,236,497 Mar-12 2,374,385 Mar-09 1,553,130 Sep-12 2,539,022 Sep-09 1,689,876 Mar-13 2,659,301 Mar-10 1,888,532 Sep-13 2,939,360 Sep-10 2,053,372 Mar-14 2,848,110 Mar-11 2,220,543
1 DCLG data October 2013
0
500,000
1,000,000
1,500,000
2,000,000
2,500,000
3,000,000
Mar
-08
Jun-
08
Sep
-08
Dec
-08
Mar
-09
Jun-
09
Sep
-09
Dec
-09
Mar
-10
Jun-
10
Sep
-10
Dec
-10
Mar
-11
Jun-
11
Sep
-11
Dec
-11
Mar
-12
Jun-
12
Sep
-12
Dec
-12
Mar
-13
Jun-
13
Sep
-13
Dec
-13
Mar
-14
7
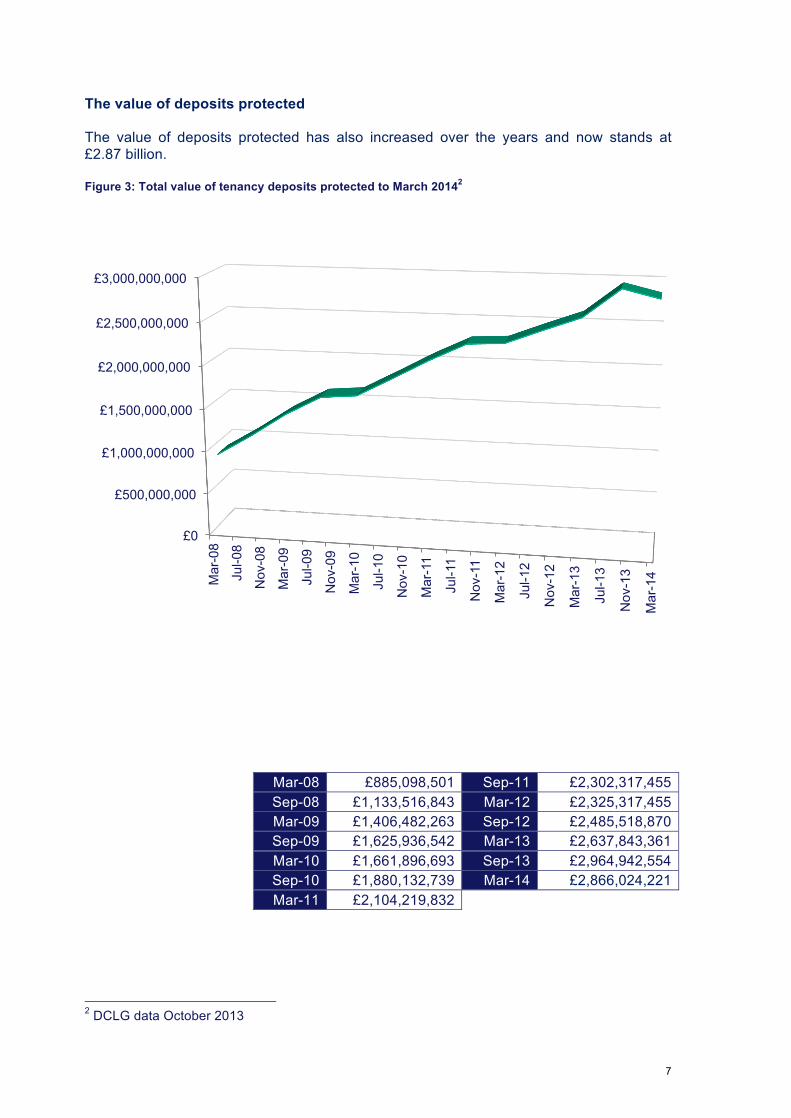
The value of deposits protected The value of deposits protected has also increased over the years and now stands at £2.87 billion. Figure 3: Total value of tenancy deposits protected to March 20142
2 DCLG data October 2013
£0
£500,000,000
£1,000,000,000
£1,500,000,000
£2,000,000,000
£2,500,000,000
£3,000,000,000
Mar
-08
Jul-0
8
Nov
-08
Mar
-09
Jul-0
9
Nov
-09
Mar
-10
Jul-1
0
Nov
-10
Mar
-11
Jul-1
1
Nov
-11
Mar
-12
Jul-1
2
Nov
-12
Mar
-13
Jul-1
3
Nov
-13
Mar
-14
Mar-08 £885,098,501 Sep-11 £2,302,317,455 Sep-08 £1,133,516,843 Mar-12 £2,325,317,455 Mar-09 £1,406,482,263 Sep-12 £2,485,518,870 Sep-09 £1,625,936,542 Mar-13 £2,637,843,361 Mar-10 £1,661,896,693 Sep-13 £2,964,942,554 Sep-10 £1,880,132,739 Mar-14 £2,866,024,221 Mar-11 £2,104,219,832
8
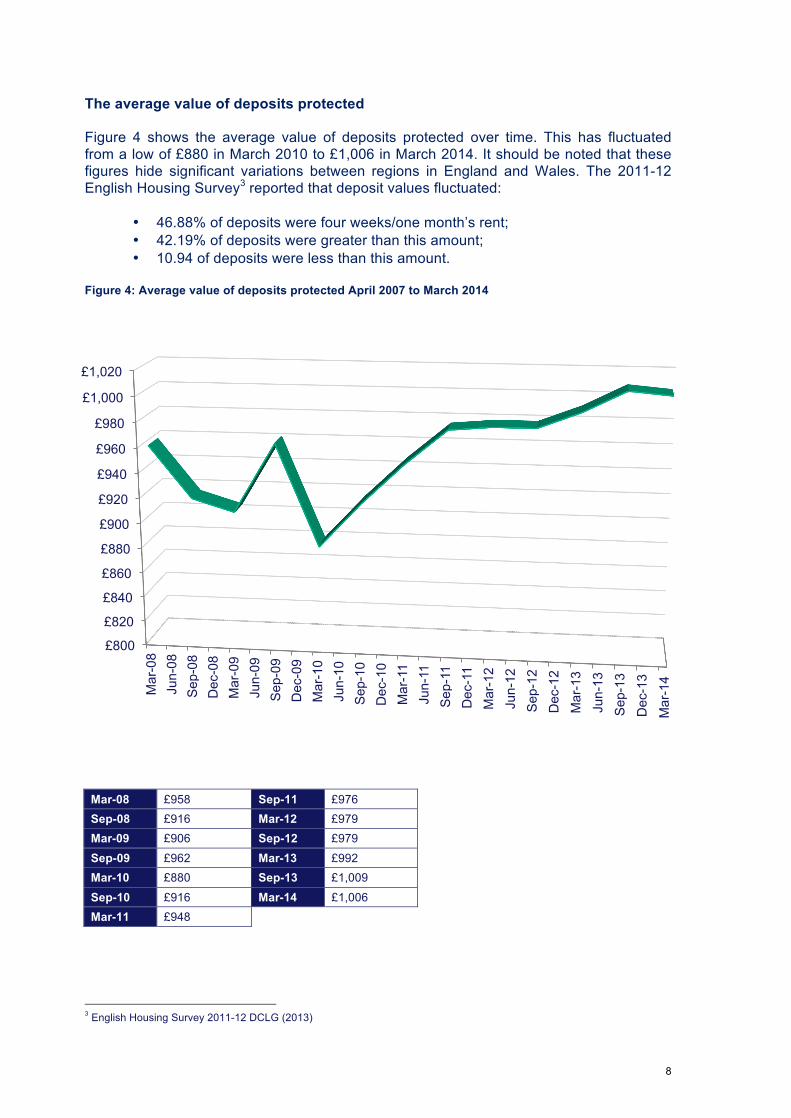
The average value of deposits protected Figure 4 shows the average value of deposits protected over time. This has fluctuated from a low of £880 in March 2010 to £1,006 in March 2014. It should be noted that these figures hide significant variations between regions in England and Wales. The 2011-12 English Housing Survey3 reported that deposit values fluctuated:
• 46.88% of deposits were four weeks/one month’s rent; • 42.19% of deposits were greater than this amount; • 10.94 of deposits were less than this amount.
Figure 4: Average value of deposits protected April 2007 to March 2014
Mar-08 £958 Sep-11 £976 Sep-08 £916 Mar-12 £979 Mar-09 £906 Sep-12 £979
Sep-09 £962 Mar-13 £992 Mar-10 £880 Sep-13 £1,009
Sep-10 £916 Mar-14 £1,006 Mar-11 £948
3 English Housing Survey 2011-12 DCLG (2013)
£800
£820
£840
£860
£880
£900
£920
£940
£960
£980
£1,000
£1,020
Mar
-08
Jun-
08
Sep
-08
Dec
-08
Mar
-09
Jun-
09
Sep
-09
Dec
-09
Mar
-10
Jun-
10
Sep
-10
Dec
-10
Mar
-11
Jun-
11
Sep
-11
Dec
-11
Mar
-12
Jun-
12
Sep
-12
Dec
-12
Mar
-13
Jun-
13
Sep
-13
Dec
-13
Mar
-14
9
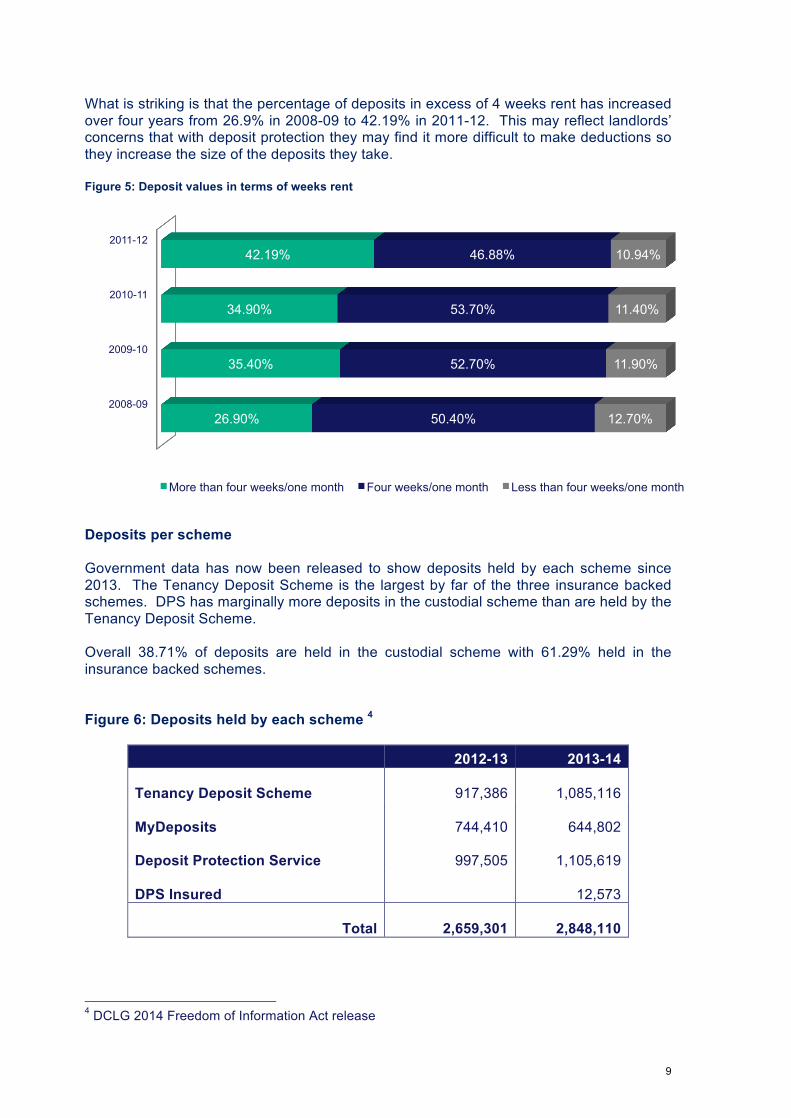
What is striking is that the percentage of deposits in excess of 4 weeks rent has increased over four years from 26.9% in 2008-09 to 42.19% in 2011-12. This may reflect landlords’ concerns that with deposit protection they may find it more difficult to make deductions so they increase the size of the deposits they take. Figure 5: Deposit values in terms of weeks rent
Deposits per scheme Government data has now been released to show deposits held by each scheme since 2013. The Tenancy Deposit Scheme is the largest by far of the three insurance backed schemes. DPS has marginally more deposits in the custodial scheme than are held by the Tenancy Deposit Scheme. Overall 38.71% of deposits are held in the custodial scheme with 61.29% held in the insurance backed schemes. Figure 6: Deposits held by each scheme 4
2012-13 2013-14
Tenancy Deposit Scheme
917,386
1,085,116
MyDeposits
744,410
644,802
Deposit Protection Service
997,505
1,105,619
DPS Insured
12,573
Total 2,659,301
2,848,110
4 DCLG 2014 Freedom of Information Act release
2008-09
2009-10
2010-11
2011-12
26.90%
35.40%
34.90%
42.19%
50.40%
52.70%
53.70%
46.88%
12.70%
11.90%
11.40%
10.94%
More than four weeks/one month Four weeks/one month Less than four weeks/one month
10
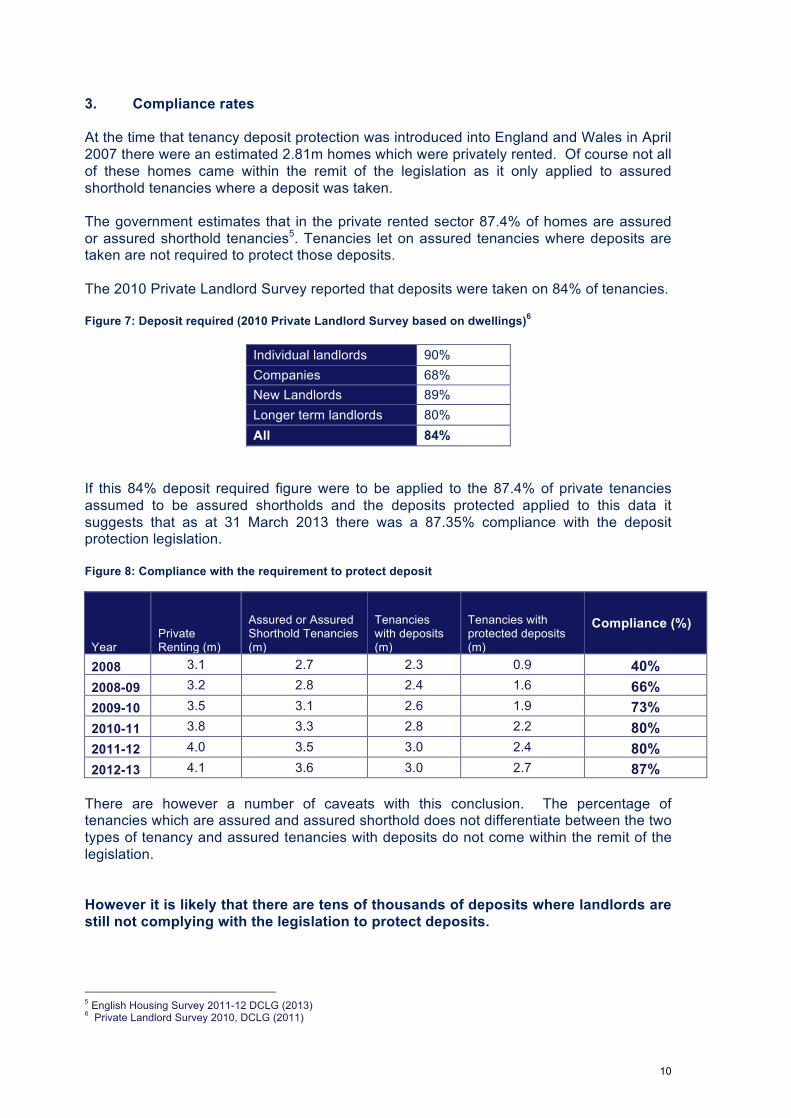
3. Compliance rates At the time that tenancy deposit protection was introduced into England and Wales in April 2007 there were an estimated 2.81m homes which were privately rented. Of course not all of these homes came within the remit of the legislation as it only applied to assured shorthold tenancies where a deposit was taken. The government estimates that in the private rented sector 87.4% of homes are assured or assured shorthold tenancies5. Tenancies let on assured tenancies where deposits are taken are not required to protect those deposits. The 2010 Private Landlord Survey reported that deposits were taken on 84% of tenancies. Figure 7: Deposit required (2010 Private Landlord Survey based on dwellings)6
Individual landlords 90% Companies 68% New Landlords 89% Longer term landlords 80% All 84%
If this 84% deposit required figure were to be applied to the 87.4% of private tenancies assumed to be assured shortholds and the deposits protected applied to this data it suggests that as at 31 March 2013 there was a 87.35% compliance with the deposit protection legislation. Figure 8: Compliance with the requirement to protect deposit
Year Private Renting (m)
Assured or Assured Shorthold Tenancies (m)
Tenancies with deposits (m)
Tenancies with protected deposits (m)
Compliance (%)
2008 3.1 2.7 2.3 0.9 40% 2008-09 3.2 2.8 2.4 1.6 66% 2009-10 3.5 3.1 2.6 1.9 73% 2010-11 3.8 3.3 2.8 2.2 80% 2011-12 4.0 3.5 3.0 2.4 80% 2012-13 4.1 3.6 3.0 2.7 87%
There are however a number of caveats with this conclusion. The percentage of tenancies which are assured and assured shorthold does not differentiate between the two types of tenancy and assured tenancies with deposits do not come within the remit of the legislation. However it is likely that there are tens of thousands of deposits where landlords are still not complying with the legislation to protect deposits. 5 English Housing Survey 2011-12 DCLG (2013) 6 Private Landlord Survey 2010, DCLG (2011)
11
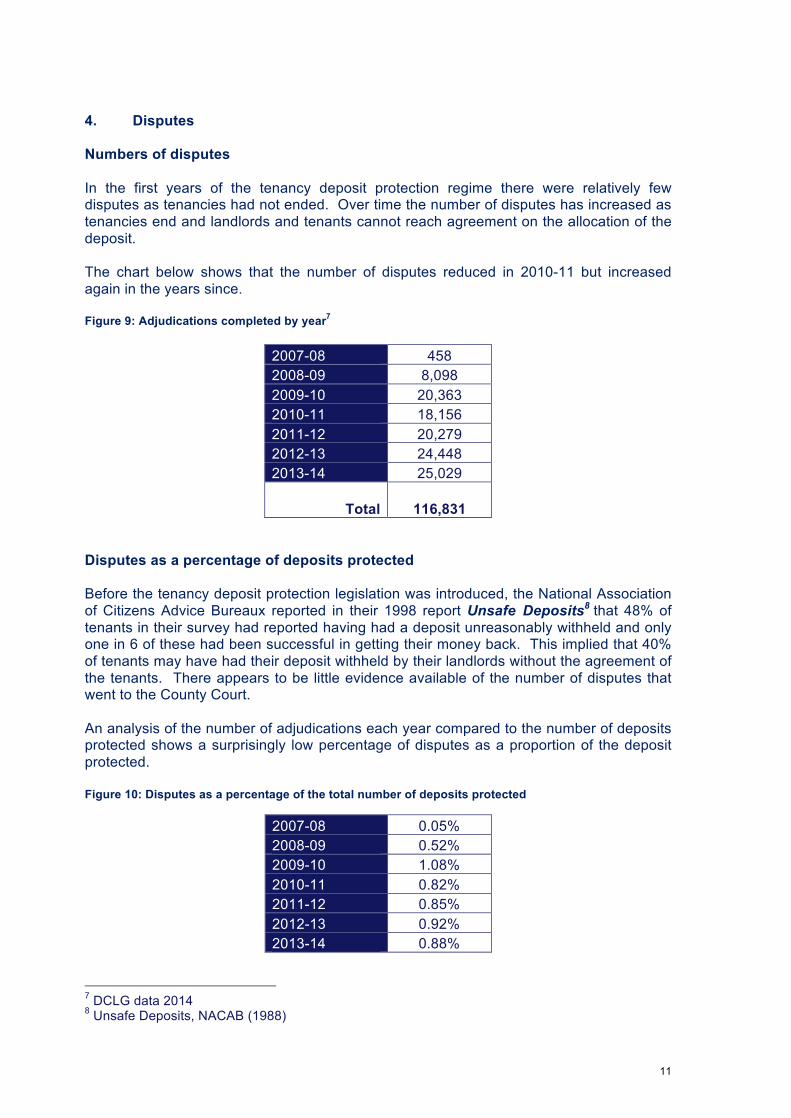
4. Disputes Numbers of disputes In the first years of the tenancy deposit protection regime there were relatively few disputes as tenancies had not ended. Over time the number of disputes has increased as tenancies end and landlords and tenants cannot reach agreement on the allocation of the deposit. The chart below shows that the number of disputes reduced in 2010-11 but increased again in the years since. Figure 9: Adjudications completed by year7
2007-08 458 2008-09 8,098 2009-10 20,363 2010-11 18,156 2011-12 20,279 2012-13 24,448 2013-14 25,029
Total 116,831 Disputes as a percentage of deposits protected Before the tenancy deposit protection legislation was introduced, the National Association of Citizens Advice Bureaux reported in their 1998 report Unsafe Deposits8 that 48% of tenants in their survey had reported having had a deposit unreasonably withheld and only one in 6 of these had been successful in getting their money back. This implied that 40% of tenants may have had their deposit withheld by their landlords without the agreement of the tenants. There appears to be little evidence available of the number of disputes that went to the County Court. An analysis of the number of adjudications each year compared to the number of deposits protected shows a surprisingly low percentage of disputes as a proportion of the deposit protected. Figure 10: Disputes as a percentage of the total number of deposits protected
2007-08 0.05% 2008-09 0.52% 2009-10 1.08% 2010-11 0.82% 2011-12 0.85% 2012-13 0.92% 2013-14 0.88%
7 DCLG data 2014 8 Unsafe Deposits, NACAB (1988)
12
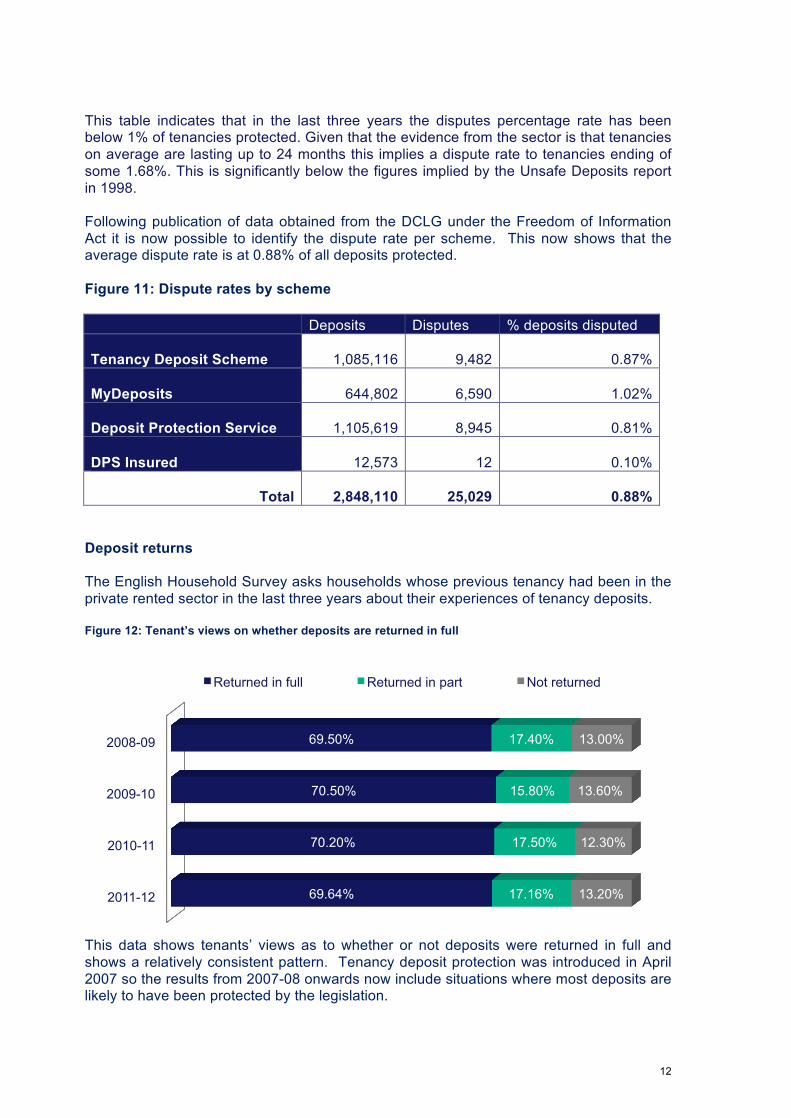
This table indicates that in the last three years the disputes percentage rate has been below 1% of tenancies protected. Given that the evidence from the sector is that tenancies on average are lasting up to 24 months this implies a dispute rate to tenancies ending of some 1.68%. This is significantly below the figures implied by the Unsafe Deposits report in 1998. Following publication of data obtained from the DCLG under the Freedom of Information Act it is now possible to identify the dispute rate per scheme. This now shows that the average dispute rate is at 0.88% of all deposits protected. Figure 11: Dispute rates by scheme Deposits Disputes % deposits disputed
Tenancy Deposit Scheme
1,085,116
9,482 0.87%
MyDeposits
644,802
6,590 1.02%
Deposit Protection Service
1,105,619
8,945 0.81%
DPS Insured
12,573
12 0.10%
Total
2,848,110
25,029 0.88% Deposit returns The English Household Survey asks households whose previous tenancy had been in the private rented sector in the last three years about their experiences of tenancy deposits. Figure 12: Tenant’s views on whether deposits are returned in full
This data shows tenants’ views as to whether or not deposits were returned in full and shows a relatively consistent pattern. Tenancy deposit protection was introduced in April 2007 so the results from 2007-08 onwards now include situations where most deposits are likely to have been protected by the legislation.
2011-12
2010-11
2009-10
2008-09
69.64%
70.20%
70.50%
69.50%
17.16%
17.50%
15.80%
17.40%
13.20%
12.30%
13.60%
13.00%
Returned in full Returned in part Not returned
13
56%
48%
22%
27%
23%
25%
Landlord should not have withheld any of the deposit
Landlord justified in withholding some of the deposit
Landlord justified in withholding as much of the deposit as they did
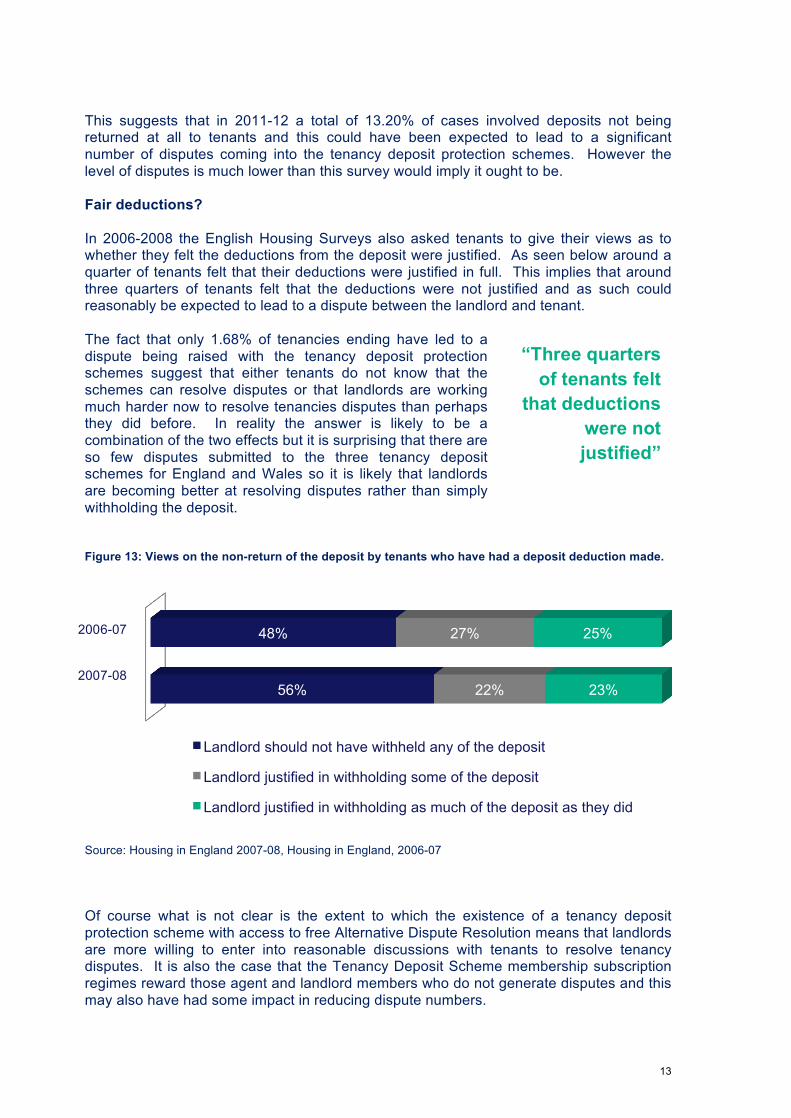
This suggests that in 2011-12 a total of 13.20% of cases involved deposits not being returned at all to tenants and this could have been expected to lead to a significant number of disputes coming into the tenancy deposit protection schemes. However the level of disputes is much lower than this survey would imply it ought to be. Fair deductions? In 2006-2008 the English Housing Surveys also asked tenants to give their views as to whether they felt the deductions from the deposit were justified. As seen below around a quarter of tenants felt that their deductions were justified in full. This implies that around three quarters of tenants felt that the deductions were not justified and as such could reasonably be expected to lead to a dispute between the landlord and tenant. The fact that only 1.68% of tenancies ending have led to a dispute being raised with the tenancy deposit protection schemes suggest that either tenants do not know that the schemes can resolve disputes or that landlords are working much harder now to resolve tenancies disputes than perhaps they did before. In reality the answer is likely to be a combination of the two effects but it is surprising that there are so few disputes submitted to the three tenancy deposit schemes for England and Wales so it is likely that landlords are becoming better at resolving disputes rather than simply withholding the deposit. Figure 13: Views on the non-return of the deposit by tenants who have had a deposit deduction made. Source: Housing in England 2007-08, Housing in England, 2006-07 Of course what is not clear is the extent to which the existence of a tenancy deposit protection scheme with access to free Alternative Dispute Resolution means that landlords are more willing to enter into reasonable discussions with tenants to resolve tenancy disputes. It is also the case that the Tenancy Deposit Scheme membership subscription regimes reward those agent and landlord members who do not generate disputes and this may also have had some impact in reducing dispute numbers.
2006-07 2007-08
“Three quarters of tenants felt
that deductions were not justified”
14
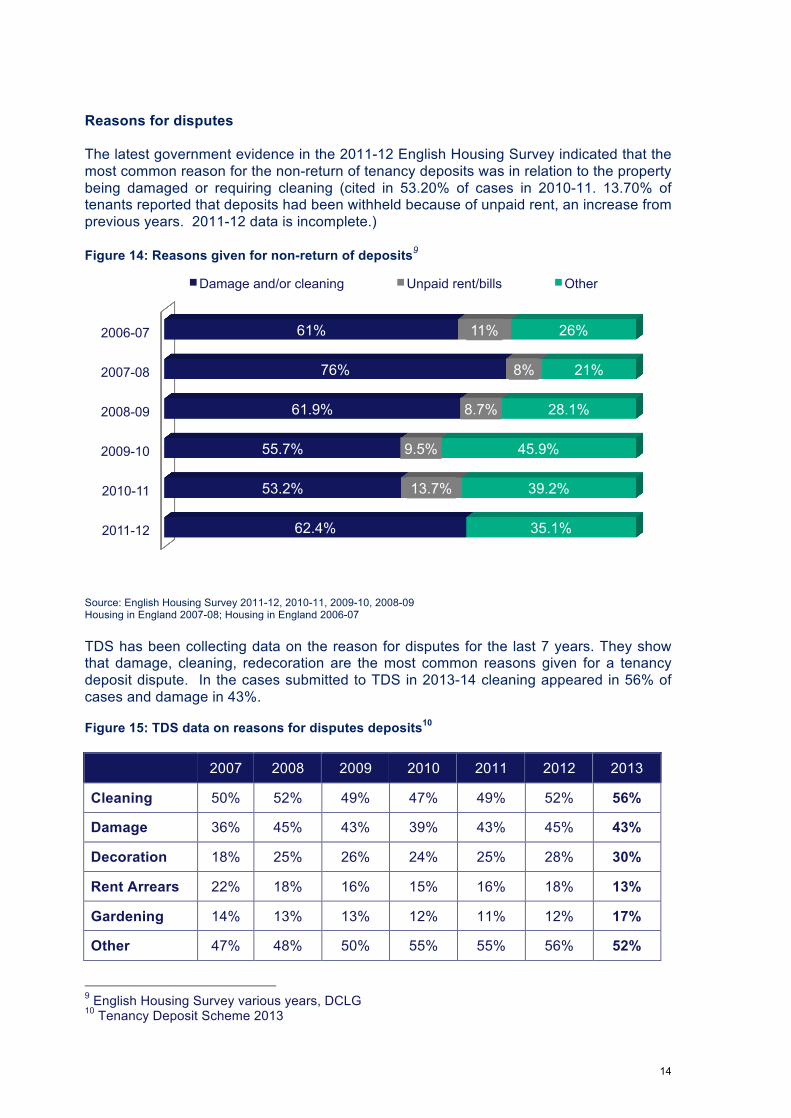
Reasons for disputes The latest government evidence in the 2011-12 English Housing Survey indicated that the most common reason for the non-return of tenancy deposits was in relation to the property being damaged or requiring cleaning (cited in 53.20% of cases in 2010-11. 13.70% of tenants reported that deposits had been withheld because of unpaid rent, an increase from previous years. 2011-12 data is incomplete.) Figure 14: Reasons given for non-return of deposits9
Source: English Housing Survey 2011-12, 2010-11, 2009-10, 2008-09 Housing in England 2007-08; Housing in England 2006-07 TDS has been collecting data on the reason for disputes for the last 7 years. They show that damage, cleaning, redecoration are the most common reasons given for a tenancy deposit dispute. In the cases submitted to TDS in 2013-14 cleaning appeared in 56% of cases and damage in 43%. Figure 15: TDS data on reasons for disputes deposits10 2007 2008 2009 2010 2011 2012 2013
Cleaning 50% 52% 49% 47% 49% 52% 56%
Damage 36% 45% 43% 39% 43% 45% 43%
Decoration 18% 25% 26% 24% 25% 28% 30%
Rent Arrears 22% 18% 16% 15% 16% 18% 13%
Gardening 14% 13% 13% 12% 11% 12% 17%
Other 47% 48% 50% 55% 55% 56% 52%
9 English Housing Survey various years, DCLG 10 Tenancy Deposit Scheme 2013
2011-12
2010-11
2009-10
2008-09
2007-08
2006-07
62.4%
53.2%
55.7%
61.9%
76%
61%
13.7%
9.5%
8.7%
8%
11%
35.1%
39.2%
45.9%
28.1%
21%
26%
Damage and/or cleaning Unpaid rent/bills Other
15
In order to minimize disputes coming through to The Tenancy Deposit Scheme detailed guides have been produced to show the action which landlords and agents need to take to avoid disputes: Cleaning, damage, decoration: Have a good inventory, check in and check out report
backed up with photos, video and signed off by the tenant.
Rent arrears: Produce an accurate rent statement showing dates of
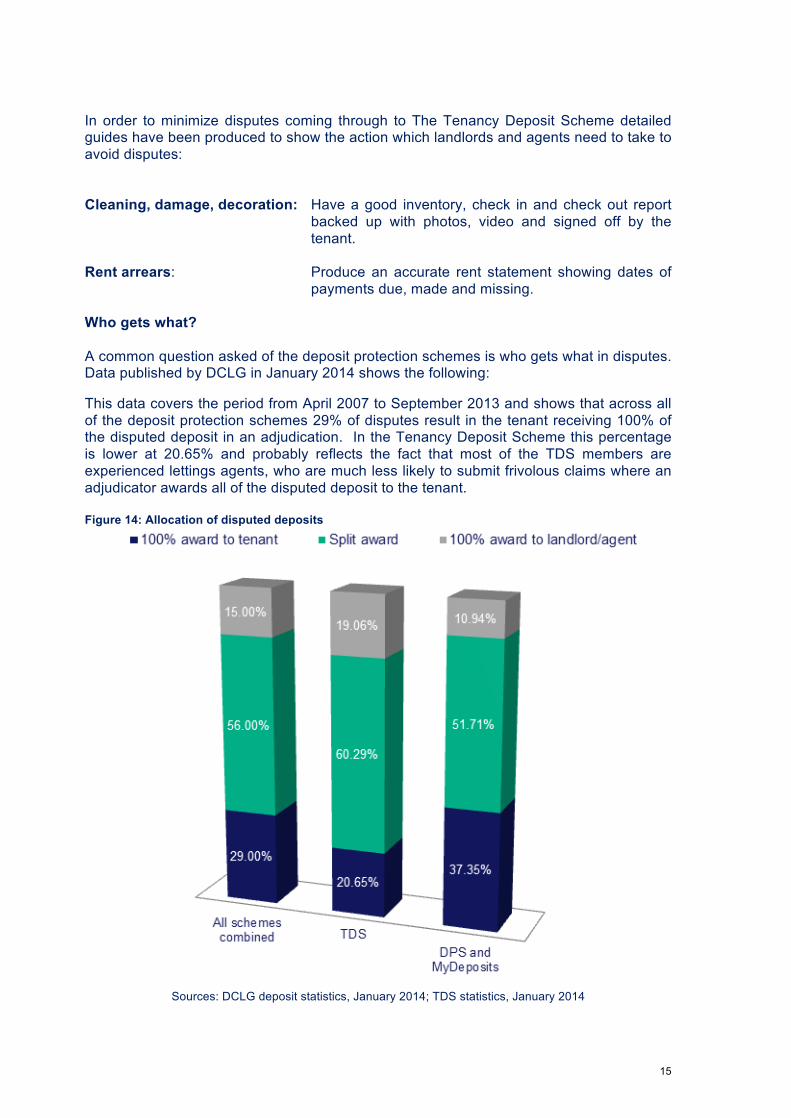
payments due, made and missing. Who gets what? A common question asked of the deposit protection schemes is who gets what in disputes. Data published by DCLG in January 2014 shows the following:
This data covers the period from April 2007 to September 2013 and shows that across all of the deposit protection schemes 29% of disputes result in the tenant receiving 100% of the disputed deposit in an adjudication. In the Tenancy Deposit Scheme this percentage is lower at 20.65% and probably reflects the fact that most of the TDS members are experienced lettings agents, who are much less likely to submit frivolous claims where an adjudicator awards all of the disputed deposit to the tenant. Figure 14: Allocation of disputed deposits
Sources: DCLG deposit statistics, January 2014; TDS statistics, January 2014

Contact details:
Tenancy Deposit Scheme PO Box 1255 Hemel Hempstead Herts HP1 9GN
Telephone: 0845 226 7837
Fax: 01442 253193
E-mail: [email protected]
Web: www.tds.gb.com
Revised February 2014 © The Dispute Service Limited 2014