Embed Size (px)
Citation preview

UNITED STATESSECURITIES AND EXCHANGE COMMISSION
Washington, D.C. 20549
FORM 10-K(Mark One)
[ üü]ANNUAL REPORT PURSUANT TO SECTION 13 OR 15(d) OF THE SECURITIES EXCHANGE ACT OF 1934For the fiscal year ended December 31, 2017
OR [ ] TRANSITION REPORT PURSUANT TO SECTION 13 OR 15(d) OF THE SECURITIES EXCHANGE ACT OF 1934
For the transition period from __________ to __________.
Commission File Number 001-16191
TENNANT COMPANY(Exact name of registrant as specified in its charter)
Minnesota 41-0572550State or other jurisdiction of (I.R.S. Employerincorporation or organization Identification No.)
701 North Lilac Drive, P.O. Box 1452Minneapolis, Minnesota 55440
(Address of principal executive offices) (Zip Code)
Registrant’s telephone number, including area code 763-540-1200
Securities registered pursuant to Section 12(b) of the Act:
Title of each class Name of exchange on which registered
Common Stock, par value $0.375 per share New York Stock Exchange
Securities registered pursuant to Section 12(g) of the Act: None
Indicate by check mark if the registrant is a well-known seasoned issuer, as defined by Rule 405 of the Securities Act. üü Yes No
Indicate by check mark if the registrant is not required to file reports pursuant to Section 13 or Section 15(d) of the Act. Yes üü NoIndicate by check mark whether the registrant (1) has filed all reports required to be filed by Section 13 or 15(d) of the Securities Exchange Actof 1934 during the preceding 12 months (or for such shorter period that the registrant was required to file such reports), and (2) has beensubject to such filing requirements for the past 90 days. üü Yes NoIndicate by check mark whether the registrant has submitted electronically and posted on its corporate Web site, if any, every Interactive DataFile required to be submitted and posted pursuant to Rule 405 of Regulation S-T (§232.405 of this chapter) during the preceding 12 months (orfor such shorter period that the registrant was required to submit and post such files). üü Yes NoIndicate by check mark if disclosure of delinquent filers pursuant to Item 405 of Regulation S-K (§229.405 of this chapter) is not containedherein, and will not be contained, to the best of registrant’s knowledge, in definitive proxy or information statements incorporated by referencein Part III of this Form 10-K or any amendment to this Form 10-K. [ ]
1

Indicate by check mark whether the registrant is a large accelerated filer, an accelerated filer, a non-accelerated filer, or a smaller reporting company, or emerging growthcompany. See definitions of “large accelerated filer,” "accelerated filer," "smaller reporting company," and "emerging growth company" in Rule 12b-2 of the Exchange Act.
Large accelerated filer üü Accelerated filer
Non-accelerated filer (Do not check if a smaller reportingcompany) Smaller reporting company
Emerging growth company
If an emerging growth company, indicate by check mark if the registrant has elected not to use the extended transition period forcomplying with any new or revised financial accounting standards provided pursuant to Section 13(a) of the Exchange Act. [ ] Indicate by check mark whether the registrant is a shell company (as defined in Rule 12b-2 of the Act). Yes üü NoThe aggregate market value of the voting and non-voting common equity held by non-affiliates as of June 30, 2017, was $1,292,419,327.As of January 31, 2018, there were 17,881,327 shares of Common Stock outstanding.
DOCUMENTS INCORPORATED BY REFERENCE
Portions of the registrant’s Proxy Statement for its 2018 annual meeting of shareholders (the “2018 Proxy Statement”) are incorporated by reference in Part III.
2

Tennant CompanyForm 10–K
Table of Contents
PART I Page Item 1 Business 4 Item 1A Risk Factors 6
Item 1B Unresolved Staff Comments 9
Item 2 Properties 9
Item 3 Legal Proceedings 9
Item 4 Mine Safety Disclosures 9PART II Item 5 Market for Registrant's Common Equity, Related Shareholder Matters and Issuer Purchases of Equity Securities 10 Item 6 Selected Financial Data 12
Item 7 Management's Discussion and Analysis of Financial Condition and Results of Operations 13
Item 7A Quantitative and Qualitative Disclosures About Market Risk 23
Item 8 Financial Statements and Supplementary Data 25
Report of Independent Registered Public Accounting Firm 25
Consolidated Financial Statements 26
Consolidated Statements of Operations 26
Consolidated Statements of Comprehensive Income 27
Consolidated Balance Sheets 28
Consolidated Statements of Cash Flows 29
Consolidated Statements of Equity 31
Notes to the Consolidated Financial Statements 31
1 Summary of Significant Accounting Policies 32
2 Newly Adopted Accounting Pronouncements 35
3 Investment in Joint Venture 35
4 Management Actions 35
5 Acquisitions 35
6 Inventories 38
7 Property, Plant and Equipment 38
8 Goodwill and Intangible Assets 39
9 Debt 40
10 Other Current Liabilities 42
11 Derivatives 43
12 Fair Value Measurements 45
13 Retirement Benefit Plans 45
14 Shareholders' Equity 51
15 Commitments and Contingencies 51
16 Income Taxes 52
17 Share-Based Compensation 55
18 Earnings Per Share 57
19 Segment Reporting 57
20 Consolidated Quarterly Data (Unaudited) 58
21 Related Party Transactions 58
22 Separate Financial Information of Guarantor Subsidiaries 59
23 Subsequent Event 66 Item 9 Changes in and Disagreements with Accountants on Accounting and Financial Disclosure 67 Item 9A Controls and Procedures 67
Item 9B Other Information 68PART III Item 10 Directors, Executive Officers and Corporate Governance 68

Item 11 Executive Compensation 68
Item 12 Security Ownership of Certain Beneficial Owners and Management and Related Shareholder Matters 68
Item 13 Certain Relationships and Related Transactions, and Director Independence 68
Item 14 Principal Accountant Fees and Services 68PART IV Item 15 Exhibits and Financial Statement Schedules 69 Item 16 Form 10-K Summary 72
Signatures 73
3

Table of Contents
TENNANT COMPANY2017
ANNUAL REPORTForm 10–K
(Pursuant to Securities Exchange Act of 1934)PART I
ITEM 1 – BusinessGeneral Development of Business
Founded in 1870 by George H. Tennant, Tennant Company, a Minnesotacorporation incorporated in 1909, began as a one-man woodworking business, evolvedinto a successful wood flooring and wood products company, and eventually into amanufacturer of floor cleaning equipment. Throughout its history, Tennant hasremained focused on advancing our industry by aggressively pursuing newtechnologies and creating a culture that celebrates innovation.
Today, Tennant Company is a recognized leader of the cleaning industry. We arepassionate about developing innovative and sustainable solutions that help ourcustomers clean spaces more effectively, addressing indoor and outdoor cleaningchallenges. Tennant Company operates in three geographic business units includingthe Americas, Europe, Middle East and Africa (EMEA) and Asia Pacific (APAC). InApril 2017, Tennant Company completed its acquisition of the IPC Group, a multi-brand manufacturer of a broad range of cleaning and accessory equipment. Withprimary operations in Italy, the IPC Group significantly enhances Tennant's positionin the EMEA region and brings to Tennant a broader product offering.
Tennant Company is committed to empowering our customers to create acleaner, safer and healthier world with high-performance solutions that minimizewaste, reduce costs, improve safety and further sustainability goals.
Segment and Geographic Area Financial Information
The Company has one reportable business segment. Sales to customersgeographically located in the United States were $543.7 million, $525.3 million and$517.9 million for the years ended December 31, 2017 , 2016 and 2015 , respectively.Long-lived assets located in the United States were $108.0 and $109.2 million as ofthe years ended December 31, 2017 and 2016 , respectively. Additional financialinformation on the Company’s segment and geographic areas is provided throughoutItem 8 and Note 19 to the Consolidated Financial Statements.
Principal Products, Markets and Distribution
The Company offers products and solutions consisting of mechanized cleaningequipment, detergent-free and other sustainable cleaning technologies, aftermarketparts and consumables, equipment maintenance and repair service, specialty surfacecoatings, and business solutions such as financing, rental and leasing programs, andmachine-to-machine asset management solutions.
The Company's products are used in many types of environments including:Retail establishments, distribution centers, factories and warehouses, public venuessuch as arenas and stadiums, office buildings, schools and universities, hospitals andclinics, parking lots and streets, and more. The Company markets its offerings underthe following brands: Tennant ® , Nobles ® , Green Machines ™ , Alfa Uma EmpresaTennant ™ , IRIS ® , Superior Anodes, Waterstar and Orbio ® . Orbio Technologies,which markets and sells Orbio-branded products and solutions, is a group created bythe Company to focus on expanding the opportunities for the emerging category ofOn-Site Generation (OSG). OSG technologies create and dispense effective cleaningand antimicrobial solutions on site within a facility. Customers include contractcleaners to whom organizations outsource facilities maintenance, as well as businessesthat perform facilities maintenance themselves. The Company reaches these customersthrough the industry's largest direct sales and service organization and through astrong and well-supported network of authorized distributors worldwide.
In April 2017, the Company completed its acquisition of the IPC Group business("IPC"). IPC manufactures a complete range of commercial cleaning productsincluding mechanized cleaning equipment, wet & dry vacuum cleaners, cleaning tools& carts and high pressure washers. These products are sold into similar verticalmarket applications as those listed above, but also into office cleaning and hospitalityvertical markets through a global direct sales and service organization and network ofdistributors. IPC markets products and services under the following valued brands:IPC, Gansow, Vaclensa, Portotecnica, Soteco and private-label brands.
Raw Materials
The Company has not experienced any significant or unusual problems in theavailability of raw materials or other product components. The Company has sole-source vendors for certain components. A disruption in supply from such vendors maydisrupt the Company’s operations. However, the Company believes that it can findalternate sources in the event there is a disruption in supply from such vendors.
Intellectual Property
Although the Company considers that its patents, proprietary technologies andtrade secrets, customer relationships, licenses, trademarks, trade names and brandnames in the aggregate constitute a valuable asset, it does not regard its business asbeing materially dependent upon any single item or category of intellectual property.We take appropriate measures to protect our intellectual property to the extent suchintellectual property can be protected.
SeasonalityAlthough the Company’s business is not seasonal in the traditional sense, the
percentage of revenues in each quarter typically ranges from 22% to 28% of the totalyear. The first quarter tends to be at the low end of the range reflecting customers’initial slow ramp up of capital purchases and the Company’s efforts to close out ordersat the end of each year. The second and fourth quarters tend to be towards the high endof the range and the third quarter is typically in the middle of the range.
4

Table of Contents
Working CapitalThe Company funds operations through a combination of cash and cash
equivalents and cash flows from operations. Wherever possible, cash management iscentralized and intercompany financing is used to provide working capital tosubsidiaries as needed. In addition, credit facilities are available for additionalworking capital needs or investment opportunities.
Major Customers
The Company sells its products to a wide variety of customers, none of which areof material importance in relation to the business as a whole. The customer baseincludes several governmental entities which generally have terms similar to othercustomers.
Backlog
The Company processes orders within two weeks, on average. Therefore, nosignificant backlogs existed at December 31, 2017 and 2016 .
Competition
Public industry data concerning global market share is limited; however, throughan assessment of validated third party sources and sponsored third party marketstudies, the Company is confident in its position as a world-leading manufacturer offloor maintenance and cleaning equipment. Several global competitors compete withTennant in virtually every geography of the world. However, small regionalcompetitors are also significant competitors who vary by country, vertical market,product category or channel. The Company competes primarily on the basis ofoffering a broad line of high-quality, innovative products supported by an extensivesales and service network in major markets.
Research and Development
Tennant Company has a history of developing innovative technologies to create acleaner, safer, healthier world. The Company is committed to its innovation leadershipposition through fulfilling its goal to annually invest 3% to 4% of annual sales toresearch and development. The Company’s innovation efforts are focused on solvingour customers’ needs holistically addressing a broad array of issues, such as managinglabor costs, enhancing productivity, and making cleaning processes more efficient andsustainable. Through core product development, partnerships and technologyenablement we are creating new growth avenues for Tennant. These new avenues forgrowth go beyond cleaning equipment into business insights and service solutions. In2017 , 2016 and 2015 , the Company spent $32.0 million , $34.7 million and $32.4million on research and development, respectively.
Environmental Compliance
Compliance with Federal, State and local provisions which have been enacted oradopted regulating the discharge of materials into the environment, or otherwiserelating to the protection of the environment, has not had, and the Company does notexpect it to have, a material effect upon the Company’s capital expenditures, earningsor competitive position.
Employees
The Company employed approximately 4,300 people in worldwide operations asof December 31, 2017 .
Available Information
The Company makes available free of charge, through the Investor Relationswebsite at investors.tennantco.com, its annual report on Form 10-K, quarterly reportson Form 10-Q, current reports on Form 8-K and amendments to those reports filed orfurnished pursuant to Section 13(a) or 15(d) of the Exchange Act as soon asreasonably practicable when such material is filed electronically with, or furnished to,the Securities and Exchange Commission (“SEC”).
Executive Officers of the Registrant
The list below identifies those persons designated as executive officers of theCompany, including their age, positions held with the Company and their businessexperience during the past five or more years.
David W. Huml, Senior Vice President, EMEA, APAC and Global Marketing
David W. Huml (49) joined the Company in November 2014 as Senior VicePresident, Global Marketing. In January 2016, he also assumed oversight for theCompany's APAC business unit and in January 2017, he assumed oversight for theCompany's EMEA business. From 2006 to October 2014, he held various positionswith Pentair plc, a global manufacturer of water and fluid solutions, valves andcontrols, equipment protection and thermal management products, most recently asVice President, Applied Water Platform. From 1992 to 2006, he held various positionswith Graco Inc., a designer, manufacturer and marketer of systems and equipment tomove, measure, control, dispense and spray fluid and coating materials, includingWorldwide Director of Marketing, Contractor Equipment Division.
H. Chris Killingstad, President and Chief Executive Officer
H. Chris Killingstad (62) joined the Company in April 2002 as Vice President,North America and was named President and CEO in 2005. From 1990 to 2002, hewas employed by The Pillsbury Company, a consumer foods manufacturer. From1999 to 2002 he served as Senior Vice President and General Manager of FrozenProducts for Pillsbury North America; from 1996 to 1999 he served as Regional VicePresident and Managing Director of Pillsbury Europe, and from 1990 to 1996 wasRegional Vice President of Häagen-Dazs Asia Pacific. He held the position ofInternational Business Development Manager at PepsiCo Inc., from 1982-1990 andFinancial Manager for General Electric, from 1978-1980.
Carol E. McKnight, Senior Vice President, Chief Administrative Officer
Carol E. McKnight (50) joined the Company in June 2014 as Senior VicePresident of Global Human Resources. In 2017, Carol was named SVP and ChiefAdministrative Officer. Prior to joining Tennant, she was Vice President of HumanResources at ATK (Alliant Techsystems) where she held divisional and corporateleadership positions in the areas of compensation, talent management, talentacquisition and general human resource management. Prior to ATK, she was withNew Jersey-based NRG Energy, Inc.
Jeffrey C. Moorefield, Senior Vice President, Global Operations
Jeffrey C. Moorefield (54) joined the Company in April 2015 as Senior VicePresident, Global Operations. From 2001 to 2008 and 2010 to March 2015, he heldvarious positions with Pentair plc, a global manufacturer of water and fluid solutions,valves and controls, equipment protection and thermal management products, mostrecently as Global Vice President of Operation - Technical Solutions. From 2008 to2010, he was Head of Operations for Netshape Technology, a technical start-upcompany. From 1987 to 2001, he held various positions with Emerson ElectricCompany, a worldwide technology and engineering company, culminating in VicePresident, Operations. From 1985 to 1987, he was a Design Engineer at Smith &Proffit Machine & Engineering, a custom equipment engineering company.
Thomas Paulson, Senior Vice President and Chief Financial Officer
Thomas Paulson (61) joined the Company in March 2006 as Vice President andChief Financial Officer and was named Senior Vice President and Chief FinancialOfficer in October 2013. Prior to joining Tennant, he was Chief Financial Officer andSenior Vice President of Innovex from 2001 to February 2006. Prior to joiningInnovex, a manufacturer of electronic interconnect solutions, he worked for ThePillsbury Company for over 19 years. He became a Vice President at Pillsbury in 1995and was the Vice President of Finance for the $4 billion North American FoodsDivision for over two years before joining Innovex.
5

Jeffrey L. Cotter, Senior Vice President, General Counsel and Corporate Secretary
Jeffrey L. Cotter (50) joined the Company in September 2017 as Senior VicePresident, General Counsel and Corporate Secretary . Previously, he was with G&KServices, Inc., starting in 2006 and from 2008 to 2017 serving as Vice President,General Counsel, and Corporate Secretary. Prior to G&K Services, Inc., he was ashareholder at Leonard, Street and Deinard P.A. (n/k/a Stinson Leonard Street LLP).
Richard H. Zay, Senior Vice President, The Americas and R&D
Richard H. Zay (47) joined the Company in June 2010 as Vice President, GlobalMarketing and was named Senior Vice President, Global Marketing in October 2013.In 2014, he was named Senior Vice President of the Americas business unit forTennant and in 2018 he assumed responsibility for Tennant Research andDevelopment as well. From 2006 to 2010, he held various positions with WhirlpoolCorporation, a manufacturer of major home appliances, most recently as GeneralManager, KitchenAid Brand. From 1993 to 2006, he held various positions withMaytag Corporation, including Vice President, Jenn-Air Brand, Director ofMarketing, Maytag Brand, and Director of Cooking Category Management.
ITEM 1A – Risk Factors
The following are significant factors known to us that could materially adverselyaffect our business, financial condition or operating results.
We may not be able to effectively manage organizational changes which couldnegatively impact our operating results or financial condition.
We are continuing to implement global standardized processes in our businessdespite lean staffing levels. We continue to consolidate and reallocate resources aspart of our ongoing efforts to optimize our cost structure in the current economy. Ouroperating results may be negatively impacted if we are unable to implement newprocesses and manage organizational changes, which includes changes to our go-to-market strategy, systems and processes, simultaneous focus on expense control andgrowth and introduction of alternative cleaning methods. In addition, if we do noteffectively realize and sustain the benefits that these transformations are designed toproduce, we may not fully realize the anticipated savings of these actions or they maynegatively impact our ability to serve our customers or meet our strategic objectives.
Our ability to effectively operate our Company could be adversely affected if weare unable to attract and retain key personnel and other highly skilled employees,provide employee development opportunities and create effective successionplanning strategies.
Our growth strategy, expanding global footprint, changing workforcedemographics and increased improvements in technology and business processesdesigned to enhance the customer experience are putting increased pressure on humancapital strategies designed to recruit, retain and develop top talent.
Our continued success will depend on, among other things, the skills and servicesof our executive officers and other key personnel. Our ability to attract and retainhighly qualified managerial, technical, manufacturing, research, sales and marketingpersonnel also impacts our ability to effectively operate our business. As the economyrecovers and companies grow and increase their hiring activities, there is an inherentrisk of increased employee turnover and the loss of valuable employees in keypositions, especially in emerging markets. We believe the increased loss of keypersonnel within a concentrated region could adversely affect our sales growth.
In addition, there is a risk that we may not have adequate talent acquisitionresources and employee development resources to support our future hiring needs andprovide training and development opportunities to all employees. This, in turn, couldimpede our workforce from embracing change and leveraging the improvements wehave made in technology and other business process enhancements.
We are subject to competitive risks associated with developing innovativeproducts and technologies, including but not limited to, not expanding as rapidly oraggressively in the global market as our competitors, our customers not continuingto pay for innovation and competitive challenges to our products, technology andthe underlying intellectual property.
Our products are sold in competitive markets throughout the world. Competitionis based on product features and design, brand recognition, reliability, durability,technology, breadth of product offerings, price, customer relationships and after-saleservice. Although we believe that the performance and price characteristics of ourproducts will produce competitive solutions for our customers’ needs, our products aregenerally priced higher than our competitors’ products. This is due to our dedicationto innovation and continued investments in research and development. We believe thatcustomers will pay for the innovations and quality in our products. However, it maybe difficult for us to compete with lower priced products offered by our competitorsand there can be no assurance that our customers will continue to choose our productsover products offered by our competitors. If our products, markets and services are notcompetitive, we may experience a decline in sales volume, an increase in pricediscounting and a loss of market share, which adversely impacts revenues, margin andthe success of our operations.
Competitors may also initiate litigation to challenge the validity of our patents orclaims, allege that we infringe upon their patents, violate our patents or they may usetheir resources to design comparable products that avoid infringing our patents.Regardless of whether such litigation is successful, such litigation could significantlyincrease our costs and divert management’s attention from the operation of ourbusiness, which could adversely affect our results of operations and financialcondition.
Increases in the cost of, quality, or disruption in the availability of, rawmaterials and components that we purchase to manufacture our products couldnegatively impact our operating results or financial condition.
Our sales growth, expanding geographical footprint and continued use of solesource vendors (concentration risk), coupled with suppliers’ potential credit issues,could lead to an increased risk of a breakdown in our supply chain. There is anincreased risk of defects due to the highly configured nature of our purchasedcomponent parts that could result in quality issues, returns or production slow-downs.In addition, modularization may lead to more sole sourced products and as we seek tooutsource the design of certain key components, we risk loss of proprietary controland becoming more reliant on a sole source. There is also a risk that the vendors wechoose to supply our parts and equipment fail to comply with our quality expectations,thus damaging our reputation for quality and negatively impacting sales.
6

Table of Contents
The SEC has adopted rules regarding disclosure of the use of “conflict minerals”(commonly referred to as tin, tantalum, tungsten and gold) which are mined from theDemocratic Republic of the Congo in products we manufacture or contract tomanufacture. These rules have required and will continue to require due diligence anddisclosure efforts. There are and will continue to be costs associated with complyingwith this disclosure requirement, including costs to determine which of our productsare subject to the rules and the source of any "conflict minerals" used in theseproducts. Since our supply chain is complex, ultimately we may not be able tosufficiently discover the origin of the conflict minerals used in our products throughthe due diligence procedures that we implement. If we are unable to or choose not toprovide appropriate disclosure, customers may choose not to purchase our products.Alternatively, if we choose to use only suppliers offering conflict free minerals, wecannot be sure that we will be able to obtain metals, if necessary, from such suppliersin sufficient quantities or at competitive prices. Any one or a combination of thesevarious factors could harm our business, reduce market demand for our products, andadversely affect our profit margins, net sales, and overall financial results.
We may not be able to upgrade and evolve our information technology systemsas quickly as we wish and we may encounter difficulties as we upgrade and evolvethese systems to support our growth strategy and business operations, which couldadversely impact our abilities to accomplish anticipated future cost savings andbetter serve our customers.
We have many information technology systems that are important to theoperation of our business and are in need of upgrading in order to effectivelyimplement our growth strategy. Given our greater emphasis on customer-facingtechnologies, we may not have adequate resources to upgrade our systems at the pacewhich the current business environment demands. Additionally, significantlyupgrading and evolving the capabilities of our existing systems could lead toinefficient or ineffective use of our technology due to lack of training or expertise inthese evolving technology systems. These factors could lead to significant expenses,adversely impacting our results of operations and hinder our ability to offer bettertechnology solutions to our customers.
Inadequate funding or insufficient innovation of new technologies may resultin an inability to develop and commercialize new innovative products and services.
We strive to develop new and innovative products and services to differentiateourselves in the marketplace. New product development relies heavily on our financialand resource investments in both the short term and long term. If we fail to adequatelyfund product development projects or fund a project which ultimately does not gainthe market acceptance we anticipated, we risk not meeting our customers'expectations, which could result in decreased revenues, declines in margin and loss ofmarket share.
We may consider acquisition of suitable candidates to accomplish our growthobjectives. We may not be able to successfully integrate the businesses we acquire toachieve operational efficiencies, including synergistic and other benefits ofacquisition.
We may consider, as part of our growth strategy, supplementing our organicgrowth through acquisitions of complementary businesses or products. We haveengaged in acquisitions in the past, such as the acquisition of the IPC Group, and webelieve future acquisitions may provide meaningful opportunities to grow our businessand improve profitability. Acquisitions allow us to enhance the breadth of our productofferings and expand the market and geographic participation of our products andservices.
However, our success in growing by acquisition is dependent upon identifyingbusinesses to acquire, integrating the newly acquired businesses with our existingbusinesses and complying with the terms of our credit facilities. We may incurdifficulties in the realignment and integration of business activities when assimilatingthe operations and products of an
acquired business or in realizing projected efficiencies, cost savings, revenuesynergies and profit margins. Acquired businesses may not achieve the levels ofrevenue, profit, productivity or otherwise perform as expected. We are also subject toincurring unanticipated liabilities and contingencies associated with an acquired entitythat are not identified or fully understood in the due diligence process. Current orfuture acquisitions may not be successful or accretive to earnings if the acquiredbusinesses do not achieve expected financial results.
In addition, we may record significant goodwill or other intangible assets inconnection with an acquisition. We are required to perform impairment tests at leastannually and whenever events indicate that the carrying value may not be recoverablefrom future cash flows. If we determine that any intangible asset values need to bewritten down to their fair values, this could result in a charge that may be material toour operating results and financial condition.
We may not be able to generate sufficient cash to service all of ourindebtedness, and may be forced to take other actions to satisfy our obligationsunder our indebtedness, which may not be successful.
In April 2017, in connection with the acquisition of IPC Cleaning S.p.A., weentered into a new senior credit facility and indenture, and issued debt totalingapproximately $400,000, consisting of a $100,000 term loan and $300,000 of seniornotes, which funded the acquisition and replaced our current debt facility. The newsenior credit facility also includes a revolving facility in an amount up to $200,000.We cannot provide assurance that our business will generate sufficient cash flow fromoperations to meet all our debt service requirements, to pay dividends, to repurchaseshares of our common stock, and to fund our general corporate and capitalrequirements.
Our ability to satisfy our debt obligations will depend upon our future operatingperformance. We do not have complete control over our future operating performancebecause it is subject to prevailing economic conditions, and financial, business andother factors.
Our current and future debt service obligations and covenants could haveimportant consequences. These consequences include, or may include, the following:
• our ability to obtain financing for future working capital needs or acquisitionsor other purposes may be limited;
• our funds available for operations, expansions, dividends or otherdistributions, or stock repurchases may be reduced because we dedicate asignificant portion of our cash flow from operations to the payment ofprincipal and interest on our indebtedness;
• our ability to conduct our business could be limited by restrictive covenants;and
• our vulnerability to adverse economic conditions may be greater than lessleveraged competitors and, thus, our ability to withstand competitive pressuresmay be limited.
Restrictive covenants in our senior credit facility and in our indenture place limitson our ability to conduct our business. Covenants in our senior credit facility andindenture include those that restrict our ability to make acquisitions, incur debt,encumber or sell assets, pay dividends, engage in mergers and consolidations, enterinto transactions with affiliates, make investments and permit our subsidiaries to enterinto certain restrictive agreements. The senior credit facility additionally containscertain financial covenants. We cannot provide assurance that we will be able tocomply with these covenants in the future.
7

Table of Contents
We may encounter financial difficulties if the United States or other globaleconomies experience an additional or continued long-term economic downturn,decreasing the demand for our products and negatively affecting our sales growth.
Our product sales are sensitive to declines in capital spending by ourcustomers. Decreased demand for our products could result in decreased revenues,profitability and cash flows and may impair our ability to maintain our operations andfund our obligations to others. In the event of a continued long-term economicdownturn in the U.S. or other global economies, our revenues could decline to thepoint that we may have to take cost-saving measures, such as restructuring actions. Inaddition, other fixed costs would have to be reduced to a level that is in line with alower level of sales. A long-term economic downturn that puts downward pressure onsales could also negatively affect investor perception relative to our publicly statedgrowth targets.
We may encounter risks to our IT infrastructure, such as access and security,that may not be adequately designed to protect critical data and systems from theft,corruption, unauthorized usage, viruses, sabotage or unintentional misuse.
Global cybersecurity threats and incidents can range from uncoordinatedindividual attempts to gain unauthorized access to IT systems to sophisticated andtargeted measures known as advanced persistent threats, directed at the Company, itsproducts and its customers. We seek to deploy comprehensive measures to deter,prevent, detect, react to and mitigate these threats, including identity and accesscontrols, data protection, vulnerability assessments, continuous monitoring of our ITnetworks and systems and maintenance of backup and protective systems.
Despite these efforts, cybersecurity incidents, depending on their nature andscope, could potentially result in the misappropriation, destruction, corruption orunavailability of critical data and confidential or proprietary information (our own orthat of third parties) and the disruption of business operations. The potentialconsequences of a material cybersecurity incident include financial loss, reputationaldamage, litigation with third parties, theft of intellectual property, diminution in thevalue of our investment in research, development and engineering, and increasedcybersecurity protection and remediation costs due to the increasing sophistication andproliferation of threats, which in turn could adversely affect our competitiveness andresults of operations.
We may be unable to conduct business if we experience a significant businessinterruption in our computer systems, manufacturing plants or distribution facilitiesfor a significant period of time.
We rely on our computer systems, manufacturing plants and distribution facilitiesto efficiently operate our business. If we experience an interruption in the functionalityin any of these items for a significant period of time for any reason, we may not haveadequate business continuity planning contingencies in place to allow us to continueour normal business operations on a long-term basis. In addition, the increase incustomer facing technology raises the risk of a lapse in business operations. Therefore,significant long-term interruption in our business could cause a decline in sales, anincrease in expenses and could adversely impact our financial results.
Our global operations are subject to laws and regulations that imposesignificant compliance costs and create reputational and legal risk.
Due to the international scope of our operations, we are subject to a complexsystem of commercial, tax and trade regulations around the world. Recent years haveseen an increase in the development and enforcement of laws regarding trade, taxcompliance, labor and safety and anti-corruption, such as the U.S. Foreign CorruptPractices Act, and similar laws from other countries. Our numerous foreignsubsidiaries and affiliates are governed by laws, rules and business practices that differfrom those of the U.S., but because we are a U.S. based company, oftentimes they arealso subject to U.S. laws which can create a conflict. Despite our due diligence, thereis a risk that we do not have adequate resources or comprehensive processes to staycurrent on changes in laws or regulations applicable to us worldwide and maintaincompliance with those changes. Increased compliance requirements may lead toincreased costs and erosion of desired profit margin. As a result, it is possible that theactivities of these entities may not comply with U.S. laws or business practices or ourBusiness Ethics Guide. Violations of the U.S. or local laws may result in severecriminal or civil sanctions, could disrupt our business, and result in an adverse effecton our reputation, business and results of operations or financial condition. We cannotpredict the nature, scope or effect of future regulatory requirements to which ouroperations might be subject or the manner in which existing laws might beadministered or interpreted.
In addition to the foregoing, the European Union adopted a comprehensiveGeneral Data Privacy Regulation (the "GDPR") in May 2016 that will replace thecurrent EU Data Protection Directive and related country-specific legislation. TheGDPR will become fully effective in May 2018. GDPR requires companies to satisfynew requirements regarding the handling of personal and sensitive data, including itsuse, protection and the ability of persons whose data is stored to correct or delete suchdata about themselves. Failure to comply with GDPR requirements could result inpenalties of up to 4% of worldwide revenue.
Actions of activist investors or others could disrupt our business.
Public companies have been the target of activist investors. One investor whichowns approximately 5% of our outstanding common stock recently filed a Schedule13D with the Securities and Exchange Commission which stated its belief that weshould undertake a strategic review process regarding a consolidation transaction witha third party. In the event such investor or another third party, such as an activistinvestor, continues to pursue such belief or proposes to change our governancepolicies, board of directors, or other aspects of our operations, our review andconsideration of such proposals may create a significant distraction for ourmanagement and employees. This could negatively impact our ability to execute ourbusiness plans and may require our management to expend significant time andresources. Such proposals may also create uncertainties with respect to our financialposition and operations and may adversely affect our ability to attract and retain keyemployees.
8

Table of Contents
Foreign currency exchange rate fluctuations, particularly the strengthening ofthe U.S. dollar against other major currencies, could result in declines in ourreported net sales and net earnings.
We earn revenues, pay expenses, own assets and incur liabilities in countriesusing functional currencies other than the U.S. dollar. Because our consolidatedfinancial statements are presented in U.S. dollars, we translate revenues and expensesinto U.S. dollars at the average exchange rate during each reporting period, as well asassets and liabilities into U.S. dollars at exchange rates in effect at the end of eachreporting period. Therefore, increases or decreases in the value of the U.S. dollaragainst other major currencies will affect our net revenues, net earnings, earnings pershare and the value of balance sheet items denominated in foreign currencies as wetranslate them into the U.S. dollar reporting currency. We use derivative financialinstruments to hedge our estimated transactional or translational exposure to certainforeign currency-denominated assets and liabilities as well as our foreign currencydenominated revenue. While we actively manage the exposure of our foreign currencymarket risk in the normal course of business by utilizing various foreign exchangefinancial instruments, these instruments involve risk and may not effectively limit ourunderlying exposure from foreign currency exchange rate fluctuations or minimize theeffects on our net earnings and the cash volatility associated with foreign currencyexchange rate changes. Fluctuations in foreign currency exchange rates, particularlythe strengthening of the U.S. dollar against major currencies, could materially affectour financial results.
We are subject to product liability claims and product quality issues that couldadversely affect our operating results or financial condition.
Our business exposes us to potential product liability risks that are inherent in thedesign, manufacturing and distribution of our products. If products are usedincorrectly by our customers, injury may result leading to product liability claimsagainst us. Some of our products or product improvements may have defects or risksthat we have not yet identified that may give rise to product quality issues, liabilityand warranty claims. Quality issues may also arise due to changes in parts orspecifications with suppliers and/or changes in suppliers. If product liability claims arebrought against us for damages that are in excess of our insurance coverage or foruninsured liabilities and it is determined we are liable, our business could be adverselyimpacted. Any losses we suffer from any liability claims, and the effect that anyproduct liability litigation may have upon the reputation and marketability of ourproducts, may have a negative impact on our business and operating results. We couldexperience a material design or manufacturing failure in our products, a quality systemfailure, other safety issues, or heightened regulatory scrutiny that could warrant arecall of some of our products. Any unforeseen product quality problems could resultin loss of market share, reduced sales and higher warranty expense.
The integration of IPC's operations into ours following its acquisition couldcreate additional risks for our internal controls over financial reporting.
We intend to integrate IPC into our control environment and subject it to internalcontrol testing during 2018, which means that deficiencies in our internal control overfinancial reporting as a combined company may not be identified until then. Any suchundiscovered deficiencies, if material, could result in misstatements of our results ofoperations, restatements of our financial statements, declines in the trading price ofour common stock or otherwise have a material adverse effect on our business,reputation, results of operations, financial condition or cash flows.
ITEM 1B – Unresolved Staff Comments
None.
ITEM 2 – Properties
The Company’s corporate offices are owned by the Company and are located inthe Minneapolis, Minnesota, metropolitan area. Manufacturing facilities located inMinneapolis, Minnesota; Holland, Michigan; Chicago, Illinois; and Uden, theNetherlands are owned by the Company. Manufacturing facilities located inLouisville, Kentucky; São Paulo, Brazil; and Shanghai, China are leased to theCompany. Sales offices, warehouse and storage facilities are leased in variouslocations in North America, Europe, Japan, China, Australia, New Zealand and LatinAmerica. The Company’s facilities are in good operating condition, suitable for theirrespective uses and adequate for current needs.
In April 2017, the Company completed its acquisition of IPC. IPC has five majormanufacturing facilities, all located in Italy, and 11 sales branches located in theUnited States, Brazil, Europe, India and China. IPC owns its manufacturing facilitieslocated in the Italian cities of Venice, Cremona and Reggio Emilia as well as itsmanufacturing facility located in the Province of Padua. Another manufacturingfacility located in the Province of Padua is leased to IPC. In addition, IPC uses adedicated, third party plant in Germany that specially manufactures heavy–dutystainless steel scrubbers and sweepers to IPC designs. IPC also owns a minor tools andsupplies assembly operation in China to service local customers. The facilities are ingood operating condition, suitable for their respective uses and adequate for currentneeds.
Further information regarding the Company’s property and lease commitments isincluded in the Contractual Obligations section of Item 7 and in Note 15 to theConsolidated Financial Statements.
ITEM 3 – Legal Proceedings
There are no material pending legal proceedings other than ordinary routinelitigation incidental to the Company’s business.
ITEM 4 – Mine Safety Disclosures
Not applicable.
9
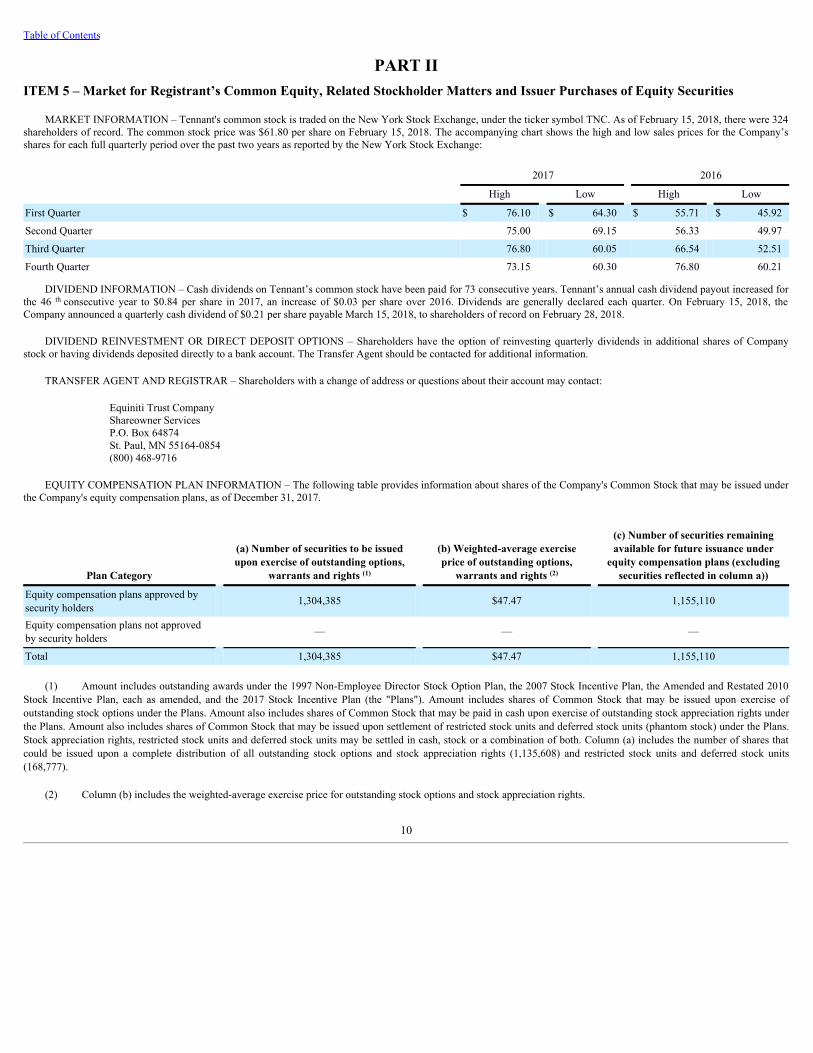
Table of Contents
PART IIITEM 5 – Market for Registrant’s Common Equity, Related Stockholder Matters and Issuer Purchases of Equity Securities
MARKET INFORMATION – Tennant's common stock is traded on the New York Stock Exchange, under the ticker symbol TNC. As of February 15, 2018, there were 324shareholders of record. The common stock price was $61.80 per share on February 15, 2018. The accompanying chart shows the high and low sales prices for the Company’sshares for each full quarterly period over the past two years as reported by the New York Stock Exchange:
2017 2016
High Low High Low
First Quarter $ 76.10 $ 64.30 $ 55.71 $ 45.92
Second Quarter 75.00 69.15 56.33 49.97
Third Quarter 76.80 60.05 66.54 52.51
Fourth Quarter 73.15 60.30 76.80 60.21
DIVIDEND INFORMATION – Cash dividends on Tennant’s common stock have been paid for 73 consecutive years. Tennant’s annual cash dividend payout increased forthe 46 th consecutive year to $0.84 per share in 2017, an increase of $0.03 per share over 2016. Dividends are generally declared each quarter. On February 15, 2018, theCompany announced a quarterly cash dividend of $0.21 per share payable March 15, 2018, to shareholders of record on February 28, 2018.
DIVIDEND REINVESTMENT OR DIRECT DEPOSIT OPTIONS – Shareholders have the option of reinvesting quarterly dividends in additional shares of Companystock or having dividends deposited directly to a bank account. The Transfer Agent should be contacted for additional information.
TRANSFER AGENT AND REGISTRAR – Shareholders with a change of address or questions about their account may contact:
Equiniti Trust CompanyShareowner ServicesP.O. Box 64874St. Paul, MN 55164-0854(800) 468-9716
EQUITY COMPENSATION PLAN INFORMATION – The following table provides information about shares of the Company's Common Stock that may be issued underthe Company's equity compensation plans, as of December 31, 2017.
Plan Category
(a) Number of securities to be issuedupon exercise of outstanding options,
warrants and rights (1)
(b) Weighted-average exerciseprice of outstanding options,
warrants and rights (2)
(c) Number of securities remainingavailable for future issuance under
equity compensation plans (excludingsecurities reflected in column a))
Equity compensation plans approved bysecurity holders 1,304,385 $47.47 1,155,110
Equity compensation plans not approvedby security holders — — —
Total 1,304,385 $47.47 1,155,110
(1) Amount includes outstanding awards under the 1997 Non-Employee Director Stock Option Plan, the 2007 Stock Incentive Plan, the Amended and Restated 2010Stock Incentive Plan, each as amended, and the 2017 Stock Incentive Plan (the "Plans"). Amount includes shares of Common Stock that may be issued upon exercise ofoutstanding stock options under the Plans. Amount also includes shares of Common Stock that may be paid in cash upon exercise of outstanding stock appreciation rights underthe Plans. Amount also includes shares of Common Stock that may be issued upon settlement of restricted stock units and deferred stock units (phantom stock) under the Plans.Stock appreciation rights, restricted stock units and deferred stock units may be settled in cash, stock or a combination of both. Column (a) includes the number of shares thatcould be issued upon a complete distribution of all outstanding stock options and stock appreciation rights (1,135,608) and restricted stock units and deferred stock units(168,777).
(2) Column (b) includes the weighted-average exercise price for outstanding stock options and stock appreciation rights.
10

Table of Contents
SHARE REPURCHASES – On October 31, 2016, the Board of Directors authorized the repurchase of an additional 1,000,000 shares of our common stock. This is inaddition to the 393,965 shares remaining under our prior repurchase program. Share repurchases are made from time to time in the open market or through privately negotiatedtransactions, primarily to offset the dilutive effect of shares issued through our share-based compensation programs. As of December 31, 2017, our 2017 Credit Agreementrestricts the payment of dividends or repurchasing of stock if, after giving effect to such payments and assuming no default exists or would result from such payment, ourleverage ratio is greater than 2.50 to 1, in such case limiting such payments to an amount ranging from $50.0 million to $75.0 million during any fiscal year based on ourleverage ratio after giving effect to such payment. Our Senior Notes due 2025 also contain certain restrictions, which are generally less restrictive than those contained in the2017 Credit Agreement.
For the Quarter EndedDecember 31, 2017
Total Number of SharesPurchased (1) Average Price Paid Per Share
Total Number of SharesPurchased as Part of Publicly
Announced Plans orPrograms
Maximum Number of Sharesthat May Yet Be Purchased
Under the Plans or Programs
October 1–31, 2017 228 $ 68.94 — 1,393,965
November 1–30, 2017 922 67.35 — 1,393,965
December 1–31, 2017 — — — 1,393,965
Total 1,150 $ 67.66 — 1,393,965
(1) Includes 1,150 shares delivered or attested to in satisfaction of the exercise price and/or tax withholding obligations by employees who exercised stock options orrestricted stock under employee share-based compensation plans.
STOCK PERFORMANCE GRAPH – The following graph compares the cumulative total shareholder return on Tennant’s common stock to two indices: S&P SmallCap600 and Morningstar Industrials Sector. The graph below compares the performance for the last five fiscal years, assuming an investment of $100 on December 31, 2012,including the reinvestment of all dividends.
5-YEAR CUMULATIVE TOTAL RETURN COMPARISON
2012 2013 2014 2015 2016 2017
Tennant Company $100 $156 $168 $133 $171 $176
S&P SmallCap 600 $100 $141 $149 $147 $144 $163
Morningstar Industrials Sector $100 $142 $155 $151 $179 $219
11

Table of Contents
ITEM 6 – Selected Financial Data(In thousands, except shares and per share data)
Years Ended December 31 2017 2016 2015 2014 2013 Financial Results:
Net Sales $ 1,003,066 $ 808,572 $ 811,799 $ 821,983 $ 752,011 Cost of Sales 598,645 (1) 456,977 462,739 469,556 426,103 Gross Margin - % 40.3 43.5 43.0 42.9 43.3 Research and Development Expense 32,013 34,738 32,415 29,432 30,529
% of Net Sales 3.2 4.3 4.0 3.6 4.1 Selling and Administrative Expense 345,364 (1) 248,210 252,270 (2) 250,898 232,976 (3)
% of Net Sales 34.4 30.7 31.1 30.5 31.0 Profit from Operations 27,044 (1) 68,498 53,176 (2) 72,097 62,403 (3)
% of Net Sales 2.7 8.5 6.6 8.8 8.3 Income Tax Expense 4,913 (1) 19,877 18,336 (2) 18,887 19,647 (3)
Effective Tax Rate - % (380.2) 29.9 36.4 27.2 32.8 Net (Loss) Earnings Attributable to TennantCompany (6,195)
(1)
46,614 32,088 50,651 40,231 % of Net Sales (0.6) 5.8 4.0 6.2 5.3
Per Share Data: Basic Net (Loss) Earnings Attributable to TennantCompany $ (0.35)
(1)
$ 2.66 $ 1.78(2)
$ 2.78 $ 2.20(3)
Diluted Net (Loss) Earnings Attributable toTennant Company $ (0.35)
(1)
$ 2.59 $ 1.74(2)
$ 2.70 $ 2.14(3)
Diluted Weighted Average Shares 17,695,390 17,976,183 18,493,447 18,740,858 18,833,453 Cash Dividends $ 0.84 $ 0.81 $ 0.80 $ 0.78 $ 0.72 Financial Position:
Total Assets $ 993,977 $ 470,037 $ 432,295 $ 486,932 $ 456,306 Total Debt 376,839 36,194 24,653 28,137 31,803 Total Tennant Company Shareholders’ Equity 296,503 278,543 252,207 280,651 263,846 Current Ratio 1.8 2.2 2.2 2.4 2.4 Debt-to-Capital Ratio 56.0% 11.5% 8.9% 9.1% 10.8% Cash Flows:
Net Cash Provided by Operations $ 54,174 $ 57,878 $ 45,232 $ 59,362 $ 59,814 Capital Expenditures, Net of Disposals (17,926) (25,911) (24,444) (19,292) (14,655) Free Cash Flow 36,248 31,967 20,788 40,070 45,159 Other Data:
Depreciation and Amortization $ 43,253 $ 18,300 $ 18,031 $ 20,063 $ 20,246 Number of employees at year-end 4,297 3,236 3,164 3,164 3,087
The results of operations from our 2017 acquisition of the IPC Group have been included in the Selected Financial Data presented above since its acquisition date on April6, 2017.
(1) 2017 includes a fair value step-up adjustment to acquired inventory in cost of sales of $7,245 pre-tax ($5,237 after-tax, or $0.30 per diluted share), pre-tax acquisitioncosts, restructuring charges and a pension settlement charge in selling and administrative expense of $10,560, $10,519 and $6,373, respectively ($9,748, $7,559 and$4,020 after-tax, or $0.55, $0.43 and $0.23 per diluted share, respectively). 2017 also includes pre-tax acquisition-related financing costs and acquisition costs in totalother expense, net of $7,378 and $814, respectively ($4,619 and $660 after-tax, or $0.26 and $0.04 per diluted share, respectively). In addition, 2017 net lossattributable to Tennant Company includes a $2,388 net income tax expense ($0.14 per diluted share) as a result of the impacts of the 2017 tax reform legislation.
(2) 2015 includes restructuring charges of $3,744 pre-tax ($3,095 after-tax or $0.17 per diluted share) and a non-cash impairment of long-lived assets of $11,199 pre-tax($10,822 after-tax or $0.58 per diluted share).
(3) 2013 includes restructuring charges of $3,017 pre-tax ($2,938 after-tax or $0.15 per diluted share) and a tax benefit of $582 (or $0.03 per diluted share) related to theretroactive reinstatement of the 2012 U.S. Federal Research and Development ("R&D") Tax Credit.
12
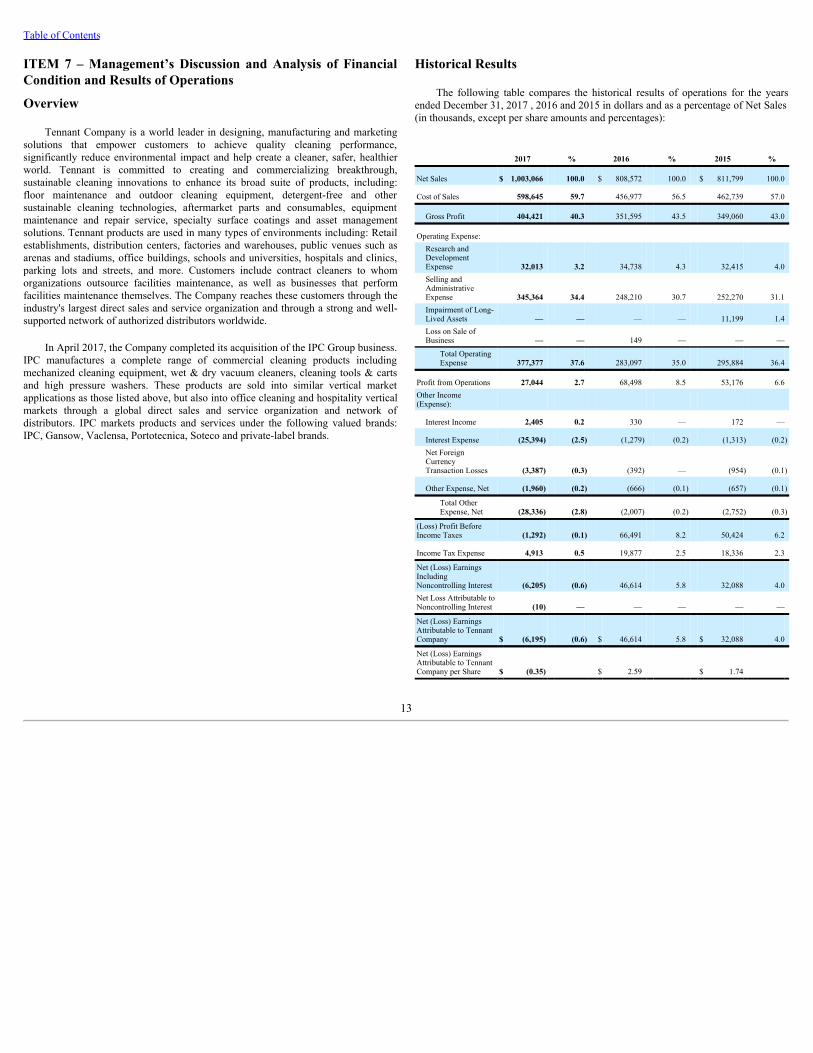
Table of Contents
ITEM 7 – Management’s Discussion and Analysis of FinancialCondition and Results of Operations
Overview
Tennant Company is a world leader in designing, manufacturing and marketingsolutions that empower customers to achieve quality cleaning performance,significantly reduce environmental impact and help create a cleaner, safer, healthierworld. Tennant is committed to creating and commercializing breakthrough,sustainable cleaning innovations to enhance its broad suite of products, including:floor maintenance and outdoor cleaning equipment, detergent-free and othersustainable cleaning technologies, aftermarket parts and consumables, equipmentmaintenance and repair service, specialty surface coatings and asset managementsolutions. Tennant products are used in many types of environments including: Retailestablishments, distribution centers, factories and warehouses, public venues such asarenas and stadiums, office buildings, schools and universities, hospitals and clinics,parking lots and streets, and more. Customers include contract cleaners to whomorganizations outsource facilities maintenance, as well as businesses that performfacilities maintenance themselves. The Company reaches these customers through theindustry's largest direct sales and service organization and through a strong and well-supported network of authorized distributors worldwide.
In April 2017, the Company completed its acquisition of the IPC Group business.IPC manufactures a complete range of commercial cleaning products includingmechanized cleaning equipment, wet & dry vacuum cleaners, cleaning tools & cartsand high pressure washers. These products are sold into similar vertical marketapplications as those listed above, but also into office cleaning and hospitality verticalmarkets through a global direct sales and service organization and network ofdistributors. IPC markets products and services under the following valued brands:IPC, Gansow, Vaclensa, Portotecnica, Soteco and private-label brands.
Historical Results
The following table compares the historical results of operations for the yearsended December 31, 2017 , 2016 and 2015 in dollars and as a percentage of Net Sales(in thousands, except per share amounts and percentages):
2017 % 2016 % 2015 %
Net Sales $ 1,003,066 100.0 $ 808,572 100.0 $ 811,799 100.0
Cost of Sales 598,645 59.7 456,977 56.5 462,739 57.0
Gross Profit 404,421 40.3 351,595 43.5 349,060 43.0
Operating Expense: Research andDevelopmentExpense 32,013 3.2 34,738 4.3 32,415 4.0Selling andAdministrativeExpense 345,364 34.4 248,210 30.7 252,270 31.1Impairment of Long-Lived Assets — — — — 11,199 1.4Loss on Sale ofBusiness — — 149 — — —
Total OperatingExpense 377,377 37.6 283,097 35.0 295,884 36.4
Profit from Operations 27,044 2.7 68,498 8.5 53,176 6.6Other Income(Expense):
Interest Income 2,405 0.2 330 — 172 —
Interest Expense (25,394) (2.5) (1,279) (0.2) (1,313) (0.2)Net ForeignCurrencyTransaction Losses (3,387) (0.3) (392) — (954) (0.1)
Other Expense, Net (1,960) (0.2) (666) (0.1) (657) (0.1)
Total OtherExpense, Net (28,336) (2.8) (2,007) (0.2) (2,752) (0.3)
(Loss) Profit BeforeIncome Taxes (1,292) (0.1) 66,491 8.2 50,424 6.2
Income Tax Expense 4,913 0.5 19,877 2.5 18,336 2.3
Net (Loss) EarningsIncludingNoncontrolling Interest (6,205) (0.6) 46,614 5.8 32,088 4.0Net Loss Attributable toNoncontrolling Interest (10) — — — — —
Net (Loss) EarningsAttributable to TennantCompany $ (6,195) (0.6) $ 46,614 5.8 $ 32,088 4.0
Net (Loss) EarningsAttributable to TennantCompany per Share $ (0.35) $ 2.59 $ 1.74
13

Table of Contents
Net Sales
Net Sales in 2017 totaled $1,003.1 million , a 24.1% increase as compared to NetSales of $808.6 million in 2016 .
The components of the consolidated Net Sales change for 2017 as compared to2016 , and 2016 as compared to 2015 , were as follows:
Growth Elements 2017 v. 2016 2016 v. 2015
Organic Growth: Volume (0.1%) 1.1%
Price 1.5% —%
Organic Growth 1.4% 1.1%
Foreign Currency 0.5% (1.0%)
Acquisitions 22.2% (0.5%)
Total 24.1% (0.4%)
The 24.1% increase in consolidated Net Sales for 2017 as compared to 2016 wasdriven by:
• 22.2% from the April 2017 acquisition of the IPC Group and the expansion ofour commercial floor coatings business through the August 2016 acquisition ofthe Florock ® brand.
• An organic sales increase of approximately 1.4% which excludes the effects offoreign currency exchange and acquisitions, due to an approximate 1.5% priceincrease, partially offset by a volume decrease of 0.1% . The price increasewas the result of selling price increases, typically in the range of 2% to 4% inmost geographies, with an effective date of February 1, 2017. The impact togross margin was minimal as these selling price increases were taken to offsetinflation. The slight volume decrease was primarily due to increased sales inLatin America and EMEA being more than offset by volume decreases inNorth America. Sales of new products introduced within the past three yearstotaled 48% of equipment revenue in 2017. This compares to 37% ofequipment revenue in 2016 from sales of new products introduced within thepast three years.
• A favorable impact from foreign currency exchange of approximately 0.5%.
The 0.4% decrease in consolidated Net Sales for 2016 as compared to 2015 wasprimarily due to the following:
• An unfavorable impact from foreign currency exchange of approximately1.0%.
• An unfavorable net impact of 0.5% resulting from the sale of our GreenMachines outdoor city cleaning line, partially offset by the acquisition of theFlorock brand.
• An organic sales increase of approximately 1.1% which excludes the effects offoreign currency exchange and acquisitions and divestitures, due to anapproximate 1.1% volume increase. The volume increase was primarily due tostrong sales of industrial equipment and sales of new products, particularly inthe Americas region, being somewhat offset by lower sales of commercialequipment, particularly within the APAC region. Sales of new productsintroduced within the past three years totaled 37% of equipment revenue in2016. This compares to 26 % of equipment revenue in 2015 from sales of newproducts introduced within the past three years. There was essentially no priceincrease in 2016 due to no significant new selling list price increases sinceprior year selling list price increases with an effective date of February 1,2015.
The following table sets forth annual Net Sales by geographic area and therelated percentage change from the prior year (in thousands, except percentages):
2017 % 2016 % 2015
Americas $ 640,274 5.5 $ 607,026 2.6 $ 591,405Europe, Middle Eastand Africa 273,738 112.1 129,046 (7.7) 139,834
Asia Pacific 89,054 22.8 72,500 (10.0) 80,560
Total $ 1,003,066 24.1 $ 808,572 (0.4) $ 811,799
Americas – In 2017 , Americas Net Sales increased 5.5% to $640.3 million ascompared with $607.0 million in 2016 . The direct impact of the IPC Group andFlorock acquisitions favorably impacted Net Sales by approximately 4.4%. Inaddition, a favorable direct impact of foreign currency translation exchange effectswithin the Americas impacted Net Sales by approximately 0.4% in 2017. As a result,organic sales growth in the Americas favorably impacted Net Sales by approximately0.7% due to strong sales performance in Latin America, particularly Brazil andMexico, from focused go-to-market strategies in our direct channel. This was partiallyoffset by lower sales in North America, where sales growth through the distributionchannel were more than offset by service sales.
In 2016 , Americas Net Sales increased 2.6% to $607.0 million as compared with$591.4 million in 2015 . The primary drivers of the increase in Net Sales were strongsales of industrial equipment, sales of new products and robust sales in Latin America.The direct impact of the Florock acquisition favorably impacted Net Sales byapproximately 0.7%. An unfavorable direct impact of foreign currency translationexchange effects within the Americas impacted Net Sales by approximately 0.5% in2016. As a result, organic sales increased approximately 2.4% in 2016 within theAmericas.
Europe, Middle East and Africa – EMEA Net Sales in 2017 increased 112.1%to $273.7 million as compared to 2016 Net Sales of $129.0 million . In 2017 , thedirect impact of the IPC Group acquisition favorably impacted Net Sales byapproximately 105.3%. In addition, a favorable direct impact of foreign currencytranslation exchange effects within EMEA impacted Net Sales by approximately 1.3%in 2017. As a result, organic sales growth in EMEA favorably impacted Net Sales in2017 by approximately 5.5% due to s trong sales growth in most European countriesfrom strong demand in both the direct and distributor channels being partially offsetby lower sales in the UK.
EMEA Net Sales in 2016 decreased 7.7% to $129.0 million as compared to 2015Net Sales of $139.8 million . In 2016, organic sales growth was achieved in all regionsexcept the UK and the Central Eastern Europe, Middle East and Africa marketsprimarily due to Brexit and challenging economic conditions, respectively. In 2016,there was an unfavorable impact on Net Sales of approximately 5.9% as a result of thesale of our Green Machines outdoor city cleaning line in January 2016. In addition,the direct impact of foreign currency exchange effects within EMEA unfavorablyimpacted Net Sales by approximately 2.0% in 2016. As a result, organic salesincreased approximately 0.2% in 2016 within EMEA.
Asia Pacific – APAC Net Sales in 2017 increased 22.8% to $89.1 million ascompared to 2016 Net Sales of $72.5 million . In 2017 , the direct impact of the IPCGroup acquisition favorably impacted Net Sales by approximately 22.7%. In addition,a favorable direct impact of foreign currency translation exchange effects withinAPAC impacted Net Sales by approximately 0.1% in 2017. As a result, organic salesgrowth in APAC was essentially flat due to sales growth in China from strong salesthrough the direct and distributor channels being offset by sales declines primarily inKorea and Singapore resulting from a challenging economic environment.
14

Table of Contents
APAC Net Sales in 2016 decreased 10.0% to $72.5 million as compared to 2015Net Sales of $80.6 million . Organic sales decreased approximately 10.0% in 2016with lower sales of commercial and industrial equipment. Organic sales declines in allof our Asian markets were primarily due to economic slowdowns in the region andfewer large deals. Direct foreign currency translation exchange effects had essentiallyno impact on Net Sales in 2016 within APAC.
Gross Profit
Gross Profit margin was 320 basis points lower in 2017 compared to 2016 dueprimarily to the $7.2 million, or approximately 70 basis points, fair value inventorystep-up flow through related to our acquisition of the IPC Group and field serviceproductivity challenges related to a high number of open service trucks of $5.1million, or approximately 50 basis points. In addition, Gross Profit margin wasunfavorably impacted by mix of sales by channel and region, primarily resulting fromhigher sales through the distribution in North America and lower gross margins fromthe IPC Group. The near-term unfavorable impacts from investments in manufacturingautomation initiatives and high levels of raw material cost inflation also contributed tolower Gross Profit margin in 2017.
Gross Profit margin was 43.5% in 2016 , an increase of 50 basis points ascompared to 2015 . Gross Profit margin in 2016 was favorably impacted by productmix (with relatively higher sales of industrial equipment and lower sales ofcommercial equipment), partially offset by manufacturing productivity challenges inNorth America.
Operating Expenses
Research and Development Expense – Tennant continues to invest ininnovative product development with 3.2% of 2017 Net Sales spent on Research andDevelopment ("R&D"). We continue to invest in developing innovative new productsand technologies and the advancement of detergent-free products, fleet managementand other sustainable technologies. There were 32 new products and product variantslaunched in 2017 including a new family of T500 commercial walk-behind scrubbers,the enhanced IRIS ® Web Based Fleet Management System, the i-mop, the V3ecompact dry canister vacuum, the T350 stand-on commercial scrubber and the A140micro-scrubber. In 2017, our newly acquired IPC Group business also launched manynew products and product variants across all product lines.
R&D Expense decreased $2.7 million , or 7.8% , in 2017 as compared to 2016 .As a percentage of Net Sales, 2017 R&D Expense decreased 110 basis pointscompared to the prior year. The decrease in R&D spending was primarily due toheadcount reduction related to the first quarter 2017 restructuring action.
R&D Expense increased $2.3 million, or 7.2%, in 2016 as compared to 2015. Asa percentage of Net Sales, 2016 R&D Expense increased 30 basis points compared tothe prior year. New products are a key driver of sales growth. There were 10 newproducts and product variants launched in 2016 including three models of emergingmarket floor machines, two models of the M17 battery-powered sweeper-scrubber,three large next-generation cleaning machines: the M20 and M30 integrated sweeper-scrubbers, and the T20 heavy-duty industrial rider scrubber, and two models of thecommercial dryer/air mover.
Selling and Administrative Expense – Selling and Administrative Expense("S&A Expense") increased by $97.2 million , or 39.1% , in 2017 compared to 2016 .As a percentage of Net Sales, 2017 S&A Expense increased 370 basis points to 34.4%from 30.7% in 2016 . S&A Expense was unfavorably impacted by $15.7 million, or160 basis points, and $10.6 million, or 110 basis points, of amortization expense andacquisition costs, respectively, related to our acquisition of the IPC Group. In addition,S&A Expense was unfavorably impacted by $10.5 million, or 100 basis points, and$6.4 million, or 60 basis points, of restructuring charges taken in the 2017 first andfourth quarters and pension settlement charges, respectively. Excluding these costs,S&A Expense was 50 basis points lower in 2017 compared to 2016 due primarily toour continued balance of disciplined spending control with investments in key growthinitiatives.
S&A Expense decreased by $4.1 million, or 1.6%, in 2016 compared to 2015. Asa percentage of Net Sales, 2016 S&A Expense decreased 40 basis points to 30.7%from 31.1% in 2015 due to two restructuring charges totaling $3.7 million werecorded in 2015 to reduce our infrastructure costs that did not repeat in 2016. Inaddition, there was a net favorable impact to S&A Expense in 2016 as a result ofdisciplined spending control more than offsetting investments in key growthinitiatives.
Profit from OperationsOperating Profit was $27.0 million , or 2.7% of Net Sales, in 2017 , as compared
to Operating Profit of $68.5 million , or 8.5% of Net Sales, in 2016 . 2017 OperatingProfit was $41.5 million lower than 2016 Operating Profit due primarily to $15.7million of amortization expense related to IPC intangible assets, $10.6 million ofacquisition costs and a $7.2 million fair value inventory step-up flow through, allrelated to our acquisition of the IPC Group. We also recorded $10.5 million ofrestructuring charges in 2017 to better align our global resources and expensestructure. In addition, we recorded pension settlement charges of $6.4 million due toour termination of the U.S. Pension Plan in May 2017. These unfavorable impactswere partially offset by operating profit obtained from the IPC acquisition, reducedexpenses resulting from our first quarter 2017 restructuring charge and tightmanagement of controllable costs.
Operating Profit was $68.5 million in 2016, as compared to Operating Profit of$53.2 million in the prior year which included $11.2 million for the pre-tax non-cashImpairment of Long-Lived Assets as a result of the classification of our GreenMachines assets as held for sale and also the $3.7 million pre-tax restructuring chargesrecorded in 2015. Operating Profit margin increased 190 basis points to 8.5% in 2016from 6.6% in 2015. 2016 Operating Profit was also favorably impacted by higherGross Profit despite the lower Net Sales in 2016 as compared to 2015. Due to theoverall strengthening of the U.S. dollar relative to other currencies in 2016, foreigncurrency exchange reduced Operating Profit by approximately $1.2 million.
Total Other Expense, Net
Interest Income – Interest Income was $2.4 million in 2017 , an increase of $2.1million from 2016 . The increase between 2017 and 2016 was primarily due to interestincome related to foreign currency swap activities.
Interest Income was $0.3 in 2016, an increase of $0.1 million from 2015. Theincrease between 2016 and 2015 was due to higher levels of cash deposits.
Interest Expense – Interest Expense was $25.4 million in 2017 , as compared to$1.3 million in 2016 . The higher Interest Expense in 2017 was primarily due tocarrying a higher level of debt on our Consolidated Balance Sheets related to ouracquisition activities as well as a $6.2 million charge to expense the debt issuancecosts for loans which were refinanced or repaid, as further described in the Liquidityand Capital Resources section that follows.
There was no significant change in Interest Expense in 2016 as compared to2015.
15

Table of Contents
Net Foreign Currency Transaction Losses – Net Foreign Currency TransactionLosses were $3.4 million in 2017 as compared to $0.4 million in 2016 . Theunfavorable change in the impact from foreign currency transactions in 2017 wasprimarily due to fluctuations in foreign currency rates, specifically between the Euroand U.S. dollar, settlements of transactional hedging activity in the normal course ofbusiness and a $1.1 million mark-to-market adjustment of a foreign exchange calloption, an instrument held in connection with our acquisition of the IPC Group onApril 6, 2017.
Net Foreign Currency Transaction Losses were $0.4 million in 2016 as comparedto $1.0 million in 2015. The favorable change in the impact from foreign currencytransactions in 2016 was due to fluctuations in foreign currency rates and settlementsof transactional hedging activity in the normal course of business.
Other Expense, Net – Other Expense, Net was $2.0 million in 2017 as comparedto $0.7 million in 2016 . The unfavorable change in Other Expense, Net was dueprimarily to the additional expense recorded as a result of the acquisition of the IPCGroup.
There was no significant change in Other Expense, Net in 2016 as compared to2015.
(Loss) Profit Before Income Taxes
Loss Before Income Taxes for 2017 was $1.3 million compared to Profit BeforeIncome Taxes of $66.5 million for 2016 and $50.4 million in 2015 .
The breakdown of (Loss) Profit Before Income Taxes between U.S. and foreignoperations for each year ended December 31 was as follows:
2017 % 2016 % 2015 %
U.S. operations $ 7,465 (577.8) $ 54,018 81.2 $ 51,189 101.5Foreign operations (8,757) 677.8 12,473 18.8 (765) (1.5)
Total $ (1,292) 100.0 $ 66,491 100.0 $ 50,424 100.0
Profit Before Income Taxes from U.S. operations decreased by $46.6 million in2017 compared to 2016 . The decrease resulted primarily from $10.6 million ofacquisition costs related to our acquisition of the IPC Group, $6.4 million of pensionsettlement charges recorded in 2017 as a result of the termination of the U.S. PensionPlan in May 2017 and $4.9 million of restructuring charges recorded in 2017 to betteralign our global resources and expense structure. In addition, Interest Expenserecorded in Profit Before Income Taxes from U.S. operations during 2017 was $23.4higher compared to 2016 primarily due to carrying a higher level of debt on ourConsolidated Balance Sheets related to our acquisition activities as well as a $6.2million charge to expense the debt issuance costs for loans which were refinanced orrepaid as part of our acquisition of the IPC Group.
(Loss) Profit Before Income Taxes from foreign operations decreased by $21.2million in 2017 compared to 2016 . The decrease resulted primarily from $15.7million of amortization expense related to IPC intangible assets in 2017, a $7.2million fair value inventory step-up flow through as a result of our acquisition of theIPC Group and $5.6 million of restructuring charges recorded in 2017 to better alignour global resources and expense structure. These unfavorable impacts were partiallyoffset by Profit Before Income Taxes obtained from the IPC acquisition.
Profit Before Income Taxes from foreign operations increased by $13.2 millionin 2016 compared to 2015. The increase resulted primarily from the $11.2 millionnon-cash Impairment of Long-Lived Assets included in 2015 as a result of ourdecision to hold the assets and liabilities of our Green Machines outdoor city cleaningline for sale that did not repeat in 2016. This impairment affected the results ofoperations in our EMEA region. In addition, 2015 Profit Before Income Taxes in ourEMEA and APAC subsidiaries included an additional expense of $1.9 million and$0.7 million, respectively, as a result of two worldwide restructuring actions that didnot repeat in 2016. Profit Before Income Taxes in our Latin America subsidiariesincreased approximately $0.6 million in 2016 primarily due to sales increases. ProfitBefore Income Taxes in our APAC subsidiaries decreased by $1.3 million primarilydue to lower sales resulting from economic slowdowns in the region and fewer largedeals.
Income Taxes
On December 22, 2017, legislation popularly referred to as the Tax Cuts and JobsAct (Tax Act) was enacted, resulting in significant changes from previous tax law,including, but not limited to requiring a one-time transition tax on certainunrepatriated earnings of foreign subsidiaries and a reduction in the U.S. federalcorporate income tax rate from 35% to 21%. The Tax Act also establishes new lawsthat will impact 2018.
ASC 740 requires a company to record the effects of a tax law change in theperiod of enactment, however shortly after the enactment of the Tax Act, the SECstaff issued SAB 118, which allows a company to record a provisional amount when itdoes not have the necessary information available, prepared or analyzed in reasonabledetail to complete its accounting for the change in the law. The measurement periodends when the company has obtained, prepared and analyzed the informationnecessary to finalize its accounting, but cannot extend beyond one year.
Therefore, in connection with its initial analysis of the impact of the Tax Act, theCompany’s overall tax expense for 2017 includes a provisional tax charge of $2.4million, or $0.14 per share, to reflect the estimated impacts of the Tax Act, includingthe transition tax on cash and cash equivalent balances related to accumulated earningsassociated with our international operations, the write-down of net U.S. deferred taxassets at lower enacted corporate tax rates, and the effects of the implementation of theterritorial tax system.
The overall effective income tax rate was (380.2)% , 29.9% and 36.4% in 2017 ,2016 and 2015 , respectively.
The tax expense for 2017 included a $3.7 million tax benefit associated with$18.8 million of acquisition and financing costs related to the IPC Group acquisition, a$3.0 million tax benefit associated with a $10.5 million restructuring charge, a $2.4million tax benefit associated with a $6.2 million pension settlement, a $2.0 milliontax benefit associated with $7.2 million of expense related to inventory step-upamortization, a $2.0 million provisional tax expense related to the write-down of netU.S. deferred tax assets at the lower enacted tax rates and a $0.4 million provisionaltax expense related to the transition tax on cash and cash equivalent balances related toaccumulated earnings associated with our international operations as a result of TaxLegislation. These special items impacted the 2017 year-to-date overall effective taxrate by 412.9%.
Our effective tax rate fluctuates from year to year due to the global nature of ouroperations. Excluding the 2017 special items and the effect of the Tax Act, the tax rateincreased from 29.9% in 2016 due primarily to the mix in full year taxable earnings bycountry. As a result of the Tax Act, we expect the income tax rate to be favorablyimpacted.
There were no special items that affected the tax rate in 2016.
16
The tax expense for 2015 included a $0.4 million tax benefit associated with an$11.2 million Impairment of Long-Lived Assets and a $0.6 million tax benefitassociated with restructuring charges of $3.7 million. We are not able to recognize atax benefit on the impairment charge until the assets are sold due to a tax valuationallowance. Excluding these items, the 2015 overall effective tax rate would have been29.6%.
Net (Loss) Earnings and (Loss) Earnings Per Share
Net (Loss) Earnings for 2017 were $(6.2) million , or $(0.35) per diluted share,compared to $46.6 million , or $2.59 per diluted share, for 2016 . Net (Loss) Earningswere impacted by:
• Gross profit margin decline of 320 basis points compared to 2016 .
• A 370 basis point increase in S&A Expense as a percentage of Net Salescompared to 2016.
• An unfavorable impact of $24.1 million from Interest Expense of $25.4million in 2017 as compared to $1.3 million in 2016 .
• An unfavorable impact of $3.0 million from Net Foreign Currency TransactionLosses of $3.4 million in 2017 as compared to $0.4 million in 2016 .
• An increase in Net Sales of 24.1% in 2017 as compared to 2016 .
Net Earnings for 2016 were $46.6 million , or $2.59 per diluted share, comparedto $32.1 million , or $1.74 per diluted share, for 2015 . Net Earnings were impactedby:
• Gross profit margin strengthening of 50 basis points compared to 2015 .
• A 40 basis point decrease in S&A Expense as a percentage of Net Salescompared to 2015.
• A pre-tax non-cash impact of $11.2 million in 2015 due to the Impairment ofLong-Lived Assets as a result of the classification of our Green Machinesassets as held for sale that did not repeat in 2016.
• A favorable impact of $0.6 million from Net Foreign Currency TransactionLosses of $0.4 million in 2016 as compared to $1.0 million in 2015.
• A decrease in Net Sales of 0.4% in 2016 as compared to 2015.
Other Comprehensive Income (Loss)
Foreign Currency Translation Adjustments – For the years endedDecember 31, 2017 and 2016 , we recorded a pre-tax foreign currency translationgain of $28.4 million and $0.1 million , respectively. For the year endedDecember 31, 2015 , we recorded pre-tax foreign currency translation losses of $12.5million in Other Comprehensive Income (Loss). These adjustments resulted fromtranslating the financial statements of our non-U.S. dollar functional currencysubsidiaries into our reporting currency, which is the U.S. dollar, as well as otheradjustments permitted by ASC 830 – Foreign Currency Matters .
Durin g 2017 , we recorded pre-tax currency translation gains of $28.4 million .These adjustments were caused primarily by the appreciation of the Euro against theU.S. dollar. In 2017, the Euro appreciated against the U.S. dollar by approximately14%.
During 2016 , we recorded translation gains of $3.4 million relating to theBrazilian real, and translation losses of $1.3 million for the Euro, $1.0 million for theChines renminbi, $0.9 million for the British pound and $0.1 million for various othercurrencies. These adjustments were caused by the appreciation of the U.S. dollaragainst these currencies of between 3% and 17%, and the strengthening of theBrazilian real of 22% in 2016.
During 2015 , we recorded translation losses of $6.5 million relating to theBrazilian real, $5.3 million for the Euro, $0.6 million for the Chinese renminbi and$0.1 million for various other currencies. These adjustments were caused by theappreciation of the U.S. dollar against these currencies of between 5% and 32% in2015.
Pension and Retiree Medical Benefits – For the years ended December 31,2017 and 2016 , we recorded pre-tax pension and postretirement liability adjustmentsconsisting of gains of $5.9 million and losses of $2.2 million , respectively, in OtherComprehensive Income (Loss) as further disclosed in Note 13 to the Company'sConsolidated Financial Statements. For the year ended December 31, 2015 , werecorded a gain of $4.1 million in Other Comprehensive Income (Loss) for theseitems.
The summarized changes in Accumulated Other Comprehensive Loss for thethree years ended December 31 were as follows:
Pension and Postretirement Medical
Benefits
2017 2016 2015
Net actuarial loss (gain) $ 622 $ 2,357 $ (2,940)Amortization of prior service cost — (41) (67)Amortization of net actuarial loss (117) (68) (1,114)Settlement Charge (6,373) — —
Total recognized in othercomprehensive (income) loss $ (5,868) $ 2,248 $ (4,121)
The $5.9 million gain in 2017 was primarily due to a $6.4 million settlementcharge related to the termination of the U.S. Pension Plan and a $0.1 million creditrelated to amortization of accumulated actuarial losses. These gains were partiallyoffset by $0.6 million of net actuarial losses relating to an increase of $1.2 million inthe pension benefit obligation in 2017 due to changes in demographic experience andother changes, a $0.6 million increase in the pension benefit obligation resulting froma 64 basis point decrease in the U.S. pension discount rate, a 19 basis point decrease inthe non-U.S. discount rate and a 32 basis point decrease in the postretirement discountrates and $1.0 million decrease in the pension benefit obligation due to a higher thanexpected actual return on assets.
The $2.2 million loss i n 2016 was primarily due to a $2.4 net actuarial lossrelating to an increase of $3.2 million in the projected benefit obligation resultingfrom a 16 basis point decrease in the U.S. pension discount rate, a 95 basis pointdecrease in the non-U.S. discount rate and a 12 basis point decrease in thepostretirement discount rate. There was an approximate $0.6 million decrease in thepension benefit obligation in 2016 relating to demographic experience and otherchanges, as well as a $0.2 million decrease due to a higher than expected actual returnon assets. The net actuarial loss was partially offset by a $0.1 million credit relating toamortization of accumulated actuarial losses and prior service costs.
The $4.1 million gain in 2015 was primarily due to a $2.9 million net actuarialgain relating to a decrease of $2.4 million in the projected benefit obligation resultingfrom a 32 basis point increase in the U.S. Pension discount rate, a 21 basis pointincrease in the non-U.S. discount rate and a 31 basis point increase in thepostretirement discount rate. There was an approximate $3.3 million decrease in thepension benefit obligation in 2015 relating to demographic experience and otherchanges, as well as a $3.0 million increase due to a lower than expected actual returnof assets. The net actuarial gain was supplemented by a $1.2 million credit relating toamortization of accumulated losses and prior service costs.
17

Table of Contents
Cash Flow Hedging – For the years ended December 31, 2017 and 2016 , werecorded adjustments to pre-tax losses on cash flow hedge financial instruments of$7.7 million and $0.3 million , respectively, in Other Comprehensive Income (Loss)as further disclosed i n Note 11 to the Company's Consolidated Financial Statements.For the year ended December 31, 2015 , we recorded a gain of $0.2 million in OtherComprehensive Income (Loss) for these items.
The $7.7 million loss in 2017 was primarily due to $26.2 million of lossesrecognized primarily as a result of our Euro to U.S. dollar foreign exchange crosscurrency swaps to mitigate our Euro exposure on our cash flows associated with anintercompany loan from a wholly-owned European subsidiary. The loss was partiallyoffset by $18.5 of losses reclassified from Accumulated Other Comprehensive Loss tothe Consolidated Statements of Earnings.
The $0.3 million pre-tax loss i n 2016 and the pre-tax gain of $0.2 million in2015 was driven by our cash flow exposure to the Canadian dollar resulting fromchanges in this currency relative to the U.S. dollar.
Liquidity and Capital Resources
Liquidity – Cash and Cash Equivalents totaled $58.4 million at December 31,2017 , as compared to $58.0 million as of December 31, 2016 . Cash and CashEquivalents held by our foreign subsidiaries totaled $39.1 million as of December 31,2017 , as compared to $19.0 million as of December 31, 2016 . Wherever possible,cash management is centralized and intercompany financing is used to provideworking capital to subsidiaries as needed. Our current ratio was 1.8 as ofDecember 31, 2017 and 2.2 as of December 31, 2016 , and our working capital was$186.6 million and $165.1 million , respectively.
Our Debt-to-Capital ratio was 56.0% as of December 31, 2017 , compared with11.5% as of December 31, 2016 . Our capital structure was comprised of $376.8million of Debt and $296.5 million of Tennant Company Shareholders’ Equity as ofDecember 31, 2017 .
During 2017 , we generated operating cash flows of $54.2 million and paid atotal of $15.0 million in cash dividends. Total debt increased to $376.8 million as ofDecember 31, 2017 , compared to $36.2 million at the end of 2016 , due primarily tothe acquisition of the IPC Group in April 2017.
Cash Flow Summary – Cash provided by (used in) our operating, investing andfinancing activities is summarized as follows (in thousands):
2017 2016 2015
Operating Activities $ 54,174 $ 57,878 $ 45,232Investing Activities:
Purchases of Property, Plant andEquipment, Net of Disposals (17,926) (25,911) (24,444)Proceeds from Principal PaymentsReceived on Long-Term NoteReceivable 667 — —Issuance of Long-Term NoteReceivable (1,500) (2,000) —Acquisitions of Businesses, Net ofCash Acquired (354,073) (12,933) —Purchase of Intangible Asset (2,500) — —Proceeds from Sale of Business — 285 1,185(Increase) Decrease in RestrictedCash (92) 116 (322)
Financing Activities 319,473 (9,558) (61,405)Effect of Exchange Rate Changes onCash and Cash Equivalents 2,142 (1,144) (1,908)
Net Increase (Decrease) in Cash andCash Equivalents $ 365 $ 6,733 $ (41,662)
Operating Activities – Cash provided by operating activities was $54.2 millionin 2017 , $57.9 million in 2016 and $45.2 million in 2015 . In 2017 , cash provided byoperating activities was driven primarily by net earnings, after adding back non-cashitems, an increase in Other Current Liabilities of $14.6 million due to additionalaccruals recorded as a result of the IPC Group consolidation and the fourth quarter2017 restructuring action and an increase in Accounts Payable of $10.8 million due totiming of payments. These cash inflows were partially offset by cash outflowsresulting from an increase in Accounts Receivable of $14.4 million resulting fromhigher sales levels, the variety of payment terms offered and mix of business.
In 2016, cash provided by operating activities was driven primarily by netearnings, after adding back non-cash items, partially offset by an increase in AccountsReceivable of $9.3 million resulting from higher sales levels, particularly in December2016, the variety of payment terms offered and mix of business.
In 2015, cash provided by operating activities was driven primary by netearnings, after adding back non-cash items, somewhat offset by a decrease inAccounts Payable of $10.5 million due to making earlier payments to utilize cashdiscounts and an increase in Inventories of $10.2 million to support the launches ofmany new products.
For 2017 , we used operating profit and operating profit margin as key indicatorsof financial performance and the primary metrics for performance-based incentives.
Two metrics used by management to evaluate how effectively we utilize our netassets are “Accounts Receivable Days Sales Outstanding” (“DSO”) and “DaysInventory on Hand” (“DIOH”), on a first-in, first-out (“FIFO”) basis. The metrics arecalculated on a rolling three month basis in order to more readily reflect changingtrends in the business. These metrics for the quarters ended December 31 were asfollows (in days):
2017 2016
DSO 63 59
DIOH 96 89
18

Table of Contents
DSO increased 4 days in 2017 as compared to 2016 primarily due to theacquisition of IPC, who generally offers longer payment terms than the average DSOof our business in 2016 prior to the acquisition, and mix of business. These driverswere partially offset by the trend of continued proactive management of ourreceivables by enforcing tighter credit limits and continuing to successfully collectpast due balances.
DIOH increased 7 days in 2017 as compared to 2016 primarily due to a lowerlevel of sales than anticipated that resulted in higher levels of inventory andmaintaining a higher level of select inventory items to lower lead times, partiallyoffset by progress from inventory reduction initiatives.
Investing Activities – Net cash used in investing activities was $375.4 million in2017 , $40.4 million in 2016 and $23.6 million in 2015 . In 2017 , we used $354.1million , net of cash acquired, in relation to our acquisition of the IPC Group and thefinal installment payment for the acquisition of the Florock brand and $17.9 millionfor net capital expenditures. Net capital expenditures included investments ininformation technology process improvement projects, tooling related to new productdevelopment, and manufacturing equipment. We also used $2.5 million for thepurchase of the distribution rights to sell the i-mop and $1.5 million as a result of aloan to i-team North America B.V., a joint venture that operates as a distributor of thei-mop in North America. The details regarding the joint venture and our distribution ofthe i-mop are described further in Note 3 to the Consolidated Financial Statements.
In 2016 , we used $25.9 million for net capital expenditures. Net capitalexpenditures included investments in information technology process improvementprojects, tooling related to new product development, and manufacturing equipment.In addition, our acquisition of the Florock brand and the assets of Dofesa BarrdioMecanizado, a long-time distributor based in Central Mexico, used $12.9 million , netof cash acquired. We also used $2.0 million as a result of a non-interest bearing cashadvance to TCS EMEA GmbH, the master distributor of our products in CentralEastern Europe, Middle East and Africa.
In 2015 , we used $24.4 million for net capital expenditures. Net capitalexpenditures included investments in information technology process improvementprojects, tooling related to new product development, and manufacturing equipment.This cash outflow was partially offset by a cash inflow resulting from proceeds fromsale of our Green Machines outdoor city cleaning line, which provided $1.2 million .
Financing Activities – Net cash provided by financing activities was $319.5million in 2017 . Net cash used in financing activities was $9.6 million in 2016 and$61.4 million in 2015 . In 2017 , proceeds from the incurrence of Long-Term Debtassociated with the IPC acquisition and the issuance of Common Stock provided$440.0 million and $6.9 million , respectively. These cash inflows were partiallyoffset by cash outflows resulting from $96.2 million of Long-Term Debt payments,$16.5 million related to payments of debt issuance costs and dividend payments of$15.0 million . Our annual cash dividend payout increased for the 46 th consecutiveyear to $0.84 per share in 2017 , an increase of $0.03 per share over 2016 .
In 2016 , dividend payments used $14.3 million , the purchases of our commonstock per our authorized repurchase program used $12.8 million and the payment ofLong-Term Debt used $3.5 million . These cash ouflows were partially offset byproceeds resulting from the incurrence of Long-Term Debt of $15.0 million , theissuance of Common Stock of $5.3 million and the excess tax benefit on stock plansof $0.7 million .
In 2015 , the purchase of our common stock per our authorized repurchaseprogram used $46.0 million , dividend payments used $14.5 million and the paymentof Long-Term Debt used $3.4 million , partially offset by proceeds from the issuanceof Common Stock of $1.7 million and the excess benefit on stock plans of $0.9million .
On October 31, 2016, the Board of Directors authorized the repurchase of anadditional 1,000,000 shares of our common stock. At December 31, 2017 , there were1,393,965 remaining shares authorized for repurchase.
There were no shares repurchased in 2017 in the open market, 246,474 sharesrepurchased in 2016 and 764,046 shares repurchased during 2015 , at averagerepurchase prices of $51.78 during 2016 and $60.20 during 2015 . Our 2017 CreditAgreement restricts the payment of dividends or repurchasing of stock if, after givingeffect to such payments and assuming no default exists or would result from suchpayment, our leverage ratio is greater than 2.50 to 1, in such case limiting suchpayments to an amount ranging from $50.0 million to $75.0 million during any fiscalyear based on our leverage ratio after giving effect to such payment. Our Senior Notesdue 2025 also contain certain restrictions, which are generally less restrictive thanthose contained in the 2017 Credit Agreement.
Indebtedness – In order to finance the acquisition of the IPC Group, on April 4,2017, the Company and certain of our foreign subsidiaries entered into a CreditAgreement (the “2017 Credit Agreement”) with JPMorgan, as administrative agent,Goldman Sachs Bank USA, as syndication agent, Wells Fargo, National Association,U.S. Bank National Association, and HSBC Bank USA, National Association, as co-documentation agents, and the lenders (including JPMorgan) from time to time partythereto.
On April 18, 2017, we issued and sold $300,000 in aggregate principal amount ofour 5.625% Senior Notes due 2025 (the “Notes”), pursuant to an Indenture, dated as ofApril 18, 2017, among the company, the Guarantors (as defined therein), and WellsFargo Bank, National Association, a national banking association, as trustee. TheNotes are guaranteed by Tennant Coatings, Inc. and Tennant Sales and ServiceCompany (collectively, the “Guarantors”), which are wholly owned subsidiaries of thecompany.
For further details regarding our indebtedness, see Note 9 to the ConsolidatedFinancial Statements.
19

Table of Contents
Contractual Obligations – Our contractual obligations as of December 31, 2017, are summarized by period due in the following table (in thousands):
Total Less Than
1 Year 1 - 3
Years 3 - 5 Years More Than
5 Years
Long-term debt(1) $ 380,000 $ 5,000 $ 16,250 $ 58,750 $ 300,000Interestpayments onlong-termdebt (1) 132,744 19,587 38,549 36,217 38,391
Capital leases 3,279 1,609 1,540 130 —Interestpayments oncapital leases 300 187 111 2 —Retirementbenefit plans (2) 1,239 1,239 — — —Deferredcompensationarrangements(3) 6,257 1,356 1,894 721 2,286Operatingleases (4) 36,931 14,083 15,261 4,991 2,596Purchaseobligations (5) 57,848 57,848 — — —
Other (6) 11,410 11,410 — — —
Totalcontractualobligations $ 630,008 $ 112,319 $ 73,605 $ 100,811 $ 343,273
(1) Long-term debt represents borrowings through our Senior Notes due2025 and the 2017 Credit Agreement with JPMorgan. Interest on the Senior Notes willaccrue at the rate of 5.625% per annum and will be payable semiannually in cash oneach May 1 and November 1, commencing on November 1, 2017. Repayment of theprincipal amount of the Senior Notes is due upon expiration of the agreement in 2025.Interest payments on our 2017 Credit Agreement with JPMorgan were calculatedusing the December 31, 2017 30-day LIBOR rate plus a spread.
(2) Our retirement benefit plans, as described in Note 13 to the ConsolidatedFinancial Statements, require us to make contributions to the plans from time to time.Our plan obligations totaled $12.0 million as of December 31, 2017 . Contributions tothe various plans are dependent upon a number of factors including the marketperformance of plan assets, if any, and future changes in interest rates, which impactthe actuarial measurement of plan obligations. As a result, we have only included our2018 expected contribution in the contractual obligations table.
(3) The unfunded deferred compensation arrangements covering certaincurrent and retired management employees totaled $6.3 million as of December 31,2017 . Our estimated distributions in the contractual obligations table are based upon anumber of assumptions including termination dates and participant distributionelections.
(4) Operating lease commitments consist primarily of office and warehousefacilities, vehicles and office equipment as discussed in Note 15 to the ConsolidatedFinancial Statements.
(5) Purchase obligations include all known open purchase orders,contractual purchase commitments and contractual obligations as of December 31,2017 .
(6) Other obligations include residual value guarantees as discussed in Note15 to the Consolidated Financial Statements.
Total contractual obligations exclude our gross unrecognized tax benefits of $2.2million and accrued interest and penalties of $0.5 million as of December 31, 2017 .We expect to make cash outlays in the future related to uncertain tax positions.However, due to the uncertainty of the timing of future cash flows, we are unable tomake reasonably reliable estimates of the period of cash settlement, if any, with therespective taxing authorities. For further information related to unrecognized taxbenefits, see Note 16 to the Consolidated Financial Statements.
Newly Issued Accounting Guidance
Revenues from Contracts with Customers
In May 2014, the Financial Accounting Standards Board ("FASB") issuedAccounting Standards Update ("ASU") No. 2014-09, Revenue from Contracts withCustomers (Topic 606) . This ASU will replace all existing revenue recognitionstandards and significantly expand the disclosure requirements for revenuearrangements. This guidance requires an entity to recognize the amount of revenue towhich it expects to be entitled for the transfer of promised goods or services tocustomers. This guidance provides a five-step analysis of transactions to determinewhen and how revenue is recognized. This guidance also requires enhanceddisclosures regarding the nature, amount, timing and uncertainty of revenue and cashflows arising from an entity's contracts with customers. The ASU permits twomethods of adoption: retrospectively to each prior reporting period presented (fullretrospective method), or retrospectively with the cumulative effect of initiallyapplying the guidance recognized at the date of initial application (the modifiedretrospective method).
In August 2015, the FASB issued ASU No. 2015-14, Revenue from Contractswith Customers (Topic 606): Deferral of the Effective Date , which defers theeffective date of the new revenue recognition standard by one year from the originaleffective date specified in ASU No. 2014-09. The guidance now permits us to applythe new revenue recognition standard to annual reporting periods beginning afterDecember 15, 2017, including interim periods within that reporting period, which isour fiscal 2018.
We have completed the process of evaluating the effect of the adoption of thisASU on our financial statements and related disclosures. We adopted the new standardeffective January 1, 2018, using the modified retrospective approach. We will expandour consolidated financial statement disclosures in order to comply with the ASU. Thenew standard requires a change in the presentation of our sales return reserve on thebalance sheet, which we currently record net. The new standard also requires us torecord a refund liability and a corresponding asset for our right to recover productsfrom customers upon settling the refund liability to account for the transfer of productswith a right of return. However, these changes will not have a material impact on ourfinancial condition, results of operations or cash flows, other than additionaldisclosure requirements.
Leases
In February 2016, the FASB issued ASU No. 2016-02, Leases (Topic 842) . ThisASU changes current U.S. GAAP for lessees to recognize lease assets and leaseliabilities on the balance sheet for those leases classified as operating leases underprevious U.S. GAAP. Under the new guidance, lessor accounting is largelyunchanged. The amendments in this ASU are effective for annual periods beginningafter December 15, 2018, including interim periods within that reporting period,which is our fiscal 2019. Early application is permitted. Lessees and lessors mustapply a modified retrospective transition approach for leases existing at, or enteredinto after, the beginning of the earliest comparative period presented in the financialstatements. The transition approach would not require any transition accounting forleases that expired before the earliest comparative period presented. A fullretrospective transition approach is prohibited for both lessees and lessors. We willadopt this ASU beginning in 2019. We are currently evaluating the impact of thisamended guidance on our consolidated financial statements and related disclosures.
20
Table of Contents
Business Combinations
In January 2017, the FASB issued ASU No. 2017-01, Business Combinations(Topic 805): Clarifying the Definition of a Business . This ASU clarifies the definitionof a business when evaluating whether transactions should be accounted for asacquisitions (or disposals) of assets or businesses. This ASU is effective for annualreporting periods beginning after December 15, 2017, including interim periods withinthat reporting period, which is our fiscal 2018. We will apply this guidance toapplicable transactions commencing in 2018.
Goodwill
In January 2017, the FASB issued ASU No. 2017-04, Intangibles—Goodwilland Other (Topic 350): Simplifying the Test for Goodwill Impairment , which removesStep 2 of the goodwill impairment test. A goodwill impairment will now be theamount by which a reporting unit’s carrying value exceeds its fair value, not to exceedthe carrying amount of goodwill. This ASU is effective for annual or any interimgoodwill impairment tests beginning after December 15, 2019, which is our fiscal2020. Early adoption of the standard is permitted for any interim or annual goodwillimpairment tests performed on testing dates after January 1, 2017. We early adoptedthis guidance to applicable goodwill impairment tests commencing with our annualgoodwill impairment analysis in 2017 and it did not have a material impact on ourConsolidated Financial Statements.
Compensation – Retirement Benefits
In March 2017, the FASB issued ASU No. 2017-07, Compensation—RetirementBenefits (Topic 715): Improving the Presentation of Net Periodic Pension Cost andNet Periodic Postretirement Benefit Cost , which requires employers to report theservice cost component in the same line item or items as other compensation costsarising from services rendered by the pertinent employees during the period. The othercomponents of net benefit cost (credit) are required to be presented in the incomestatement separately from the service cost component in nonoperating expenses. Inaddition, the line items used in the income statement to present the other componentsof net benefit cost (credit) must be disclosed. The amendments also allow only theservice cost component to be eligible for capitalization when applicable. This ASU iseffective for annual reporting periods beginning after December 15, 2017, includinginterim periods within that reporting period, which is our fiscal 2018. Companies arerequired to adopt the ASU retrospectively for the presentation of the service costcomponent and the other components of net periodic pension and postretirementbenefit cost (credit) in the income statement. We adopted the new standard effectiveJanuary 1, 2018.
We will comply with the requirements of this ASU by reporting the service costcomponent of net periodic pension and postretirement benefit cost (credit) in the sameline item or items as other compensation costs arising from services rendered by thepertinent employees during the period. We will also present the other components ofnet periodic benefit cost (credit) separate from the service cost component innonoperating expenses. Based on our analysis of this ASU, we have determined thatthe impact to our financial statements and related disclosures is immaterial as it relatesto the presentation of the service cost component of net periodic pension andpostretirement benefit costs. The other components of net periodic benefit cost (credit)will be recorded in Total Other Expense, Net on the Consolidated Statements ofOperations. In 2017, we recorded $0.4 million of net periodic benefit credits as itrelates to the other components of net periodic pension and postretirement benefit cost(credit) in Selling and Administrative Expense. We will begin presenting these costsin Total Other Expense, Net on a retrospective basis beginning with our fiscal 2018quarterly and annual filings, along with the related disclosures.
Derivatives and Hedging
In August 2017, the FASB issued ASU No. 2017-12, Derivatives and Hedging(Topic 815): Targeted Improvements to Accounting for Hedging Activities , whichbetter aligns accounting rules with a company's risk management activities, betterreflects the economic results of hedging in financial statements and simplifies hedgeaccounting treatment. This ASU is effective for fiscal years beginning after December15, 2018, including interim periods within those fiscal years, which is our fiscal 2019.We are currently evaluating the impact that this standard is expected to have on ourconsolidated financial statements and related disclosures.
No other new accounting pronouncements issued but not yet effective have had,or are expected to have, a material impact on our results of operations or financialposition.
Critical Accounting Policies and Estimates
Our Consolidated Financial Statements are based on the selection and applicationof accounting principles generally accepted in the United States of America, whichrequire us to make estimates and assumptions about future events that affect theamounts reported in our Consolidated Financial Statements and the accompanyingnotes. Our significant accounting policies are described in Note 1 to the ConsolidatedFinancial Statements. Future events and their effects cannot be determined withabsolute certainty. Therefore, the determination of estimates requires the exercise ofjudgment. Actual results could differ from those estimates, and any such differencesmay be material to the Consolidated Financial Statements. We believe that thefollowing policies may involve a higher degree of judgment and complexity in theirapplication and represent the critical accounting policies used in the preparation of ourConsolidated Financial Statements. If different assumptions or conditions were toprevail, the results could be materially different from our reported results.
Allowance for Doubtful Accounts – We record a reserve for accountsreceivable that are potentially uncollectible. A considerable amount of judgment isrequired in assessing the realization of these receivables including the currentcreditworthiness of each customer and related aging of the past-due balances. In orderto assess the collectability of these receivables, we perform ongoing credit evaluationsof our customers’ financial condition. Through these evaluations, we may becomeaware of a situation where a customer may not be able to meet its financial obligationsdue to deterioration of its financial viability, credit ratings or bankruptcy. The reserverequirements are based on the best facts available to us and are reevaluated andadjusted as additional information becomes available. Our reserves are also based onamounts determined by using percentages applied to trade receivables. Thesepercentages are determined by a variety of factors including, but not limited to, currenteconomic trends, historical payment and bad debt write-off experience. We are notable to predict changes in the financial condition of our customers and ifcircumstances related to these customers deteriorate, our estimates of therecoverability of accounts receivable could be materially affected and we may berequired to record additional allowances. Alternatively, if more allowances areprovided than are ultimately required, we may reverse a portion of such provisions infuture periods based on the actual collection experience. Bad debt write-offs as apercentage of Net Sales were approximately 0.1% in 2017 , 0.1% in 2016 and 0.2% in2015 . As of December 31, 2017 , we had $3.2 million reserved against AccountsReceivable for doubtful accounts and sales returns.
21

Table of Contents
Inventory Reserves – We value our inventory at the lower of the cost ofinventory or net realizable value through the establishment of a reserve for excess,slow moving and obsolete inventory. In assessing the ultimate realization ofinventories, we are required to make judgments as to future demand requirementscompared with inventory levels. Reserve requirements are developed by comparingour inventory levels to our projected demand requirements based on historicaldemand, market conditions and technological and product life cycle changes. It ispossible that an increase in our reserve may be required in the future if there aresignificant declines in demand for certain products. This reserve creates a new costbasis for these products and is considered permanent. As of December 31, 2017 , wehad $4.1 million reserved against Inventories.
Goodwill – Goodwill represents the excess of cost over the fair value of netassets of businesses acquired and is allocated to our reporting units at the time of theacquisition. We analyze Goodwill on an annual basis and when an event occurs orcircumstances change that may reduce the fair value of a reporting unit below itscarrying amount. An entity should recognize an impairment charge for the amount bywhich the carrying amount exceeds the reporting unit's fair value.
We performed an analysis of qualitative factors to determine whether it is morelikely than not that the fair value of a reporting unit is less than its carrying amount asa basis for determining whether it is necessary to perform the quantitative goodwillimpairment test. The qualitative test is used as an indicator to identify if there ispotential goodwill impairment. If the qualitative test indicates there may be animpairment, the quantitative test is performed which measures the amount of thegoodwill impairment, if any. We perform our goodwill impairment analysis as of yearend or when an event occurs or circumstances change that may reduce the fair value ofa reporting unit below its carrying amount, and use our judgment to developassumptions for the discounted cash flow model that we use, if necessary.Management assumptions include forecasting revenues and margins, estimatingcapital expenditures, depreciation, amortization and discount rates.
If our goodwill impairment testing resulted in one or more of our reporting units’carrying amount exceeding its fair value, we would write down our reporting units’carrying amount to its fair value and would record an impairment charge in our resultsof operations in the period such determination is made. Subsequent reversal ofgoodwill impairment charges is not permitted. We performed an analysis ofqualitative factors to determine whether it is more likely than not that the fair value ofa reporting unit is less than its carrying amount and, based upon our analysis, noqualitative indicators of impairment exist at December 31, 2017 . We had Goodwill of$186.0 million as of December 31, 2017 .
Warranty Reserves – We record a liability for warranty claims at the time ofsale. The amount of the liability is based on the trend in the historical ratio of claimsto net sales, the historical length of time between the sale and resulting warrantyclaim, new product introductions and other factors. Future claims experience could bematerially different from prior results because of the introduction of new, morecomplex products, a change in our warranty policy in response to industry trends,competition or other external forces, or manufacturing changes that could impactproduct quality. In the event we determine that our current or future product repair andreplacement costs exceed our estimates, an adjustment to these reserves would becharged to earnings in the period such determination is made. Warranty expense as apercentage of Net Sales was 1.2% in 2017 , 1.5% in 2016 and 1.4% in 2015 . As ofDecember 31, 2017 , we had $12.7 million reserved for future estimated warrantycosts.
Income Taxes – We are required to estimate our income taxes in each of thejurisdictions in which we operate. This process involves estimating our actual currenttax obligations based on expected income, statutory tax rates and tax planningopportunities in the various jurisdictions. We also establish reserves for uncertain taxmatters that are complex in nature and uncertain as to the ultimate outcome. Althoughwe believe that our tax return positions are fully supportable, we consider our abilityto ultimately prevail in defending these matters when establishing these reserves. Weadjust our reserves in light of changing facts and circumstances, such as the closing ofa tax audit. We believe that our current reserves are adequate. However, the ultimateoutcome may differ from our estimates and assumptions and could impact the incometax expense reflected in our Consolidated Statements of Operations.
Tax law requires certain items to be included in our tax return at different timesthan the items are reflected in our results of operations. Some of these differences arepermanent, such as expenses that are not deductible in our tax returns, and somedifferences will reverse over time, such as depreciation expense on property, plant andequipment. These temporary differences result in deferred tax assets and liabilities,which are included within our Consolidated Balance Sheets. Deferred tax assetsgenerally represent items that can be used as a tax deduction or credit in our taxreturns in future years but have already been recorded as an expense in ourConsolidated Statements of Operations. We assess the likelihood that our deferred taxassets will be recovered from future taxable income, and, based on management’sjudgment, to the extent we believe that recovery is not more likely than not, weestablish a valuation reserve against those deferred tax assets. The deferred tax assetvaluation allowance could be materially different from actual results because ofchanges in the mix of future taxable income, the relationship between book andtaxable income and our tax planning strategies. As of December 31, 2017 , a valuationallowance of $9.7 million was recorded against foreign tax loss carryforwards, foreigntax credit carryforwards and state credit carryforwards.
Cautionary Factors Relevant to Forward-Looking Information
This annual report on Form 10-K, including “Management’s Discussion andAnalysis of Financial Condition and Results of Operations” in Item 7, contain certainstatements that are considered “forward-looking statements” within the meaning of thePrivate Securities Litigation Reform Act of 1995. Forward-looking statementsgenerally can be identified by the use of forward-looking terminology such as “may,”“will,” “expect,” “intend,” “estimate,” “anticipate,” “believe,” “project,” or “continue”or similar words or the negative thereof. These statements do not relate to strictlyhistorical or current facts and provide current expectations of forecasts of futureevents. Any such expectations or forecasts of future events are subject to a variety offactors. Particular risks and uncertainties presently facing us include:
• Ability to effectively manage organizational changes.
• Ability to attract, retain and develop key personnel and create effectivesuccession planning strategies.
• Competition in our business.
• Fluctuations in the cost, quality or availability of raw materials and purchasedcomponents.
• Ability to successfully upgrade and evolve our information technologysystems.
• Ability to develop and commercialize new innovative products and services.
• Ability to integrate acquisitions, including IPC.
• Ability to generate sufficient cash to satisfy our debt obligations.
• Geopolitical and economic uncertainty throughout the world.
22

Table of Contents
• Ability to successfully protect our information technology systems from cybersecurity risks.
• Occurrence of a significant business interruption.
• Ability to comply with laws and regulations.
• Potential disruption of our business from actions of activist investors or others.
• Relative strength of the U.S. dollar, which affects the cost of our materials andproducts purchased and sold internationally.
• Unforeseen product liability claims or product quality issues.
• Internal control over financial reporting risks resulting from our acquisition ofIPC.
We caution that forward-looking statements must be considered carefully andthat actual results may differ in material ways due to risks and uncertainties bothknown and unknown. Information about factors that could materially affect our resultscan be found in Part I, Item 1A - Risk Factors. Shareholders, potential investors andother readers are urged to consider these factors in evaluating forward-lookingstatements and are cautioned not to place undue reliance on such forward-lookingstatements.
We undertake no obligation to update or revise any forward-looking statement,whether as a result of new information, future events or otherwise, except as requiredby law. Investors are advised to consult any further disclosures by us in our filingswith the Securities and Exchange Commission and in other written statements onrelated subjects. It is not possible to anticipate or foresee all risk factors, and investorsshould not consider any list of such factors to be an exhaustive or complete list of allrisks or uncertainties.
ITEM 7A – Quantitative and Qualitative Disclosures AboutMarket Risk
Commodity Risk – We are subject to exposures resulting from potential costincreases related to our purchase of raw materials or other product components. We donot use derivative commodity instruments to manage our exposures to changes incommodity prices such as steel, oil, gas, lead and other commodities.
Various factors beyond our control affect the price of oil and gas, including butnot limited to worldwide and domestic supplies of oil and gas, political instability orarmed conflict in oil-producing regions, the price and level of foreign imports, thelevel of consumer demand, the price and availability of alternative fuels, domestic andforeign governmental regulation, weather-related factors and the overall economicenvironment. We purchase petroleum-related component parts for use in ourmanufacturing operations. In addition, our freight costs associated with shipping andreceiving product and sales and service vehicle fuel costs are impacted by fluctuationsin the cost of oil and gas.
Fluctuations in worldwide demand and other factors affect the price for lead,steel and related products. We do not maintain an inventory of raw or fabricated steelor batteries in excess of near-term production requirements. As a result, increases inthe price of lead or steel can significantly increase the cost of our lead- and steel-basedraw materials and component parts.
During 2017, we experienced inflation on our raw materials and other purchasedcomponent costs. We continue to focus on mitigating the risk of future raw material orother product component cost increases through supplier negotiations, ongoingoptimization of our supply chain, the continuation of cost reduction actions andproduct pricing. The success of these efforts will depend upon our ability to leverageour commodity spend in the current global economic environment. If the commodityprices increase significantly and we are not able to offset the increases with higherselling prices, our results may continue to be unfavorably impacted in 2018.
Foreign Currency Exchange Rate Risk – Due to the global nature of ouroperations, we are subject to exposures resulting from foreign currency exchangefluctuations in the normal course of business. Our primary exchange rate exposuresare with the Euro, Australian and Canadian dollars, British pound, Japanese yen,Chinese renminbi, Brazilian real and Mexican peso against the U.S. dollar. The directfinancial impact of foreign currency exchange includes the effect of translating profitsfrom local currencies to U.S. dollars, the impact of currency fluctuations on thetransfer of goods between our operations in the United States and our internationaloperations and transaction gains and losses. In addition to the direct financial impact,foreign currency exchange has an indirect financial impact on our results, includingthe effect on sales volume within local economies and the impact of pricing actionstaken as a result of foreign exchange rate fluctuations.
In the normal course of business, we actively manage the exposure of our foreigncurrency exchange rate market risk by entering into various hedging instruments withcounterparties that are highly rated financial institutions. We may use foreignexchange purchased options or forward contracts to hedge our foreign currencydenominated forecasted revenues or forecasted sales to wholly owned foreignsubsidiaries. Additionally, we hedge our net recognized foreign currency assets andliabilities with foreign exchange forward contracts. We hedge these exposures toreduce the risk that our net earnings and cash flows will be adversely affected bychanges in foreign exchange rates. We do not enter into any of these instruments forspeculative or trading purposes to generate revenue.
These contracts are carried at fair value and have maturities between one and 12months. The gains and losses on these contracts generally approximate changes in thevalue of the related assets, liabilities or forecasted transactions. Some of the derivativeinstruments we enter into do not meet the criteria for cash flow hedge accountingtreatment; therefore, changes in fair value are recorded in Foreign CurrencyTransaction Losses on our Consolidated Statements of Operations.
We also use foreign currency exchange rate derivatives to hedge our exposure tofluctuations in exchange rates for anticipated intercompany cash transactions betweenTennant Company and its subsidiaries. During the second quarter of 2017, we enteredinto Euro to U.S. dollar foreign exchange cross currency swaps for all of theanticipated cash flows associated with an intercompany loan from a wholly-ownedEuropean subsidiary. We entered into these foreign exchange cross currency swaps tohedge the foreign currency denominated cash flows associated with this intercompanyloan and accordingly, they are not speculative in nature. We designated these crosscurrency swaps as cash flow hedges. The scheduled maturity and principal payment ofthe loan and related swaps are due in April 2022 .
For further information regarding our foreign currency derivatives and hedgingprograms, see Note 11 to the Consolidated Financial Statements.
23

Table of Contents
The average contracted rate and notional amounts of the foreign currencyderivative instruments outstanding at December 31, 2017 , presented in U.S. dollarequivalents are as follows (dollars in thousands, except average contracted rate):
Notional AmountAverage
Contracted RateMaximum Term
(Months)
Derivatives designated ashedging instrument:
Foreign currency optioncontracts:
Canadian dollar $ 8,619 1.301 12Foreign currency forwardcontracts:
Euro 207,076 1.168 51Canadian dollar 2,928 1.264 3
Derivatives not designated ashedging instruments:
Foreign currency forwardcontracts:
Australian dollar $ 3,061 1.287 6Brazilian real 4,862 3.329 1Canadian dollar 6,612 1.263 8Euro 38,068 0.831 11Mexican peso 8,255 20.312 8
For details of the estimated effects of currency translation on the operations ofour operating segments, see Item 7 – Management's Discussion and Analysis ofFinancial Condition and Results of Operations.
Other Matters – Management regularly reviews our business operations withthe objective of improving financial performance and maximizing our return oninvestment. As a result of this ongoing process to improve financial performance, wemay incur additional restructuring charges in the future which, if taken, could bematerial to our financial results.
24

Table of Contents
ITEM 8 – Financial Statements and Supplementary Data
REPORT OF INDEPENDENT REGISTERED PUBLIC ACCOUNTING FIRM
To the shareholders and board of directorsTennant Company:
Opinions on the Consolidated Financial Statements and Internal Control Over Financial Reporting
We have audited the accompanying consolidated balance sheets of Tennant Company and subsidiaries (the Company) as of December 31, 2017 and 2016, the relatedconsolidated statements of operations, comprehensive income, equity, and cash flows for each of the years in the three-year period ended December 31, 2017, and the relatednotes and the financial statement schedule as included in Item 15.A.2 (collectively, the consolidated financial statements). We also have audited the Company’s internal controlover financial reporting as of December 31, 2017, based on criteria established in Internal Control - Integrated Framework (2013) issued by the Committee of SponsoringOrganizations of the Treadway Commission.
In our opinion, the consolidated financial statements referred to above present fairly, in all material respects, the financial position of the Company as of December 31, 2017and 2016, and the results of its operations and its cash flows for each of the years in the three-year period ended December 31, 2017, in conformity with U.S. generally acceptedaccounting principles. Also in our opinion, the Company maintained, in all material respects, effective internal control over financial reporting as of December 31, 2017, basedon criteria established in Internal Control - Integrated Framework (2013) issued by the Committee of Sponsoring Organizations of the Treadway Commission.
The Company acquired IPC Group during 2017, and management excluded from its assessment of the effectiveness of the Company’s internal control over financialreporting as of December 31, 2017, IPC Group’s internal control over financial reporting associated with total assets of $509 million and total revenues of $174 million includedin the consolidated financial statements of the Company as of and for the year ended December 31, 2017. Our audit of internal control over financial reporting of the Companyalso excluded an evaluation of the internal control over financial reporting of IPC Group.
Basis for Opinion
The Company’s management is responsible for these consolidated financial statements, for maintaining effective internal control over financial reporting, and for itsassessment of the effectiveness of internal control over financial reporting, included in the accompanying Management’s Report on Internal Control over Financial Reporting.Our responsibility is to express an opinion on the Company’s consolidated financial statements and an opinion on the Company’s internal control over financial reporting basedon our audits. We are a public accounting firm registered with the Public Company Accounting Oversight Board (United States) (“PCAOB”) and are required to be independentwith respect to the Company in accordance with the U.S. federal securities laws and the applicable rules and regulations of the Securities and Exchange Commission and thePCAOB.
We conducted our audits in accordance with the standards of the PCAOB. Those standards require that we plan and perform the audits to obtain reasonable assurance aboutwhether the consolidated financial statements are free of material misstatement, whether due to error or fraud, and whether effective internal control over financial reporting wasmaintained in all material respects.
Our audits of the consolidated financial statements included performing procedures to assess the risks of material misstatement of the consolidated financial statements,whether due to error or fraud, and performing procedures that respond to those risks. Such procedures included examining, on a test basis, evidence regarding the amounts anddisclosures in the consolidated financial statements. Our audits also included evaluating the accounting principles used and significant estimates made by management, as well asevaluating the overall presentation of the consolidated financial statements. Our audit of internal control over financial reporting included obtaining an understanding of internalcontrol over financial reporting, assessing the risk that a material weakness exists, and testing and evaluating the design and operating effectiveness of internal control based onthe assessed risk. Our audits also included performing such other procedures as we considered necessary in the circumstances. We believe that our audits provide a reasonablebasis for our opinions.
Definition and Limitations of Internal Control Over Financial Reporting
A company’s internal control over financial reporting is a process designed to provide reasonable assurance regarding the reliability of financial reporting and the preparation offinancial statements for external purposes in accordance with generally accepted accounting principles. A company’s internal control over financial reporting includes thosepolicies and procedures that (1) pertain to the maintenance of records that, in reasonable detail, accurately and fairly reflect the transactions and dispositions of the assets of thecompany; (2) provide reasonable assurance that transactions are recorded as necessary to permit preparation of financial statements in accordance with generally acceptedaccounting principles, and that receipts and expenditures of the company are being made only in accordance with authorizations of management and directors of the company;and (3) provide reasonable assurance regarding prevention or timely detection of unauthorized acquisition, use, or disposition of the company’s assets that could have a materialeffect on the financial statements.
Because of its inherent limitations, internal control over financial reporting may not prevent or detect misstatements. Also, projections of any evaluation of effectiveness tofuture periods are subject to the risk that controls may become inadequate because of changes in conditions, or that the degree of compliance with the policies or procedures maydeteriorate.
/s/ KPMG LLP
We have served as the Company's auditor since 1954.
Minneapolis, MinnesotaFebruary 27, 2018
25
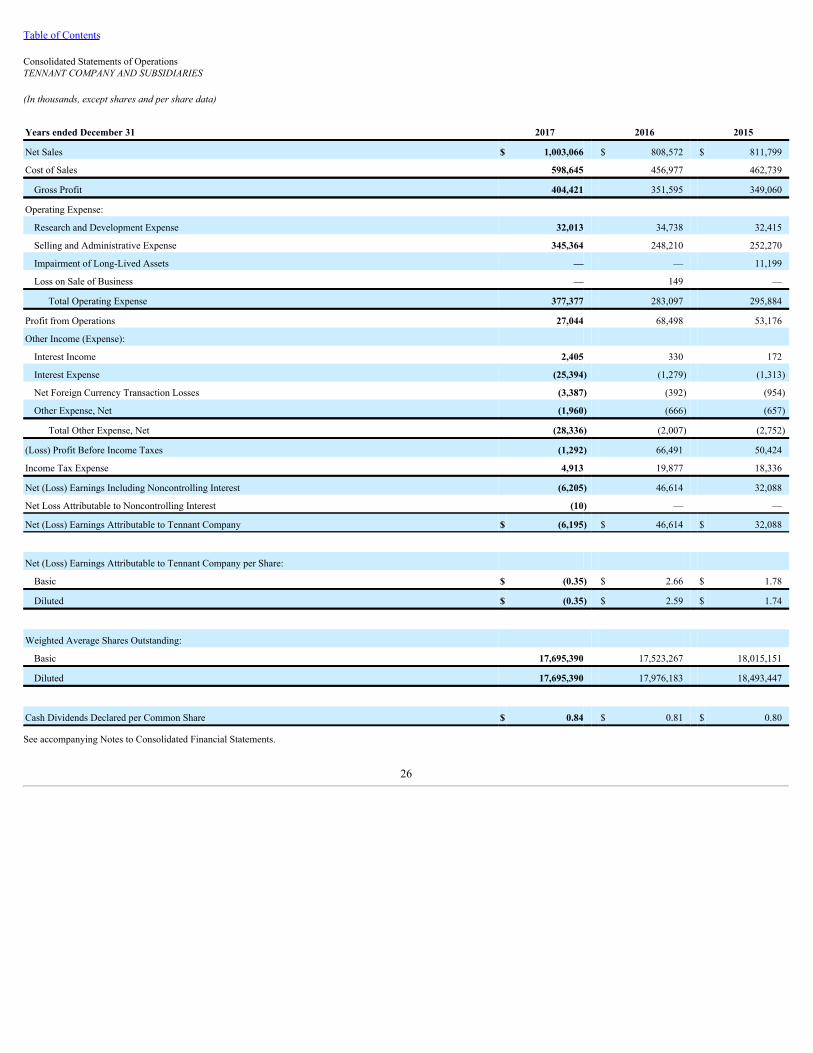
Table of Contents
Consolidated Statements of OperationsTENNANT COMPANY AND SUBSIDIARIES
(In thousands, except shares and per share data)
Years ended December 31 2017 2016 2015
Net Sales $ 1,003,066 $ 808,572 $ 811,799
Cost of Sales 598,645 456,977 462,739
Gross Profit 404,421 351,595 349,060
Operating Expense:
Research and Development Expense 32,013 34,738 32,415
Selling and Administrative Expense 345,364 248,210 252,270
Impairment of Long-Lived Assets — — 11,199
Loss on Sale of Business — 149 —
Total Operating Expense 377,377 283,097 295,884
Profit from Operations 27,044 68,498 53,176
Other Income (Expense):
Interest Income 2,405 330 172
Interest Expense (25,394) (1,279) (1,313)
Net Foreign Currency Transaction Losses (3,387) (392) (954)
Other Expense, Net (1,960) (666) (657)
Total Other Expense, Net (28,336) (2,007) (2,752)
(Loss) Profit Before Income Taxes (1,292) 66,491 50,424
Income Tax Expense 4,913 19,877 18,336
Net (Loss) Earnings Including Noncontrolling Interest (6,205) 46,614 32,088
Net Loss Attributable to Noncontrolling Interest (10) — —
Net (Loss) Earnings Attributable to Tennant Company $ (6,195) $ 46,614 $ 32,088
Net (Loss) Earnings Attributable to Tennant Company per Share:
Basic $ (0.35) $ 2.66 $ 1.78
Diluted $ (0.35) $ 2.59 $ 1.74
Weighted Average Shares Outstanding:
Basic 17,695,390 17,523,267 18,015,151
Diluted 17,695,390 17,976,183 18,493,447
Cash Dividends Declared per Common Share $ 0.84 $ 0.81 $ 0.80
See accompanying Notes to Consolidated Financial Statements.
26

Table of Contents
Consolidated Statements of Comprehensive IncomeTENNANT COMPANY AND SUBSIDIARIES
(In thousands)
Years ended December 31 2017 2016 2015
Net (Loss) Earnings Including Noncontrolling Interest $ (6,205) $ 46,614 $ 32,088
Other Comprehensive Income (Loss):
Foreign currency translation adjustments 28,356 109 (12,520)
Pension and retiree medical benefits 5,868 (2,248) 4,121
Cash flow hedge (7,731) (305) 164
Income Taxes:
Foreign currency translation adjustments 310 32 25
Pension and retiree medical benefits (2,087) 504 (1,265)
Cash flow hedge 2,884 114 (61)
Total Other Comprehensive Income (Loss), net of tax 27,600 (1,794) (9,536)
Total Comprehensive Income Including Noncontrolling Interest 21,395 44,820 22,552
Comprehensive Loss Attributable to Noncontrolling Interest (10) — —
Comprehensive Income Attributable to Tennant Company $ 21,405 $ 44,820 $ 22,552
See accompanying Notes to Consolidated Financial Statements.
27

Table of Contents
Consolidated Balance SheetsTENNANT COMPANY AND SUBSIDIARIES
(In thousands, except shares and per share data)
December 31 2017 2016
ASSETS
Current Assets:
Cash and Cash Equivalents $ 58,398 $ 58,033
Restricted Cash 653 517
Receivables:
Trade, less Allowances of $3,241 and $3,108, respectively 203,280 145,299
Other 6,236 3,835
Net Receivables 209,516 149,134
Inventories 127,694 78,622
Prepaid Expenses 19,351 9,204
Other Current Assets 7,503 2,412
Total Current Assets 423,115 297,922
Property, Plant and Equipment 382,768 298,500
Accumulated Depreciation (202,750) (186,403)
Property, Plant and Equipment, Net 180,018 112,097
Deferred Income Taxes 11,134 13,439
Goodwill 186,044 21,065
Intangible Assets, Net 172,347 6,460
Other Assets 21,319 19,054
Total Assets $ 993,977 $ 470,037
LIABILITIES AND TOTAL EQUITY
Current Liabilities:
Current Portion of Long-Term Debt $ 30,883 $ 3,459
Accounts Payable 96,082 47,408
Employee Compensation and Benefits 37,257 35,997
Income Taxes Payable 2,838 2,348
Other Current Liabilities 69,447 43,617
Total Current Liabilities 236,507 132,829
Long-Term Liabilities:
Long-Term Debt 345,956 32,735
Employee-Related Benefits 23,867 21,134
Deferred Income Taxes 53,225 171
Other Liabilities 35,948 4,625
Total Long-Term Liabilities 458,996 58,665
Total Liabilities 695,503 191,494
Commitments and Contingencies (Note 15) Equity:
Common Stock, $0.375 par value per share, 60,000,000 shares authorized; 17,881,177 and 17,688,350 issued and outstanding, respectively 6,705 6,633
Additional Paid-In Capital 15,089 3,653
Retained Earnings 297,032 318,180
Accumulated Other Comprehensive Loss (22,323) (49,923)
Total Tennant Company Shareholders' Equity 296,503 278,543
Noncontrolling Interest 1,971 —
Total Equity 298,474 278,543
Total Liabilities and Total Equity $ 993,977 $ 470,037
See accompanying Notes to Consolidated Financial Statements.
28

Table of Contents
Consolidated Statements of Cash FlowsTENNANT COMPANY AND SUBSIDIARIES
(In thousands)
Years ended December 31 2017 2016 2015
OPERATING ACTIVITIES
Net (Loss) Earnings Including Noncontrolling Interest $ (6,205) $ 46,614 $ 32,088
Adjustments to Reconcile Net (Loss) Earnings to Net Cash Provided by Operating Activities:
Depreciation 26,199 17,891 16,550
Amortization of Intangible Assets 17,054 409 1,481
Amortization of Debt Issuance Costs 1,779 — —
Debt Issuance Cost Charges Related to Short-Term Financing 6,200 — —
Fair Value Step-Up Adjustment to Acquired Inventory 7,245 — —
Impairment of Long-Lived Assets — — 11,199
Deferred Income Taxes (6,095) (1,172) (1,129)
Share-Based Compensation Expense 5,891 3,875 8,222
Allowance for Doubtful Accounts and Returns 1,602 468 1,089
Loss on Sale of Business — 149 —
Other, Net 364 (345) (100)
Changes in Operating Assets and Liabilities, Net of Assets Acquired:
Receivables, Net (14,381) (9,278) 4,547
Inventories (2,898) 23 (10,190)
Accounts Payable 10,849 (3,904) (10,455)
Employee Compensation and Benefits (7,780) 124 716
Other Current Liabilities 14,560 (185) (402)
Income Taxes 285 5,427 (4,283)
Other Assets and Liabilities (495) (2,218) (4,101)
Net Cash Provided by Operating Activities 54,174 57,878 45,232
INVESTING ACTIVITIES
Purchases of Property, Plant and Equipment (20,437) (26,526) (24,780)
Proceeds from Disposals of Property, Plant and Equipment 2,511 615 336
Proceeds from Principal Payments Received on Long-Term Note Receivable 667 — —
Issuance of Long-Term Note Receivable (1,500) (2,000) —
Acquisitions of Businesses, Net of Cash Acquired (354,073) (12,933) —
Purchase of Intangible Asset (2,500) — —
Proceeds from Sale of Business — 285 1,185
(Increase) Decrease in Restricted Cash (92) 116 (322)
Net Cash Used in Investing Activities (375,424) (40,443) (23,581)
FINANCING ACTIVITIES
Proceeds from Short-Term Debt 303,000 — —
Repayments of Short-Term Debt (303,000) — —
Proceeds from Issuance of Long-Term Debt 440,000 15,000 —
Payments of Long-Term Debt (96,248) (3,460) (3,445)
Payments of Debt Issuance Costs (16,482) — —
Change in Capital Lease Obligations 311 — —
Purchases of Common Stock — (12,762) (45,998)
Proceeds from Issuances of Common Stock 6,875 5,271 1,677
Excess Tax Benefit on Stock Plans — 686 859
Purchase of Noncontrolling Owner Interest (30) — —
Dividends Paid (14,953) (14,293) (14,498)
Net Cash Provided by (Used in) Financing Activities 319,473 (9,558) (61,405)
Effect of Exchange Rate Changes on Cash and Cash Equivalents 2,142 (1,144) (1,908)
NET INCREASE IN CASH AND CASH EQUIVALENTS 365 6,733 (41,662)
Cash and Cash Equivalents at Beginning of Year 58,033 51,300 92,962

CASH AND CASH EQUIVALENTS AT END OF YEAR $ 58,398 $ 58,033 $ 51,300
29
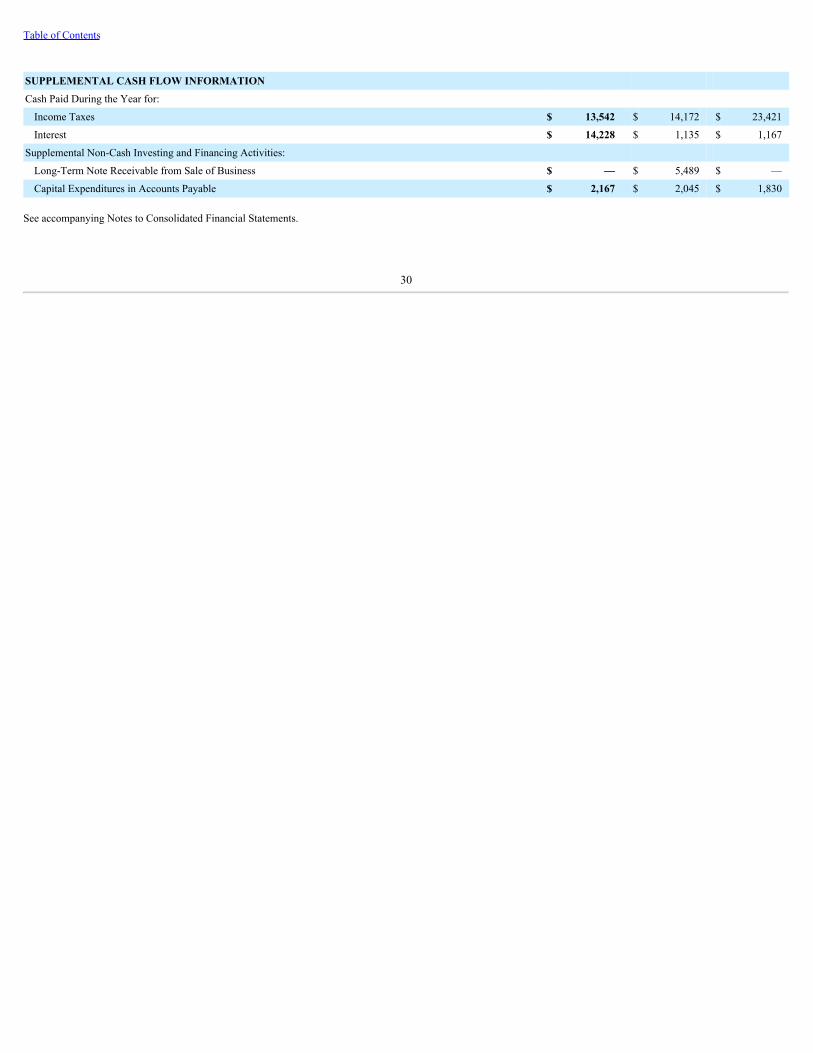
Table of Contents
SUPPLEMENTAL CASH FLOW INFORMATION Cash Paid During the Year for:
Income Taxes $ 13,542 $ 14,172 $ 23,421
Interest $ 14,228 $ 1,135 $ 1,167
Supplemental Non-Cash Investing and Financing Activities:
Long-Term Note Receivable from Sale of Business $ — $ 5,489 $ —
Capital Expenditures in Accounts Payable $ 2,167 $ 2,045 $ 1,830
See accompanying Notes to Consolidated Financial Statements.
30
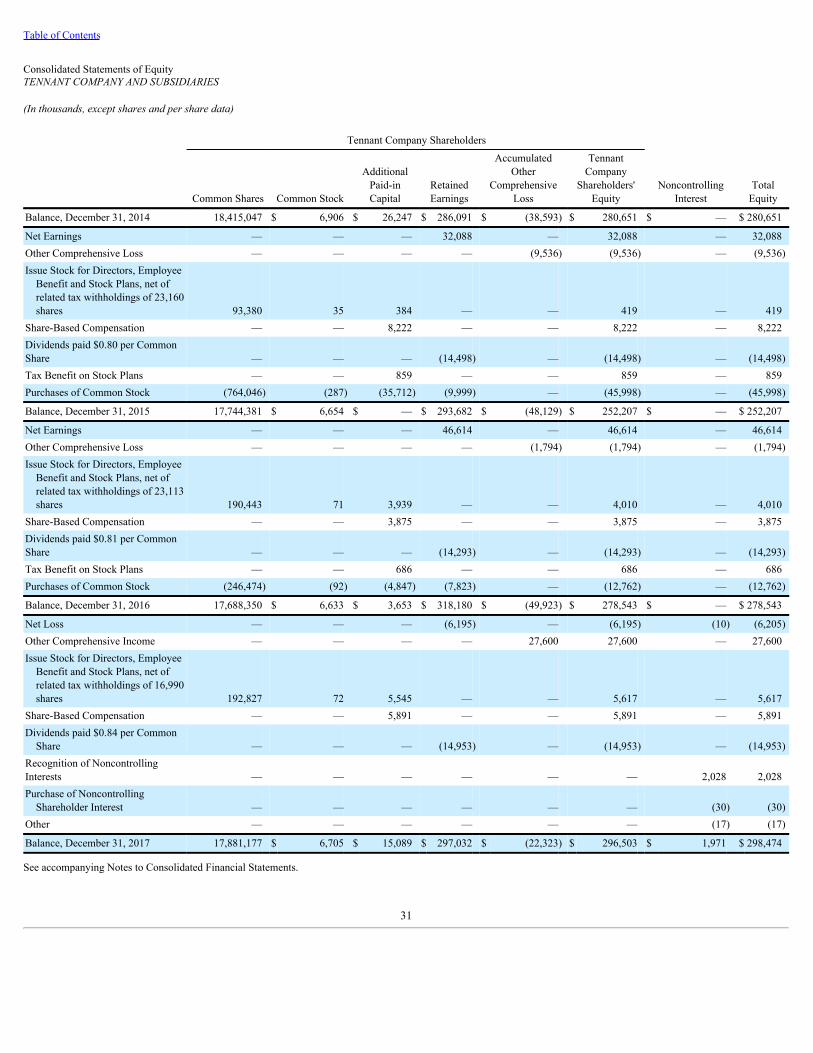
Table of Contents
Consolidated Statements of EquityTENNANT COMPANY AND SUBSIDIARIES
(In thousands, except shares and per share data)
Tennant Company Shareholders
Common Shares Common Stock
AdditionalPaid-inCapital
RetainedEarnings
AccumulatedOther
ComprehensiveLoss
TennantCompany
Shareholders'Equity
NoncontrollingInterest
TotalEquity
Balance, December 31, 2014 18,415,047 $ 6,906 $ 26,247 $ 286,091 $ (38,593) $ 280,651 $ — $ 280,651
Net Earnings — — — 32,088 — 32,088 — 32,088Other Comprehensive Loss — — — — (9,536) (9,536) — (9,536)Issue Stock for Directors, Employee
Benefit and Stock Plans, net ofrelated tax withholdings of 23,160shares 93,380 35 384 — — 419 — 419
Share-Based Compensation — — 8,222 — — 8,222 — 8,222Dividends paid $0.80 per CommonShare — — — (14,498) — (14,498) — (14,498)Tax Benefit on Stock Plans — — 859 — — 859 — 859Purchases of Common Stock (764,046) (287) (35,712) (9,999) — (45,998) — (45,998)
Balance, December 31, 2015 17,744,381 $ 6,654 $ — $ 293,682 $ (48,129) $ 252,207 $ — $ 252,207
Net Earnings — — — 46,614 — 46,614 — 46,614Other Comprehensive Loss — — — — (1,794) (1,794) — (1,794)Issue Stock for Directors, Employee
Benefit and Stock Plans, net ofrelated tax withholdings of 23,113shares 190,443 71 3,939 — — 4,010 — 4,010
Share-Based Compensation — — 3,875 — — 3,875 — 3,875Dividends paid $0.81 per CommonShare — — — (14,293) — (14,293) — (14,293)Tax Benefit on Stock Plans — — 686 — — 686 — 686Purchases of Common Stock (246,474) (92) (4,847) (7,823) — (12,762) — (12,762)
Balance, December 31, 2016 17,688,350 $ 6,633 $ 3,653 $ 318,180 $ (49,923) $ 278,543 $ — $ 278,543
Net Loss — — — (6,195) — (6,195) (10) (6,205)Other Comprehensive Income — — — — 27,600 27,600 — 27,600Issue Stock for Directors, Employee
Benefit and Stock Plans, net ofrelated tax withholdings of 16,990shares 192,827 72 5,545 — — 5,617 — 5,617
Share-Based Compensation — — 5,891 — — 5,891 — 5,891Dividends paid $0.84 per Common
Share — — — (14,953) — (14,953) — (14,953)Recognition of NoncontrollingInterests — — — — — — 2,028 2,028Purchase of Noncontrolling
Shareholder Interest — — — — — — (30) (30)Other — — — — — — (17) (17)
Balance, December 31, 2017 17,881,177 $ 6,705 $ 15,089 $ 297,032 $ (22,323) $ 296,503 $ 1,971 $ 298,474
See accompanying Notes to Consolidated Financial Statements.
31

Table of ContentsNOTES TO THE CONSOLIDATED FINANCIAL STATEMENTS
(In thousands, except shares and per share data)
1. Summary of Significant Accounting Policies
Nature of Operations – Tennant Company is a world leader in designing, manufacturing and marketing solutions that empower customers to achieve quality cleaningperformance, significantly reduce environmental impact and help create a cleaner, safer, healthier world. Tennant offers products and solutions consisting of mechanizedcleaning equipment, detergent-free and other sustainable cleaning technologies, aftermarket parts and consumables, equipment maintenance and repair service, specialty surfacecoatings, and business solutions such as financing, rental and leasing programs, and machine-to-machine asset management solutions. Tennant products are used in many typesof environments including: Retail establishments, distribution centers, factories and warehouses, public venues such as arenas and stadiums, office buildings, schools anduniversities, hospitals and clinics, parking lots and streets, and more. Customers include contract cleaners to whom organizations outsource facilities maintenance, as well asbusinesses that perform facilities maintenance themselves. The Company reaches these customers through the industry's largest direct sales and service organization and througha strong and well-supported network of authorized distributors worldwide.
In April 2017, the Company completed its acquisition of the IPC Group business. IPC manufactures a complete range of commercial cleaning products includingmechanized cleaning equipment, wet & dry vacuum cleaners, cleaning tools & carts and high pressure washers. These products are sold into similar vertical market applicationsas those listed above, but also into office cleaning and hospitality vertical markets through a global direct sales and service organization and network of distributors. IPC marketsproducts and services under the following valued brands: IPC, Gansow, Vaclensa, Portotecnica, Soteco and private-label brands.
Consolidation – The Consolidated Financial Statements include the accounts of Tennant Company and its subsidiaries. All intercompany transactions and balances havebeen eliminated. In these Notes to the Consolidated Financial Statements, Tennant Company is referred to as “Tennant,” “we,” “us,” or “our.”
Translation of Non-U.S. Currency – Foreign currency-denominated assets and liabilities have been translated to U.S. dollars at year-end exchange rates, while incomeand expense items are translated at average exchange rates prevailing during the year. Gains or losses resulting from translation are included as a separate component ofAccumulated Other Comprehensive Loss. The balance of cumulative foreign currency translation adjustments recorded within Accumulated Other Comprehensive Loss as ofDecember 31, 2017 , 2016 and 2015 was a net loss of $15,778 , $44,444 and $44,585 , respectively. The majority of translation adjustments are not adjusted for income taxes assubstantially all translation adjustments relate to permanent investments in non-U.S. subsidiaries. Net Foreign Currency Transaction Losses are included in Other Income(Expense).
Use of Estimates – In preparing the consolidated financial statements in conformity with U.S. generally accepted accounting principles ("U.S. GAAP"), management mustmake decisions that impact the reported amounts of assets, liabilities, revenues, expenses and the related disclosures, including disclosures of contingent assets and liabilities.Such decisions include the selection of the appropriate accounting principles to be applied and the assumptions on which to base accounting estimates. Estimates are used indetermining, among other items, sales promotions and incentives accruals, inventory valuation, warranty reserves, allowance for doubtful accounts, pension and postretirementaccruals, useful lives for intangible assets, and future cash flows associated with impairment testing for Goodwill and other long-lived assets. These estimates and assumptionsare based on management’s best estimates and judgments. Management evaluates its estimates and assumptions on an ongoing basis using historical experience and other factorsthat management believes to be reasonable under the circumstances. We adjust such estimates and assumptions when facts and circumstances dictate. A number of these factorsinclude, among others, economic conditions, credit markets, foreign currency, commodity cost volatility and consumer spending and confidence, all of which have combined toincrease the uncertainty inherent in such estimates and assumptions. As future events and their effects cannot be determined with precision, actual amounts could differsignificantly from those estimated at the time the consolidated financial statements are prepared. Changes in those estimates resulting from continuing changes in the economicenvironment will be reflected in the financial statements in future periods.
Cash and Cash Equivalents – We consider all highly liquid investments with maturities of three months or less from the date of purchase to be cash equivalents.
Restricted Cash – We have a total of $653 as of December 31, 2017 that serves as collateral backing certain bank guarantees and is therefore restricted. This money isinvested in time deposits.
Receivables – Credit is granted to our customers in the normal course of business. Receivables are recorded at original carrying value less reserves for estimateduncollectible accounts and sales returns. To assess the collectability of these receivables, we perform ongoing credit evaluations of our customers’ financial condition. Throughthese evaluations, we may become aware of a situation where a customer may not be able to meet its financial obligations due to deterioration of its financial viability, creditratings or bankruptcy. The reserve requirements are based on the best facts available to us and are reevaluated and adjusted as additional information becomes available. Ourreserves are also based on amounts determined by using percentages applied to trade receivables. These percentages are determined by a variety of factors including, but notlimited to, current economic trends, historical payment and bad debt write-off experience. An account is considered past-due or delinquent when it has not been paid within thecontractual terms. Uncollectible accounts are written off against the reserves when it is deemed that a customer account is uncollectible.
Inventories – Inventories are valued at the lower of cost or net realizable value. Cost is determined on a first-in, first-out (“FIFO”) basis except for Inventories in NorthAmerica, which are determined on a last-in, first-out (“LIFO”) basis.
Property, Plant and Equipment – Property, plant and equipment is carried at cost. Additions and improvements that extend the lives of the assets are capitalized whileexpenditures for repairs and maintenance are expensed as incurred. We generally depreciate buildings and improvements by the straight-line method over a life of 30 years .Other property, plant and equipment are generally depreciated using the straight-line method based on lives of 3 years to 15 years .
32
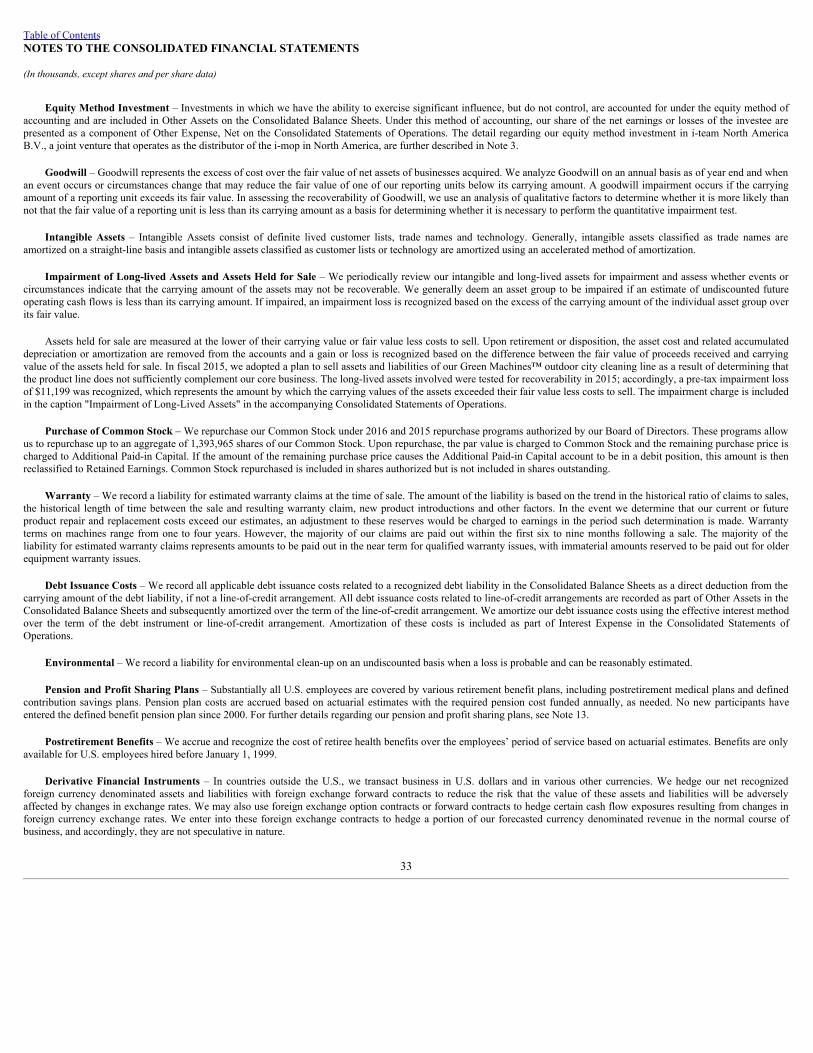
Table of ContentsNOTES TO THE CONSOLIDATED FINANCIAL STATEMENTS
(In thousands, except shares and per share data)
Equity Method Investment – Investments in which we have the ability to exercise significant influence, but do not control, are accounted for under the equity method ofaccounting and are included in Other Assets on the Consolidated Balance Sheets. Under this method of accounting, our share of the net earnings or losses of the investee arepresented as a component of Other Expense, Net on the Consolidated Statements of Operations. The detail regarding our equity method investment in i-team North AmericaB.V., a joint venture that operates as the distributor of the i-mop in North America, are further described in Note 3.
Goodwill – Goodwill represents the excess of cost over the fair value of net assets of businesses acquired. We analyze Goodwill on an annual basis as of year end and whenan event occurs or circumstances change that may reduce the fair value of one of our reporting units below its carrying amount. A goodwill impairment occurs if the carryingamount of a reporting unit exceeds its fair value. In assessing the recoverability of Goodwill, we use an analysis of qualitative factors to determine whether it is more likely thannot that the fair value of a reporting unit is less than its carrying amount as a basis for determining whether it is necessary to perform the quantitative impairment test.
Intangible Assets – Intangible Assets consist of definite lived customer lists, trade names and technology. Generally, intangible assets classified as trade names areamortized on a straight-line basis and intangible assets classified as customer lists or technology are amortized using an accelerated method of amortization.
Impairment of Long-lived Assets and Assets Held for Sale – We periodically review our intangible and long-lived assets for impairment and assess whether events orcircumstances indicate that the carrying amount of the assets may not be recoverable. We generally deem an asset group to be impaired if an estimate of undiscounted futureoperating cash flows is less than its carrying amount. If impaired, an impairment loss is recognized based on the excess of the carrying amount of the individual asset group overits fair value.
Assets held for sale are measured at the lower of their carrying value or fair value less costs to sell. Upon retirement or disposition, the asset cost and related accumulateddepreciation or amortization are removed from the accounts and a gain or loss is recognized based on the difference between the fair value of proceeds received and carryingvalue of the assets held for sale. In fiscal 2015, we adopted a plan to sell assets and liabilities of our Green Machines™ outdoor city cleaning line as a result of determining thatthe product line does not sufficiently complement our core business. The long-lived assets involved were tested for recoverability in 2015; accordingly, a pre-tax impairment lossof $11,199 was recognized, which represents the amount by which the carrying values of the assets exceeded their fair value less costs to sell. The impairment charge is includedin the caption "Impairment of Long-Lived Assets" in the accompanying Consolidated Statements of Operations.
Purchase of Common Stock – We repurchase our Common Stock under 2016 and 2015 repurchase programs authorized by our Board of Directors. These programs allowus to repurchase up to an aggregate of 1,393,965 shares of our Common Stock. Upon repurchase, the par value is charged to Common Stock and the remaining purchase price ischarged to Additional Paid-in Capital. If the amount of the remaining purchase price causes the Additional Paid-in Capital account to be in a debit position, this amount is thenreclassified to Retained Earnings. Common Stock repurchased is included in shares authorized but is not included in shares outstanding.
Warranty – We record a liability for estimated warranty claims at the time of sale. The amount of the liability is based on the trend in the historical ratio of claims to sales,the historical length of time between the sale and resulting warranty claim, new product introductions and other factors. In the event we determine that our current or futureproduct repair and replacement costs exceed our estimates, an adjustment to these reserves would be charged to earnings in the period such determination is made. Warrantyterms on machines range from one to four years. However, the majority of our claims are paid out within the first six to nine months following a sale. The majority of theliability for estimated warranty claims represents amounts to be paid out in the near term for qualified warranty issues, with immaterial amounts reserved to be paid out for olderequipment warranty issues.
Debt Issuance Costs – We record all applicable debt issuance costs related to a recognized debt liability in the Consolidated Balance Sheets as a direct deduction from thecarrying amount of the debt liability, if not a line-of-credit arrangement. All debt issuance costs related to line-of-credit arrangements are recorded as part of Other Assets in theConsolidated Balance Sheets and subsequently amortized over the term of the line-of-credit arrangement. We amortize our debt issuance costs using the effective interest methodover the term of the debt instrument or line-of-credit arrangement. Amortization of these costs is included as part of Interest Expense in the Consolidated Statements ofOperations.
Environmental – We record a liability for environmental clean-up on an undiscounted basis when a loss is probable and can be reasonably estimated.
Pension and Profit Sharing Plans – Substantially all U.S. employees are covered by various retirement benefit plans, including postretirement medical plans and definedcontribution savings plans. Pension plan costs are accrued based on actuarial estimates with the required pension cost funded annually, as needed. No new participants haveentered the defined benefit pension plan since 2000. For further details regarding our pension and profit sharing plans, see Note 13.
Postretirement Benefits – We accrue and recognize the cost of retiree health benefits over the employees’ period of service based on actuarial estimates. Benefits are onlyavailable for U.S. employees hired before January 1, 1999.
Derivative Financial Instruments – In countries outside the U.S., we transact business in U.S. dollars and in various other currencies. We hedge our net recognizedforeign currency denominated assets and liabilities with foreign exchange forward contracts to reduce the risk that the value of these assets and liabilities will be adverselyaffected by changes in exchange rates. We may also use foreign exchange option contracts or forward contracts to hedge certain cash flow exposures resulting from changes inforeign currency exchange rates. We enter into these foreign exchange contracts to hedge a portion of our forecasted currency denominated revenue in the normal course ofbusiness, and accordingly, they are not speculative in nature.
33

Table of ContentsNOTES TO THE CONSOLIDATED FINANCIAL STATEMENTS
(In thousands, except shares and per share data)
We account for our foreign currency hedging instruments as either assets or liabilities on the balance sheet and measure them at fair value. Gains and losses resulting fromchanges in fair value are accounted for depending on the use of the derivative and whether it is designated and qualifies for hedge accounting. Gains and losses from foreignexchange forward contracts that hedge certain balance sheet positions are recorded each period to Net Foreign Currency Transaction Losses in our Consolidated Statements ofOperations. Foreign exchange option contracts or forward contracts hedging forecasted foreign currency revenue are designated as cash flow hedges under accounting forderivative instruments and hedging activities, with gains and losses recorded each period to Accumulated Other Comprehensive Loss in our Consolidated Balance Sheets, untilthe forecasted transaction occurs. When the forecasted transaction occurs, we reclassify the related gain or loss on the cash flow hedge to Net Sales. In the event the underlyingforecasted transaction does not occur, or it becomes probable that it will not occur, we reclassify the gain or loss on the related cash flow hedge from Accumulated OtherComprehensive Loss to Net Foreign Currency Transaction Losses in our Consolidated Statements of Operations at that time. If we do not elect hedge accounting, or the contractdoes not qualify for hedge accounting treatment, the changes in fair value from period to period are recorded in Net Foreign Currency Transaction Losses in our ConsolidatedStatements of Operations. See Note 11 for additional information regarding our hedging activities.
Revenue Recognition – We recognize revenue when persuasive evidence of an arrangement exists, title and risk of ownership have passed to the customer, the sales priceis fixed or determinable and collectability is reasonably assured. Generally, these criteria are met at the time the product is shipped. Provisions for estimated returns, rebates anddiscounts are provided for at the time the related revenue is recognized. Freight revenue billed to customers is included in Net Sales and the related shipping expense is includedin Cost of Sales. Service revenue is recognized in the period the service is performed or ratably over the period of the related service contract.
Customers may obtain financing through third-party leasing companies to assist in their acquisition of our equipment products. Certain lease transactions classified asoperating leases contain retained ownership provisions or guarantees, which results in recognition of revenue over the lease term. As a result, we defer the sale of thesetransactions and record the sales proceeds as collateralized borrowings or deferred revenue. The underlying equipment relating to operating leases is depreciated on a straight-line basis, not to exceed the equipment’s estimated useful life.
Revenues from contracts with multiple element arrangements are recognized as each element is earned. We offer service contracts in conjunction with equipment sales inaddition to selling equipment and service contracts separately. Sales proceeds related to service contracts are deferred if the proceeds are received in advance of the service andrecognized ratably over the contract period.
In May 2014, the Financial Accounting Standards Board ("FASB") issued Accounting Standards Update ("ASU") No. 2014-09, Revenue from Contracts with Customers(Topic 606) . This ASU will replace all existing revenue recognition standards and significantly expand the disclosure requirements for revenue arrangements. This guidancerequires an entity to recognize the amount of revenue to which it expects to be entitled for the transfer of promised goods or services to customers. This guidance provides a five-step analysis of transactions to determine when and how revenue is recognized. This guidance also requires enhanced disclosures regarding the nature, amount, timing anduncertainty of revenue and cash flows arising from an entity's contracts with customers. We adopted the new standard effective January 1, 2018. The adoption of this ASU didnot have a material impact on our financial condition, results of operations or cash flows, other than additional disclosure requirements.
Share-based Compensation – We account for employee share-based compensation using the fair value based method. Our share-based compensation plans are more fullydescribed in Note 17 of the Consolidated Financial Statements.
Research and Development – Research and development costs are expensed as incurred.
Advertising Costs – We advertise products, technologies and solutions to customers and prospective customers through a variety of marketing campaign and promotionalefforts. These efforts include tradeshows, online advertising, e-mail marketing, mailings, sponsorships and telemarketing. Advertising costs are expensed as incurred. In 2017 ,2016 and 2015 such activities amounted to $8,228 , $7,269 and $7,418 , respectively.
Income Taxes – Deferred tax assets and liabilities are recognized for the expected future tax consequences of temporary differences between the book and tax bases ofexisting assets and liabilities. A valuation allowance is provided when, in management’s judgment, it is more likely than not that some portion or all of the deferred tax asset willnot be realized. We have established contingent tax liabilities using management’s best judgment. We follow guidance provided by Accounting Standards Codification ("ASC")740, Income Taxes , regarding uncertainty in income taxes, to record these contingent tax liabilities (refer to Note 16 of the Consolidated Financial Statements for additionalinformation). We adjust these liabilities as facts and circumstances change. Interest Expense is recognized in the first period the interest would begin accruing. Penalties arerecognized in the period we claim or expect to claim the position in our tax return. Interest and penalties expenses are classified as an income tax expense.
Sales Tax – Sales taxes collected from customers and remitted to governmental authorities are presented on a net basis.
Earnings per Share – Basic (loss) earnings per share is computed by dividing Net (Loss) Earnings Attributable to Tennant Company by the Weighted Average SharesOutstanding during the period. Diluted earnings per share assumes conversion of potentially dilutive stock options, performance shares, restricted shares and restricted stockunits. These conversions are not included in our computation of diluted earnings per share if we have a net loss attributable to Tennant Company in a reporting period, as theeffects are anti-dilutive.
New Accounting Pronouncements – In accordance with ASU No. 2016-09, Compensation–Stock Compensation (Topic 718): Improvements to Employee Share-BasedPayment Accounting , all excess tax benefits and tax deficiencies are recorded as a component of the provision for income taxes in the reporting period in which they occur.Additionally, we present excess tax benefits along with other income tax cash flows on the Consolidated Statements of Cash Flows as an operating activity rather than, aspreviously required, a financing activity. For further details regarding the implementation of this ASU and the impact on our financial statements, see Note 2.
34

Table of ContentsNOTES TO THE CONSOLIDATED FINANCIAL STATEMENTS
(In thousands, except shares and per share data)
2. Newly Adopted Accounting PronouncementsOn March 30, 2016, the FASB issued ASU 2016-09, Compensation–Stock Compensation (Topic 718): Improvements to Employee Share-Based Payment Accounting ,
which amends Accounting Standards Codification ("ASC") Topic 718, Compensation–Stock Compensation . ASU 2016-09 simplifies several aspects of the accounting for share-based payment transaction, including the income tax consequences, classification of awards as either equity or liabilities and classification on the Consolidated Statements ofCash Flows. Under the new standard, all excess tax benefits and tax deficiencies are recorded as a component of the provision for income taxes in the reporting period in whichthey occur. Additionally, ASU 2016-09 requires that the company present excess tax benefits along with other income tax cash flows on the Consolidated Statements of CashFlows as an operating activity rather than, as previously required, a financing activity. ASU 2016-09 is effective for fiscal years beginning after December 15, 2016.
We have adopted ASU 2016-09 effective January 1, 2017 on a prospective basis where permitted by the new standard. As a result of this adoption:
• In 2017 , we recognized discrete tax benefits of $1,168 in the Income Tax Expense line item of our Consolidated Statements of Operations related to excess tax benefitsupon vesting or settlement in that period.
• We elected to adopt the cash flow presentation of the excess tax benefits prospectively where the tax benefits are classified along with other income tax cash flows asoperating cash flows in 2017 . Our 2016 and 2015 excess tax benefits are recognized as financing cash flows. However, other income tax cash flows are classified asoperating cash flows.
• We have elected to account for forfeitures as they occur, rather than electing to estimate the number of share-based awards expected to vest to determine the amount ofcompensation cost to be recognized in each period. The difference of such change is immaterial.
3. Investment in Joint VentureOn February 13, 2017, the company, through a Dutch subsidiary, and i-team Global, a Future Cleaning Technologies, B.V. company headquartered in The Netherlands,
announced the January 1, 2017 formation of i-team North America B.V., a joint venture that will operate as the distributor of the i-mop in North America. We began selling andservicing the i-mop in the second quarter of 2017. We own a 50% ownership interest in the joint venture, which is accounted for under the equity method of accounting, with ourproportionate share of income or loss presented as a component of Other Expense, Net on the Consolidated Statements of Operations. In 2017 , this amount is immaterial.
As of December 31, 2017 , the carrying value of the company's investment in the joint venture was $75 . In March 2017, we issued a $1,500 loan to the joint venture and, asa result, recorded a long-term note receivable in Other Assets on the Consolidated Balance Sheets.
4. Management Actions
During the first quarter of 2017 , we implemented a restructuring action to better align our global resources and expense structure with a lower growth global economicenvironment. The pre-tax charge of $8,018 , including other associated costs of $961 , consisted primarily of severance and was included within Selling and AdministrativeExpense in the Consolidated Statements of Operations. The charge impacted our Americas, Europe, Middle East and Africa ("EMEA") and Asia Pacific ("APAC") operatingsegments. We believe the anticipated savings will offset the pre-tax charge in approximately one year from the date of the action. We do not expect additional costs will beincurred related to this restructuring action.
During the fourth quarter of 2017 , we implemented a restructuring action primarily driven by integration actions related to our acquisition of IP Cleaning S.p.A and itssubsidiaries ("IPC Group"). See Note 5 for further details regarding our acquisition of the IPC Group. The restructuring action consisted primarily of severance and includesreductions in overall staffing to streamline and right-size the organization to support anticipated business requirements. The pre-tax charge of $2,501 was included within Sellingand Administrative Expense in the Consolidated Statements of Operations. The charge impacted our Americas, EMEA and APAC operating segments. We believe theanticipated savings will offset the pre-tax charge in approximately one year from the date of the action. We do not expect additional costs will be incurred related to thisrestructuring action.
A reconciliation to the ending liability balance of severance and related costs as of December 31, 2017 is as follows:
Severance and Related
Costs
2017 restructuring actions $ 9,558Cash payments (6,312)Foreign currency adjustments 190
December 31, 2017 Balance $ 3,436
5. AcquisitionsIP Cleaning S.p.A.
On April 6, 2017, we acquired 100 percent of the outstanding capital stock of IP Cleaning S.p.A. and its subsidiaries ("IPC Group") for a purchase price of $353,769 , netof cash acquired of $8,804 . The primary seller was Ambienta SGR S.p.A., a European private equity fund. IPC Group, based in Italy, is a designer and manufacturer ofinnovative professional cleaning equipment, cleaning tools and supplies. The acquisition strengthens our presence and market share in Europe and will allow us to betterleverage our EMEA cost structure. We funded the acquisition of IPC Group, along with related fees, including refinancing of existing debt, with funds raised through borrowingsunder a senior secured credit facility in an aggregate principal amount of $420,000 . Further details regarding our acquisition financing arrangements are discussed in Note 9.
35

Table of ContentsNOTES TO THE CONSOLIDATED FINANCIAL STATEMENTS
(In thousands, except shares and per share data)
The following table summarizes the preliminary fair value measurement of the assets acquired and liabilities assumed as of the date of acquisition:
ASSETS Receivables $ 39,984Inventories 46,442Other Current Assets 5,314Assets Held for Sale 2,247Property, Plant and Equipment 63,890
Intangible Assets Subject to Amortization: Trade Name 26,753Customer Lists 123,061Technology 9,631
Other Assets 8,261
Total Identifiable Assets Acquired 325,583
LIABILITIES Accounts Payable 32,227Accrued Expenses 15,611Deferred Income Taxes 60,433Other Liabilities 9,360
Total Identifiable Liabilities Assumed 117,631
Net Identifiable Assets Acquired 207,952
Noncontrolling Interest (2,028)Goodwill 147,845
Total Estimated Purchase Price, net of Cash Acquired $ 353,769
The acquired assets, liabilities and operating results have been included in our Consolidated Financial Statements from the date of acquisition. During 2017, we included netsales of $174,444 and a net loss of $14,483 from IPC Group in our Consolidated Statements of Operations. The net loss includes a fair value adjustment, net of tax, of $5,237to the acquired inventory of IPC Group. In addition, costs of $10,408 , net of tax, associated with the acquisition of the IPC Group were expensed as incurred in the 2017Consolidated Statement of Operations. The preliminary gross amount of the accounts receivable acquired is $44,654 , of which $4,670 is expected to be uncollectible.
The fair value measurements were final at December 31, 2017, with the exception of the fair value of accounts receivable, inventory excess and obsolescence reserves,intangible assets subject to amortization, goodwill, warranty, income tax payable and deferred income taxes. We expect the fair value measurement process to be completed nolater than one year from the acquisition date.
Goodwill was calculated as the difference between the acquisition date fair value of the total purchase price consideration and the fair value of the net identifiable assetsacquired, and represents the future economic benefits that we expect to achieve as a result of the acquisition. This resulted in an estimated purchase price in excess of the fairvalue of identifiable net assets acquired.
The estimated purchase price also included the fair value of other assets that were not identifiable and not separately recognizable under accounting rules (e.g., assembledworkforce) or these assets were of immaterial value. In addition, there is a going concern element that represents our ability to earn a higher rate of return on the group of assetsthan would be expected on the separate assets as determined during the valuation process. Based on preliminary fair value measurement of the assets acquired and liabilitiesassumed, we allocated $147,845 to goodwill for the expected synergies from combining IPC Group with our existing business. None of the goodwill is expected to bedeductible for income tax purposes. The assignment of goodwill to reporting units is not complete, pending finalization of the valuation measurements.
The fair value of acquired identifiable intangible assets was primarily determined using discounted expected cash flows. The fair value of acquired identifiable tangibleassets was primarily determined using the cost or market approach. The valuations were based on the information that was available as of the acquisition date and theexpectations and assumptions that have been deemed reasonable by us. There are inherent uncertainties and management judgment required in these determinations. The fairvalue measurements of the assets acquired and liabilities assumed were based on valuations involving significant unobservable inputs, or Level 3 in the fair value hierarchy.
The preliminary fair value of the acquired intangible assets is $159,445 . The expected lives of the acquired amortizable intangible assets are approximately 15 years forcustomer lists, 10 years for trade names and 10 years for technology. Trade names are being amortized on a straight-line basis while the customer lists and technology arebeing amortized on an accelerated basis. We recorded amortization expense of $15,746 in Selling and Administrative Expense on our Consolidated Statements of Operations forthese acquired intangible assets in 2017.
36
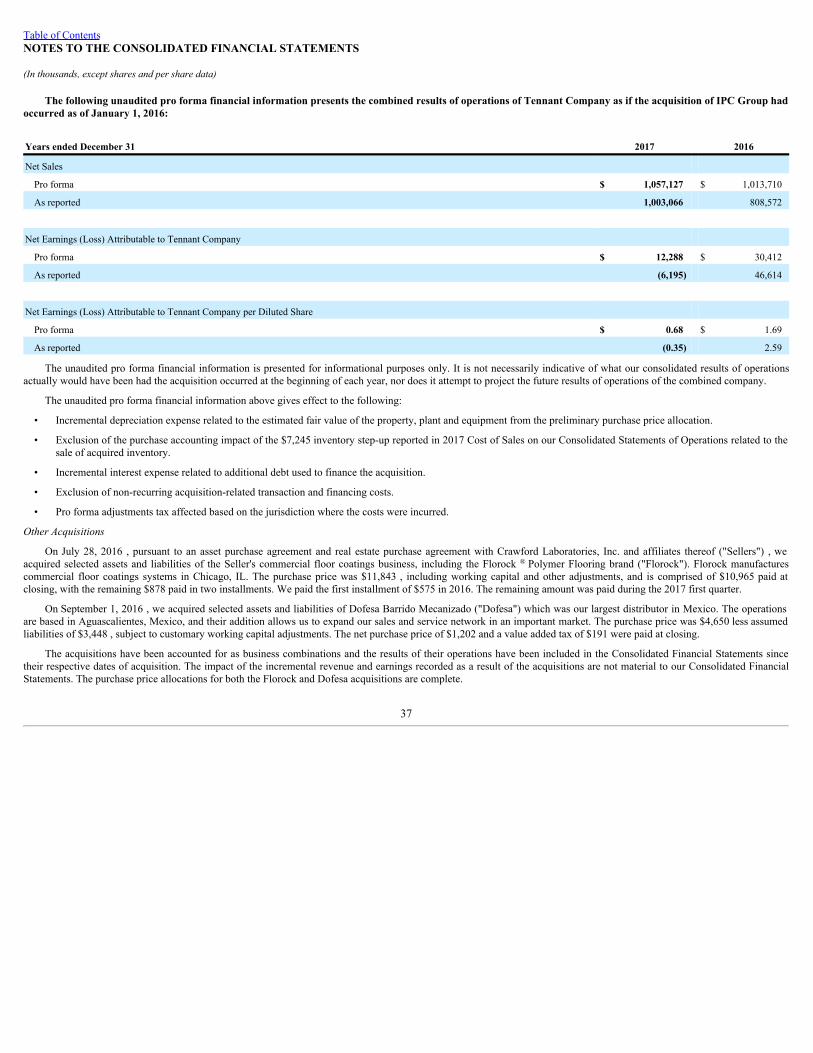
Table of ContentsNOTES TO THE CONSOLIDATED FINANCIAL STATEMENTS
(In thousands, except shares and per share data)
The following unaudited pro forma financial information presents the combined results of operations of Tennant Company as if the acquisition of IPC Group hadoccurred as of January 1, 2016:
Years ended December 31 2017 2016
Net Sales
Pro forma $ 1,057,127 $ 1,013,710
As reported 1,003,066 808,572
Net Earnings (Loss) Attributable to Tennant Company
Pro forma $ 12,288 $ 30,412
As reported (6,195) 46,614
Net Earnings (Loss) Attributable to Tennant Company per Diluted Share
Pro forma $ 0.68 $ 1.69
As reported (0.35) 2.59
The unaudited pro forma financial information is presented for informational purposes only. It is not necessarily indicative of what our consolidated results of operationsactually would have been had the acquisition occurred at the beginning of each year, nor does it attempt to project the future results of operations of the combined company.
The unaudited pro forma financial information above gives effect to the following:
• Incremental depreciation expense related to the estimated fair value of the property, plant and equipment from the preliminary purchase price allocation.
• Exclusion of the purchase accounting impact of the $7,245 inventory step-up reported in 2017 Cost of Sales on our Consolidated Statements of Operations related to thesale of acquired inventory.
• Incremental interest expense related to additional debt used to finance the acquisition.
• Exclusion of non-recurring acquisition-related transaction and financing costs.
• Pro forma adjustments tax affected based on the jurisdiction where the costs were incurred.
Other Acquisitions
On July 28, 2016 , pursuant to an asset purchase agreement and real estate purchase agreement with Crawford Laboratories, Inc. and affiliates thereof ("Sellers") , weacquired selected assets and liabilities of the Seller's commercial floor coatings business, including the Florock ® Polymer Flooring brand ("Florock"). Florock manufacturescommercial floor coatings systems in Chicago, IL. The purchase price was $11,843 , including working capital and other adjustments, and is comprised of $10,965 paid atclosing, with the remaining $878 paid in two installments. We paid the first installment of $575 in 2016. The remaining amount was paid during the 2017 first quarter.
On September 1, 2016 , we acquired selected assets and liabilities of Dofesa Barrido Mecanizado ("Dofesa") which was our largest distributor in Mexico. The operationsare based in Aguascalientes, Mexico, and their addition allows us to expand our sales and service network in an important market. The purchase price was $4,650 less assumedliabilities of $3,448 , subject to customary working capital adjustments. The net purchase price of $1,202 and a value added tax of $191 were paid at closing.
The acquisitions have been accounted for as business combinations and the results of their operations have been included in the Consolidated Financial Statements sincetheir respective dates of acquisition. The impact of the incremental revenue and earnings recorded as a result of the acquisitions are not material to our Consolidated FinancialStatements. The purchase price allocations for both the Florock and Dofesa acquisitions are complete.
37

Table of ContentsNOTES TO THE CONSOLIDATED FINANCIAL STATEMENTS
(In thousands, except shares and per share data)
The components of the final purchase price of the Florock and Dofesa acquisitions, as described above, have been allocated as follows:
Current Assets $ 5,949Property, Plant and Equipment, net 4,112Identified Intangible Assets 6,055Goodwill 1,739Other Assets 7
Total Assets Acquired 17,862
Current Liabilities 4,764Other Liabilities 53
Total Liabilities Assumed 4,817
Net Assets Acquired $ 13,045
6. Inventories
Inventories as of December 31, consisted of the following:
2017 2016
Inventories carried at LIFO: Finished goods $ 43,439 $ 39,142
Raw materials, production parts and work-in-process 23,694 23,980
LIFO reserve (28,429) (28,190)
Total LIFO inventories $ 38,704 $ 34,932
Inventories carried at FIFO: Finished goods $ 54,161 $ 31,044
Raw materials, production parts and work-in-process 34,829 12,646
Total FIFO inventories $ 88,990 $ 43,690
Total inventories $ 127,694 $ 78,622
The LIFO reserve approximates the difference between LIFO carrying cost and FIFO.
7. Property, Plant and Equipment
Property, Plant and Equipment and related Accumulated Depreciation, including equipment under capital leases, as of December 31, consisted of the following:
2017 2016
Property, Plant and Equipment: Land $ 18,152 $ 6,328
Buildings and improvements 96,230 58,577
Machinery and manufacturing equipment 151,645 116,221
Office equipment 107,312 89,838
Work in progress 9,429 27,536
Total Property, Plant and Equipment 382,768 298,500
Less: Accumulated Depreciation (202,750) (186,403)
Property, Plant and Equipment, Net $ 180,018 $ 112,097
Depreciation expense was $26,199 in 2017 , $17,891 in 2016 and $16,550 in 2015 .
38
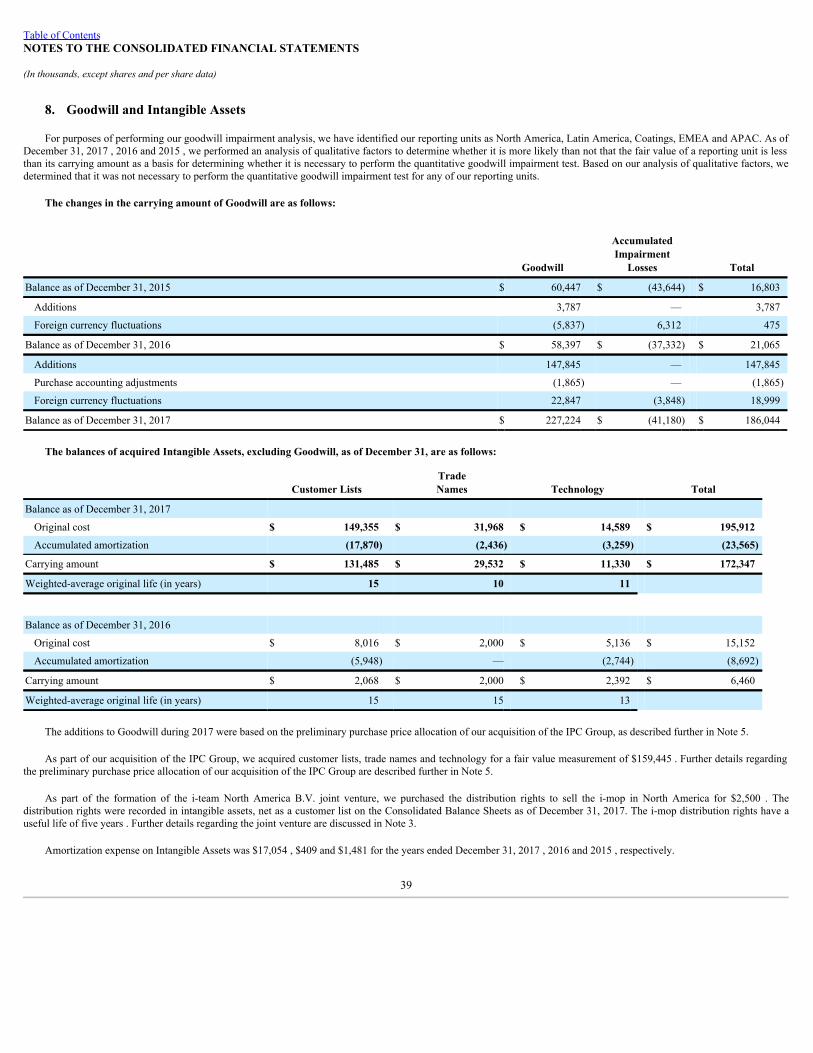
Table of ContentsNOTES TO THE CONSOLIDATED FINANCIAL STATEMENTS
(In thousands, except shares and per share data)
8. Goodwill and Intangible Assets
For purposes of performing our goodwill impairment analysis, we have identified our reporting units as North America, Latin America, Coatings, EMEA and APAC. As ofDecember 31, 2017 , 2016 and 2015 , we performed an analysis of qualitative factors to determine whether it is more likely than not that the fair value of a reporting unit is lessthan its carrying amount as a basis for determining whether it is necessary to perform the quantitative goodwill impairment test. Based on our analysis of qualitative factors, wedetermined that it was not necessary to perform the quantitative goodwill impairment test for any of our reporting units.
The changes in the carrying amount of Goodwill are as follows:
Goodwill
AccumulatedImpairment
Losses Total
Balance as of December 31, 2015 $ 60,447 $ (43,644) $ 16,803
Additions 3,787 — 3,787
Foreign currency fluctuations (5,837) 6,312 475
Balance as of December 31, 2016 $ 58,397 $ (37,332) $ 21,065
Additions 147,845 — 147,845
Purchase accounting adjustments (1,865) — (1,865)
Foreign currency fluctuations 22,847 (3,848) 18,999
Balance as of December 31, 2017 $ 227,224 $ (41,180) $ 186,044
The balances of acquired Intangible Assets, excluding Goodwill, as of December 31, are as follows:
Customer Lists TradeNames Technology Total
Balance as of December 31, 2017
Original cost $ 149,355 $ 31,968 $ 14,589 $ 195,912
Accumulated amortization (17,870) (2,436) (3,259) (23,565)
Carrying amount $ 131,485 $ 29,532 $ 11,330 $ 172,347
Weighted-average original life (in years) 15 10 11
Balance as of December 31, 2016
Original cost $ 8,016 $ 2,000 $ 5,136 $ 15,152
Accumulated amortization (5,948) — (2,744) (8,692)
Carrying amount $ 2,068 $ 2,000 $ 2,392 $ 6,460
Weighted-average original life (in years) 15 15 13
The additions to Goodwill during 2017 were based on the preliminary purchase price allocation of our acquisition of the IPC Group, as described further in Note 5.
As part of our acquisition of the IPC Group, we acquired customer lists, trade names and technology for a fair value measurement of $159,445 . Further details regardingthe preliminary purchase price allocation of our acquisition of the IPC Group are described further in Note 5.
As part of the formation of the i-team North America B.V. joint venture, we purchased the distribution rights to sell the i-mop in North America for $2,500 . Thedistribution rights were recorded in intangible assets, net as a customer list on the Consolidated Balance Sheets as of December 31, 2017. The i-mop distribution rights have auseful life of five years . Further details regarding the joint venture are discussed in Note 3.
Amortization expense on Intangible Assets was $17,054 , $409 and $1,481 for the years ended December 31, 2017 , 2016 and 2015 , respectively.
39

Table of ContentsNOTES TO THE CONSOLIDATED FINANCIAL STATEMENTS
(In thousands, except shares and per share data)
Estimated aggregate amortization expense based on the current carrying amount of amortizable Intangible Assets for each of the five succeeding years is asfollows:
2018 $ 22,3452019 21,6912020 20,1982021 18,5612022 16,367Thereafter 73,185
Total $ 172,347
9. Debt
Credit Facility Borrowings
2017 Credit Agreement
In order to finance the acquisition of the IPC Group, on April 4, 2017, the Company and certain of our foreign subsidiaries entered into a Credit Agreement (the “2017Credit Agreement”) with JPMorgan, as administrative agent, Goldman Sachs Bank USA, as syndication agent, Wells Fargo, National Association, U.S. Bank NationalAssociation, and HSBC Bank USA, National Association, as co-documentation agents, and the lenders (including JPMorgan) from time to time party thereto. The 2017 CreditAgreement provides the company and certain of our foreign subsidiaries access to a senior secured credit facility until April 4, 2022, consisting of a multi-tranche term loanfacility in an amount up to $400,000 and a revolving facility in an amount up to $200,000 with an option to expand the revolving facility by $150,000 , with the consent of thelenders willing to provide additional borrowings in the form of increases to their revolving facility commitment or funding of incremental term loans. Borrowings may bedenominated in U.S. dollars or certain other currencies.
In connection with the 2017 Credit Agreement, the company granted the lenders a security interest in substantially all its personal property, and pledged the stock of itsdomestic subsidiaries and 65% of the stock of its first tier foreign subsidiaries. The obligations under the 2017 Credit Agreement are also guaranteed by certain of theCompany’s first tier domestic subsidiaries and those subsidiaries also provided a security interest in their similar personal property.
The fee for committed funds under the revolving facility of the 2017 Credit Agreement ranges from an annual rate of 0.175% to 0.35% , depending on the company’sleverage ratio. Borrowings denominated in U.S. dollars under the 2017 Credit Agreement bear interest at a rate per annum equal to (a) the greatest of (i) the prime rate, (ii) thefederal funds rate plus 0.50% and (iii) the adjusted LIBOR rate for a one month period, but in any case, not less than 0% , plus, in any such case, 1.00% , plus an additionalspread of 0.075% to 0.90% for revolving loans and 0.25% to 1.25% for term loans, depending on the company’s leverage ratio, or (b) the LIBOR Rate, as adjusted forstatutory reserve requirements for eurocurrency liabilities, but in any case, not less than 0% , plus an additional spread of 1.075% to 1.90% for revolving loans and 1.25% to 2.25% for term loans, depending on the company’s leverage ratio.
The 2017 Credit Agreement contains customary representations, warranties and covenants, including, but not limited to, covenants restricting the company’s ability to incurindebtedness and liens and merge or consolidate with another entity. The 2017 Credit Agreement also contains financial covenants, requiring us to maintain a ratio ofconsolidated total indebtedness to consolidated earnings before income, taxes, depreciation and amortization, subject to certain adjustments ("Adjusted EBITDA") of not greaterthan 4.25 to 1, as well as requiring us to maintain a ratio of consolidated Adjusted EBITDA to consolidated interest expense of no less than 3.50 to 1 for the year endedDecember 31, 2017. The 2017 Credit Agreement also contains a financial covenant requiring us to maintain a senior secured net indebtedness to Adjusted EBITDA ratio of notgreater than 3.50 to 1. These financial covenants may restrict our ability to pay dividends and purchase outstanding shares of our common stock. We were in compliance withour financial covenants at December 31, 2017.
We will be required to repay the senior credit agreement with 25% to 50% of our excess cash flow from the preceding fiscal year, as defined in the agreement, unless ournet leverage ratio for such preceding fiscal year is less than or equal to 3.00 to 1, which will be first measured using our fiscal year ended December 31, 2018.
Upon entry into the 2017 Credit Agreement, the company repaid $45,000 in outstanding borrowings under our Prior Credit Agreement (as defined below) and terminatedthe Prior Credit Agreement.
Prior Credit Agreement
On June 30, 2015, we entered into an Amended and Restated Credit Agreement (the "Prior Credit Agreement") that amended and restated the Credit Agreement dated May5, 2011 between us and JP Morgan Chase Bank, N.A. ("JPMorgan"), as administrative agent and collateral agent, U.S. Bank National Association, as syndication agent, WellsFargo Bank, National Association, and RBS Citizens, N.A., as co-documentation agents, and the Lenders (including JPMorgan) from time to time party thereto, as amended byAmendment No. 1 dated April 25, 2013.
At December 31, 2016 , there were $25,000 in outstanding borrowings under this facility with a weighted average interest rate of 1.64% . Upon entry into the 2017 CreditAgreement, we repaid any outstanding borrowings under the Prior Credit Agreement and terminated the Prior Credit Agreement.
Prudential Shelf Agreement
On July 29, 2009, we entered into a Private Shelf Agreement, as amended (the “Shelf Agreement”) with Prudential Investment Management, Inc. (“Prudential”) andPrudential affiliates from time to time party thereto. The Shelf Agreement provided us and our subsidiaries access to an uncommitted, senior secured, maximum aggregateprincipal amount of $80,000 of debt capital.
40

Table of ContentsNOTES TO THE CONSOLIDATED FINANCIAL STATEMENTS
(In thousands, except shares and per share data)
As of December 31, 2016 , there were $11,143 in outstanding borrowings under this facility, consisting of the $4,000 Series A notes issued in March 2011 with a fixedinterest rate of 4.00% and a term of seven years , with remaining serial maturities from 2017 to 2018 , and the $7,143 Series B notes issued in June 2011 with a fixed interest rateof 4.10% and a term of 10 years , with remaining serial maturities from 2017 to 2021 . Upon entry into the 2017 Credit Agreement, we repaid any outstanding borrowings underthe Shelf Agreement and terminated the Shelf Agreement.
HSBC Bank (China) Company Limited, Shanghai Branch
On June 20, 2012, we entered into a banking facility with the HSBC Bank (China) Company Limited, Shanghai Branch in the amount of $5,000 . As of December 31, 2017, there were no outstanding borrowings on this facility.
Senior Unsecured Notes
On April 18, 2017, we issued and sold $300,000 in aggregate principal amount of our 5.625% Senior Notes due 2025 (the “Notes”), pursuant to an Indenture, dated as ofApril 18, 2017, among the company, the Guarantors (as defined therein), and Wells Fargo Bank, National Association, a national banking association, as trustee. The Notes areguaranteed by Tennant Coatings, Inc. and Tennant Sales and Service Company (collectively, the “Guarantors”), which are wholly owned subsidiaries of the company. Separatefinancial information of the Guarantors is presented in Note 22.
The Notes will mature on May 1, 2025. Interest on the Notes will accrue at the rate of 5.625% per annum and will be payable semiannually in cash on each May 1 andNovember 1, commencing on November 1, 2017.
The Notes and the guarantees constitute senior unsecured obligations of the company and the Guarantors, respectively. The Notes and the guarantees, respectively, are:(a) equal in right of payment with all of the company’s and the Guarantors’ senior debt, without giving effect to collateral arrangements; (b) senior in right of payment to all ofthe company’s and the Guarantors’ future subordinated debt, if any; (c) effectively subordinated in right of payment to all of the company’s and the Guarantors’ debt andobligations that are secured, including borrowings under the company’s senior secured credit facilities for so long as the senior secured credit facilities are secured, to the extentof the value of the assets securing such liens; and (d) structurally subordinated in right of payment to all liabilities (including trade payables) of the company’s and theGuarantors’ subsidiaries that do not guarantee the Notes. The Notes also contain customary representations, warranties and covenants, and are less restrictive than thosecontained in the 2017 Credit Agreement.
We used the net proceeds from this offering to refinance a $300,000 term loan under our 2017 Credit Agreement that we borrowed as part of the financing for theacquisition of the IPC Group and to pay related fees and expenses.
The Indenture governing the Notes contains covenants that limit, among other things, our ability and the ability of our restricted subsidiary to incur additional indebtedness(including guarantees thereof); incur or create liens on assets securing indebtedness; make certain restricted payments; make certain investments; dispose of certain assets; allowto exist certain restrictions on the ability of the our restricted subsidiaries to pay dividends or make other payments to us; engage in certain transactions with affiliates; andconsolidate or merge with or into other companies. If we experience certain kinds of changes of control, we may be required to repurchase the Notes at a price equal to 101% ofthe principal amount of the Notes, plus accrued and unpaid interest, if any, to, but excluding, the date of repurchase. If we makes certain asset sales and do not use the netproceeds for specified purposes, we may be required to offer to repurchase the Notes at a price equal to 100% of the principal amount, plus accrued and unpaid interest, if any,to, but excluding, the date of repurchase.
Registration Rights Agreement
In connection with the issuance and sale of the Notes, the company entered into a Registration Rights Agreement, dated April 18, 2017, among the company, the Guarantorsand Goldman, Sachs & Co. and J.P. Morgan Securities LLC (the “Registration Rights Agreement”). Pursuant to the Registration Rights Agreement, the company agreed (1) touse its commercially reasonable efforts to consummate an exchange offer to exchange the Notes for new registered notes (the “Exchange Notes”), with terms substantiallyidentical in all material respects with the Notes (except that the Exchange Notes will not contain terms with respect to additional interest, registration rights or transferrestrictions) and (2) if required, to have a shelf registration statement declared effective with respect to resales of the Notes. If the company fails to satisfy certain obligationsunder the Registration Rights Agreement within 360 days, it will be required to pay additional interest to the holders of the Notes under certain circumstances.
On January 22, 2018, we commenced the exchange offer required by the Registration Rights Agreement. The exchange offer closed on February 23, 2018. We will notincur any additional indebtedness as a result of the exchange offer. As a result, we will not be required to pay additional interest on the Notes.
Capital Lease Obligations
Capital lease obligations outstanding are primarily related to sale-leaseback transactions with third-party leasing companies whereby we sell our manufactured equipment tothe leasing company and lease it back. The equipment covered by these leases is rented to our customers over the lease term.
41

Table of ContentsNOTES TO THE CONSOLIDATED FINANCIAL STATEMENTS
(In thousands, except shares and per share data)
Debt outstanding at December 31, consisted of the following:
2017 2016
Long-Term Debt:
Senior Unsecured Notes $ 300,000 $ —
Credit Facility Borrowings 80,000 36,143
Capital Lease Obligations 3,279 51
Total Long-Term Debt 383,279 36,194
Less: Unamortized Debt Issuance Costs (6,440) —
Less: Current Maturities of Credit Facility Borrowings, Net of Debt Issuance Costs (1) (29,413) (3,459)
Less: Current Maturities of Capital Lease Obligations (1) (1,470) —
Long-term portion $ 345,956 $ 32,735
(1) Current maturities of long-term debt include $30,000 of current maturities, less $587 of unamortized debt issuance costs, under our 2017 Credit Agreement (definedbelow) and $1,470 of current maturities of capital lease obligations.
As of December 31, 2017 , we had outstanding borrowings under our Senior Unsecured Notes of $300,000 . We had outstanding borrowings under our 2017 CreditAgreement, totaling $60,000 under our term loan facility and $20,000 under our revolving facility, leaving $180,000 of unused borrowing capacity on our revolving facility.Although we are only required to make a minimum principal payment of $5,000 during 2018, we have both the intent and the ability to pay an additional $25,000 during 2018.As such, we have classified $30,000 as current maturities of long-term debt. In addition, we had stand alone letters of credit and bank guarantees outstanding in the amount of$4,670 , leaving approximately $175,330 of unused borrowing capacity on our revolving facility. Commitment fees on unused lines of credit for the year ended December 31,2017 were $570 . The overall weighted average cost of debt is approximately 5.1% and, net of a related cross-currency swap instrument, is approximately 4.2% . Further detailsregarding the cross-currency swap instrument are discussed in Note 11.
The aggregate maturities of our outstanding debt, including capital lease obligations as of December 31, 2017 , are as follows:
2018 $ 6,6092019 7,8682020 9,9212021 12,0062022 46,875Thereafter 300,000
Total aggregate maturities $ 383,279
10. Other Current Liabilities
Other Current Liabilities as of December 31, consisted of the following:
2017 2016
Other Current Liabilities: Taxes, other than income taxes $ 14,760 $ 7,122
Warranty 12,676 10,960
Deferred revenue 5,815 2,366
Rebates 13,466 11,102
Freight 3,208 4,274
Restructuring 4,267 394
Miscellaneous accrued expenses 10,779 4,385
Other 4,476 3,014
Total Other Current Liabilities $ 69,447 $ 43,617
42

Table of ContentsNOTES TO THE CONSOLIDATED FINANCIAL STATEMENTS
(In thousands, except shares and per share data)
The changes in warranty reserves for the three years ended December 31 were as follows:
2017 2016 2015
Beginning balance $ 10,960 $ 10,093 $ 9,686
Product warranty provision 12,124 12,413 11,719
Acquired warranty obligations 1,208 42 —
Foreign currency 274 82 (207)
Claims paid (11,890) (11,670) (11,105)
Ending balance $ 12,676 $ 10,960 $ 10,093
11. DerivativesHedge Accounting and Hedging Programs
In 2015, we expanded our foreign currency hedging programs to include foreign exchange purchased options and forward contracts to hedge our foreign currencydenominated revenue. We recognize all derivative instruments as either assets or liabilities in our Consolidated Balance Sheets and measure them at fair value. Gains and lossesresulting from changes in fair value are accounted for depending on the use of the derivative and whether it is designated and qualifies for hedge accounting.
We evaluate hedge effectiveness on our hedges that are designated and qualify for hedge accounting at the inception of the hedge prospectively, as well as retrospectively,and record any ineffective portion of the hedging instruments in Net Foreign Currency Transaction Losses on our Consolidated Statements of Operations. The time value ofpurchased contracts is recorded in Net Foreign Currency Transaction Losses in our Consolidated Statements of Operations.
Our hedging policy establishes maximum limits for each counterparty to mitigate any concentration of risk.
Balance Sheet Hedging
Hedges of Foreign Currency Assets and Liabilities
We hedge our net recognized foreign currency denominated assets and liabilities with foreign exchange forward contracts to reduce the risk that the value of these assetsand liabilities will be adversely affected by changes in exchange rates. These contracts hedge assets and liabilities that are denominated in foreign currencies and are carried atfair value as either assets or liabilities on the Consolidated Balance Sheets with changes in the fair value recorded to Net Foreign Currency Transaction Losses in ourConsolidated Statements of Operations. These contracts do not subject us to material balance sheet risk due to exchange rate movements because gains and losses on thesederivatives are intended to offset gains and losses on the assets and liabilities being hedged. At December 31, 2017 and December 31, 2016 , the notional amounts of foreigncurrency forward exchange contracts outstanding not designated as hedging instruments were $60,858 and $42,866 , respectively.
During the first quarter of 2017, in connection with our acquisition of IPC Group, we entered into a foreign currency option contract not designated as a hedging instrumentfor a notional amount of €180,000 . The option contract has since expired and there were no outstanding foreign currency option contracts not designated as hedging instrumentsas of December 31, 2017 and December 31, 2016 .
Cash Flow Hedging
Hedges of Forecasted Foreign Currency Transactions
In countries outside the U.S., we transact business in U.S. dollars and in various other currencies. We may use foreign exchange option contracts or forward contracts tohedge certain cash flow exposures resulting from changes in these foreign currency exchange rates. These foreign exchange contracts, carried at fair value, have maturities of upto one year . We enter into these foreign exchange contracts to hedge a portion of our forecasted foreign currency denominated revenue in the normal course of business, andaccordingly, they are not speculative in nature. The notional amount of outstanding foreign currency forward contracts designated as cash flow hedges were $2,928 and $2,127as of December 31, 2017 and December 31, 2016 , respectively. The notional amount of outstanding foreign currency option contracts designated as cash flow hedges was$8,619 and $8,522 as of December 31, 2017 and December 31, 2016 , respectively.
Foreign Currency Derivatives
We use foreign currency exchange rate derivatives to hedge our exposure to fluctuations in exchange rates for anticipated intercompany cash transactions between TennantCompany and its subsidiaries. During the second quarter of 2017, we entered into Euro to U.S. dollar foreign exchange cross currency swaps for all of the anticipated cash flowsassociated with an intercompany loan from a wholly-owned European subsidiary. We entered into these foreign exchange cross currency swaps to hedge the foreign currencydenominated cash flows associated with this intercompany loan, and accordingly, they are not speculative in nature. We designated these cross currency swaps as cash flowhedges. The hedged cash flows as of December 31, 2017 included €181,200 of total notional value. As of December 31, 2017 , the aggregate scheduled interest payments overthe course of the loan and related swaps amounted to €31,200 . The scheduled maturity and principal payment of the loan and related swaps of €150,000 are due in April 2022 .There were no cross currency swaps designated as cash flow hedges as of December 31, 2016 .
43

Table of ContentsNOTES TO THE CONSOLIDATED FINANCIAL STATEMENTS
(In thousands, except shares and per share data)
To receive hedge accounting treatment, all hedging relationships are formally documented at the inception of the hedge, and the hedges must be highly effective inoffsetting changes to future cash flows on hedged transactions. We record changes in the fair value of these cash flow hedges in Accumulated Other Comprehensive Loss in ourConsolidated Balance Sheets, until the forecasted transaction occurs. When the forecasted transaction occurs, we reclassify the related gain or loss on the cash flow hedge to NetSales. In the event the underlying forecasted transaction does not occur, or it becomes probable that it will not occur, we reclassify the gain or loss on the related cash flow hedgefrom Accumulated Other Comprehensive Loss to Net Foreign Currency Transaction Losses in our Consolidated Statements of Operations at that time. If we do not elect hedgeaccounting, or the contract does not qualify for hedge accounting treatment, the changes in fair value from period to period are recorded in Net Foreign Currency TransactionLosses in our Consolidated Statements of Operations.
The fair value of derivative instruments on our Consolidated Balance Sheets as of December 31 , consisted of the following:
2017 2016
Fair Value Asset
Derivatives
Fair ValueLiability
Derivatives Fair Value Asset
Derivatives
Fair ValueLiability
Derivatives
Derivatives designated as hedging instruments: Foreign currency option contracts (1) $ 86 $ — $ 184 $ —
Foreign currency forward contracts (1) 7,218 34,961 — 13
Derivatives not designated as hedging instruments: Foreign currency forward contracts (1) $ 442 $ 425 $ 12 $ 162
(1) Contracts that mature within the next 12 months are included in Other Current Assets and Other Current Liabilities for asset derivatives and liabilities derivatives,respectively, on our Consolidated Balance Sheets. Contracts with maturities greater than 12 months are included in Other Assets and Other Liabilities for assetderivatives and liability derivatives, respectively, in our Consolidated Balance Sheets. Amounts included in our Consolidated Balance Sheets are recorded net where aright of offset exists with the same derivative counterparty.
As of December 31, 2017 , we anticipate reclassifying approximately $1,865 of gains from Accumulated Other Comprehensive Loss to n et earnings during the next twelvemonths.
The effect of foreign currency derivative instruments designated as cash flow hedges and foreign currency derivative instruments not designated as hedges in ourConsolidated Statements of Earnings for the three years ended December 31 were as follows:
2017 2016 2015
ForeignCurrency
OptionContracts
ForeignCurrencyForwardContracts
ForeignCurrency
OptionContracts
ForeignCurrencyForwardContracts
ForeignCurrency
OptionContracts
ForeignCurrencyForwardContracts
Derivatives in cash flow hedging relationships: Net (loss) gain recognized in Other Comprehensive Income (Loss), net oftax (1) $ (193) $ (16,226) $ (259) $ (73) $ 31 $ 77Net (loss) gain reclassified from Accumulated Other Comprehensive Lossinto earnings, net of tax, effective portion to Net Sales (178) (37) (148) 7 — 5Net gain reclassified from Accumulated Other Comprehensive Loss inearnings, net of tax, effective portion to Interest Income — 1,198 — — — —Net loss reclassified from Accumulated Other Comprehensive Loss intoearnings, net of tax, effective portion to Net Foreign Currency TransactionLosses — (12,555) — — — —
Net (loss) gain recognized in earnings (2) (13) 10 (11) 2 6 (2)
Derivatives not designated as hedging instruments: Net (loss) gain recognized in earnings (3) $ — $ (6,161) $ — $ (890) $ — $ 4,047
(1) Net change in the fair value of the effective portion classified in Other Comprehensive Income (Loss).
(2) Ineffective portion and amount excluded from effectiveness testing classified in Net Foreign Currency Transaction Losses.
(3) Classified in Net Foreign Currency Transaction Losses.
44
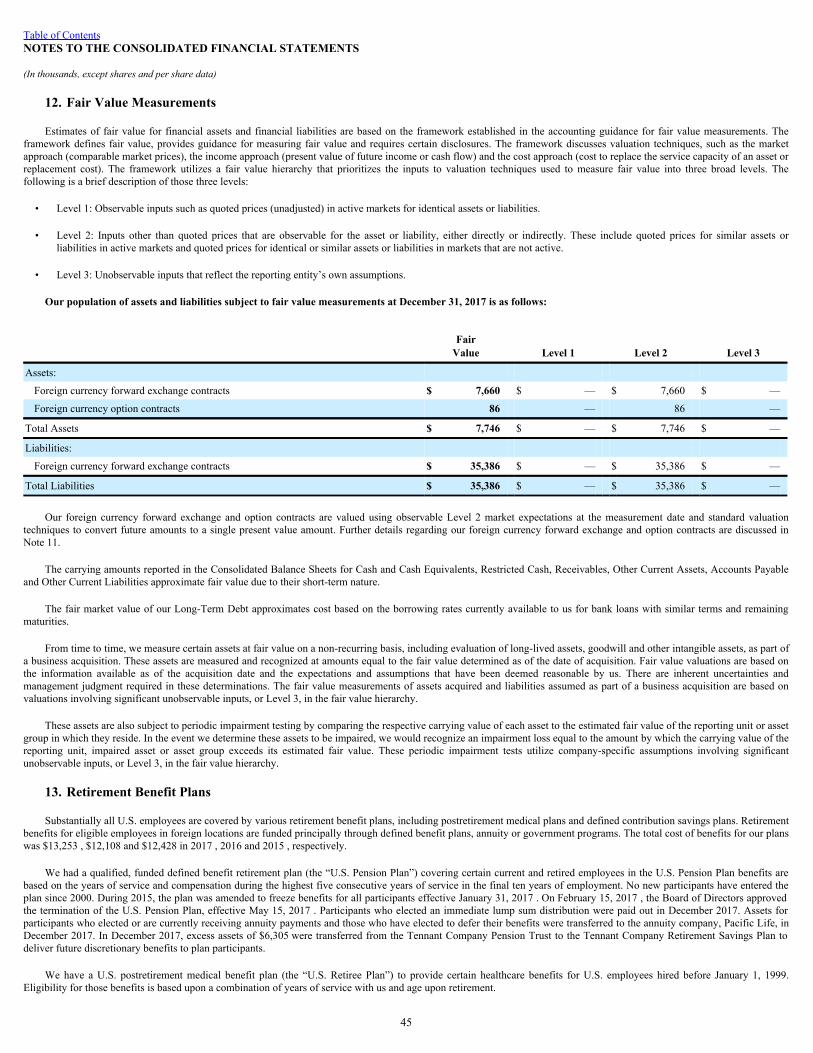
Table of ContentsNOTES TO THE CONSOLIDATED FINANCIAL STATEMENTS
(In thousands, except shares and per share data)
12. Fair Value Measurements
Estimates of fair value for financial assets and financial liabilities are based on the framework established in the accounting guidance for fair value measurements. Theframework defines fair value, provides guidance for measuring fair value and requires certain disclosures. The framework discusses valuation techniques, such as the marketapproach (comparable market prices), the income approach (present value of future income or cash flow) and the cost approach (cost to replace the service capacity of an asset orreplacement cost). The framework utilizes a fair value hierarchy that prioritizes the inputs to valuation techniques used to measure fair value into three broad levels. Thefollowing is a brief description of those three levels:
• Level 1: Observable inputs such as quoted prices (unadjusted) in active markets for identical assets or liabilities.
• Level 2: Inputs other than quoted prices that are observable for the asset or liability, either directly or indirectly. These include quoted prices for similar assets orliabilities in active markets and quoted prices for identical or similar assets or liabilities in markets that are not active.
• Level 3: Unobservable inputs that reflect the reporting entity’s own assumptions.
Our population of assets and liabilities subject to fair value measurements at December 31, 2017 is as follows:
Fair
Value Level 1 Level 2 Level 3
Assets:
Foreign currency forward exchange contracts $ 7,660 $ — $ 7,660 $ —
Foreign currency option contracts 86 — 86 —
Total Assets $ 7,746 $ — $ 7,746 $ —
Liabilities:
Foreign currency forward exchange contracts $ 35,386 $ — $ 35,386 $ —
Total Liabilities $ 35,386 $ — $ 35,386 $ —
Our foreign currency forward exchange and option contracts are valued using observable Level 2 market expectations at the measurement date and standard valuationtechniques to convert future amounts to a single present value amount. Further details regarding our foreign currency forward exchange and option contracts are discussed inNote 11.
The carrying amounts reported in the Consolidated Balance Sheets for Cash and Cash Equivalents, Restricted Cash, Receivables, Other Current Assets, Accounts Payableand Other Current Liabilities approximate fair value due to their short-term nature.
The fair market value of our Long-Term Debt approximates cost based on the borrowing rates currently available to us for bank loans with similar terms and remainingmaturities.
From time to time, we measure certain assets at fair value on a non-recurring basis, including evaluation of long-lived assets, goodwill and other intangible assets, as part ofa business acquisition. These assets are measured and recognized at amounts equal to the fair value determined as of the date of acquisition. Fair value valuations are based onthe information available as of the acquisition date and the expectations and assumptions that have been deemed reasonable by us. There are inherent uncertainties andmanagement judgment required in these determinations. The fair value measurements of assets acquired and liabilities assumed as part of a business acquisition are based onvaluations involving significant unobservable inputs, or Level 3, in the fair value hierarchy.
These assets are also subject to periodic impairment testing by comparing the respective carrying value of each asset to the estimated fair value of the reporting unit or assetgroup in which they reside. In the event we determine these assets to be impaired, we would recognize an impairment loss equal to the amount by which the carrying value of thereporting unit, impaired asset or asset group exceeds its estimated fair value. These periodic impairment tests utilize company-specific assumptions involving significantunobservable inputs, or Level 3, in the fair value hierarchy.
13. Retirement Benefit Plans
Substantially all U.S. employees are covered by various retirement benefit plans, including postretirement medical plans and defined contribution savings plans. Retirementbenefits for eligible employees in foreign locations are funded principally through defined benefit plans, annuity or government programs. The total cost of benefits for our planswas $13,253 , $12,108 and $12,428 in 2017 , 2016 and 2015 , respectively.
We had a qualified, funded defined benefit retirement plan (the “U.S. Pension Plan”) covering certain current and retired employees in the U.S. Pension Plan benefits arebased on the years of service and compensation during the highest five consecutive years of service in the final ten years of employment. No new participants have entered theplan since 2000. During 2015, the plan was amended to freeze benefits for all participants effective January 31, 2017 . On February 15, 2017 , the Board of Directors approvedthe termination of the U.S. Pension Plan, effective May 15, 2017 . Participants who elected an immediate lump sum distribution were paid out in December 2017. Assets forparticipants who elected or are currently receiving annuity payments and those who have elected to defer their benefits were transferred to the annuity company, Pacific Life, inDecember 2017. In December 2017, excess assets of $6,305 were transferred from the Tennant Company Pension Trust to the Tennant Company Retirement Savings Plan todeliver future discretionary benefits to plan participants.
We have a U.S. postretirement medical benefit plan (the “U.S. Retiree Plan”) to provide certain healthcare benefits for U.S. employees hired before January 1, 1999.Eligibility for those benefits is based upon a combination of years of service with us and age upon retirement.
45


Table of ContentsNOTES TO THE CONSOLIDATED FINANCIAL STATEMENTS
(In thousands, except shares and per share data)
Our defined contribution savings plan (“401(k)”) covers substantially all U.S. employees. Under this plan, we match up to 3% of the employee’s annual compensation incash to be invested per their election. We also make a profit sharing contribution to the 401(k) plan for employees with more than one year of service in accordance with ourProfit Sharing Plan. This contribution is based upon our financial performance and can be funded in the form of Tennant stock, cash or a combination of both. Expenses for the401(k) plan were $4,404 , $8,359 and $8,098 during 2017 , 2016 and 2015 , respectively.
We have a U.S. nonqualified supplemental benefit plan (the “U.S. Nonqualified Plan”) to provide additional retirement benefits for certain employees whose benefits underour 401(k) plan or U.S. Pension Plan are limited by either the Employee Retirement Income Security Act or the Internal Revenue Code.
We also have defined benefit pension plans in the United Kingdom and Germany (the “U.K. Pension Plan” and the “German Pension Plan”). The U.K. Pension Plan andGerman Pension Plan cover certain current and retired employees and both plans are closed to new participants.
We expect to contribute approximately $140 to our U.S. Nonqualified Plan, $771 to our U.S. Retiree Plan, $292 to our U.K. Pension Plan and $36 to our German PensionPlan in 2018 . There were no contributions made to the U.S. Pension Plan during 2017.
Weighted-average asset allocations by asset category of the U.K. Pension Plan and the Tennant Company Retirement Savings Plan are as of December 31, 2017are as follows:
Asset Category Fair Value
Quoted Prices in ActiveMarkets for Identical
Assets(Level 1)
Significant ObservableInputs
(Level 2)
SignificantUnobservable Inputs
(Level 3)
Cash and Cash Equivalents $ 6,305 $ 6,305 $ — $ —
Investment Account held by Pension Plan (1) 11,163 — — 11,163
Total $ 17,468 $ 6,305 $ — $ 11,163
(1) This category is comprised of investments in insurance contracts.
Weighted-average asset allocations by asset category of the U.S. and U.K. Pension Plans as of December 31, 2016 are as follows:
Asset Category Fair Value
Quoted Prices in ActiveMarkets for Identical
Assets(Level 1)
Significant ObservableInputs
(Level 2)
Significant UnobservableInputs
(Level 3)
Cash and Cash Equivalents $ 663 $ 663 $ — $ —
Mutual Funds:
U.S. Large-Cap 9,803 9,803 — —
U.S. Small-Cap 2,584 2,584 — —
International Equities 2,244 2,244 — —
Fixed-Income Domestic 4,564 4,564 — —
Collective Investment Funds 26,531 — 26,531 —
Investment Account held by Pension Plan (1) 9,562 — — 9,562
Total $ 55,951 $ 19,858 $ 26,531 $ 9,562
(1) This category is comprised of investments in insurance contracts.
Estimates of the fair value of U.S. and U.K Pension Plan and the Tennant Company Retirement Savings Plan assets are based on the framework established in theaccounting guidance for fair value measurements. A brief description of the three levels can be found in Note 12. Equity Securities and Mutual Funds traded in active marketsare classified as Level 1. Collective Investment Funds are measured at fair value using quoted market prices. They are classified as Level 2 as they trade in a non-active marketfor which asset prices are readily available. The Investment Account held by the U.K. Pension Plan invests in insurance contracts for purposes of funding the U.K. Pension Planand is classified as Level 3. The fair value of the Investment Account is the cash surrender values as determined by the provider which are the amounts the plan would receive ifthe contracts were cashed out at year end. The underlying assets held by these contracts are primarily invested in assets traded in active markets.
46

Table of ContentsNOTES TO THE CONSOLIDATED FINANCIAL STATEMENTS
(In thousands, except shares and per share data)
A reconciliation of the beginning and ending balances of the Level 3 investments of our U.K. Pension Plan during the years ended are as follows:
2017 2016
Fair value at beginning of year $ 9,562 $ 10,691
Purchases, sales, issuances and settlements, net (535) 7
Net gain 1,190 674
Foreign currency 946 (1,810)
Fair value at end of year $ 11,163 $ 9,562
The primary objective of our U.S. and U.K. Pension Plans is to meet retirement income commitments to plan participants at a reasonable cost to us and to maintain a soundactuarially funded status. This objective is accomplished through growth of capital and safety of funds invested. The pension plans' assets are invested in securities to achievegrowth of capital over inflation through appreciation and accumulation and reinvestment of dividend and interest income. Investments are diversified to control risk. The targetallocation for the U.S. Pension Plan was 70% debt securities and 30% equity. Equity securities within the U.S. Pension Plan did not include any direct investments in TennantCompany Common Stock. The U.K. Pension Plan is invested in insurance contracts with underlying investments primarily in equity and fixed income securities. Our GermanPension Plan is unfunded, which is customary in that country.
Weighted-average assumptions used to determine benefit obligations as of December 31 are as follows:
U.S. Pension Benefits Non-U.S.
Pension Benefits Postretirement
Medical Benefits
2017 2016 2017 2016 2017 2016
Discount rate 3.28% 3.92% 2.45% 2.64% 3.26% 3.58%
Rate of compensation increase —% 3.00% 3.50% 3.50% — —
Weighted-average assumptions used to determine net periodic benefit costs as of December 31 are as follows:
U.S. Pension Benefits Non-U.S.
Pension Benefits Postretirement
Medical Benefits
2017 2016 2015 2017 2016 2015 2017 2016 2015
Discount rate 3.92% 4.08% 3.76% 2.64% 3.59% 3.38% 3.58% 3.70% 3.39%
Expected long-term rate of return on plan assets 5.10% 5.20% 5.20% 3.90% 4.60% 4.40% — — —
Rate of compensation increase —% 3.00% 3.00% 3.50% 3.50% 3.50% — — —
The discount rate is used to discount future benefit obligations back to today’s dollars. Our discount rates were determined based on high-quality fixed income investments.The resulting discount rates are consistent with the duration of plan liabilities. The Citigroup Above Median Spot Rate is used in determining the discount rate for the U.S. Plans.The expected return on assets assumption on the investment portfolios for the pension plans is based on the long-term expected returns for the investment mix of assets currentlyin the portfolio. Management uses historic return trends of the asset portfolio combined with recent market conditions to estimate the future rate of return.
The accumulated benefit obligations as of December 31, for all defined benefit plans are as follows:
2017 2016
U.S. Pension Plans $ 1,414 $ 40,961
U.K. Pension Plan 11,131 10,265
German Pension Plan 1,013 871
Information for our plans with an accumulated benefit obligation in excess of plan assets as of December 31 is as follows:
2017 2016
Accumulated benefit obligation $ 2,427 $ 12,597
Fair value of plan assets — 9,562
As of December 31, 2017 , the U.S. Nonqualified and the German Pension Plans had an accumulated benefit obligation in excess of plan assets. As of December 31, 2016 ,the U.S. Nonqualified, the U.K. Pension and the German Pension Plans had an accumulated benefit obligation in excess of plan assets.
47

Table of ContentsNOTES TO THE CONSOLIDATED FINANCIAL STATEMENTS
(In thousands, except shares and per share data)
Information for our plans with a projected benefit obligation in excess of plan assets as of December 31 is as follows:
2017 2016
Projected benefit obligation $ 2,427 $ 12,794
Fair value of plan assets — 9,562
As of December 31, 2017 , the U.S. Nonqualified and the German Pension Plans had a projected benefit obligation in excess of plan assets. As of December 31, 2016 , theU.S. Nonqualified, the UK Pension and the German Pension Plans had a projected benefit obligation in excess of plan assets.
Assumed healthcare cost trend rates as of December 31 are as follows:
2017 2016
Healthcare cost trend rate assumption for the next year 6.56% 6.56%
Rate to which the cost trend rate is assumed to decline (the ultimate trend rate) 5.00% 5.00%
Year that the rate reaches the ultimate trend rate 2032 2031
Assumed healthcare cost trend rates have a significant effect on the amounts reported for healthcare plans. To illustrate, a one-percentage-point change in assumedhealthcare cost trends would have the following effects:
1-Percentage-Point
Decrease
1-Percentage-Point
Increase
Effect on total of service and interest cost components $ (31) $ 35
Effect on postretirement benefit obligation $ (724) $ 820
48

Table of ContentsNOTES TO THE CONSOLIDATED FINANCIAL STATEMENTS
(In thousands, except shares and per share data)
Summaries related to changes in benefit obligations and plan assets and to the funded status of our defined benefit and postretirement medical benefit plans areas follows:
U.S. Pension Benefits Non-U.S.
Pension Benefits Postretirement
Medical Benefits
2017 2016 2017 2016 2017 2016
Change in benefit obligation:
Benefit obligation at beginning of year $ 40,961 $ 41,774 $ 11,136 $ 10,883 $ 10,540 $ 11,144
Service cost — 354 132 103 60 76
Interest cost 1,538 1,659 298 358 363 396
Plan participants' contributions — — 14 14 — —
Actuarial loss (gain) 1,811 690 327 1,939 (524) 6
Foreign exchange — — 1,097 (1,852) — —
Benefits paid (1,950) (3,516) (860) (309) (835) (1,082)
Settlement (40,946) — — — — —
Benefit obligation at end of year $ 1,414 $ 40,961 $ 12,144 $ 11,136 $ 9,604 $ 10,540
Change in fair value of plan assets and net accrued liabilities:
Fair value of plan assets at beginning of year $ 46,389 $ 47,201 $ 9,562 $ 10,691 $ — $ —
Actual return on plan assets 2,536 2,457 1,189 673 — —
Employer contributions 276 247 313 303 835 1,082
Plan participants' contributions — — 14 14 — —
Excess assets transferred to Defined Contribution Plan (6,305) — — — — —
Foreign exchange — — 945 (1,810) — —
Benefits paid (1,950) (3,516) (860) (309) (835) (1,082)
Settlement (40,946) — — — — —
Fair value of plan assets at end of year — 46,389 11,163 9,562 — —
Funded status at end of year $ (1,414) $ 5,428 $ (981) $ (1,574) $ (9,604) $ (10,540)
Amounts recognized in the Consolidated Balance Sheets consist of:
Noncurrent Other Assets $ — $ 7,087 $ — $ — $ — $ —
Current Liabilities (140) (239) (36) (30) (771) (828)
Long-Term Liabilities (1,274) (1,420) (945) (1,544) (8,833) (9,712)
Net accrued asset (liability) $ (1,414) $ 5,428 $ (981) $ (1,574) $ (9,604) $ (10,540)
Amounts recognized in Accumulated Other Comprehensive Loss consist of:
Net actuarial loss (915) (5,720) (1,245) (1,802) (41) (566)
Accumulated Other Comprehensive Loss $ (915) $ (5,720) $ (1,245) $ (1,802) $ (41) $ (566)
49

Table of ContentsNOTES TO THE CONSOLIDATED FINANCIAL STATEMENTS
(In thousands, except shares and per share data)
The components of the net periodic benefit (credit) cost for the three years ended December 31 were as follows:
U.S. Pension Benefits Non-U.S.
Pension Benefits Postretirement
Medical Benefits
2017 2016 2015 2017 2016 2015 2017 2016 2015
Service cost $ — $ 354 $ 480 $ 132 $ 103 $ 153 $ 60 $ 76 $ 96
Interest cost 1,538 1,659 1,711 298 358 396 363 396 393
Expected return on plan assets (2,336) (2,400) (2,613) (379) (452) (433) — — —
Amortization of net actuarial loss 43 41 835 74 27 54 — — —
Amortization of prior service cost — 41 42 — — — — — —
Foreign currency — — — (1) 97 (35) — — —
Net periodic benefit (credit) cost (755) (305) 455 124 133 135 423 472 489
Curtailment charge — — 25 — — — — — —
Settlement charge 6,373 — 225 — — — — — —
Net benefit cost (credit) $ 5,618 $ (305) $ 705 $ 124 $ 133 $ 135 $ 423 $ 472 $ 489
The changes in Accumulated Other Comprehensive Loss for the three years ended December 31 were as follows:
U.S. Pension Benefits Non-U.S.
Pension Benefits Postretirement
Medical Benefits
2017 2016 2015 2017 2016 2015 2017 2016 2015
Net actuarial loss (gain) $ 1,611 $ 633 $ 195 $ (465) $ 1,718 $ (1,517) $ (524) $ 6 $ (1,618)
Amortization of prior service cost — (41) (67) — — — — — —
Amortization of net actuarial loss (43) (41) (1,060) (74) (27) (54) — — —
Settlement Charge (6,373) — — — — — — — —
Total recognized in other comprehensive (income)loss $ (4,805) $ 551 $ (932) $ (539) $ 1,691 $ (1,571) $ (524) $ 6 $ (1,618)
Total recognized in net benefit cost (credit) andother comprehensive (income) loss $ 813 $ 246 $ (227) $ (415) $ 1,824 $ (1,436) $ (101) $ 478 $ (1,129)
The following benefit payments, which reflect expected future service, are expected to be paid for our U.S. and Non-U.S. plans:
U.S. Pension Benefits Non-U.S.
Pension Benefits Postretirement
Medical Benefits
2018 $ 140 $ 247 $ 771
2019 133 254 803
2020 132 261 849
2021 124 269 751
2022 117 278 741
2023 to 2027 493 1,538 3,509
Total $ 1,139 $ 2,847 $ 7,424
The following amounts are included in Accumulated Other Comprehensive Loss as of December 31, 2017 and are expected to be recognized as components of netperiodic benefit cost during 2018 :
PensionBenefits
PostretirementMedicalBenefits
Net actuarial loss $ 78 $ —
50
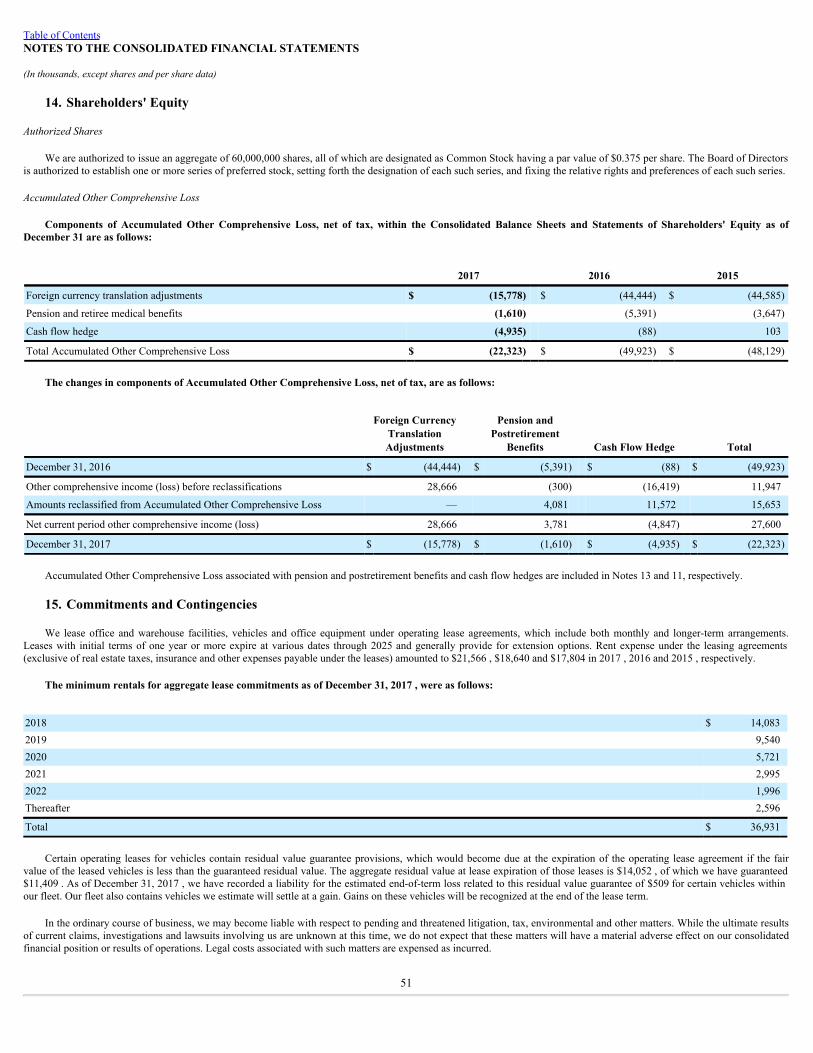
Table of ContentsNOTES TO THE CONSOLIDATED FINANCIAL STATEMENTS
(In thousands, except shares and per share data)
14. Shareholders' Equity
Authorized Shares
We are authorized to issue an aggregate of 60,000,000 shares, all of which are designated as Common Stock having a par value of $0.375 per share. The Board of Directorsis authorized to establish one or more series of preferred stock, setting forth the designation of each such series, and fixing the relative rights and preferences of each such series.
Accumulated Other Comprehensive Loss
Components of Accumulated Other Comprehensive Loss, net of tax, within the Consolidated Balance Sheets and Statements of Shareholders' Equity as ofDecember 31 are as follows:
2017 2016 2015
Foreign currency translation adjustments $ (15,778) $ (44,444) $ (44,585)
Pension and retiree medical benefits (1,610) (5,391) (3,647)
Cash flow hedge (4,935) (88) 103
Total Accumulated Other Comprehensive Loss $ (22,323) $ (49,923) $ (48,129)
The changes in components of Accumulated Other Comprehensive Loss, net of tax, are as follows:
Foreign CurrencyTranslationAdjustments
Pension andPostretirement
Benefits Cash Flow Hedge Total
December 31, 2016 $ (44,444) $ (5,391) $ (88) $ (49,923)
Other comprehensive income (loss) before reclassifications 28,666 (300) (16,419) 11,947
Amounts reclassified from Accumulated Other Comprehensive Loss — 4,081 11,572 15,653
Net current period other comprehensive income (loss) 28,666 3,781 (4,847) 27,600
December 31, 2017 $ (15,778) $ (1,610) $ (4,935) $ (22,323)
Accumulated Other Comprehensive Loss associated with pension and postretirement benefits and cash flow hedges are included in Notes 13 and 11, respectively.
15. Commitments and Contingencies
We lease office and warehouse facilities, vehicles and office equipment under operating lease agreements, which include both monthly and longer-term arrangements.Leases with initial terms of one year or more expire at various dates through 2025 and generally provide for extension options. Rent expense under the leasing agreements(exclusive of real estate taxes, insurance and other expenses payable under the leases) amounted to $21,566 , $18,640 and $17,804 in 2017 , 2016 and 2015 , respectively.
The minimum rentals for aggregate lease commitments as of December 31, 2017 , were as follows:
2018 $ 14,0832019 9,5402020 5,7212021 2,9952022 1,996Thereafter 2,596
Total $ 36,931
Certain operating leases for vehicles contain residual value guarantee provisions, which would become due at the expiration of the operating lease agreement if the fairvalue of the leased vehicles is less than the guaranteed residual value. The aggregate residual value at lease expiration of those leases is $14,052 , of which we have guaranteed$11,409 . As of December 31, 2017 , we have recorded a liability for the estimated end-of-term loss related to this residual value guarantee of $509 for certain vehicles withinour fleet. Our fleet also contains vehicles we estimate will settle at a gain. Gains on these vehicles will be recognized at the end of the lease term.
In the ordinary course of business, we may become liable with respect to pending and threatened litigation, tax, environmental and other matters. While the ultimate resultsof current claims, investigations and lawsuits involving us are unknown at this time, we do not expect that these matters will have a material adverse effect on our consolidatedfinancial position or results of operations. Legal costs associated with such matters are expensed as incurred.
51

Table of ContentsNOTES TO THE CONSOLIDATED FINANCIAL STATEMENTS
(In thousands, except shares and per share data)
16. Income TaxesTax Reform
Legislation popularly known as The Tax Cuts and Jobs Act (Tax Act) was enacted on December 22, 2017, resulting in significant changes to the U.S. corporate income taxsystem. These changes include a federal statutory rate reduction from 35% to 21%, the elimination or reduction of certain domestic deductions and credits and limitations on thedeductibility of interest expense and executive compensation. The Tax Act also transitions international taxation from a worldwide system to a modified territorial system andincludes base erosion prevention measures on non-U.S. earnings, which has the effect of subjecting certain earnings of our foreign subsidiaries to U.S. taxation as globalintangible low-taxed income. These changes are effective beginning in 2018. The 2017 Tax Act also includes a one-time transition tax on certain unrepatriated earnings fromforeign subsidiaries.
ASC 740 requires a company to record the effects of a tax law change in the period of enactment, however, shortly after the enactment of the Tax Act, the SEC staff issuedSAB 118, which allows a company to record a provisional amount when it does not have the necessary information available, prepared or analyzed in reasonable detail tocomplete its accounting for the change in the tax law. The measurement period ends when the company has obtained, prepared and analyzed the information necessary to finalizeits accounting, but cannot extend beyond one year. We have made a reasonable estimate of the impact of the Tax Act and recorded discrete items in our 2017 provisional incometax expense of $2,355 which reflects an estimated reduction in our deferred income tax liabilities of $1,993 as a result of the maximum federal rate decrease to 21% from 35%and an estimated tax charge of $362 for the effects of one-time transition tax on cash and cash equivalent balances related to accumulated earnings associated with ourinternational operations. We are continuing to gather additional information related to these estimates in order to more precisely compute the remeasurement of deferred taxesand the impact of the transition tax.
Income from continuing operations for the three years ended December 31 was as follows:
2017 2016 2015
U.S. operations $ 7,465 $ 54,018 $ 51,189
Foreign operations (8,757) 12,473 (765)
Total $ (1,292) $ 66,491 $ 50,424
Income tax expense (benefit) for the three years ended December 31 was as follows:
2017 2016 2015
Current:
Federal $ 2,590 $ 15,962 $ 15,117
Foreign 8,701 3,035 3,992
State 812 1,859 1,685
$ 12,103 $ 20,856 $ 20,794
Deferred:
Federal $ 1,640 $ (472) $ (481)
Foreign (8,699) (434) (1,888)
State (131) (73) (89)
$ (7,190) $ (979) $ (2,458)
Total:
Federal $ 4,230 $ 15,490 $ 14,636
Foreign 2 2,601 2,104
State 681 1,786 1,596
Total Income Tax Expense $ 4,913 $ 19,877 $ 18,336
U.S. income taxes have been provided on approximately $11,636 of undistributed earnings of non-U.S. subsidiaries as a result of the transition tax required by the Tax Act.In general, it is our practice and intention to permanently reinvest the earnings of our foreign subsidiaries and repatriate earnings only when the tax impact is zero or immaterialand that position has not changed following incurring the transition tax under the Tax Act. No deferred taxes have been provided for withholding taxes or other taxes that wouldresult upon repatriation of our foreign investments to the United States.
52

Table of ContentsNOTES TO THE CONSOLIDATED FINANCIAL STATEMENTS
(In thousands, except shares and per share data)
Tax loss carryforwards and expiration periods by international operation as of December 31, 2017 were as follows:
Amount Carryforward
Period
Netherlands $ 23,733 9 years
Germany 12,068 Unlimited
Sweden 1,586 Unlimited
Norway 655 Unlimited
Spain 4,555 Unlimited
Total $ 42,597
Because of the uncertainty regarding realization of the Netherlands and Sweden tax loss carryforwards, valuation allowances were established.
We have Netherlands foreign tax credit carryforwards of $1,575 . Because of the uncertainty regarding utilization of the Netherlands foreign tax credit carryforward, avaluation allowance was established.
A valuation allowance for the remaining deferred tax assets is not required since it is more likely than not that they will be realized through carryback to taxable income inprior years, future reversals of existing taxable temporary differences and future taxable income.
Our effective income tax rate varied from the U.S. federal statutory tax rate for the three years ended December 31 as follows:
2017 2016 2015
Tax at statutory rate 35.0 % 35.0 % 35.0 %
(Decreases) increases in the tax rate from:
State and local taxes, net of federal benefit (21.1) 1.7 2.2
Effect of foreign operations (70.8) (5.5) (5.1)
Transaction costs (226.3) — —
Effect of 2018 deferred rate change (154.3) — —
Transition Tax (28.0) — —
Impairment of Long-Lived Assets — — 7.0
Effect of changes in valuation allowances (126.5) 1.9 1.5
Domestic production activities deduction 28.3 (2.2) (2.7)
Share-based payments 90.4 — —
Research & Development credit 82.9 (1.3) (1.7)
Other, net 10.2 0.3 0.2
Effective income tax rate (380.2)% 29.9 % 36.4 %
53

Table of ContentsNOTES TO THE CONSOLIDATED FINANCIAL STATEMENTS
(In thousands, except shares and per share data)
Deferred tax assets and liabilities were comprised of the following as of December 31:
2017 2016
Deferred Tax Assets:
Inventories, principally due to changes in inventory reserves $ 4,757 $ 332
Employee wages and benefits, principally due to accruals for financial reporting purposes 11,031 14,723
Warranty reserves accrued for financial reporting purposes 2,578 3,617
Receivables, principally due to allowance for doubtful accounts and tax accounting method for equipment rentals 2,138 1,413
Tax loss carryforwards 11,383 7,821
Tax credit carryforwards 1,575 1,228
Other 3,630 2,126
Gross Deferred Tax Assets $ 37,092 $ 31,260
Less: valuation allowance (9,691) (6,865)
Total Net Deferred Tax Assets $ 27,401 $ 24,395
Deferred Tax Liabilities:
Property, Plant and Equipment, principally due to differences in depreciation and related gains 9,042 6,947
Goodwill and Intangible Assets 60,450 4,180
Total Deferred Tax Liabilities $ 69,492 $ 11,127
Net Deferred Tax (Liabilities) Assets $ (42,091) $ 13,268
The valuation allowance at December 31, 2017 principally applies to the Netherlands tax loss and tax credit carryforwards that, in the opinion of management, are morelikely than not to expire unutilized. However, to the extent that tax benefits related to these carryforwards are realized in the future, the reduction in the valuation allowance willreduce income tax expense.
A reconciliation of the beginning and ending amount of unrecognized tax benefits is as follows:
2017 2016
Balance at January 1, $ 2,477 $ 2,326
Increases as a result of tax positions taken during the current year 329 545
Increase related to prior period tax positions of acquired entities 236 —
Decreases relating to settlement with tax authorities (68) (6)
Reductions as a result of a lapse of the applicable statute of limitations (770) (523)
Increases as a result of foreign currency fluctuations 28 135
Balance at December 31, $ 2,232 $ 2,477
Included in the balance of unrecognized tax benefits at December 31, 2017 and 2016 are potential benefits of $1,992 and $2,114 , respectively, that if recognized, wouldaffect the effective tax rate from continuing operations.
We recognize potential accrued interest and penalties related to unrecognized tax benefits as a component of income tax expense. In addition to the liability of $2,232 and$2,477 for unrecognized tax benefits as of December 31, 2017 and 2016 , there was approximately $482 and $490 , respectively, for accrued interest and penalties. To the extentinterest and penalties are not assessed with respect to uncertain tax positions, the amounts accrued will be revised and reflected as an adjustment to income tax expense.
We and our subsidiaries are subject to U.S. federal income tax as well as income tax of numerous state and foreign jurisdictions. We are generally no longer subject to U.S.federal tax examinations for taxable years before 2014 and, with limited exceptions, state and foreign income tax examinations for taxable years before 2013.
We are currently under examination by the Internal Revenue Service for the 2015 tax year. Although the outcome of this matter cannot currently be determined, we believeadequate provision has been made for any potential unfavorable financial statement impact. We are currently undergoing income tax examinations in various state and foreignjurisdictions covering 2014 to 2016 . Although the final outcome of these examinations cannot be currently determined, we believe that we have adequate reserves with respectto these examinations.
We do not anticipate that total unrecognized tax benefits will change significantly within the next 12 months.
54
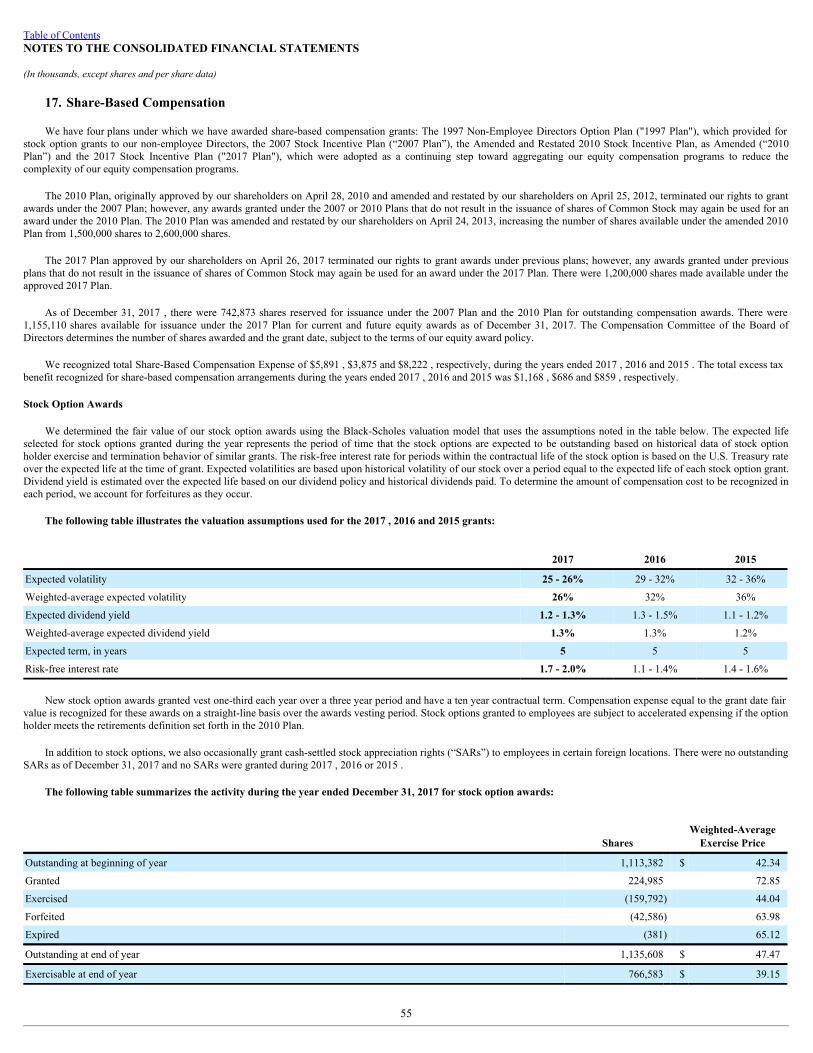
Table of ContentsNOTES TO THE CONSOLIDATED FINANCIAL STATEMENTS
(In thousands, except shares and per share data)
17. Share-Based Compensation
We have four plans under which we have awarded share-based compensation grants: The 1997 Non-Employee Directors Option Plan ("1997 Plan"), which provided forstock option grants to our non-employee Directors, the 2007 Stock Incentive Plan (“2007 Plan”), the Amended and Restated 2010 Stock Incentive Plan, as Amended (“2010Plan”) and the 2017 Stock Incentive Plan ("2017 Plan"), which were adopted as a continuing step toward aggregating our equity compensation programs to reduce thecomplexity of our equity compensation programs.
The 2010 Plan, originally approved by our shareholders on April 28, 2010 and amended and restated by our shareholders on April 25, 2012, terminated our rights to grantawards under the 2007 Plan; however, any awards granted under the 2007 or 2010 Plans that do not result in the issuance of shares of Common Stock may again be used for anaward under the 2010 Plan. The 2010 Plan was amended and restated by our shareholders on April 24, 2013, increasing the number of shares available under the amended 2010Plan from 1,500,000 shares to 2,600,000 shares.
The 2017 Plan approved by our shareholders on April 26, 2017 terminated our rights to grant awards under previous plans; however, any awards granted under previousplans that do not result in the issuance of shares of Common Stock may again be used for an award under the 2017 Plan. There were 1,200,000 shares made available under theapproved 2017 Plan.
As of December 31, 2017 , there were 742,873 shares reserved for issuance under the 2007 Plan and the 2010 Plan for outstanding compensation awards. There were1,155,110 shares available for issuance under the 2017 Plan for current and future equity awards as of December 31, 2017. The Compensation Committee of the Board ofDirectors determines the number of shares awarded and the grant date, subject to the terms of our equity award policy.
We recognized total Share-Based Compensation Expense of $5,891 , $3,875 and $8,222 , respectively, during the years ended 2017 , 2016 and 2015 . The total excess taxbenefit recognized for share-based compensation arrangements during the years ended 2017 , 2016 and 2015 was $1,168 , $686 and $859 , respectively.
Stock Option Awards
We determined the fair value of our stock option awards using the Black-Scholes valuation model that uses the assumptions noted in the table below. The expected lifeselected for stock options granted during the year represents the period of time that the stock options are expected to be outstanding based on historical data of stock optionholder exercise and termination behavior of similar grants. The risk-free interest rate for periods within the contractual life of the stock option is based on the U.S. Treasury rateover the expected life at the time of grant. Expected volatilities are based upon historical volatility of our stock over a period equal to the expected life of each stock option grant.Dividend yield is estimated over the expected life based on our dividend policy and historical dividends paid. To determine the amount of compensation cost to be recognized ineach period, we account for forfeitures as they occur.
The following table illustrates the valuation assumptions used for the 2017 , 2016 and 2015 grants:
2017 2016 2015
Expected volatility 25 - 26% 29 - 32% 32 - 36%
Weighted-average expected volatility 26% 32% 36%
Expected dividend yield 1.2 - 1.3% 1.3 - 1.5% 1.1 - 1.2%
Weighted-average expected dividend yield 1.3% 1.3% 1.2%
Expected term, in years 5 5 5
Risk-free interest rate 1.7 - 2.0% 1.1 - 1.4% 1.4 - 1.6%
New stock option awards granted vest one-third each year over a three year period and have a ten year contractual term. Compensation expense equal to the grant date fairvalue is recognized for these awards on a straight-line basis over the awards vesting period. Stock options granted to employees are subject to accelerated expensing if the optionholder meets the retirements definition set forth in the 2010 Plan.
In addition to stock options, we also occasionally grant cash-settled stock appreciation rights (“SARs”) to employees in certain foreign locations. There were no outstandingSARs as of December 31, 2017 and no SARs were granted during 2017 , 2016 or 2015 .
The following table summarizes the activity during the year ended December 31, 2017 for stock option awards:
Shares Weighted-Average
Exercise Price
Outstanding at beginning of year 1,113,382 $ 42.34
Granted 224,985 72.85
Exercised (159,792) 44.04
Forfeited (42,586) 63.98
Expired (381) 65.12
Outstanding at end of year 1,135,608 $ 47.47
Exercisable at end of year 766,583 $ 39.15
55

Table of ContentsNOTES TO THE CONSOLIDATED FINANCIAL STATEMENTS
(In thousands, except shares and per share data)
The weighted-average grant date fair value of stock options granted during the years ended December 31, 2017 , 2016 and 2015 was $16.39 , $13.61 and $20.08 ,respectively. The total intrinsic value of stock options exercised during the years ended December 31, 2017 , 2016 and 2015 was $4,450 , $3,408 and $1,702 , respectively. Theaggregate intrinsic value of options outstanding and exercisable at December 31, 2017 was $28,711 and $25,702 , respectively. The weighted-average remaining contractual lifefor options outstanding and exercisable as of December 31, 2017 , was 5.6 years and 4.2 years , respectively. As of December 31, 2017 , there was unrecognized compensationcost for nonvested options of $2,064 , which is expected to be recognized over a weighted-average period of 1.4 years .
Restricted Share Awards
Restricted share awards for employees generally have a three year vesting period from the effective date of the grant. Restricted share awards to non-employee directorsvest upon a change of control or upon termination of service as a director occurring at least six months after grant date of the award so long as termination is for one of thefollowing reasons: death; disability; retirement in accordance with Tennant policy (e.g., age, term limits, etc.); resignation at request of Board (other than for gross misconduct);resignation following at least six months’ advance notice; failure to be renominated (unless due to unwillingness to serve) or reelected by shareholders; or removal byshareholders. We use the closing share price the day before the grant date to determine the fair value of our restricted share awards. Expenses on these awards are recognizedover the vesting period.
The following table summarizes the activity during the year ended December 31, 2017 for nonvested restricted share awards:
Shares Weighted-Average
Grant Date Fair Value
Nonvested at beginning of year 117,234 $ 47.62
Granted 20,284 73.06
Vested (32,990) 44.36
Forfeited (4,739) 63.43
Nonvested at end of year 99,789 $ 53.11
The total fair value of shares vested during the years ended December 31, 2017 , 2016 and 2015 was $1,463 , $1,970 and $1,054 , respectively. As of December 31, 2017 ,there was $1,585 of total unrecognized compensation cost related to nonvested shares which is expected to be recognized over a weighted-average period of 1.8 years .
Performance Share Awards
We grant performance share awards to key employees as a part of our long-term management compensation program. These awards are earned based upon achievement ofcertain financial performance targets over a three year period. The number of shares of common stock a participant receives will be increased (up to 200 percent of target levels)or reduced (down to zero ) based on the level of achievement of the financial performance targets. We use the closing share price the day before the grant date to determine thefair value of our performance share awards. Expenses on these awards are recognized over a three year performance period. Performance shares are granted in restricted stockunits. They are payable in stock and vest solely upon achievement of certain financial performance targets during this three year period.
The following table summarizes the activity during the year ended December 31, 2017 for nonvested performance share awards:
Shares Weighted-Average
Grant Date Fair Value
Nonvested at beginning of year 129,096 $ 59.30
Granted 45,792 72.84
Vested (20,060) 61.80
Forfeited (31,804) 62.55
Nonvested at end of year 123,024 $ 63.09
The total fair value of shares vested during the year ended December 31, 2017 , 2016 and 2015 was $1,240 , $1,703 and $1,713 , respectively. As of December 31, 2017 ,we expect to recognize $1,400 of total compensation costs over a weighted-average period of 2.0 years .
Restricted Stock Units
We grant restricted stock units to employees, which generally vest within three years from the date of the grant. Vested restricted stock units are paid out in stock. We usethe closing share price the day before the grant date to determine the fair value our restricted stock units. Expenses on these awards are recognized on a straight line basis overthe vesting period of the award.
56

Table of ContentsNOTES TO THE CONSOLIDATED FINANCIAL STATEMENTS
(In thousands, except shares and per share data)
The following table summarizes the activity during the year ended December 31, 2017 for nonvested restricted stock units:
Shares Weighted-Average
Grant Date Fair Value
Nonvested at beginning of year 31,038 $ 60.47
Granted 30,750 68.92
Vested (14,638) 65.74
Forfeited (4,025) 60.82
Nonvested at end of year 43,125 $ 64.67
The total fair value of shares vested during the years ended December 31, 2017 and 2016 was $962 and $907 , respectively. As of December 31, 2017 , there was $1,743 oftotal unrecognized compensation cost related to nonvested shares which is expected to be recognized over a weighted-average period of 1.3 years .
Share-Based Liabilities
As of December 31, 2017 and 2016 , we had $175 and $155 in total share-based liabilities recorded on our Consolidated Balance Sheets, respectively. During the yearsended December 31, 2017 , 2016 and 2015 , we paid out $45 , $62 and $53 related to share-based liability awards, respectively.
18. (Loss) Earnings Attributable to Tennant Company Per Share
The computations of Basic and Diluted (Loss) Earnings Attributable to Tennant Company per Share for the years ended December 31 were as follows:
2017 2016 2015
Numerator:
Net (Loss) Earnings Attributable to Tennant Company $ (6,195) $ 46,614 $ 32,088
Denominator:
Basic - Weighted Average Shares Outstanding 17,695,390 17,523,267 18,015,151
Effect of dilutive securities — 452,916 478,296
Diluted - Weighted Average Shares Outstanding 17,695,390 17,976,183 18,493,447
Basic (Loss) Earnings per Share $ (0.35) $ 2.66 $ 1.78
Diluted (Loss) Earnings per Share $ (0.35) $ 2.59 $ 1.74
Excluded from the dilutive securities shown above were options to purchase and shares to be paid out under share-based compensation plans of 711,212 , 356,598 and222,092 shares of common stock during 2017 , 2016 and 2015 , respectively. These exclusions were made if the exercise prices of these options are greater than the averagemarket price of our common stock for the period, if the number of shares we can repurchase under the treasury stock method exceeds the weighted shares outstanding in theoptions or if we have a net loss, as the effects are anti-dilutive.
19. Segment Reporting
We are organized into four operating segments: North America; Latin America; Europe, Middle East, Africa; and Asia Pacific. We combine our North America and LatinAmerica operating segments into the "Americas" for reporting net sales by geographic area. In accordance with the objective and basic principles of the applicable accountingguidance, we aggregate our operating segments into one reportable segment that consists of the design, manufacture and sale of products used primarily in the maintenance ofnonresidential surfaces.
The following table presents Net Sales by geographic area for the years ended December 31:
2017 2016 2015
Net Sales:
Americas $ 640,274 $ 607,026 $ 591,405
Europe, Middle East, Africa 273,738 129,046 139,834
Asia Pacific 89,054 72,500 80,560
Total $ 1,003,066 $ 808,572 $ 811,799
57

Table of ContentsNOTES TO THE CONSOLIDATED FINANCIAL STATEMENTS
(In thousands, except shares and per share data)
The following table presents long-lived assets by geographic area as of December 31:
2017 2016 2015
Long-lived assets:
Americas $ 132,659 $ 134,737 $ 110,842
Europe, Middle East, Africa 422,338 19,606 11,100
Asia Pacific 4,731 4,334 4,658
Total $ 559,728 $ 158,677 $ 126,600
Accounting policies of the operations in the various operating segments are the same as those described in Note 1. Net Sales are attributed to each operating segment basedon the end user country and are net of intercompany sales. Information regarding sales to customers geographically located in the United States is provided in Item 1, Business –Segment and Geographic Area Financial Information . No single customer represents more than 10% of our consolidated Net Sales.
Long-lived assets consist of Property, Plant and Equipment, Goodwill, Intangible Assets and certain other assets. Long-lived assets located in Italy totaled $393,917 as ofthe year ended December 31, 2017 as a result of our acquisition of IPC Group. We did not have long-lived assets located in Italy for 2016 and 2015. There are no otherindividual foreign locations which have long-lived assets which represent more than 10% of our consolidated long-lived assets.
The following table presents revenues for groups of similar products and services for the years ended December 31:
2017 2016 2015
Net Sales:
Equipment $ 636,875 $ 491,075 $ 499,634
Parts and consumables 202,452 173,632 175,697
Service and other 132,332 114,719 112,622
Specialty surface coatings 31,407 29,146 23,846
Total $ 1,003,066 $ 808,572 $ 811,799
20. Consolidated Quarterly Data (Unaudited)
2017
Q1 Q2 Q3 Q4
Net Sales $ 191,059 $ 270,791 $ 261,921 $ 279,295
Gross Profit 79,736 104,554 104,604 115,527
Net (Loss) Earnings Attributable to Tennant Company (3,957) (2,591) 3,559 (3,206)
Basic (Loss) Earnings Attributable to Tennant Company per Share $ (0.22) $ (0.15) $ 0.20 $ (0.18)
Diluted (Loss) Earnings Attributable to Tennant Company per Share $ (0.22) $ (0.15) $ 0.20 $ (0.18)
2016
Q1 Q2 Q3 Q4
Net Sales $ 179,864 $ 216,828 $ 200,134 $ 211,746
Gross Profit 77,502 95,289 85,295 93,509
Net Earnings Attributable to Tennant Company 4,439 15,328 11,477 15,370
Basic Earnings Attributable to Tennant Company per Share $ 0.25 $ 0.88 $ 0.66 $ 0.88
Diluted Earnings Attributable to Tennant Company per Share $ 0.25 $ 0.85 $ 0.64 $ 0.85
The summation of quarterly data may not equate to the calculation for the full fiscal year as quarterly calculations are performed on a discrete basis.
Regular quarterly dividends aggregated to $0.84 per share in 2017 , or $0.21 per share per quarter, and $0.81 per share in 2016 , or $0.20 per share for the first threequarters of 2016 and $0.21 per share for the last quarter of 2016 .
21. Related Party Transactions
During the first quarter of 2008, we acquired Sociedade Alfa Ltda. and entered into lease agreements for certain properties owned by or partially owned by the formerowners of this entity. Some of these individuals are current employees of Tennant. Lease payments made under these lease agreements are not material to our financial position

or results of operations.
58
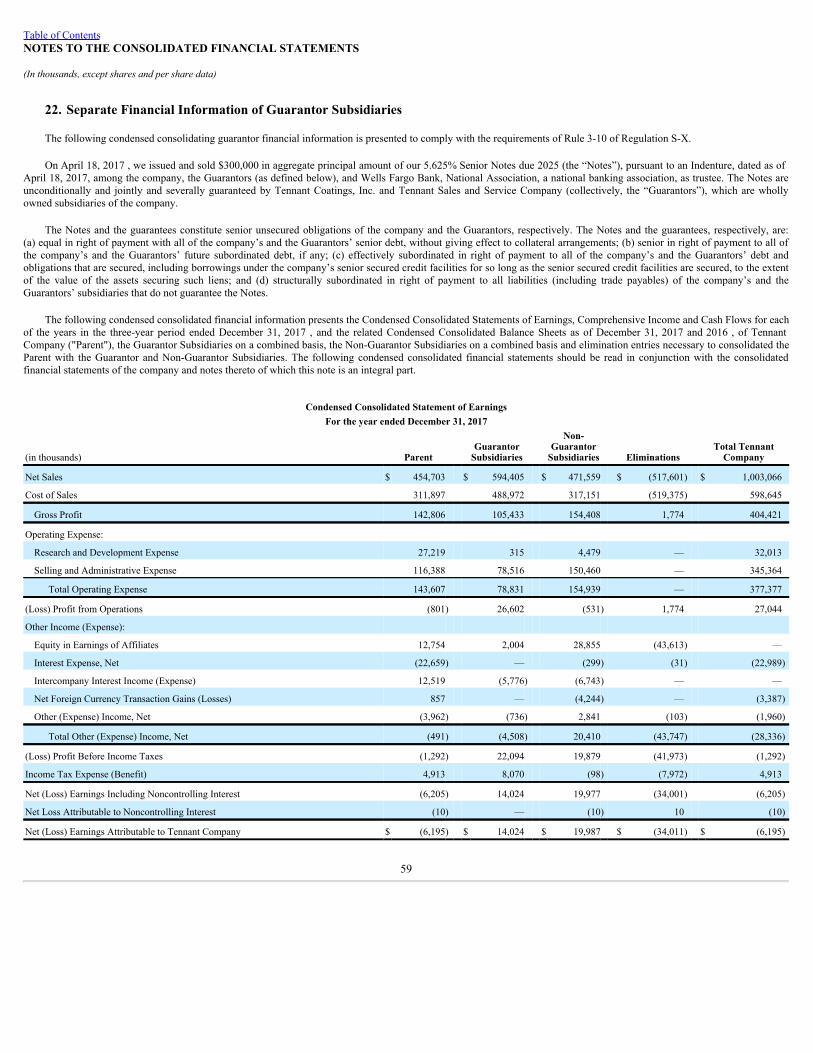
Table of ContentsNOTES TO THE CONSOLIDATED FINANCIAL STATEMENTS
(In thousands, except shares and per share data)
22. Separate Financial Information of Guarantor Subsidiaries
The following condensed consolidating guarantor financial information is presented to comply with the requirements of Rule 3-10 of Regulation S-X.
On April 18, 2017 , we issued and sold $300,000 in aggregate principal amount of our 5.625% Senior Notes due 2025 (the “Notes”), pursuant to an Indenture, dated as ofApril 18, 2017, among the company, the Guarantors (as defined below), and Wells Fargo Bank, National Association, a national banking association, as trustee. The Notes areunconditionally and jointly and severally guaranteed by Tennant Coatings, Inc. and Tennant Sales and Service Company (collectively, the “Guarantors”), which are whollyowned subsidiaries of the company.
The Notes and the guarantees constitute senior unsecured obligations of the company and the Guarantors, respectively. The Notes and the guarantees, respectively, are:(a) equal in right of payment with all of the company’s and the Guarantors’ senior debt, without giving effect to collateral arrangements; (b) senior in right of payment to all ofthe company’s and the Guarantors’ future subordinated debt, if any; (c) effectively subordinated in right of payment to all of the company’s and the Guarantors’ debt andobligations that are secured, including borrowings under the company’s senior secured credit facilities for so long as the senior secured credit facilities are secured, to the extentof the value of the assets securing such liens; and (d) structurally subordinated in right of payment to all liabilities (including trade payables) of the company’s and theGuarantors’ subsidiaries that do not guarantee the Notes.
The following condensed consolidated financial information presents the Condensed Consolidated Statements of Earnings, Comprehensive Income and Cash Flows for eachof the years in the three-year period ended December 31, 2017 , and the related Condensed Consolidated Balance Sheets as of December 31, 2017 and 2016 , of TennantCompany ("Parent"), the Guarantor Subsidiaries on a combined basis, the Non-Guarantor Subsidiaries on a combined basis and elimination entries necessary to consolidated theParent with the Guarantor and Non-Guarantor Subsidiaries. The following condensed consolidated financial statements should be read in conjunction with the consolidatedfinancial statements of the company and notes thereto of which this note is an integral part.
Condensed Consolidated Statement of EarningsFor the year ended December 31, 2017
(in thousands) Parent Guarantor
Subsidiaries
Non-Guarantor
Subsidiaries Eliminations Total Tennant
Company
Net Sales $ 454,703 $ 594,405 $ 471,559 $ (517,601) $ 1,003,066
Cost of Sales 311,897 488,972 317,151 (519,375) 598,645
Gross Profit 142,806 105,433 154,408 1,774 404,421
Operating Expense:
Research and Development Expense 27,219 315 4,479 — 32,013
Selling and Administrative Expense 116,388 78,516 150,460 — 345,364
Total Operating Expense 143,607 78,831 154,939 — 377,377
(Loss) Profit from Operations (801) 26,602 (531) 1,774 27,044
Other Income (Expense):
Equity in Earnings of Affiliates 12,754 2,004 28,855 (43,613) —
Interest Expense, Net (22,659) — (299) (31) (22,989)
Intercompany Interest Income (Expense) 12,519 (5,776) (6,743) — —
Net Foreign Currency Transaction Gains (Losses) 857 — (4,244) — (3,387)
Other (Expense) Income, Net (3,962) (736) 2,841 (103) (1,960)
Total Other (Expense) Income, Net (491) (4,508) 20,410 (43,747) (28,336)
(Loss) Profit Before Income Taxes (1,292) 22,094 19,879 (41,973) (1,292)
Income Tax Expense (Benefit) 4,913 8,070 (98) (7,972) 4,913
Net (Loss) Earnings Including Noncontrolling Interest (6,205) 14,024 19,977 (34,001) (6,205)
Net Loss Attributable to Noncontrolling Interest (10) — (10) 10 (10)
Net (Loss) Earnings Attributable to Tennant Company $ (6,195) $ 14,024 $ 19,987 $ (34,011) $ (6,195)
59
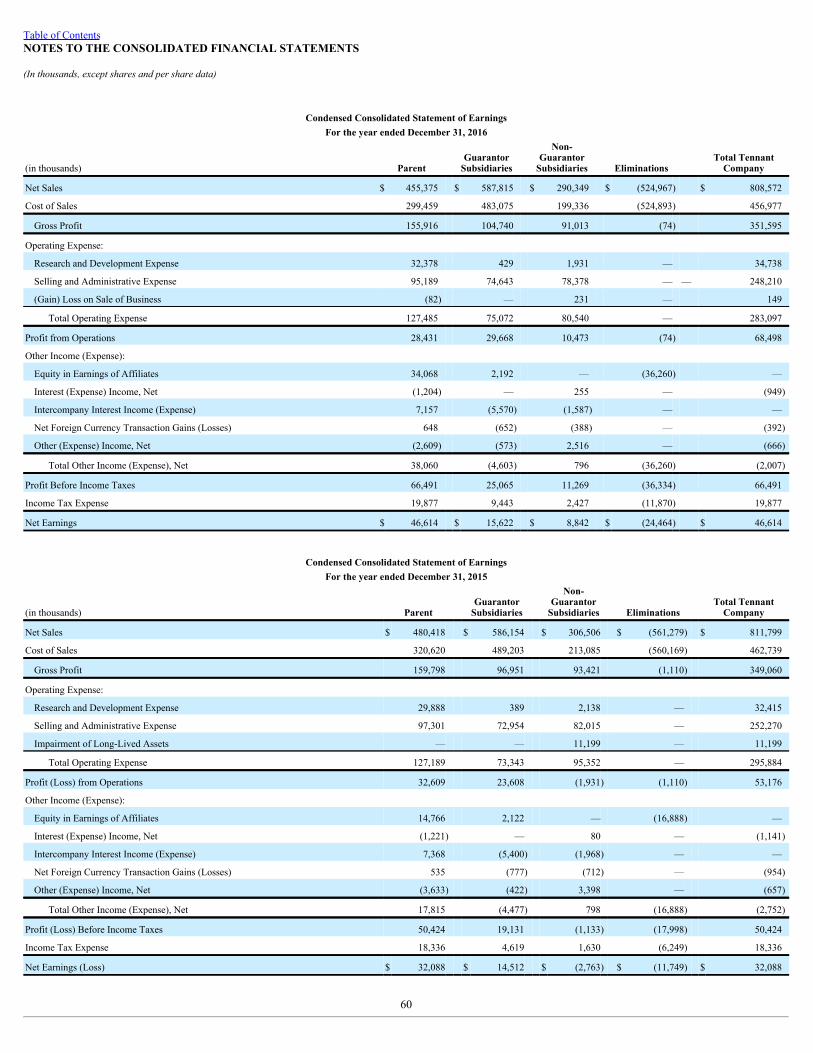
Table of ContentsNOTES TO THE CONSOLIDATED FINANCIAL STATEMENTS
(In thousands, except shares and per share data)
Condensed Consolidated Statement of EarningsFor the year ended December 31, 2016
(in thousands) Parent Guarantor
Subsidiaries
Non-Guarantor
Subsidiaries Eliminations Total Tennant
Company
Net Sales $ 455,375 $ 587,815 $ 290,349 $ (524,967) $ 808,572
Cost of Sales 299,459 483,075 199,336 (524,893) 456,977
Gross Profit 155,916 104,740 91,013 (74) 351,595
Operating Expense:
Research and Development Expense 32,378 429 1,931 — 34,738
Selling and Administrative Expense 95,189 74,643 78,378 — — 248,210
(Gain) Loss on Sale of Business (82) — 231 — 149
Total Operating Expense 127,485 75,072 80,540 — 283,097
Profit from Operations 28,431 29,668 10,473 (74) 68,498
Other Income (Expense):
Equity in Earnings of Affiliates 34,068 2,192 — (36,260) —
Interest (Expense) Income, Net (1,204) — 255 — (949)
Intercompany Interest Income (Expense) 7,157 (5,570) (1,587) — —
Net Foreign Currency Transaction Gains (Losses) 648 (652) (388) — (392)
Other (Expense) Income, Net (2,609) (573) 2,516 — (666)
Total Other Income (Expense), Net 38,060 (4,603) 796 (36,260) (2,007)
Profit Before Income Taxes 66,491 25,065 11,269 (36,334) 66,491
Income Tax Expense 19,877 9,443 2,427 (11,870) 19,877
Net Earnings $ 46,614 $ 15,622 $ 8,842 $ (24,464) $ 46,614
Condensed Consolidated Statement of EarningsFor the year ended December 31, 2015
(in thousands) Parent Guarantor
Subsidiaries
Non-Guarantor
Subsidiaries Eliminations Total Tennant
Company
Net Sales $ 480,418 $ 586,154 $ 306,506 $ (561,279) $ 811,799
Cost of Sales 320,620 489,203 213,085 (560,169) 462,739
Gross Profit 159,798 96,951 93,421 (1,110) 349,060
Operating Expense:
Research and Development Expense 29,888 389 2,138 — 32,415
Selling and Administrative Expense 97,301 72,954 82,015 — 252,270
Impairment of Long-Lived Assets — — 11,199 — 11,199
Total Operating Expense 127,189 73,343 95,352 — 295,884
Profit (Loss) from Operations 32,609 23,608 (1,931) (1,110) 53,176
Other Income (Expense):
Equity in Earnings of Affiliates 14,766 2,122 — (16,888) —
Interest (Expense) Income, Net (1,221) — 80 — (1,141)
Intercompany Interest Income (Expense) 7,368 (5,400) (1,968) — —
Net Foreign Currency Transaction Gains (Losses) 535 (777) (712) — (954)
Other (Expense) Income, Net (3,633) (422) 3,398 — (657)
Total Other Income (Expense), Net 17,815 (4,477) 798 (16,888) (2,752)
Profit (Loss) Before Income Taxes 50,424 19,131 (1,133) (17,998) 50,424
Income Tax Expense 18,336 4,619 1,630 (6,249) 18,336
Net Earnings (Loss) $ 32,088 $ 14,512 $ (2,763) $ (11,749) $ 32,088
60

Table of ContentsNOTES TO THE CONSOLIDATED FINANCIAL STATEMENTS
(In thousands, except shares and per share data)
Condensed Consolidated Statement of Comprehensive IncomeFor the year ended December 31, 2017
(in thousands) Parent Guarantor
Subsidiaries Non-Guarantor
Subsidiaries Eliminations Total Tennant
Company
Net Earnings $ (6,205) $ 14,024 $ 19,977 $ (34,001) $ (6,205)
Other Comprehensive Income (Loss):
Foreign currency translation adjustments 28,356 1,215 2,960 (4,175) 28,356
Pension and retiree medical benefits 5,868 — 538 (538) 5,868
Cash flow hedge (7,731) — — — (7,731)
Income Taxes:
Foreign currency translation adjustments 310 — 310 (310) 310
Pension and retiree medical benefits (2,087) — (99) 99 (2,087)
Cash flow hedge 2,884 — — — 2,884
Total Other Comprehensive (Loss) Income, net of tax 27,600 1,215 3,709 (4,924) 27,600
Total Comprehensive Income Including Noncontrolling Interest 21,395 15,239 23,686 (38,925) 21,395
Comprehensive Loss Attributable to Noncontrolling Interest (10) — (10) 10 (10)
Comprehensive Income Attributable to Tennant Company $ 21,405 $ 15,239 $ 23,696 $ (38,935) $ 21,405
Condensed Consolidated Statement of Comprehensive IncomeFor the year ended December 31, 2016
(in thousands) Parent Guarantor
Subsidiaries Non-Guarantor
Subsidiaries Eliminations Total Tennant
Company
Net Earnings $ 46,614 $ 15,622 $ 8,842 $ (24,464) $ 46,614
Other Comprehensive Income (Loss):
Foreign currency translation adjustments 109 270 3,534 (3,804) 109
Pension and retiree medical benefits (2,248) — (1,691) 1,691 (2,248)
Cash flow hedge (305) — — — (305)
Income Taxes:
Foreign currency translation adjustments 32 — 32 (32) 32
Pension and retiree medical benefits 504 — 296 (296) 504
Cash flow hedge 114 — — — 114
Total Other Comprehensive (Loss) Income, net of tax (1,794) 270 2,171 (2,441) (1,794)
Comprehensive Income $ 44,820 $ 15,892 $ 11,013 $ (26,905) $ 44,820
Condensed Consolidated Statement of Comprehensive IncomeFor the year ended December 31, 2015
(in thousands) Parent Guarantor
Subsidiaries
Non-Guarantor
Subsidiaries Eliminations Total Tennant
Company
Net Earnings $ 32,088 $ 14,512 $ (2,763) $ (11,749) $ 32,088
Other Comprehensive (Loss) Income:
Foreign currency translation adjustments (12,520) (1,082) (12,903) 13,985 (12,520)
Pension and retiree medical benefits 4,121 — 1,571 (1,571) 4,121
Cash flow hedge 164 — — — 164
Income Taxes:
Foreign currency translation adjustments 25 — 25 (25) 25
Pension and retiree medical benefits (1,265) — (314) 314 (1,265)
Cash flow hedge (61) — — — (61)
Total Other Comprehensive Loss, net of tax (9,536) (1,082) (11,621) 12,703 (9,536)
Comprehensive Income (Loss) $ 22,552 $ 13,430 $ (14,384) $ 954 $ 22,552
61
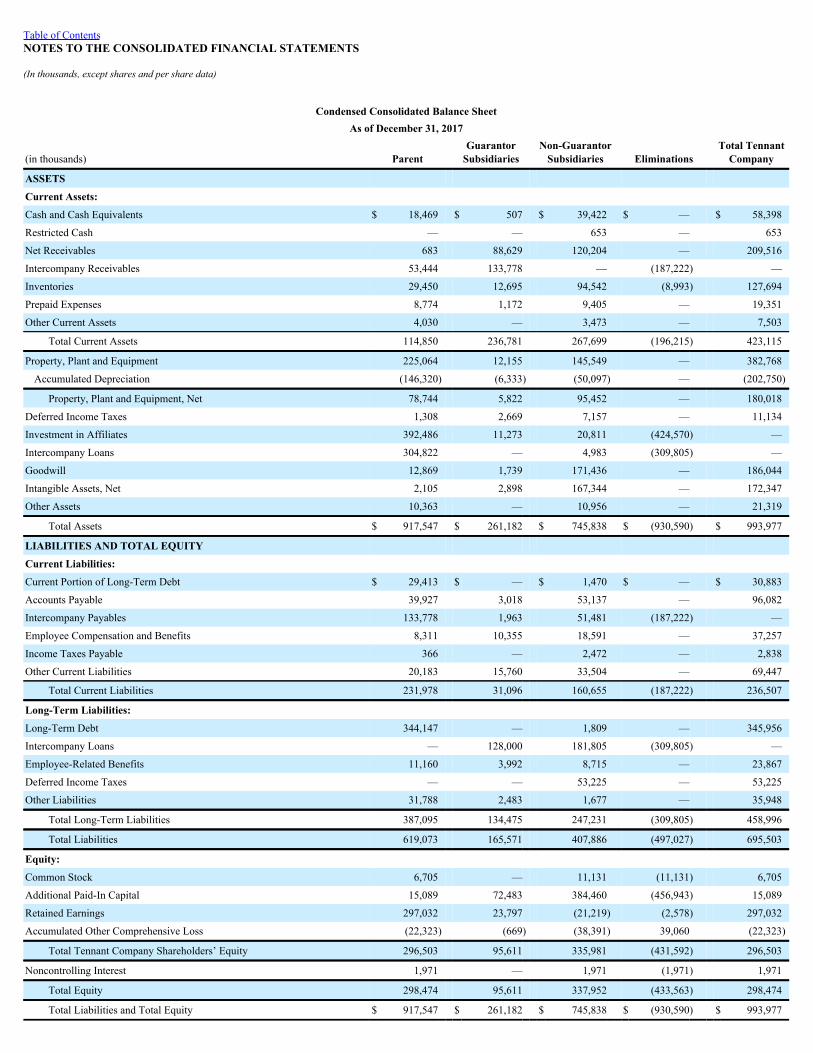
Table of ContentsNOTES TO THE CONSOLIDATED FINANCIAL STATEMENTS
(In thousands, except shares and per share data)
Condensed Consolidated Balance SheetAs of December 31, 2017
(in thousands) Parent Guarantor
Subsidiaries Non-Guarantor
Subsidiaries Eliminations Total Tennant
Company
ASSETS Current Assets: Cash and Cash Equivalents $ 18,469 $ 507 $ 39,422 $ — $ 58,398
Restricted Cash — — 653 — 653
Net Receivables 683 88,629 120,204 — 209,516
Intercompany Receivables 53,444 133,778 — (187,222) —
Inventories 29,450 12,695 94,542 (8,993) 127,694
Prepaid Expenses 8,774 1,172 9,405 — 19,351
Other Current Assets 4,030 — 3,473 — 7,503
Total Current Assets 114,850 236,781 267,699 (196,215) 423,115
Property, Plant and Equipment 225,064 12,155 145,549 — 382,768
Accumulated Depreciation (146,320) (6,333) (50,097) — (202,750)
Property, Plant and Equipment, Net 78,744 5,822 95,452 — 180,018
Deferred Income Taxes 1,308 2,669 7,157 — 11,134
Investment in Affiliates 392,486 11,273 20,811 (424,570) —
Intercompany Loans 304,822 — 4,983 (309,805) —
Goodwill 12,869 1,739 171,436 — 186,044
Intangible Assets, Net 2,105 2,898 167,344 — 172,347
Other Assets 10,363 — 10,956 — 21,319
Total Assets $ 917,547 $ 261,182 $ 745,838 $ (930,590) $ 993,977
LIABILITIES AND TOTAL EQUITY Current Liabilities: Current Portion of Long-Term Debt $ 29,413 $ — $ 1,470 $ — $ 30,883
Accounts Payable 39,927 3,018 53,137 — 96,082
Intercompany Payables 133,778 1,963 51,481 (187,222) —
Employee Compensation and Benefits 8,311 10,355 18,591 — 37,257
Income Taxes Payable 366 — 2,472 — 2,838
Other Current Liabilities 20,183 15,760 33,504 — 69,447
Total Current Liabilities 231,978 31,096 160,655 (187,222) 236,507
Long-Term Liabilities: Long-Term Debt 344,147 — 1,809 — 345,956
Intercompany Loans — 128,000 181,805 (309,805) —
Employee-Related Benefits 11,160 3,992 8,715 — 23,867
Deferred Income Taxes — — 53,225 — 53,225
Other Liabilities 31,788 2,483 1,677 — 35,948
Total Long-Term Liabilities 387,095 134,475 247,231 (309,805) 458,996
Total Liabilities 619,073 165,571 407,886 (497,027) 695,503
Equity: Common Stock 6,705 — 11,131 (11,131) 6,705
Additional Paid-In Capital 15,089 72,483 384,460 (456,943) 15,089
Retained Earnings 297,032 23,797 (21,219) (2,578) 297,032
Accumulated Other Comprehensive Loss (22,323) (669) (38,391) 39,060 (22,323)
Total Tennant Company Shareholders’ Equity 296,503 95,611 335,981 (431,592) 296,503
Noncontrolling Interest 1,971 — 1,971 (1,971) 1,971
Total Equity 298,474 95,611 337,952 (433,563) 298,474
Total Liabilities and Total Equity $ 917,547 $ 261,182 $ 745,838 $ (930,590) $ 993,977

62

Table of ContentsNOTES TO THE CONSOLIDATED FINANCIAL STATEMENTS
(In thousands, except shares and per share data)
Condensed Consolidated Balance SheetAs of December 31, 2016
(in thousands) Parent Guarantor
Subsidiaries Non-Guarantor
Subsidiaries Eliminations Total Tennant
Company
ASSETS Current Assets: Cash and Cash Equivalents $ 38,484 $ 226 $ 19,323 $ — $ 58,033
Restricted Cash — — 517 — 517
Net Receivables 209 85,219 63,706 — 149,134
Intercompany Receivables 50,437 123,289 2,251 (175,977) —
Inventories 26,422 12,821 49,829 (10,450) 78,622
Prepaid Expenses 4,120 1,151 3,933 — 9,204
Other Current Assets 2,402 — 10 — 2,412
Total Current Assets 122,074 222,706 139,569 (186,427) 297,922
Property, Plant and Equipment 225,651 12,996 59,853 — 298,500
Accumulated Depreciation (144,281) (6,175) (35,947) — (186,403)
Property, Plant and Equipment, Net 81,370 6,821 23,906 — 112,097
Deferred Income Taxes 3,048 3,281 7,110 — 13,439
Investment in Affiliates 157,004 9,021 — (166,025) —
Intercompany Loans 130,000 — — (130,000) —
Goodwill 12,869 1,439 6,757 — 21,065
Intangible Assets, Net — 3,200 3,260 — 6,460
Other Assets 10,189 27 8,838 — 19,054
Total Assets $ 516,554 $ 246,495 $ 189,440 $ (482,452) $ 470,037
LIABILITIES AND SHAREHOLDERS' EQUITY Current Liabilities: Current Portion of Long-Term Debt $ 3,429 $ — $ 30 $ — $ 3,459
Accounts Payable 30,867 2,599 13,942 — 47,408
Intercompany Payables 125,540 1,249 49,188 (175,977) —
Employee Compensation and Benefits 12,025 15,261 8,711 — 35,997
Income Taxes Payable 1,410 — 938 — 2,348
Other Current Liabilities 15,329 13,348 14,940 — 43,617
Total Current Liabilities 188,600 32,457 87,749 (175,977) 132,829
Long-Term Liabilities: Long-Term Debt 32,714 — 21 — 32,735
Intercompany Loans — 128,000 2,000 (130,000) —
Employee-Related Benefits 14,291 3,704 3,139 — 21,134
Deferred Income Taxes — — 171 — 171
Other Liabilities 2,406 1,295 924 — 4,625
Total Long-Term Liabilities 49,411 132,999 6,255 (130,000) 58,665
Total Liabilities 238,011 165,456 94,004 (305,977) 191,494
Shareholders' Equity: Common Stock 6,633 — 11,131 (11,131) 6,633
Additional Paid-In Capital 3,653 72,483 158,592 (231,075) 3,653
Retained Earnings 318,180 9,771 (32,187) 22,416 318,180
Accumulated Other Comprehensive Loss (49,923) (1,215) (42,100) 43,315 (49,923)
Total Shareholders’ Equity 278,543 81,039 95,436 (176,475) 278,543
Total Liabilities and Shareholders’ Equity $ 516,554 $ 246,495 $ 189,440 $ (482,452) $ 470,037
63


Table of ContentsNOTES TO THE CONSOLIDATED FINANCIAL STATEMENTS
(In thousands, except shares and per share data)
Condensed Consolidated Statement of Cash FlowsFor the year ended December 31, 2017
(in thousands) Parent Guarantor
Subsidiaries Non-Guarantor
Subsidiaries Eliminations Total Tennant
Company
OPERATING ACTIVITIES Net Cash Provided by Operating Activities $ 26,992 $ 280 $ 27,711 $ (809) $ 54,174
INVESTING ACTIVITIES Purchases of Property, Plant and Equipment (9,558) — (10,879) — (20,437)
Proceeds from Disposals of Property, Plant and Equipment 23 1 2,487 — 2,511Proceeds from Principal Payments Received on Long-Term NoteReceivable — — 667 — 667
Issuance of Long-Term Note Receivable — — (1,500) — (1,500)
Acquisition of Businesses, Net of Cash Acquired (304) — (353,769) — (354,073)
Purchase of Intangible Asset (2,500) — — — (2,500)
Change in Investments in Subsidiaries (199,028) — — 199,028 —
Loan (Payments) Borrowings from Subsidiaries (159,780) — (4,983) 164,763 —
Increase in Restricted Cash — — (92) — (92)
Net Cash (Used in) Provided by Investing Activities (371,147) 1 (368,069) 363,791 (375,424)
FINANCING ACTIVITIES Proceeds from Short-Term Debt 303,000 — — — 303,000
Repayments of Short-Term Debt (303,000) — — — (303,000)
Loan Borrowings (Payments) from Parent 4,983 — 159,780 (164,763) —
Change in Subsidiary Equity — — 199,028 (199,028) —
Proceeds from Issuance of Long-Term Debt 440,000 — — — 440,000
Payments of Long-Term Debt (96,142) — (106) — (96,248)
Payments of Debt Issuance Costs (16,482) — — — (16,482)
Change in Capital Lease Obligations — — 311 — 311
Proceeds from Issuances of Common Stock 6,875 — — — 6,875
Purchase of Noncontrolling Owner Interest — — (30) — (30)
Dividends Paid (14,953) — (809) 809 (14,953)
Net Cash Provided by Financing Activities 324,281 — 358,174 (362,982) 319,473
Effect of Exchange Rate Changes on Cash and Cash Equivalents (141) — 2,283 — 2,142
NET (DECREASE) INCREASE IN CASH AND CASHEQUIVALENTS (20,015) 281 20,099 — 365
Cash and Cash Equivalents at Beginning of Year 38,484 226 19,323 — 58,033
CASH AND CASH EQUIVALENTS AT END OF YEAR $ 18,469 $ 507 $ 39,422 $ — $ 58,398
64

Table of ContentsNOTES TO THE CONSOLIDATED FINANCIAL STATEMENTS
(In thousands, except shares and per share data)
Condensed Consolidated Statement of Cash FlowsFor the year ended December 31, 2016
(in thousands) Parent Guarantor
Subsidiaries Non-Guarantor
Subsidiaries Eliminations Total Tennant
Company
OPERATING ACTIVITIES Net Cash Provided by Operating Activities $ 44,147 $ 239 $ 14,090 $ (598) $ 57,878
INVESTING ACTIVITIES Purchases of Property, Plant and Equipment (21,507) (13) (5,006) — (26,526)
Proceeds from Disposals of Property, Plant and Equipment 377 — 238 — 615
Acquisition of Businesses, Net of Cash Acquired — (11,539) (1,394) — (12,933)
Issuance of Long-Term Note Receivable — — (2,000) — (2,000)
Proceeds from Sale of Business — — 285 — 285
Change in Investments in Subsidiaries (19,594) — — 19,594 —
Loan Borrowings (Payments) from Subsidiaries 8,690 — — (8,690) —
Decrease in Restricted Cash — — 116 — 116
Net Cash Used in Investing Activities (32,034) (11,552) (7,761) 10,904 (40,443)
FINANCING ACTIVITIES Loan Borrowings (Payments) from Parent — 7,969 (16,659) 8,690 —
Change in Subsidiary Equity — 3,570 16,024 (19,594) —
Payments of Long-Term Debt (3,429) — (31) — (3,460)
Proceeds from Issuance of Long-Term Debt 15,000 — — — 15,000
Purchases of Common Stock (12,762) — — — (12,762)
Proceeds from Issuances of Common Stock 5,271 — — — 5,271
Excess Tax Benefit on Stock Plans 686 — — — 686
Dividends Paid (14,293) — (598) 598 (14,293)
Net Cash (Used in) Provided by Financing Activities (9,527) 11,539 (1,264) (10,306) (9,558)
Effect of Exchange Rate Changes on Cash and Cash Equivalents 64 — (1,208) — (1,144)
NET INCREASE IN CASH AND CASH EQUIVALENTS 2,650 226 3,857 — 6,733
Cash and Cash Equivalents at Beginning of Year 35,834 — 15,466 — 51,300
CASH AND CASH EQUIVALENTS AT END OF YEAR $ 38,484 $ 226 $ 19,323 $ — $ 58,033
65

Table of ContentsNOTES TO THE CONSOLIDATED FINANCIAL STATEMENTS
(In thousands, except shares and per share data)
Condensed Consolidated Statement of Cash FlowsFor the year ended December 31, 2015
(in thousands) Parent Guarantor
Subsidiaries Non-Guarantor
Subsidiaries Eliminations Total Tennant
Company
OPERATING ACTIVITIES Net Cash Provided by Operating Activities $ 40,764 $ — $ 4,928 $ (460) $ 45,232
INVESTING ACTIVITIES Purchases of Property, Plant and Equipment (19,149) — (5,631) — (24,780)
Proceeds from Disposals of Property, Plant and Equipment 32 — 304 — 336
Loan Borrowings (Payments) from Subsidiaries 268 — — (268) —
Proceeds from Sale of Business — — 1,185 — 1,185
Increase in Restricted Cash — — (322) — (322)
Net Cash Used in Investing Activities (18,849) — (4,464) (268) (23,581)
FINANCING ACTIVITIES Loan (Payments) Borrowings from Parent — — (268) 268 —
Payments of Long-Term Debt (3,435) — (10) — (3,445)
Purchases of Common Stock (45,998) — — — (45,998)
Proceeds from Issuances of Common Stock 1,677 — — — 1,677
Excess Tax Benefit on Stock Plans 859 — — — 859
Dividends Paid (14,498) — (460) 460 (14,498)
Net Cash Used in Financing Activities (61,395) — (738) 728 (61,405)
Effect of Exchange Rate Changes on Cash and Cash Equivalents 79 — (1,987) — (1,908)
NET DECREASE IN CASH AND CASH EQUIVALENTS (39,401) — (2,261) — (41,662)
Cash and Cash Equivalents at Beginning of Year 75,235 — 17,727 — 92,962
CASH AND CASH EQUIVALENTS AT END OF YEAR $ 35,834 $ — $ 15,466 $ — $ 51,300
23. Subsequent EventOn January 22, 2018, we commenced the exchange offer required by the Registration Rights Agreement referred to in Note 9. The exchange offer closed on February 23,
2018. We will not incur any additional indebtedness as a result of the exchange offer. As a result, we will not be required to pay additional interest on the Notes.
66

Table of Contents
ITEM 9 – Changes in and Disagreements with Accountants onAccounting and Financial Disclosure
None.
ITEM 9A – Controls and Procedures
Disclosure Controls and Procedures
Our management, including our Chief Executive Officer and Principal Financialand Accounting Officer, have conducted an evaluation of the effectiveness of thedesign and operation of our disclosure controls and procedures (as defined in Rule13a-15(e) under the Securities Exchange Act of 1934, as amended (the ExchangeAct)) as of December 31, 2017. Based on that evaluation, our Chief Executive Officerand Principal Financial and Accounting Officer concluded that, as of December 31,2017, our disclosure controls and procedures were effective.
For purposes of Rule 13a-15(e), the term disclosure controls and proceduresmeans controls and other procedures of an issuer that are designed to ensure thatinformation required to be disclosed by the issuer in the reports that it files or submitsunder the Exchange Act (15 U.S.C. 78a et seq.) is recorded, processed, summarizedand reported within the time periods specified in the SEC’s rules and forms.Disclosure controls and procedures include, without limitation, controls andprocedures designed to ensure that information required to be disclosed by an issuer inthe reports that it files or submits under the Exchange Act is accumulated andcommunicated to the issuer’s management, including its Chief Executive Officer andPrincipal Financial and Accounting Officer, or persons performing similar functions,as appropriate to allow timely decisions regarding required disclosure.
Management’s Report on Internal Control over Financial Reporting
Our management is responsible for establishing and maintaining adequateinternal control over financial reporting, as such term is defined in Rule 13a-15(f)under the Exchange Act.
The Company’s internal control over financial reporting is a process designed toprovide reasonable assurance regarding the reliability of financial reporting and thepreparation of financial statements for external purposes in accordance with generallyaccepted accounting principles. A company’s internal control over financial reportingincludes those policies and procedures that:
(i) Pertain to the maintenance of records that, in reasonable detail, accurately andfairly reflect the transactions and dispositions of the assets of the company;
(ii) Provide reasonable assurance that transactions are recorded as necessary topermit preparation of financial statements in accordance with generallyaccepted accounting principles, and that receipts and expenditures of thecompany are being made only in accordance with authorizations ofmanagement and directors of the company; and
(iii) Provide reasonable assurance regarding prevention or timely detection ofunauthorized acquisition, use or disposition of the company’s assets that couldhave a material effect on the financial statements.
Because of its inherent limitations, internal control over financial reporting maynot prevent or detect misstatements. Also, projections of any evaluation ofeffectiveness to future periods are subject to the risk that controls may becomeinadequate because of changes in conditions, or that the degree of compliance with thepolicies or procedures may deteriorate.
A material weakness is a deficiency, or combination of deficiencies, in internalcontrol over financial reporting such that there is a reasonable possibility that amaterial misstatement of the Company’s annual or interim financial statements willnot be prevented or detected on a timely basis.
Under the supervision of the Audit Committee of the Board of Directors and withthe participation of our management, including our Chief Executive Officer andPrincipal Financial and Accounting Officer, we conducted an evaluation of theeffectiveness of our internal control over financial reporting using the criteriaestablished in Internal Control - Integrated Framework (2013) issued by theCommittee of Sponsoring Organizations of the Treadway Commission (COSO).Based on our assessment and those criteria, our Chief Executive Officer and PrincipalFinancial and Accounting Officer concluded that our internal control over financialreporting was effective as of December 31, 2017.
Tennant Company acquired 100 percent of the outstanding capital stock of IPCleaning S.p.A. and its subsidiaries ("IPC Group") in April 2017, which wasaccounted for as a business combination, and management excluded from itsassessment of the effectiveness of Tennant Company's internal control over financialreporting as of December 31, 2017 the IPC Group's internal control over financialreporting associated with total assets of $509 million and total revenues of $174million included in the consolidated financial statements of Tennant Company andsubsidiaries as of and for the year ended December 31, 2017. This exclusion is inaccordance with the SEC's guidance, which permits companies to omit an acquiredbusiness's internal control over financial reporting from management's assessment forup to one year after the date of the acquisition.
KPMG, LLP, an independent registered public accounting firm, has audited theeffectiveness of the Company's internal control over financial reporting as ofDecember 31, 2017 and has issued a report which is included in Item 8 of this AnnualReport on Form 10-K.
Remediation of Material Weaknesses Disclosed in Fiscal Year 2016 AnnualReport on Form 10-K
As previously disclosed in Item 9A of Part II of our Annual Report on Form 10-K for fiscal year 2016, management determined that our internal control over financialreporting was not effective as of December 31, 2016 due to material weaknesses overcontrol activities with respect to effective general information technology controlsover the accounting for revenue related to equipment maintenance and repair service,management review controls over the accounting for certain inventory adjustments,incentive accruals and performance share awards and controls over the determinationof technological feasibility and the capitalization of software development costs.Furthermore, the Company did not have a sufficient number of trained resources withassigned responsibility and accountability over the design and operation of internalcontrols nor did the Company have an effective risk assessment process that identifiedand assessed necessary changes in significant accounting policies and practices thatwere responsible to changes in business operations and new product arrangements.
To remediate the material weaknesses in our internal control over financialreporting described in Item 9A of Part II of our Annual Report on Form 10-K forFiscal year 2016, we:
• Sponsored ongoing training related to the COSO 2013 Framework bestpractices for personnel that are accountable for internal control over financialreporting.
• Enhanced management review controls over the accounting for certaininventory adjustments, incentive accruals and performance share awards.
• Performed a complete review of our accounting for revenue related toequipment maintenance and repair service to ensure the adequacy of the designand implementation of automated and manual controls.
67

Table of Contents
• Designed and implemented controls over the determination of technologicalfeasibility and the capitalization of software development costs.
Management has determined that the remediation actions discussed above wereeffectively designed and demonstrated to be operating effectively for a sufficientperiod of time to enable us to conclude that the material weaknesses regarding internalcontrol activities have been remediated as of December 31, 2017.
Changes in Internal Control Over Financial Reporting
Other than the action described under Remediation of Material WeaknessesDisclosed in Fiscal Year 2016 Annual Report on Form 10-K , there were no otherchanges in the Company's internal control over financial reporting during the quarterended December 31, 2017 that have materially affected, or are reasonably likely tomaterially affect, the Company's internal control over financial reporting.
ITEM 9B – Other Information
None.
PART IIIITEM 10 – Directors, Executive Officers and CorporateGovernance
Information required under this item with respect to directors is contained in thesections entitled “Board of Directors Information” and “Section 16(a) BeneficialOwnership Reporting Compliance” as part of our 2018 Proxy Statement and isincorporated herein by reference. See also Item 1, Executive Officers of the Registrantin Part I hereof.
Business Ethics Guide
We have adopted the Tennant Company Business Ethics Guide, as amended bythe Board of Directors in December 2011, which applies to all of our employees,directors, consultants, agents and anyone else acting on our behalf. The BusinessEthics Guide includes particular provisions applicable to our senior financialmanagement, which includes our Chief Executive Officer, Chief Financial Officer,Controller and other employees performing similar functions. A copy of our BusinessEthics Guide is available on the Investor Relations website at investors.tennantco.com.We intend to post on our website any amendment to, or waiver from, a provision ofour Business Ethics Guide that applies to our Principal Executive Officer, PrincipalFinancial Officer, Principal Accounting Officer, Controller and other personsperforming similar functions promptly following the date of such amendment orwaiver. In addition, we have also posted copies of our Corporate GovernancePrinciples and the Charters for our Audit, Compensation, Governance and ExecutiveCommittees on our website.
ITEM 11 – Executive Compensation
Information required under this item is contained in the sections entitled“Director Compensation” and “Executive Compensation Information” as part of our2018 Proxy Statement and is incorporated herein by reference.
ITEM 12 – Security Ownership of Certain Beneficial Ownersand Management and Related Shareholder Matters
Information required under this item is contained in the section entitled “SecurityOwnership of Certain Beneficial Owners and Management” as part of our 2018 ProxyStatement and is incorporated herein by reference. The section entitled "EquityCompensation Plan Information" can be found within Item 5 of this form 10-K.
ITEM 13 – Certain Relationships and Related Transactions, andDirector Independence
Information required under this item is contained in the sections entitled“Director Independence” and “Related Person Transaction Approval Policy” as part ofour 2018 Proxy Statement and is incorporated herein by reference.
ITEM 14 – Principal Accountant Fees and Services
Information required under this item is contained in the section entitled “FeesPaid to Independent Registered Public Accounting Firm” as part of our 2018 ProxyStatement and is incorporated herein by reference.
68
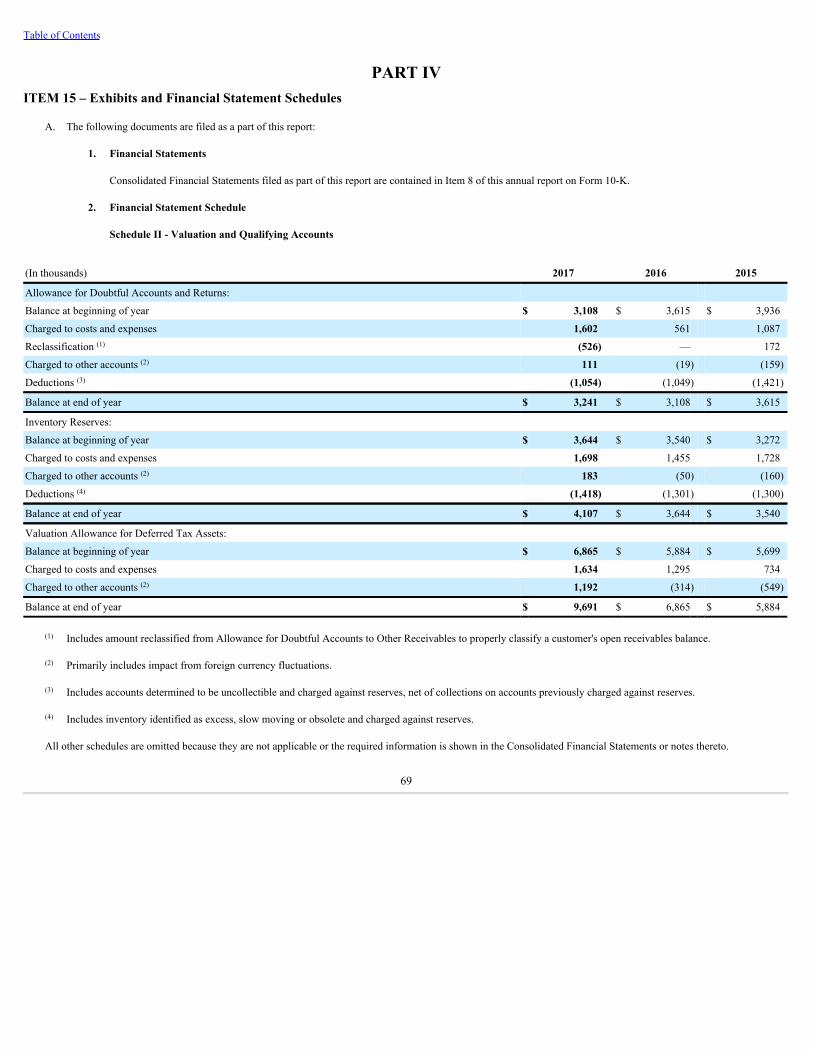
Table of Contents
PART IVITEM 15 – Exhibits and Financial Statement Schedules
A. The following documents are filed as a part of this report:
1. Financial Statements
Consolidated Financial Statements filed as part of this report are contained in Item 8 of this annual report on Form 10-K.
2. Financial Statement Schedule
Schedule II - Valuation and Qualifying Accounts
(In thousands) 2017 2016 2015
Allowance for Doubtful Accounts and Returns:
Balance at beginning of year $ 3,108 $ 3,615 $ 3,936
Charged to costs and expenses 1,602 561 1,087
Reclassification (1) (526) — 172
Charged to other accounts (2) 111 (19) (159)
Deductions (3) (1,054) (1,049) (1,421)
Balance at end of year $ 3,241 $ 3,108 $ 3,615
Inventory Reserves:
Balance at beginning of year $ 3,644 $ 3,540 $ 3,272
Charged to costs and expenses 1,698 1,455 1,728
Charged to other accounts (2) 183 (50) (160)
Deductions (4) (1,418) (1,301) (1,300)
Balance at end of year $ 4,107 $ 3,644 $ 3,540
Valuation Allowance for Deferred Tax Assets:
Balance at beginning of year $ 6,865 $ 5,884 $ 5,699
Charged to costs and expenses 1,634 1,295 734
Charged to other accounts (2) 1,192 (314) (549)
Balance at end of year $ 9,691 $ 6,865 $ 5,884
(1) Includes amount reclassified from Allowance for Doubtful Accounts to Other Receivables to properly classify a customer's open receivables balance.
(2) Primarily includes impact from foreign currency fluctuations.
(3) Includes accounts determined to be uncollectible and charged against reserves, net of collections on accounts previously charged against reserves.
(4) Includes inventory identified as excess, slow moving or obsolete and charged against reserves.
All other schedules are omitted because they are not applicable or the required information is shown in the Consolidated Financial Statements or notes thereto.
69

Table of Contents
3. Exhibits
Item # Description Method of Filing
2.1
Share Purchase Agreement dated as of February 22, 2017, among TennantCompany, Ambienta SGR S.p.A., Federico De Angelis, Pietro CorsanoAnnibaldi, Antonio Perosa and Giulio Vernazza
Incorporated by reference to Exhibit 2.1 to the Company's Current Reporton Form 8-K filed February 28, 2017.
3i Restated Articles of Incorporation Incorporated by reference to Exhibit 3i to the Company’s Form 10-Q forthe quarter ended June 30, 2006.
3ii Amended and Restated By-Laws Incorporated by reference to Exhibit 3iii to the Company’s Current Reporton Form 8-K dated December 14, 2010.
4.1
Indenture dated as of April 18, 2017
Incorporated by reference to Exhibit 4.1 to the Company's Current Reporton Form 8-K filed April 24, 2017.
4.2
Registration Rights Agreement dated April 18, 2017
Incorporated by reference to Exhibit 4.2 to the Company's Current Reporton Form 8-K filed April 24, 2017.
10.1 Tennant Company Executive Nonqualified Deferred Compensation Plan,as restated effective January 1, 2009, as amended*
Incorporated by reference to Exhibit 10.1 to the Company’s Form 10-Q forthe quarter ended September 30, 2012.
10.2 Form of Amended and Restated Management Agreement and ExecutiveEmployment Agreement*
Incorporated by reference to Exhibit 10.3 to the Company's Form 10-K forthe year ended December 31, 2011.
10.3 Schedule of parties to Management and Executive Employment Agreement
Filed herewith electronically.
10.4 Tennant Company Non-Employee Director Stock Option Plan (as amendedand restated effective May 6, 2004)*
Incorporated by reference to Exhibit 10.6 to the Company’s Form 10-Q forthe quarter ended June 30, 2004.
10.5 Tennant Company Amended and Restated 1999 Stock Incentive Plan*
Incorporated by reference to Appendix A to the Company’s ProxyStatement for the 2006 Annual Meeting of Shareholders filed on March 15,2006.
10.6 Tennant Company 2007 Stock Incentive Plan* Incorporated by reference to Appendix A to the Company’s ProxyStatement for the 2007 Annual Meeting of Shareholders filed on March 15,2007.
10.7
Deferred Stock Unit Agreement (awards in and after 2008)*
Incorporated by reference to Exhibit 10.17 to the Company's Form 10-Kfor the year ended December 31, 2007.
10.8 Tennant Company 2014 Short-Term Incentive Plan*
Incorporated by reference to Appendix B to the Company's ProxyStatement for the 2013 Annual Meeting of Shareholders filed on March 11,2013.
10.9 Amended and Restated 2010 Stock Incentive Plan, as Amended* Incorporated by reference to Appendix A to the Company's ProxyStatement for the 2013 Annual Meeting of Shareholders filed on March 11,2013.
10.10
Credit Agreement dated as of April 4, 2017
Incorporated by reference to Exhibit 10.1 to the Company's Current Reporton Form 8-K filed April 5, 2017.
10.11
2017 Stock Incentive Plan
Incorporated by reference to Appendix A on the Company's ProxyStatement for the 2017 Annual Meeting of Shareholders filed March 15,2017.
10.12
Form of Tennant Company 2017 Stock Incentive Plan Non-Statutory StockOption Agreement
Incorporated by reference to Exhibit 10.3 to the Company's Form 10-Q forthe quarter ended June 30, 2017.
10.13
Form of Tennant Company 2017 Stock Incentive Plan Restricted StockAgreement
Incorporated by reference to Exhibit 10.4 to the Company's Form 10-Q forthe quarter ended June 30, 2017.
10.14
Form of Tennant Company 2017 Stock Incentive Plan Non-EmployeeDirector Restricted Stock Agreement
Incorporated by reference to Exhibit 10.5 to the Company's Form 10-Q forthe quarter ended June 30, 2017.
10.15
Form of Tennant Company 2017 Stock Incentive Plan Restricted StockUnit Agreement
Incorporated by reference to Exhibit 10.6 to the Company's Form 10-Q forthe quarter ended June 30, 2017.
21 Subsidiaries of the Registrant Filed herewith electronically.23.1 Consent of KPMG, LLP Independent Registered Public Accounting Firm Filed herewith electronically.
24.1 Powers of Attorney Included on signature page.
31.1 Rule 13a-14(a)/15d-14(a) Certification of Chief Executive Officer Filed herewith electronically.
31.2 Rule 13a-14(a)/15d-14(a) Certification of Chief Financial Officer Filed herewith electronically.
70

Table of Contents
32.1 Section 1350 Certification of Chief Executive Officer Filed herewith electronically.32.2 Section 1350 Certification of Chief Financial Officer Filed herewith electronically.101 The following financial information from Tennant Company’s annual
report on Form 10-K for the period ended December 31, 2017, filed withthe SEC on February 27, 2018, formatted in Extensible Business ReportingLanguage (XBRL): (i) the Consolidated Statements of Operations for theyears ended December 31, 2017, 2016 and 2015, (ii) the ConsolidatedStatements of Comprehensive Income for the years ended December 31,2017, 2016 and 2015, (iii) the Consolidated Balance Sheets as ofDecember 31, 2017 and 2016, (iv) the Consolidated Statements of CashFlows for the years ended December 31, 2017, 2016 and 2015, (v) theConsolidated Statements of Equity for the years ended December 31, 2017,2016 and 2015, and (vi) Notes to the Consolidated Financial Statements.
Filed herewith electronically.
* Management contract or compensatory plan or arrangement required to be filed as an exhibit to this annual report on Form 10-K.
71

Table of Contents
ITEM 16 – Form 10-K SummaryNone.
72

Table of Contents
SIGNATURES
Pursuant to the requirements of Section 13 or 15(d) of the Securities Exchange Act of 1934, the Registrant has duly caused this report to be signed on its behalf by theundersigned, thereunto duly authorized.
TENNANT COMPANY By /s/ H. Chris Killingstad
H. Chris Killingstad
President, CEO and
Board of Directors Date February 27, 2018
Each of the undersigned hereby appoints H. Chris Killingstad and Jeffrey L. Cotter, and each of them (with full power to act alone), as attorneys and agents for theundersigned, with full power of substitution, for and in the name, place and stead of the undersigned, to sign and file with the Securities and Exchange Commission under theSecurities Act of 1934, any and all amendments and exhibits to this annual report on Form 10-K and any and all applications, instruments, and other documents to be filed withthe Securities and Exchange Commission pertaining to this annual report on Form 10-K or any amendments thereto, with full power and authority to do and perform any and allacts and things whatsoever requisite and necessary or desirable.
Pursuant to the requirements of Section 13 or 15(d) of the Securities Exchange Act of 1934, this report has been signed by the following persons on behalf of the Registrantand in the capacities and on the dates indicated.
By /s/ H. Chris Killingstad By /s/ Donal L. Mulligan
H. Chris Killingstad Donal L. Mulligan
President, CEO and Board of Directors
Board of Directors Date February 27, 2018Date February 27, 2018
By /s/ Thomas Paulson By /s/ Steven A. Sonnenberg
Thomas Paulson Steven A. Sonnenberg
Senior Vice President and Chief Financial Officer Board of Directors
(Principal Financial and Accounting Officer) Date February 27, 2018Date February 27, 2018
By /s/ Azita Arvani By /s/ David S. Wichmann
Azita Arvani David S. Wichmann
Board of Directors Board of DirectorsDate February 27, 2018 Date February 27, 2018
By /s/ William F. Austen By /s/ David Windley
William F. Austen David Windley
Board of Directors Board of Directors
Date February 27, 2018 Date February 27, 2018
By /s/ Carol S. Eicher Carol S. Eicher Board of Directors Date February 27, 2018
73
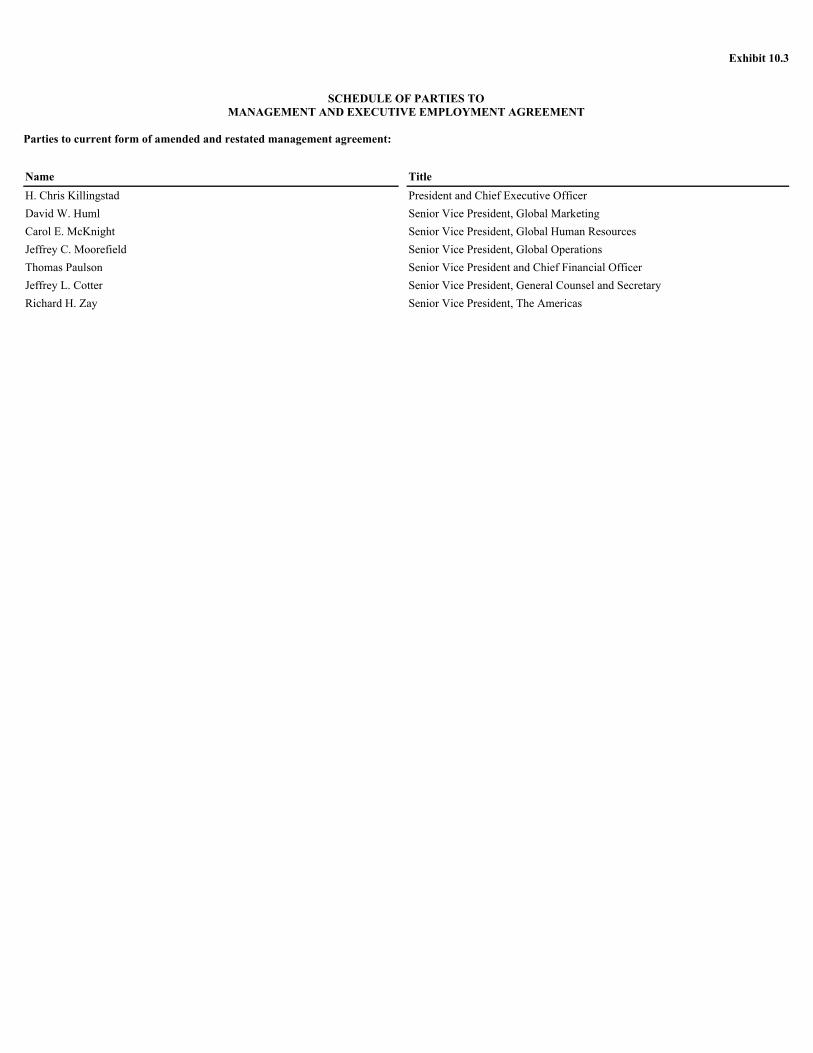
Exhibit 10.3
SCHEDULE OF PARTIES TOMANAGEMENT AND EXECUTIVE EMPLOYMENT AGREEMENT
Parties to current form of amended and restated management agreement:
Name TitleH. Chris Killingstad President and Chief Executive OfficerDavid W. Huml Senior Vice President, Global MarketingCarol E. McKnight Senior Vice President, Global Human ResourcesJeffrey C. Moorefield Senior Vice President, Global OperationsThomas Paulson Senior Vice President and Chief Financial OfficerJeffrey L. Cotter Senior Vice President, General Counsel and SecretaryRichard H. Zay Senior Vice President, The Americas
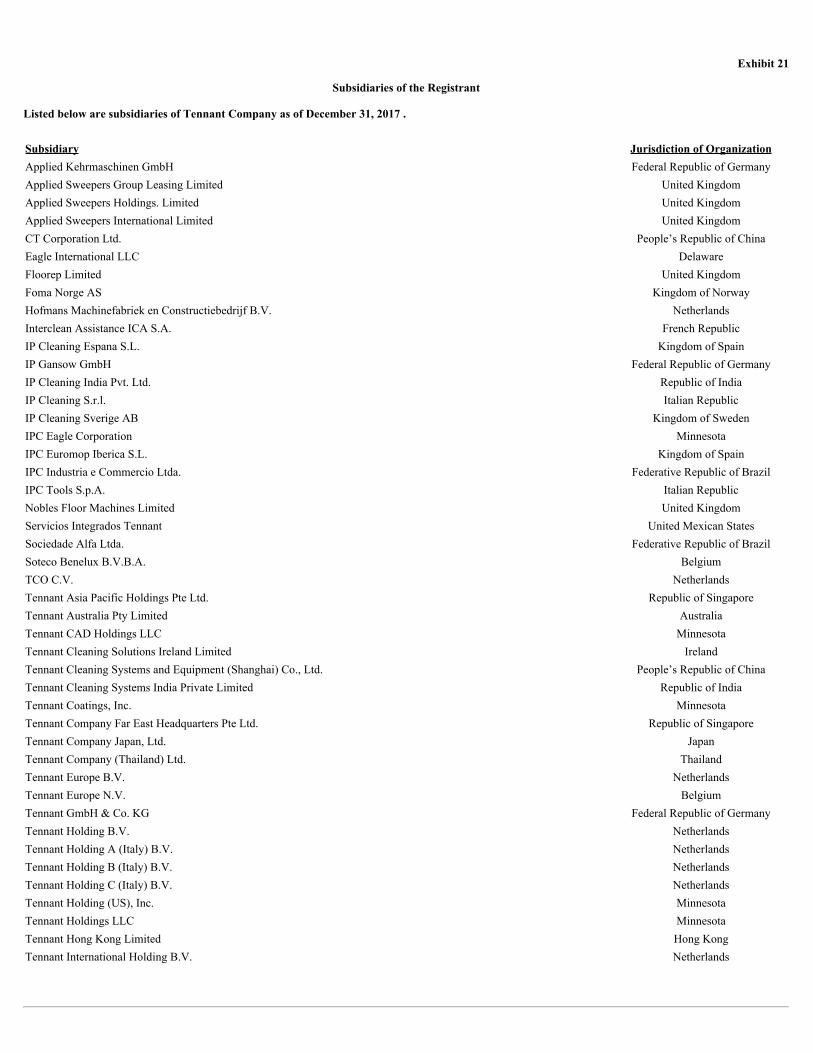
Exhibit 21
Subsidiaries of the Registrant
Listed below are subsidiaries of Tennant Company as of December 31, 2017 .
Subsidiary Jurisdiction of OrganizationApplied Kehrmaschinen GmbH Federal Republic of GermanyApplied Sweepers Group Leasing Limited United KingdomApplied Sweepers Holdings. Limited United KingdomApplied Sweepers International Limited United KingdomCT Corporation Ltd. People’s Republic of ChinaEagle International LLC DelawareFloorep Limited United KingdomFoma Norge AS Kingdom of NorwayHofmans Machinefabriek en Constructiebedrijf B.V. NetherlandsInterclean Assistance ICA S.A. French RepublicIP Cleaning Espana S.L. Kingdom of SpainIP Gansow GmbH Federal Republic of GermanyIP Cleaning India Pvt. Ltd. Republic of IndiaIP Cleaning S.r.l. Italian RepublicIP Cleaning Sverige AB Kingdom of SwedenIPC Eagle Corporation MinnesotaIPC Euromop Iberica S.L. Kingdom of SpainIPC Industria e Commercio Ltda. Federative Republic of BrazilIPC Tools S.p.A. Italian RepublicNobles Floor Machines Limited United KingdomServicios Integrados Tennant United Mexican StatesSociedade Alfa Ltda. Federative Republic of BrazilSoteco Benelux B.V.B.A. BelgiumTCO C.V. NetherlandsTennant Asia Pacific Holdings Pte Ltd. Republic of SingaporeTennant Australia Pty Limited AustraliaTennant CAD Holdings LLC MinnesotaTennant Cleaning Solutions Ireland Limited IrelandTennant Cleaning Systems and Equipment (Shanghai) Co., Ltd. People’s Republic of ChinaTennant Cleaning Systems India Private Limited Republic of IndiaTennant Coatings, Inc. MinnesotaTennant Company Far East Headquarters Pte Ltd. Republic of SingaporeTennant Company Japan, Ltd. JapanTennant Company (Thailand) Ltd. ThailandTennant Europe B.V. NetherlandsTennant Europe N.V. BelgiumTennant GmbH & Co. KG Federal Republic of GermanyTennant Holding B.V. NetherlandsTennant Holding A (Italy) B.V. NetherlandsTennant Holding B (Italy) B.V. NetherlandsTennant Holding C (Italy) B.V. NetherlandsTennant Holding (US), Inc. MinnesotaTennant Holdings LLC MinnesotaTennant Hong Kong Limited Hong KongTennant International Holding B.V. Netherlands

Tennant International Holding LLC MinnesotaTennant NL B.V. NetherlandsTennant N.V. NetherlandsTennant Netherland Holding B.V. NetherlandsTennant New Zealand Ltd. New ZealandTennant Portugal E. de L., S.U., L. da Portuguese RepublicTennant S.A. French RepublicTennant SA Holdings LLC MinnesotaTennant Sales & Service Canada ULC British Columbia, CanadaTennant Sales and Service Company MinnesotaTennant Sales and Service Spain, S.A. Kingdom of SpainTennant Scotland Limited United KingdomTennant Sverige AB Kingdom of SwedenTennant UK Cleaning Solutions Ltd. United KingdomTennant UK Limited United KingdomTennant Ventas & Servicios de Mexico United Mexican StatesTennant Verwaltungs-gesellschaft GmbH Federal Republic of GermanyTNC C.V. NetherlandsVaclensa Ltd. United KingdomWalter-Broadley Limited United KingdomWalter-Broadley Machines Limited United KingdomWater Star, Inc. Ohio
Joint Ventures
I-Team North America B.V. Netherlands
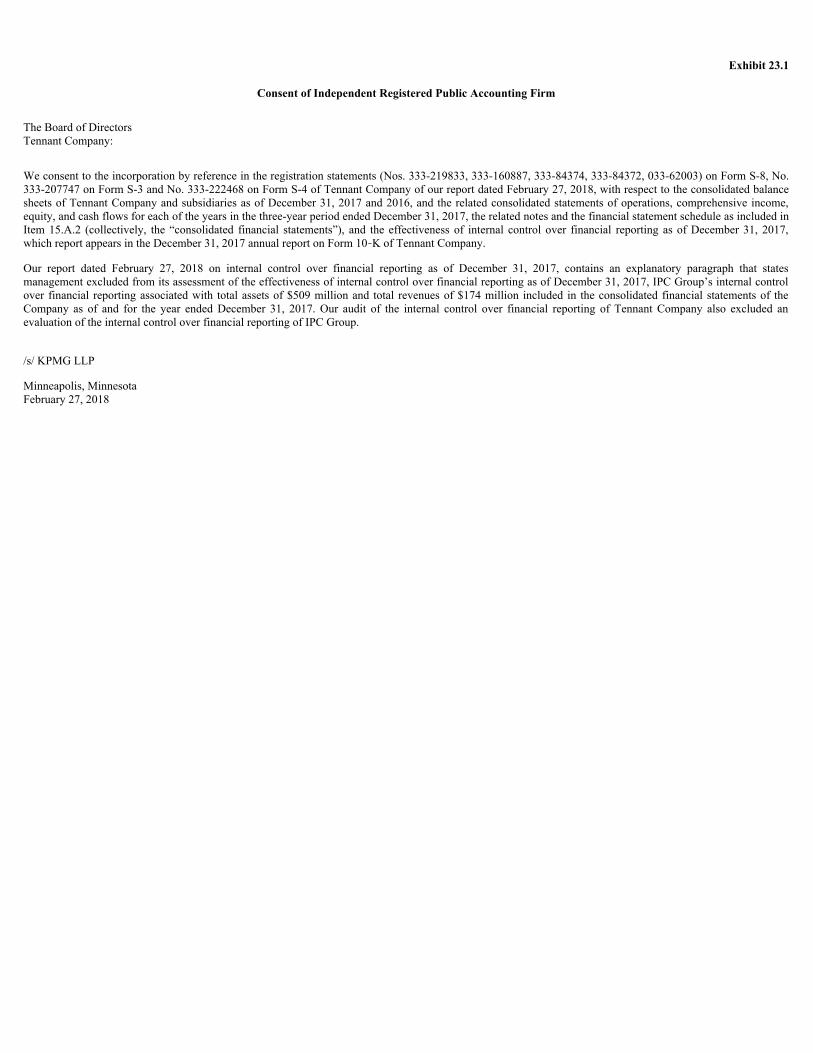
Exhibit 23.1
Consent of Independent Registered Public Accounting Firm
The Board of DirectorsTennant Company:
We consent to the incorporation by reference in the registration statements (Nos. 333-219833, 333-160887, 333-84374, 333-84372, 033-62003) on Form S-8, No.333-207747 on Form S-3 and No. 333-222468 on Form S-4 of Tennant Company of our report dated February 27, 2018, with respect to the consolidated balancesheets of Tennant Company and subsidiaries as of December 31, 2017 and 2016, and the related consolidated statements of operations, comprehensive income,equity, and cash flows for each of the years in the three-year period ended December 31, 2017, the related notes and the financial statement schedule as included inItem 15.A.2 (collectively, the “consolidated financial statements”), and the effectiveness of internal control over financial reporting as of December 31, 2017,which report appears in the December 31, 2017 annual report on Form 10‑K of Tennant Company.
Our report dated February 27, 2018 on internal control over financial reporting as of December 31, 2017, contains an explanatory paragraph that statesmanagement excluded from its assessment of the effectiveness of internal control over financial reporting as of December 31, 2017, IPC Group’s internal controlover financial reporting associated with total assets of $509 million and total revenues of $174 million included in the consolidated financial statements of theCompany as of and for the year ended December 31, 2017. Our audit of the internal control over financial reporting of Tennant Company also excluded anevaluation of the internal control over financial reporting of IPC Group.
/s/ KPMG LLP
Minneapolis, MinnesotaFebruary 27, 2018

Exhibit 31.1CERTIFICATIONS
I, H. Chris Killingstad, certify that:
1. I have reviewed this annual report on Form 10-K of Tennant Company;
2. Based on my knowledge, this report does not contain any untrue statement of a material fact or omit to state a material fact necessary to make thestatements made, in light of the circumstances under which such statements were made, not misleading with respect to the period covered by this report;
3. Based on my knowledge, the financial statements, and other financial information included in this report, fairly present in all material respects thefinancial condition, results of operations and cash flows of the registrant as of, and for, the periods presented in this report;
4. The registrant’s other certifying officers and I are responsible for establishing and maintaining disclosure controls and procedures (as defined in ExchangeAct Rules 13a-15(e) and 15d-15(e)) and internal control over financial reporting (as defined in Exchange Act Rules 13a-15(f) and 15d-15(f)) for theregistrant and have:
a) Designed such disclosure controls and procedures, or caused such disclosure controls and procedures to be designed under our supervision, toensure that material information relating to the registrant, including its consolidated subsidiaries, is made known to us by others within thoseentities, particularly during the period in which this report is being prepared;
b) Designed such internal control over financial reporting, or caused such internal control over financial reporting to be designed under oursupervision, to provide reasonable assurance regarding the reliability of financial reporting and the preparation of financial statements forexternal purposes in accordance with generally accepted accounting principles;
c) Evaluated the effectiveness of the registrant’s disclosure controls and procedures and presented in this report our conclusions about theeffectiveness of the disclosure controls and procedures, as of the end of the period covered by this report based on such evaluation; and
d) Disclosed in this report any change in the registrant’s internal control over financial reporting that occurred during the registrant’s most recentfiscal quarter (the registrant’s fourth fiscal quarter in the case of an annual report) that has materially affected, or is reasonably likely tomaterially affect, the registrant’s internal control over financial reporting; and
5. The registrant’s other certifying officers and I have disclosed, based on our most recent evaluation of internal control over financial reporting, to theregistrant’s auditors and the audit committee of the registrant’s board of directors (or persons performing the equivalent functions):
a) All significant deficiencies and material weaknesses in the design or operation of internal control over financial reporting which are reasonablylikely to adversely affect the registrant’s ability to record, process, summarize and report financial information; and
b) Any fraud, whether or not material, that involves management or other employees who have a significant role in the registrant’s internal controlover financial reporting.
Date: February 27, 2018 /s/ H. Chris Killingstad
H. Chris Killingstad
President and Chief Executive Officer
Exhibit 31.2CERTIFICATIONS
I, Thomas Paulson, certify that:
1. I have reviewed this annual report on Form 10-K of Tennant Company;
2. Based on my knowledge, this report does not contain any untrue statement of a material fact or omit to state a material fact necessary to make thestatements made, in light of the circumstances under which such statements were made, not misleading with respect to the period covered by this report;
3. Based on my knowledge, the financial statements, and other financial information included in this report, fairly present in all material respects thefinancial condition, results of operations and cash flows of the registrant as of, and for, the periods presented in this report;
4. The registrant’s other certifying officers and I are responsible for establishing and maintaining disclosure controls and procedures (as defined in ExchangeAct Rules 13a-15(e) and 15d-15(e)) and internal control over financial reporting (as defined in Exchange Act Rules 13a-15(f) and 15d-15(f)) for theregistrant and have:
a) Designed such disclosure controls and procedures, or caused such disclosure controls and procedures to be designed under our supervision, toensure that material information relating to the registrant, including its consolidated subsidiaries, is made known to us by others within thoseentities, particularly during the period in which this report is being prepared;
b) Designed such internal control over financial reporting, or caused such internal control over financial reporting to be designed under oursupervision, to provide reasonable assurance regarding the reliability of financial reporting and the preparation of financial statements forexternal purposes in accordance with generally accepted accounting principles;
c) Evaluated the effectiveness of the registrant’s disclosure controls and procedures and presented in this report our conclusions about theeffectiveness of the disclosure controls and procedures, as of the end of the period covered by this report based on such evaluation; and
d) Disclosed in this report any change in the registrant’s internal control over financial reporting that occurred during the registrant’s most recentfiscal quarter (the registrant’s fourth fiscal quarter in the case of an annual report) that has materially affected, or is reasonably likely tomaterially affect, the registrant’s internal control over financial reporting; and
5. The registrant’s other certifying officers and I have disclosed, based on our most recent evaluation of internal control over financial reporting, to theregistrant’s auditors and the audit committee of the registrant’s board of directors (or persons performing the equivalent functions):
a) All significant deficiencies and material weaknesses in the design or operation of internal control over financial reporting which are reasonablylikely to adversely affect the registrant’s ability to record, process, summarize and report financial information; and
b) Any fraud, whether or not material, that involves management or other employees who have a significant role in the registrant’s internal controlover financial reporting.
Date: February 27, 2018 /s/ Thomas Paulson
Thomas PaulsonSenior Vice President and Chief Financial Officer(Principal Financial and Accounting Officer)
Exhibit 32.1
CERTIFICATION OF CHIEF EXECUTIVE OFFICER
PURSUANT TO SECTION 906 OF THE SARBANES-OXLEY ACT OF 2002 In connection with the annual report of Tennant Company (the “Company”) on Form 10-K for the period ended December 31, 2017 as filed with the Securitiesand Exchange Commission on the date hereof (the “Report”), I, H. Chris Killingstad, President and Chief Executive Officer, certify, pursuant to 18 U.S.C. Section1350, as adopted pursuant to section 906 of the Sarbanes-Oxley Act of 2002, that:
(1) The Report fully complies with the requirements of Section 13(a) or 15(d) of the Securities Exchange Act of 1934; and(2) The information contained in this periodic report fairly presents, in all material respects, the financial condition and results of operations of the
Company.
Date: February 27, 2018 /s/ H. Chris Killingstad H. Chris Killingstad President and Chief Executive Officer

Exhibit 32.2
CERTIFICATION OF CHIEF FINANCIAL OFFICER
PURSUANT TO SECTION 906 OF THE SARBANES-OXLEY ACT OF 2002 In connection with the annual report of Tennant Company (the “Company”) on Form 10-K for the period ended December 31, 2017 as filed with the Securitiesand Exchange Commission on the date hereof (the “Report”), I, Thomas Paulson, Senior Vice President and Chief Financial Officer, certify, pursuant to 18 U.S.C.Section 1350, as adopted pursuant to section 906 of the Sarbanes-Oxley Act of 2002, that:
(1) The Report fully complies with the requirements of Section 13(a) or 15(d) of the Securities Exchange Act of 1934; and(2) The information contained in this periodic report fairly presents, in all material respects, the financial condition and results of operations of the
Company.
Date: February 27, 2018 /s/ Thomas Paulson Thomas Paulson Senior Vice President and Chief Financial Officer