Embed Size (px)
Citation preview
TENNESSEE DEPARTMENT OF HEALTH AND ENVIRONMENT Bureau of Environment T.E.R.R.A. BUILDING
150 NINTH AVENUE NORTH NASHVl LLE, TENNESSEE 3721 9-5404
Mr. Richard G. Rhoades, D i rec to r Monitoring and D a t a Analysis Division
Research Triangle Park , N C 27711EPA - OAQPS
Dear Mr. Rhoades:
Thank you fo r your l e t t e r of Apri l 8, 1985 soliciting c o m m e n t s on t h e proposed revision of AP-42 Sect ion 8.10-Concrete Batching. Although my expe r t i s e is l imited in eva lua t ing t h e technica l changes which a r e proposed in th i s document , I will add res s t h e f a c t o r s fo r c e m e n t unloading to e l eva ted silos by pneumat ic t ransfer . In 1984 t h e emissions f rom a c e m e n t s to rage silo equipped wi th w e t suppression in Gallaway, Tennessee was t e s t ed by th is division. This is t h e only pa r t i cu l a t e test on c o n c r e t e ba tching opera t ions per formed by t h e division. I a m enclosing a copy of th is test for your information and evaluation. Unfortunately, t h i s is t h e only c o m m e n t I c a n o f f e r a t this t ime. If I c a n b e of f u r t h e r ass i s tance please ca l l m e a t 6 15-74 1-3651.
Sincerely , e
Hea the r M. Whitlow Air Resources Program Tennessee Air Pollut ion Contro l Division
HMW/sh
Enclosure
STATE OF TENNESSEE
DEPARTMENT OF HEALTH AND ENVIRONMENT Division of Air Pollution Control
SOURCE SAMPLING REPORT
Speciality Alloys Corporation 210 Overton S t r e e t
T.0. Box 56 Gallaway, Tennessee 38036
Reference Number 24-0005 1-02
Par t icula te Emissions from
Cement Silo Loading
Tested June 12, 1984
Process Observation g:i P z e , 7 w Submitted By: Eric Flowers
Engineering Program
Report Submitted by:
Report Forwarded by: John W. Walton, P.E. Deputy Director
Table of C o n t e n t s
I. INTRODUCTION AND O B J E C T I V E
11. SUMMARY OF RESULTS
111. DATA SUMMATION
I V . PROCESS D E S C R I P T I O N AND DIAGRAM
V. D I S C U S S I O N O F SAMPLING PROCEDURES AND RESULTS, SAMPLING TRAIN COMPONENTS, AND ANALYTICAL TECHNIQUES
V I . PRESENTATION OF F I E L D DATA AND CALCULATIONS O F RESULTS
V I I . PERSONNEL DATA
V I I I . PSY CIIROblETRI C ff IART
I X . CALCULATION OF PARTICULATE CATCH, LABORATORY DATA S H E E T S , AND CHAIN O F CUSTODY DOCUMENTATION
X. V I S I B L E E M I S S I O N S EVALUATION DATA
X I . CALIBRATION DATA
Page
1
2
3
4- 8
9-15
16-2 5
2 6
2 7
28-34
35-40
41-45
c
INTRODUCTION A N D OBJECTIVE
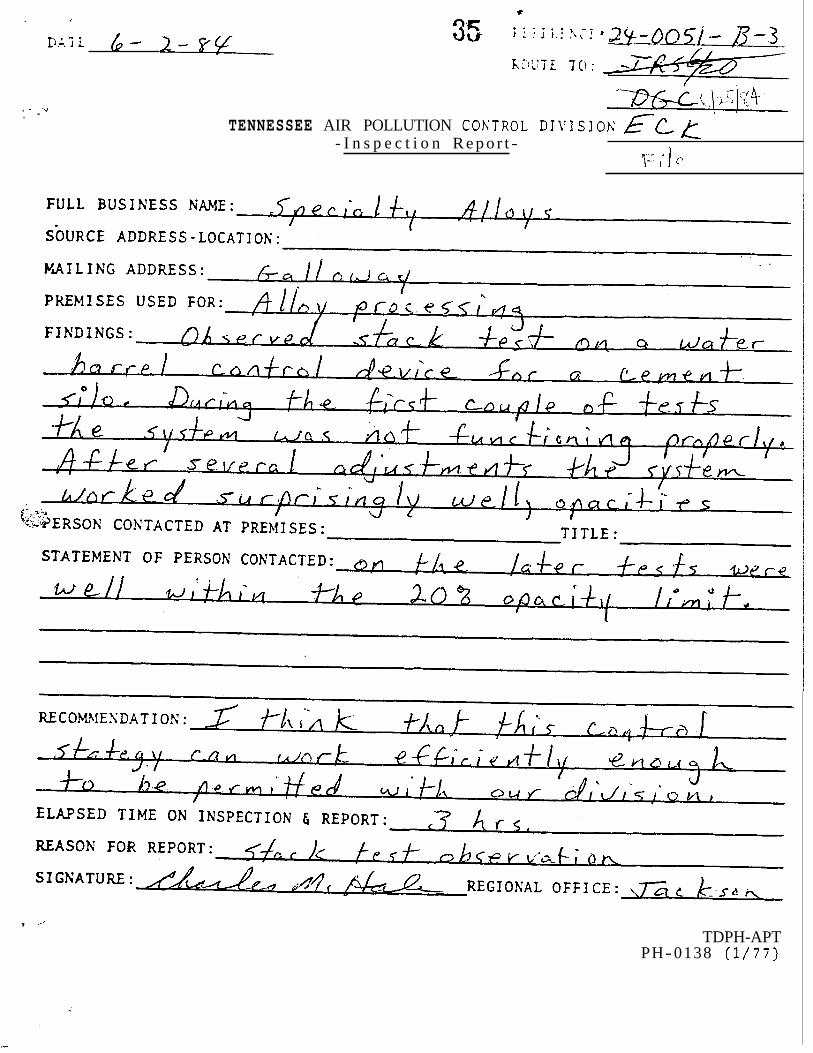
Source sampling was conducted at Speciality Alloys Corporation, Gallaway,
Tennessee, by the Compliance Monitoring Section of t h e Tennessee Division of Air
Pollution Control on June 12, 1984 to determine the part iculate emissions from the
loading of the cement silo (Process Emission Source 02). The sampling of the
unloading of t w o bulk cement trucks into the silo was conducted on June 12, 1984.
4
c
2
SUMMARY OF RESULTS
The par t icula te emissions from the loading of the cement silo (PES 02) located at Speciality Alloys Corporation a r e regulated by Rule 1200-3-7-.03 of t h e Tennessee Air Pollution Control Regulations. Since this process emission source began operation a f t e r April 3, 1972 it is considered to b e a new source by t h e Tennessee Regulations. The allowable part iculate emission rate for this source is determined based on t h e process weight of t h e material through the source. However, by Rule 1200-3-7-.04 of the Regulations the maximum allowable concentration of par t icula te mat te r in the exhaust gas s t ream of any process emission source shall b e 0.25 grains per dry standard cubic foot of stack gas irrespective of t h e maximum emission r a t e determined by any other method. For this source the grain loading standard is the over riding mass emission standard.
The visible emissions from the cement silo a r e regulated by Rule 1200-3-5-.01 of t h e Regulations. The visible emission limitation for this source is twenty (20) percent opacity utilizing a one minute t ime count method of d a t a reduction.
On June 12, 1984 this cement silo was tes ted for part iculate emissions during the unloading of two bulk cement trucks. Separate source tests were conducted on t h e unloading of each truck. During the first source test the top of t h e wet suppression system ("rain barrel") was covered with a single layer of burlap. The unloading of the f irst truck was conducted at a r a t e t h a t was below the normal unloading rate. This was done in an e f fo r t t o determine if this lower unloading might reduce the emissions from this source. During the unloading of the f i rs t truck it was noted t h a t t h e reduced unloading caused a very e r ra t i c pulsing from the top of the wet suppression system and the expulsion of a considerable amount of water mist from the top of t h e "rain barrel". During the testing period on the unloading of t h e f i rs t truck the average part iculate concentration measured from this source was determined t o be 0.0723 grains per dry standard cubic foot of s tack gas. Therefore, this source was in compliance with the applicable mass emission limitation during the test ing period. Visible emissions evaluation conducted during t h e source testing of the unloading of t h e f irst truck indicated tha t the process emission source was in compliance with the applicable visible emission limitation during this t ime period.
Prior to the unloading of the second truck a second layer of burlap was added t o the cover of t h e "rain barrel". The unloading of t h e second truck was conducted a t t h e normal unloading r a t e which is higher than the unloading r a t e of t h e f i rs t truck. During the unloading of the second truck it was noted tha t the higher unloading r a t e greatly reduced t h e pulsations noted from the top of the "rain barrel" during the unloading of the f irst truck and greatly reduced the expulsion of water mist from the top of t h e "rain barrel". During the testing period on the unloading of t h e second truck t h e average part iculate concentration measured from this source was determined to be 0.0254 grains per dry standard cubic foot of exhaust gas. Therefore, this source was in compliance with the applicable mass emission limitation during this testing period. Visible emissions evaluations conducted during the source testing of the unloading of the second truck indicated tha t the process emission source was again in compliance with the applicable visible emission limitation during this t ime period.
I
c
DATA SUMMATION
Speciality Alloys - Gallaway - June 12, 1984
Truck 1
Run J‘c 1 2 3 Ave
Particulate Concen- tration (gr/DSCF)
0.0876 0.0575 0.0717 0.0723
Particulate Emissions 0.13 0.08 0.11 0.11 (lb./hr.)
Truck 2
Run J‘c 1 2 Ave
Particulate Concen- 0.0270 tration (gr/DSCF)
0.0237 0.0254
Particulate Emissions 0.04 (lb./hr.)
0.03 0.04
Purpose of the test
I
i
, ,
The purpose of the source test was t o test the effectiveness of a wet suppression system in controlling part iculate emissions during truck loading of cement to a s torage silo. The wet suppression system consisted of a water hose applied to a burlap cover clamped t o the top of a water filled barrel. Cement is loaded penumatically by a truck compressor through a flexible hose line to a silo. The wet suppression control system is required t o satisfy t h e .25 gr/dscf standard specified in 1200-3-7-.04-(2) of Tennessee Air Pollution Control Regulations. Condition la. of construction permit 993234P st ipulates tha t the source m e e t this level of control. Additionally, Condition 3 of the permit requires tha t the source m e e t the visible emission l imits of Chapter 5 and fugit ive dust limits of Chapter 8, essentially t h e 20% opacity standard. This source is the f i r s t cement silo wet suppression control system t o b e source tested fo r part iculates by t h e Division.
Division and company personnel involved
Je ry l Stewart , Car l Koontz, and Elizabeth Coder were responsible for source test measurements. Er ic Flowers observed process operations and recorded process data. Mike Hale made visible emission readings. Mr. Don Vickrey t h e plant owner and partner with Gray McKee, Kelly Vickrey, secretary- treasurer, and Randy Hicks, plant superintendent were present during t h e silo loading test measurements and in charge of the operation.
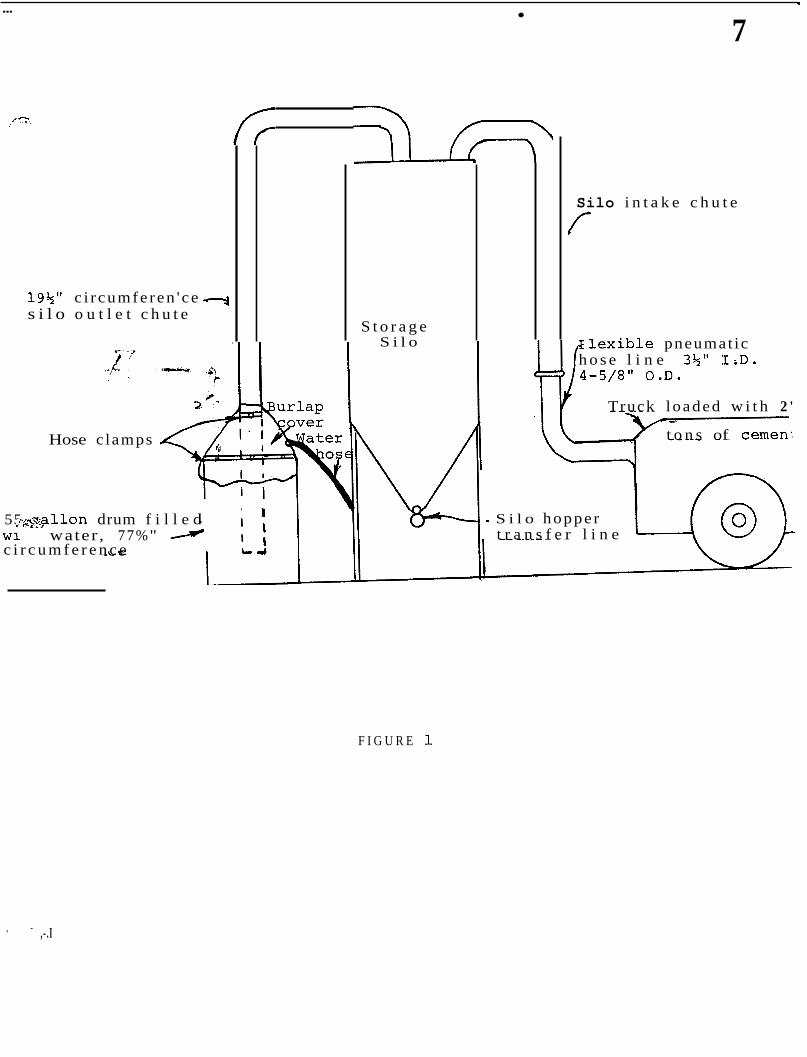
Process description and control system
A schemat ic of the silo and water barrel control system for loading is shown in Figure 1. Essentially, a truck with a Portland cement load of nominal weight of 26 tons is loaded pneumatically driven by a truck compressor through a 4 3/4 inch diameter hose into a silo intake chute. The truck operator normally unloads the cement at a maximum pressure between 14 and 16 psig to fill t h e silo at a minimum loading time. The truck loading t ime is usually between 20 and 40 minutes. Air is displaced through a 6 inch diameter silo outlet chute which feeds t o the interior of a 55 gallon drum filled with water and capped by burlap mater ia l clamped t o the barrel rim and silo outlet chute. During loading, a surge of a i r pressure expands the burlap bag and the displaced a i r exits through the burlap weave pat tern openings. The silo is designed to hold between 2% to 3 t ruck loads according t o plant officials.
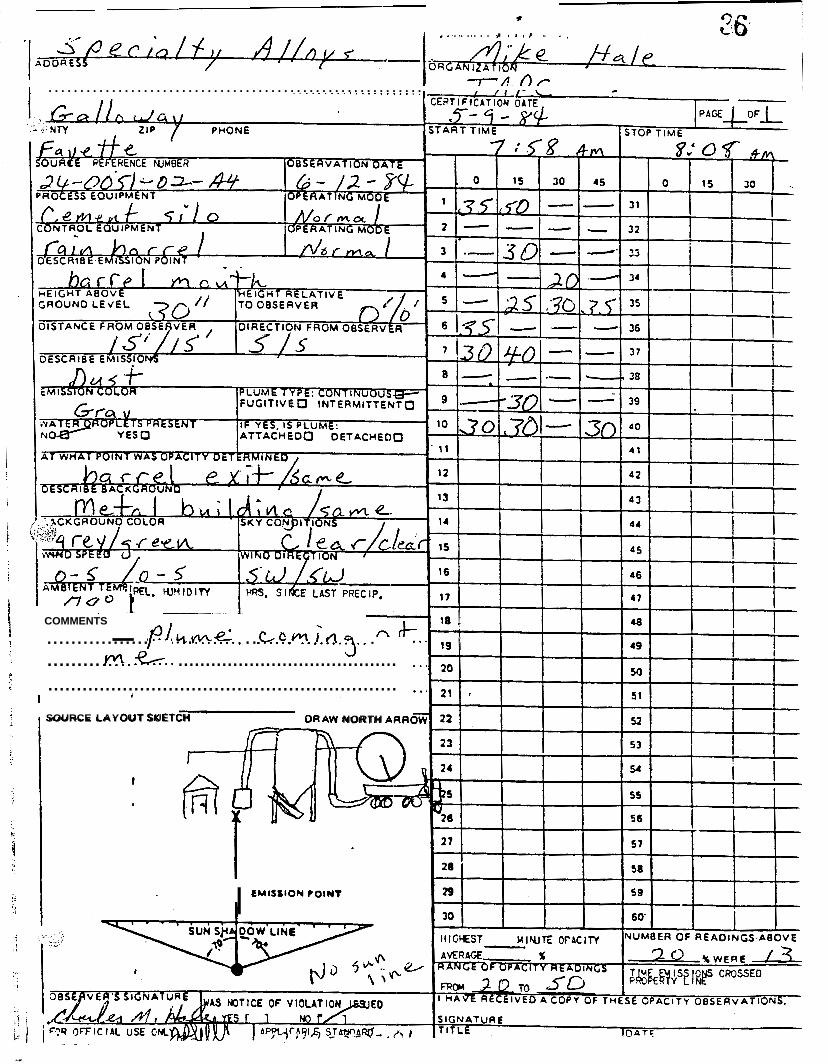
Process observation
Two separate test loading conditions were conducted. The f i r s t test was done while a truck load of 26.48 tons was filled at a nominal pressure of 8 psig. One burlap bag was clamped over the barrel top. Initially, a water hose was used t o fill the barrel and then water flow was cut off. Af te r a f e w minutes of operation it ,
was apparent tha t is was necessary t o maintain a continuous s t ream of water on the bag due t o t h e level of emissions and due to the fact tha t too much water was displaced out t h e barrel. Since the pressure was not at full (normal) loading pressure and only one bag was used, a puffing or breathing e f f e c t allowed a steady flow of sa tura ted cement dust t o the emit ted from the burlap cover. Although the pressure c rea ted a fairly t ight seal at the bag, t h e combined effects of lower pressure and one burlap cover did not prove t o be an acceptable combination in maintaining visible emissions within a complying range during t h e f i r s t loading condition. Visible emission levels averaging approximately 30% and ranging f rom 5 t o 80% were recorded by Mike Hale during t h e f i rs t truck load.
The following process da ta was recorded during t h e f i r s t truck load.
5
TABLE 1
T i m e (A.M.) -
7:50
7 3 6
7:58
8:OO 8:06 8:08
8:13:42 8:15 8:20 8:24
8:29 8:3 1 8:34 8:38 8:39 8:4 1
fi, t-?.. p- ‘ I f
Truck loading pressure ( p i g )
7.0
9.0
C o m m e n t s
A n e m o m e t e r f low r a t e of 60 f p m was recorded 2 f e e t f r o m t h e bur lap cover .
R a d e r sampl ing equipment was brought i n to test position.
S t a r t e d Run 1 ( e a c h run lasts 10 minu tes ) .
7.8 7.0
6.0 7.3 8 . 5 8.0
9.0 8.0 8.2 5.0 6.5
End Run 1
S t a r t Run 2
End Run 2
Start Run 3
End Run 3 Truck loading ended
Silo loading was stopped be tween test runs to conserve sampling time. Water was continuously applied by hose to t h e ba r r e l during loading. T h e approx ima te total loading t i m e was 41 minutes fo r t h e first t ruck load.
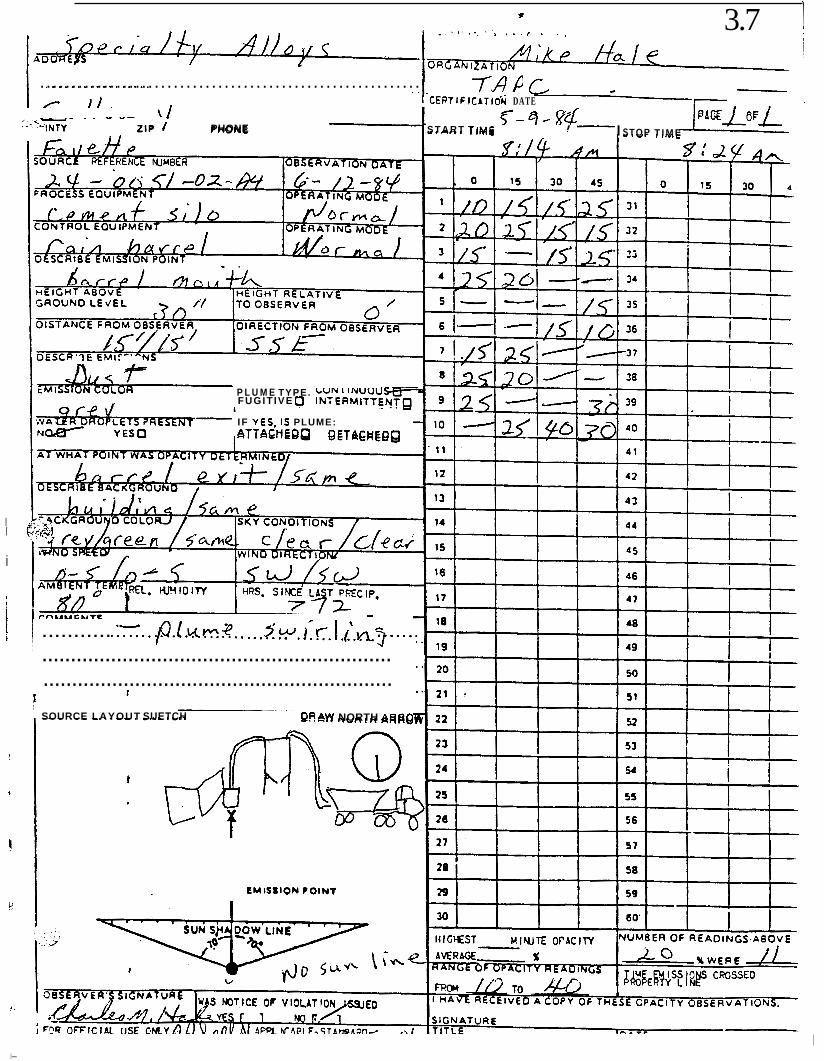
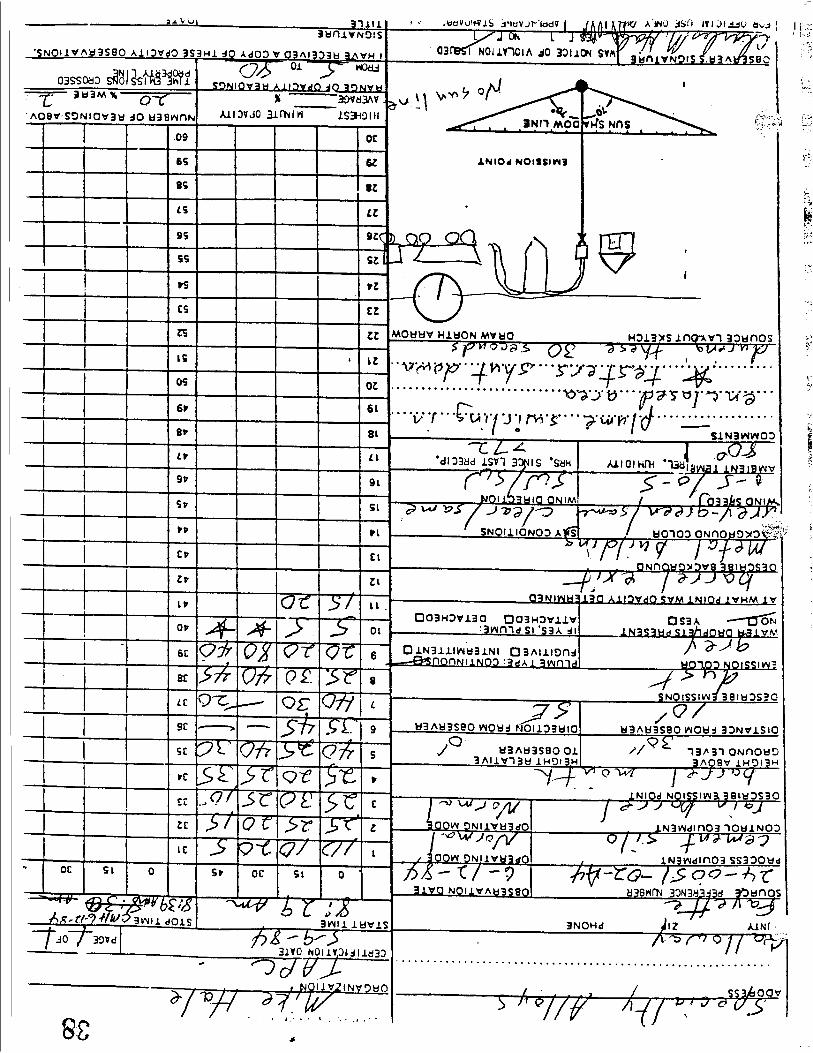
T h e second t ruck load of c e m e n t weighed 26.52 tons. During th is test ful l loading pressure was applied, above 13 psig. Because of excess ive visible emissions on t h e f i r s t test, t w o burlap bags were used to cove r t h e bar re l top. T h e combinat ion of ful l loading pressure and t w o bags dramat ica l ly improved cont ro l of emissions. Visible emissions were in t h e range of 5 to 15% opacity. Both t rucks were prac t ica l ly ident ica l in construct ion and design wi th t h e s a m e loading technique. I t is bel ieved t h e combinat ion of c ros s weave or over lap of burlap bag ma te r i a l and higher pressure provided a t ight seal t h a t minimized pulsing of dus t and c r e a t e d suf f ic ien t back pressure on t h e loading lines. A s in t h e f i r s t t ruck test, a s teady s t r e a m of hosed wa te r during loading was applied throughout t h e loading.
T h e fol lowing process d a t a was recorded as shown in T a b l e 2.
I--
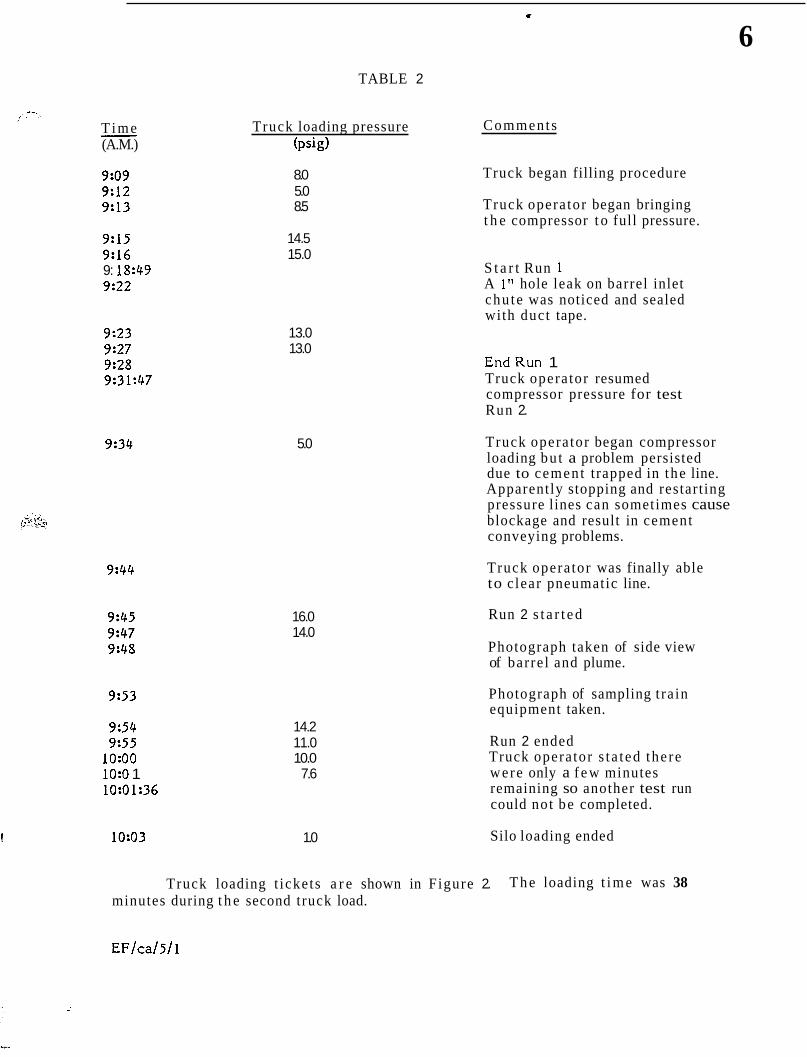
6 TABLE 2
T i m e (A.M.) -
9:09 9:12 9:13
9:15 9:16 9: 18:49 9:22
9:23 9:27 9:28 9:31:47
9334
9:44
9:45 9:47 9:48
9:53
9:54 9:55
1o:oo 1o:o 1 10:01:36
F 10:03
Truck loading pressure ( p i g )
8.0 5.0 8.5
Comments
Truck began filling procedure
Truck opera tor began bringing t h e compressor t o full pressure.
14.5 15.0
S t a r t Run 1 A 1" hole leak on barrel inlet chu te was noticed and sealed with duct tape.
13.0 13.0
E n d R u n 1 Truck opera tor resumed compressor pressure for test Run 2.
5.0
16.0 14.0
14.2 11.0 10.0 7.6
1.0
Truck opera tor began compressor loading bu t a problem persisted due to cement trapped in the line. Apparently stopping and restart ing pressure lines can sometimes cause blockage and result in cement conveying problems.
Truck opera tor was finally able to c lear pneumatic line.
Run 2 s t a r t e d
Photograph taken of side view of barre l and plume.
Photograph of sampling t ra in equipment taken.
Run 2 ended Truck opera tor s t a t ed the re were only a f e w minutes remaining so another test run could not be completed.
Silo loading ended
Truck loading t ickets a r e shown in Figure 2. T h e loading t i m e was 38 minutes during t h e second truck load.
... -1
7
19+" c i r cumfe ren ' ce s i l o o u t l e t c h u t e
Hose c lamps
' I ' I
55 ;-,:Fc.2 .,*--allon drum f i l l e d ' I wi water , 77%" M
c i r c u m f e r e n c e L 4
S t o r a g e S i l o
Silo i n t a k e c h u t e
l e x , d l e pneumat ic h o s e l i n e 3%'' I ; D . 4 - 5 / 8 " O . D .
Truck loaded w i t h 2 '
t o n s of cemen- I
- S i l o hopper t r a n s f e r l i n e
F I G U R E 1
, - , - . I
I SOLDTO SPECIALTY ALLOYS CORP I PO R O X 56
1 SPECIALTY ALLOYS C O R P \ CALLAYAY I N
I
810 OVERTON
TRAILER NO. ..i..,<.'. . , w 7 . . . : * . . . . N T .. -.,-., ... &- i'. . .
, , . . . .
*
F I G U R E 2
Truck load 1
7%200
52960
26.46
Truck load 2
- .
CUI1DUER NO. COUTRACT 8165000-801 I -'
SOLD TO SPECIALTY ALLOYS CORP PO B O X 56 6ALLAYAY TN 58036
SHIP TO U A U C A S ~ T O U N L ~ S O T U K K U I S C ~
SPECIALTY ALLOYS CORP 810 OYERTOH GALLAYAY TN cmmcnuo. 9900
CAUTION: MAY CAUSE EYE OR SKIN INJURY ' . SEE NOTICE ON REVERSE SIDE
Cood TONS I P A C U G E S KtND OF CEMENT
1 b! 2 ' . I 1 0 I
1.1 . . i . t-bl . . ! . I ".a UOV".
c
DISCUSSION OF SAMPLING PROCEDURES AND RESULTS
Specia l i ty Alloys - "Wet Suppression Sys tem" - J u n e 12, 1984
T h e purpose of th is source tes t ing was t o de t e rmine t h e p a r t i c u l a t e emission leve ls f rom a w e t suppression sys tem uti l ized to cont ro l t h e pa r t i cu l a t e emissions f rom t h e unloading of bulk c e m e n t f rom t rucks in to a s t o r a g e silo. This w e t suppression sys tem is commonly r e fe r r ed to as a " rain barrel".
Pr ior to col lec t ing t h e samples t h e process was ope ra t ed f o r s eve ra l minutes so t h a t t h e veloci ty and t e m p e r a t u r e of t h e exhaus t gases could b e determined. During t h e unloading of t h e f i r s t bulk c e m e n t t ruck t h e t o p of t h e " rain barrel" was covered with a single layer of burlap. When t h e process was o p e r a t e d i t was noted t h a t t h e r e was a w a t e r mi s t fo rced f rom t h e burlap by t h e pressure of t h e a i r being fo rced f rom t h e c e m e n t silo. I t was an t i c ipa t ed t h a t t h e exhaus t g a s veloci ty f rom this sou rce would b e quie t low and t h a t conventional measu remen t techniques utilizing a p i to t t u b e and a manomete r or a magnahel ic gauge would b e unsuitable fo r measur ing th i s flow. Both a vane type a n e m o m e t e r and a ho t wire t ype a n e m o m e t e r w e r e ut i l ized to measu re t h e exhaus t gas f lowra te f r o m t h e e x i t of t h e "rain barrel". S ince t h e
purposes. .- - . e Y *+.
measurements .
F o r t h e unloading of t h e f i r s t t ruck a veloci ty of 60 c. fee: . per-m.huie was-measured qt t h e s e l e c t e d sampl ing site utilizing both t h e vane ---- a n e m o m e t e r and t h e hot wire an2mometer . A f t e r consulting t h e ca l ibra t ion c h a r t s f o r t h e - h i volume sampler utilized, it was decided to conduct t h e sampling ut i l izing t h e largest avai lable sampling nozz le (d i ame te r 3.72 7 inches) and pulling a i r a t t h e lowes t p rac t i ca l r a t e (an o r i f i ce pressure drop of 0.03 inches of water). I t w a s e s t i m a t e d t h a t it would t a k e at least a half a n hour to comple te ly unload t h e truck. I t was decided to conduc t t h r e e ten-minute sample runs on th is t ruck unloading.
I
e w - - - . " m . . l
During t h e sampling of t h e unloading of t h e f i r s t t ruck s o m e visible emissions w e r e noted f rom t h e "rain barrel". A t t h e conclusion of t h e unloading of t h e f i r s t t ruck a second layer of bur lap was a t t a c h e d to t h e top of t h e " rain barrel".
T h e t e s t ing of t h e unloading of t h e second t ruck was conduc ted in a manner ident ica l to t h e t e s t ing of t h e unloading of t h e f i r s t t ruck. I t was noted t h a t a f t e r t he process was s t a r t e d t h e wa te r mi s t observed during t h e unloading of the first t ruck was no t as pronounced. I t was decided to conduct veloci ty and t e m p e r a t u r e measu remen t s at t h e s a m e locat ion ut i l ized f o r t h e tes t ing of t h e unloading of t h e f i r s t t ruck. A veloci ty of 60 feet per minute was measu red a t the. s e l ec t ed sampling site utiiizing both t h e vane a n e m o m e t e r and t h e h o t wire anemometer . T h e sampling w a s conducted in a manner t h a t was ident ica l to t h e sampling of t h e unloading of t h e f i r s t t ruck with o n e exception. T h e except ion was t h a t only t w o
sampling runs w e r e conducted. T h e reason for this was t h e fact t h a t t h e second t ruck was to be unloaded at a f a s t e r r a t e t han was t h e f i r s t truck. Because of th is i t was adjudged t h a t t h e r e would b e insuff icient opera t ing t i m e f o r t h r e e ten- minutes samples. I t was noted t h a t t h e observed visible emissions w e r e lower during t h e unloading of t h e second t ruck than during t h e unloading of t h e f i r s t truck.
i . ..
T h e concent ra t ion of t h e pa r t i cu l a t e m a t t e r in t h e exhaus t g a s s t r e a m of t h e "rain barrel" was ca l cu la t ed f rom t h e amoun t of pa r t i cu l a t e m a t t e r co l l ec t ed in t h e sampling t r a in during e a c h sample run and t h e volume of a i r sampled during e a c h sample run. Following t h e sampling t h e hi volume sample r was ca l ib ra t ed at a n or i f ice pressure drop of 0.03 inches of wa te r ( t h e r a t e used in t h e sampling) and f rom this d a t a t h e volume of a i r sampled during e a c h sample run was calculated.
In the ca lcula t ion of t h e mass emission r a t e f r o m a source t h e volumetr ic a i r flow f rom t h e sou rce mus t be determined. For this sou rce i t was decided t h a t t h e bes t method of ca lcula t ing t h e a i r f low f rom t h e source was by mult iplying t h e a r e a of t h e sou rce ( the a r e a of t h e open top of t h e "rain barrel" minus t h e a r e a of t h e in le t pipe) by t h e veloci ty measured at t h e sampling si te .
T h e resul ts obta ined f r o m this source tes t ing represents t h e b e s t emissions d a t a t h a t c a n b e obta ined f rom th is t y p e of cont ro l device. T h e procedures used in obtaining this emissions d a t a were designed in such a manner t h a t any biases t h a t might resul t would not b e aga ins t t he source.
SAMPLING TRAIN COMPONENTS
1. Aluminum probe with four nozzles. diameter, one nozzle of 1 7/8 inches diameter, one nozzle of 1 1/2 inches diameter, and one nozzle of 3 3/4 inches diameter.
One nozzle of 15/16 inch
2 . In- line f i l t e r of 0.3 micron porosi ty.
3. In- l ine o r i f i c e with pressure d i f f e r e n t i a l gauge of one inch w a t e r range and temperature gauge of appropriate s c a l e .
4. Bu t t e r f ly valve t o cont ro l flow through samplin- t r a i n .
5. F lex ib le hose from the t r a i n t o fan.
6. Centr ifugal fan.
I .,.
'\ I
a w
\$ I
P 0 m c
- > -
I w c i l
id -:
I3
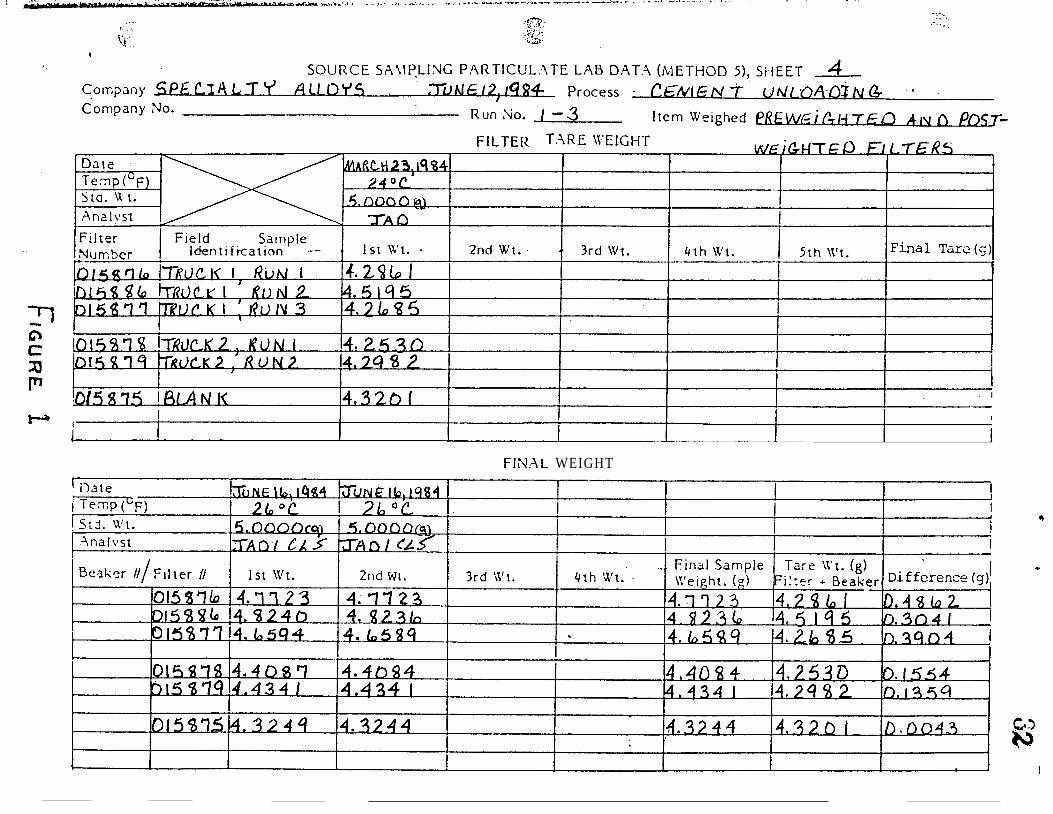
Laboratory Procedure Par t icula te High-Volume Source Samples
1. F i l t e r s are numbered, conditioned, and preweighed according t o t h e s tandardized "Total Suspended Par t icula te Analysis Procedure."
2. Upon request by t h e Source Sampling Section t e a m supervisor t h e requested quant i ty of f i l ters will be issued (preferably sequential ly numbered) and t h e chain of custody documentation (Figure 1) is initiated.
3. Throughout t h e tes t ing period t h e f i l t e r s and l a t e r t h e probe washes will remain in t h e custody of t h e test t e a m supervisor and this will be noted in t h e chain of custody documentation.
Upon completion of t h e sampling all f i l ters (used and unused) and t h e probe washings a r e returned to t h e laboratory and t h e chain of custody documentation is completed. All f i l ters (used) and probe washings a r e to be adequately labeled with t h e liquid level being marked on t h e outside of t h e container. A blank of t h e cleanup ace tone is also to be submitted.
4.
5. T h e f i l ters a r e t r e a t e d as described in t h e a t t ached l ab procedure which is t h e standardized "Total Suspended Par t icula te Analysis Procedure" with unrelated data deleted.
6. When t h e probe washings arr ive in t h e laboratory t h e y a r e checked to see if t h e r e was any loss of liquid in transit . If the re was any loss it is to be noted on t h e weight sheet. Then t h e probe washings a r e quanti tat ively t ransferred in to previously t a red beakers. The ace tone blank is t r e a t e d likewise.* These t a r e d beakers have been previously dried in a desiccator for 24 hours and weighed to t h e nearest 0.1 mg. The beakers a r e desiccated for at leas t six additional hours and reweighed. This is repeated until two successive weights a g r e e to within 0.5 mg. Before each weighing session t h e balance is checked with Class S weights and t h e results recorded.
These beakers a r e placed in t h e evaporation chamber until all liquid has evaporated, t h e n t h e beakers are desiccated f o r at leas t 24 hours and weighed to t h e neares t 0.1 mg. The beakers a r e desiccated f o r at l eas t 6 additional hours and reweighed. This is repeated until two consecutive weighings of e a c h beaker a g r e e to within 1.0 mg.
' 7. All weighings and other required d a t a a r e entered on t h e appropriate weight shee t s (Figure 2).
*Note:The quanti ty of acetone used in both t h e probe washings and t h e blank is measured and t h e volume is recorded. This is accomplished by using beakers having graduations at 25 ml intervals and building up to t h e next graduated interval with reagent acetone.
.' .. . I ' ...
Tota l Suspended Par t icula te Analysis Procedure
1. Number filters in t h e border a r e a of t h e f i l t e r using t h e sequential numbering machine. Number each filter twice, once on t h e f ront on t h e long edge and once on t h e back on t h e opposite long edge.
2. S t a m p envelopes with t h e information s tamp in t h e upper left corner with t h e opening to your l e f t as you look at t h e envelope. Number t h e envelopes to correspond to t h e f i l t e r numbers, placing t h e number to t h e right of t h e stamp.
3. S to re t h e f i l t e r s in t h e desiccator, kept dry (50% or less relat ive humidity) with t h e dryeri te. When t h e desiccator atmosphere becomgs too wet , replace t h e desiccant with t h a t in t h e oven being dried at (110-120 C). Place t h e w e t dryer i te in t h e large evaporating dish in t h e oven. In this manner t h e r e will always be a dry batch of dryer i te without having t o open another jar. T h e desiccator pan will hold 5 Ibs. of dryerite.
4. Each day, be fore weighing samples, record the.humidity in t h e desiccator and t h e weight of a 5 gm standard weight in t h e book provided. The book is kep t in t h e drawer in t h e table next to t h e balance with t h e standard weights.
In weighing c lean f i l ters and also in weighing exposed fi l ters, after weighing a batch reweigh 7%+ of t h e f i l ters to check the precision of t h e weighings. The following table gives t h e number of f i l ters to be checked.
No of f i l ters in ba tch
u p t o 14 15 to 28 29 to 42 43 to 56 57 to 70 71 to 84 95 to 100 and so on
No. to be reweighed
If any of t h e weights on t h e recheck differ by 1.0 mg or more from the - original weight, reweigh t h e ent i re batch, recording t h e new weight to t h e right of t h e original weight on t h e envelope. In calculating t h e result always use t h e l a s t weight taken.
5. In weighing t h e f i l ter , both before and a f t e r t h e exposure, place t h e f i l t e r s in t h e desiccator for at leas t 24 hours prior to t h e weighint. Record t h e original weight in t h e log book before distriburing t h e f i l t e r s to t h e field personnel. Be sure t h a t each field operator has an adequate supply of fi l ters, but t r y t o ensure t h a t al l f i l ters of t h e lowest number a r e used f i r s t to fac i l i t a t e recording in and reading from t h e log book.
When samples a r e received, wr i t e t h e d a t e received in t h e lower right corner of t h e envelope. P lace f i l ters in t h e desiccator f o r 24 hours prior to weighing.
6. 1 ,
7 . 5' . -
. . . , . .I. ..
7. Before weighing e a c h f i l ter , make sure t h a t t h e f i l t e r number matches t h e envelope number. In weighing t h e samples b e su re to reweigh 7%+ for quality control as in s t e p 4 above.
..
I.
4 .
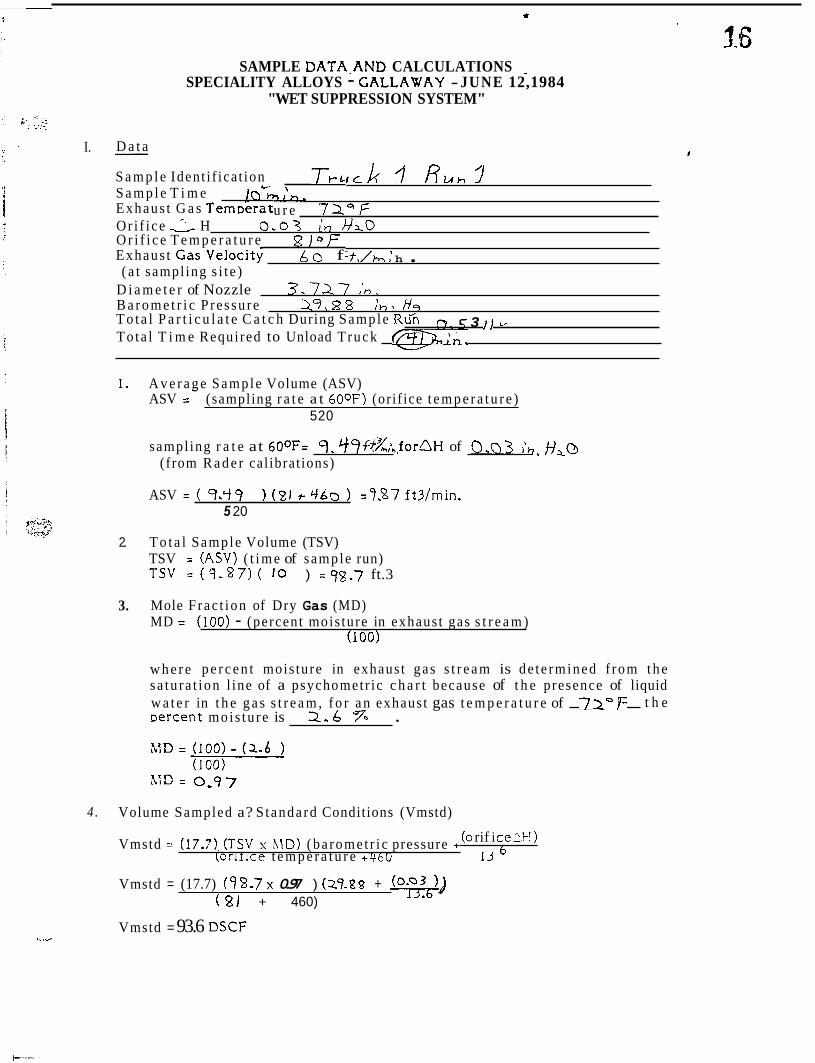
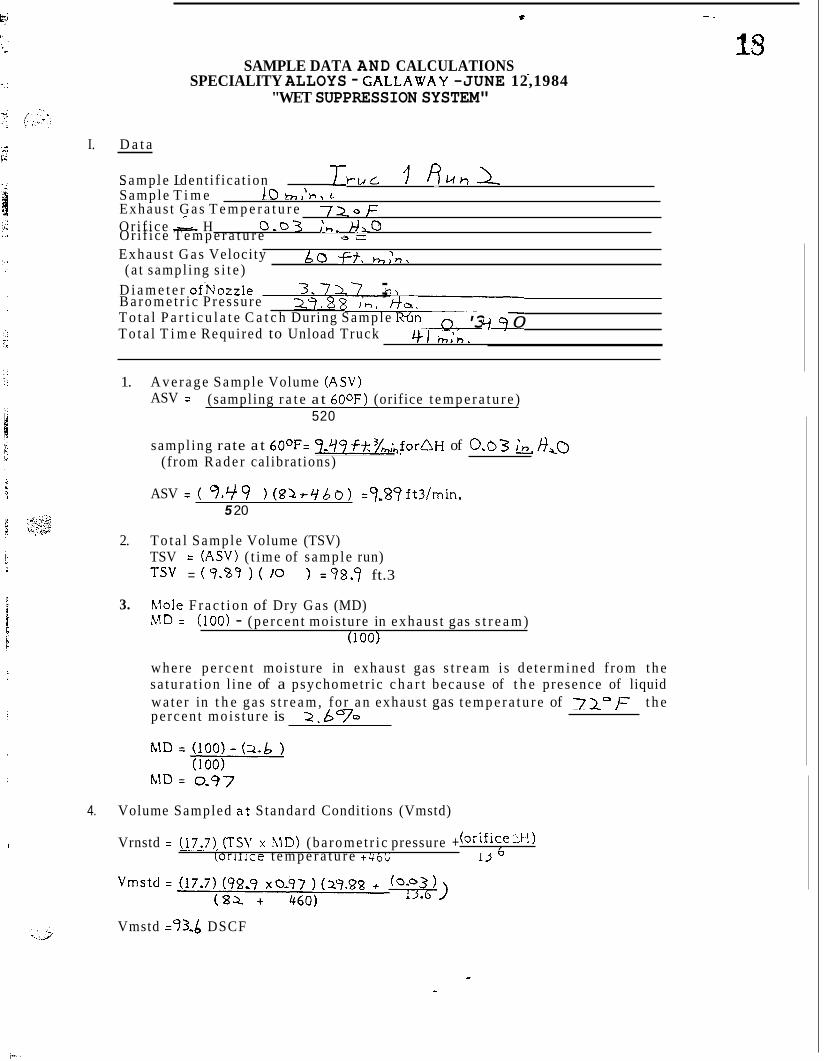
SAMPLE DATA.AND CALCULATIONS - SPECIALITY ALLOYS - GALLAWAY - JUNE 12,1984
"WET SUPPRESSION SYSTEM"
D a t a - S a m p l e Ident i f ica t ion T r Q c k ? Ruh =I S a m p l e T i m e ,'h
Exhaus t G a s TemDera t * . - , - u r e 72 - f-
Ori f i ce - 2 H 0 . 0 3 )Ir) Ha.0 O r i f i c e T e m p e r a t u r e 8 0 F
' f , /h h . Exhaus t Cas 'Veloc i ty 6 o f ( a t sampl ing s i t e )
D i a m e t e r of Nozzle ?.7.27 ; m ,
B a r o m e t r i c P res su re 29,253 ;b. H s T o t a l P a r t i c u l a t e C a t c h During Sample R u i To ta l T i m e Requi red to Unload Truck f/9;3X.;n.
0.5 3 ) I u
W
1.
2.
3.
A v e r a g e Sample Volume (ASV) - ASV = (sampling r a t e a t 600F) (orif ice t e m p e r a t u r e )
520
sampl ing r a t e at 600F= 9, yy+?x;hfordH of 0.03 i b , ff,o (from R a d e r cal ibrat ions)
ASV = ( 9.'-19 5 20
) (21 t cfbo ) Z9.87 f t3/min.
T o t a l Sample Volume (TSV) TSV = (ASV) ( t i m e of sample run) TSV = (7-87) ( 10 ) = 98.7 ft.3
Mole F rac t ion of Dry Gas (MD) MD = (100) - (percent mois ture in exhaus t gas s t r e a m )
(100)
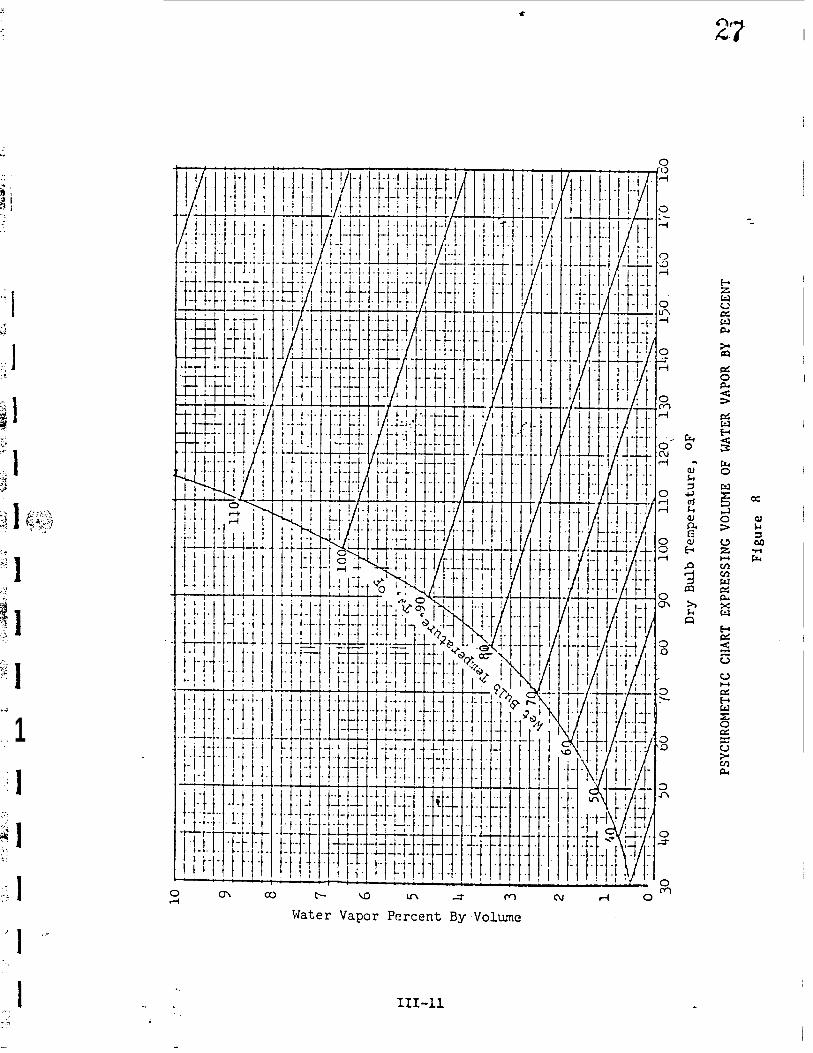
w h e r e p e r c e n t mois ture in exhaus t gas s t r e a m is de t e rmined f rom t h e sa tu ra t ion l ine of a psychometr ic c h a r t because of t h e presence of liquid w a t e r in t h e g a s s t r e a m , f o r a n exhaus t gas t e m p e r a t u r e of 71-I; t h e Dercent mo i s tu re is 2 . 6 % .
Volume Sampled a? S tanda rd Conditions (Vmstd)
Vmstd = (17.7),!TSV x hlD) (ba romet r i c pressure + (0 rif i cc"r! ) ,J (orir lce t e m p e r a t u r e +46U
Vmstd = (17.7) (98 -7x 0.97 ) ( 29 -88 + ( 0 . 0 3 )) r3I6 (81 + 460)
Vmstd = 93.6 DSCF
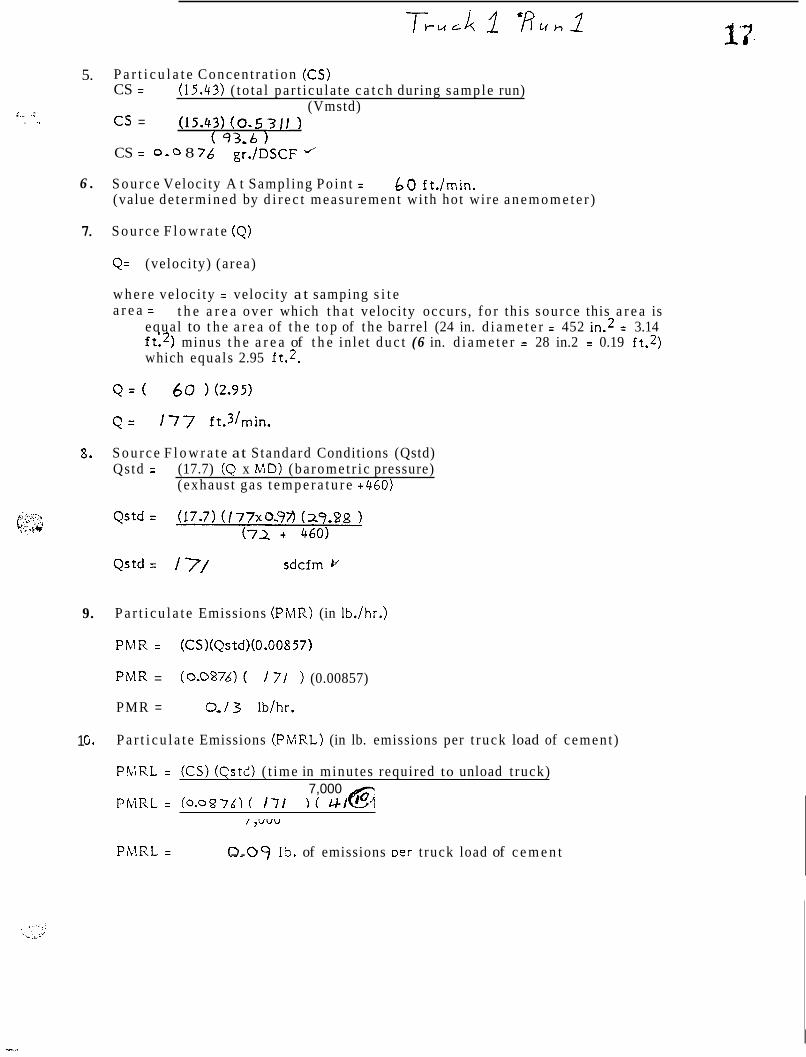
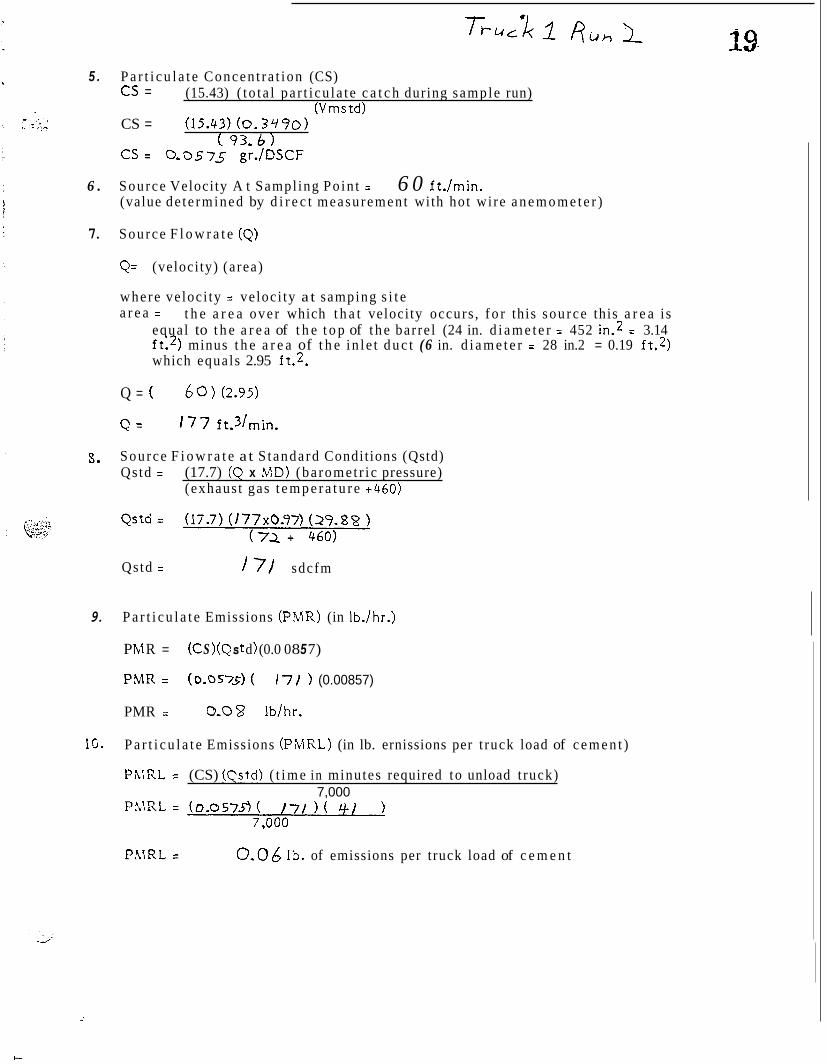
5.
, - . ,.. .. . ..
6 .
7.
9.
1 C.
P a r t i c u l a t e Concen t r a t ion (CS) CS =
CS =
CS = 0.0 8 76
S o u r c e Veloci ty A t Sampl ing Po in t = (value de t e rmined by d i r e c t measu remen t wi th hot wire a n e m o m e t e r )
S o u r c e F l o w r a t e (Q)
(15.43) ( t o t a l pa r t i cu l a t e c a t c h during sample run)
(15.43) ( 0 - 5 311 ) ( 93.6 )
gr./DSCF
(Vmstd)
60 ft./min.
Q= (veloci ty) (a rea)
w h e r e ve loc i ty = veloci ty a t samping s i t e a r e a = t h e a r e a ove r which t h a t veloci ty occurs , f o r th is sou rce this a r e a is
equal to t h e a r e a of t h e t o p of t h e bar re l (24 in. d i a m e t e r = 452 in.2 = 3.14 ft.2) minus t h e a r e a of t h e in le t d u c t (6 in. d i a m e t e r = 28 in.2 = 0.19 ft.2) which equals 2.95 ft.2.
S o u r c e F l o w r a t e at Standard Conditions (Qstd) Qstd = (17.7) (Q x MD) (ba romet r i c pressure)
(exhaus t gas t e m p e r a t u r e +460)
P a r t i c u l a t e Emissions (PMR) (in lb./hr.)
PMR = (CS)(Q~td)(0.00857)
PMR = (0.0876) ( / 7 / ) (0.00857)
PMR = 0.13 Ib/hr.
P a r t i c u l a t e Emissions (PMRL) (in lb. emissions per t ruck load of cemen t )
Pk:RL = (CS) (Cs td) ( t ime in minutes required to unload t ruck)
PMRL = (0.08'76) ( / 7 / 1 ( 7,000
PhlRL = 0-09 Ib. of emissions Der t ruck load of c e m e n t - - I
- _ *
SAMPLE DATA AND CALCULATIONS
"WET SUPPRESSION SYSTEM" SPECIALITY ALLOYS - CALLAWAY -JUNE 12,1984
I. D a t a
Sample - . - Ident i f ica t ion P M C 7 8 U h l -
Sample T i m e )O h-n'n, L
Exhaus t G a s T e m p e r a t u r e 7 1 Q F Ori f i ce - H 0-03 ;+,. Hk 0 Ori f i ce T e m p e r a t u r e d -
Exhaus t G a s Veloci ty ( a t sampl ing s i t e )
LO -W, h-r: n ,
D i a m e t e r o f N o z z l e 3,717 ; h\ B a r o m e t r i c P res su re 2 9 . 8 2 ,'-, + Q L
T o t a l P a r t i c u l a t e C a t c h During Sample R-dn T o t a l T i m e Requi red to Unload Truck
0 0, '3 9 9 4-1 m:h.
1. A v e r a g e Sample Volume (ASV) ASV = (sampling r a t e a t 600F) (orifice t e m p e r a t u r e )
520
sampl ing rate a t 60°F= 9-?9-fk3/,;$ornH of 0.03 in , fi*('~ (from R a d e r cal ibrat ions)
ASV = ( 9.4 9 5 20
(81 t4 b 0) =9.89 f t3fmin .
2. T o t a l Sample Volume (TSV) TSV = (ASV) ( t ime of s ample run) TSV = (9-539 1 ( 1 0 =92.9 ft.3
3. hlole F r a c t i o n of Dry Gas (MD) MD = (100) - (pe rcen t mois ture in exhaus t gas s t r e a m )
(100)
where p e r c e n t mois ture in exhaus t gas s t r e a m is de t e rmined f rom t h e sa tu ra t ion l ine of a psychometr ic c h a r t because of t h e presence of liquid wa te r in t h e gas s t r e a m , fo r a n exhaus t gas t e m p e r a t u r e of 7 l o F t h e pe rcen t mo i s tu re is 2, bye
4. Volume Sampled a: S tandard Conditions (Vmstd)
(orificei-F.!) Vrnstd = (17.7), ITS ' x LID) (ba romet r i c pressure + I j (oriilce t e m p e r a t u r e +46u
Vmstd =93-6 DSCF
5 . P a r t i c u l a t e Concen t r a t ion (CS) CS =
CS = (15.43) ( 0 . 3 9 9 0 )
(15.43) ( t o t a l pa r t i cu l a t e c a t c h during sample run) (Vmstd)
( 9 3 - 6 ) . C S = 0,0575 gr./DSCF
(value de t e rmined by d i r e c t measu remen t with hot wire a n e m o m e t e r ) 6 . Source Veloci ty A t Sampl ing Po in t = 6 0 ft./min.
7. Source F l o w r a t e (Q)
Q= (veloci ty) (a rea)
where ve loc i ty = veloc i ty a t samping s i t e a r e a = t h e a r e a ove r which t h a t veloci ty occurs , f o r this sou rce this a r e a i s
equal to t h e a r e a of t h e t o p of t h e bar re l (24 in. d i a m e t e r = 452 in.2 = 3.14 ft.2) minus t h e a r e a of t h e in l e t d u c t (6 in. d i a m e t e r = 28 in.2 = 0.19 ft.2) which equals 2.95 ft.2.
Q = ( 6 0 ) (2.95)
8. Source F i o w r a t e a t S tanda rd Condit ions (Qstd) Qstd = (17.7) (Q x MD) (ba romet r i c pressure)
(exhaus t gas t e m p e r a t u r e +460)
Qstd = 17) sdcfm
9. P a r t i c u l a t e Emissions (PklR) (in lb./hr.)
P h;l R = (C S ) (Q s t d ) (0.0 0 8 5 7)
PMR = (0-057'3) ( / 7 / ) (0.00857)
PMR = 0-09 lb/hr.
P a r t i c u l a t e Emissions (PMRL) (in lb. ernissions per t ruck load of c e m e n t ) 16.
Ph'#RL = (CS) (Qstd) ( t i m e in minutes required to unload t ruck) 7,000
P h l R L = 0-06 Ib. of emissions per t ruck load of c e m e n t
1.-
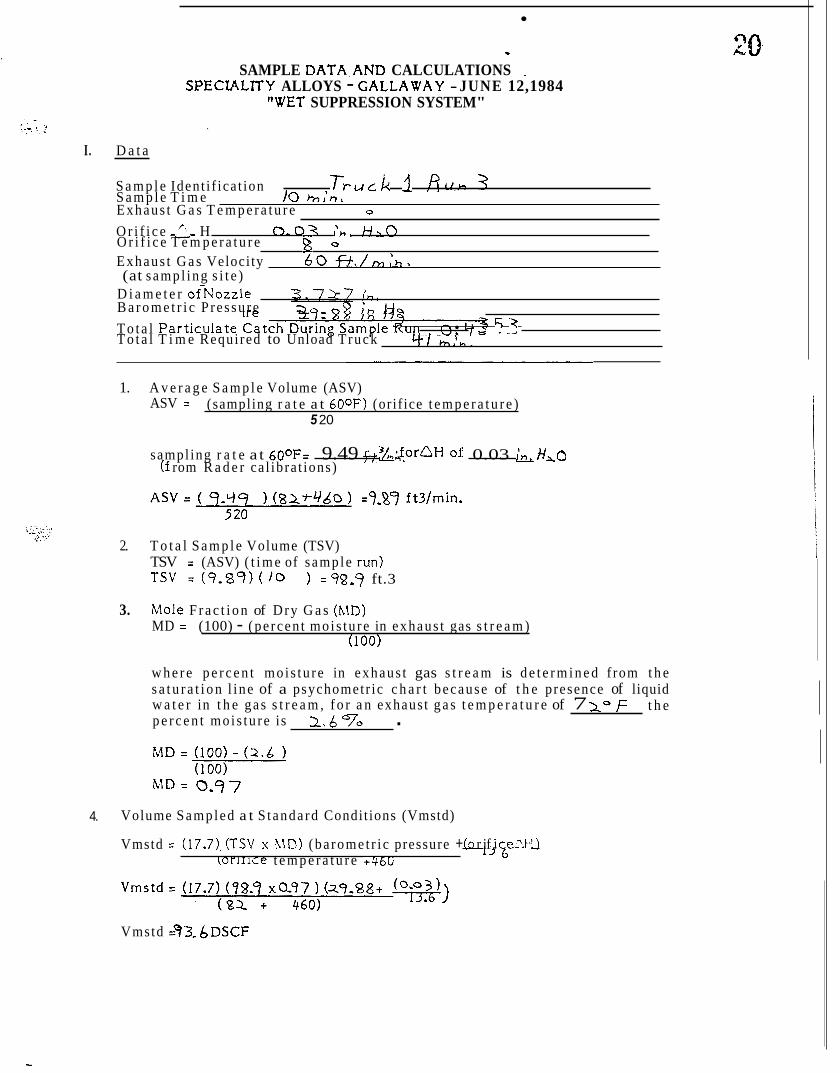
SAMPLE DATA,AND CALCULATIONS
"WET SUPPRESSION SYSTEM" SPECIALITY ALLOYS - GALLAWAY - JUNE 12,1984
I. D a t a
S a m p l e Ident i f ica t ion T-t-ur,k 1 f ) U h 3 Exhaus t G a s T e m p e r a t u r e 0
O r i f i c e - 2 H 0.03 ;)7, HLO O r i f i c e T e m p e r a t u r e 0
Exhaus t G a s Veloci ty 6 0 f f . /h , 'h ,
S a m p l e T i m e lo bI 'n,
(at sampl ing s i t e ) - - r -
B a r o m e t r i c P re s su re 2 - T o t a l T i m e Requi red to Unload Truck
7 T o t a l P a r t i c u l a t e C a t c t e - , ~
c t l m!n.
D i a m e t e r o f N o z z l e 7.717 /;7, 9 i n H9
; 6 ?
1. A v e r a g e S a m p l e Volume (ASV) ASV = (sampling r a t e a t 600F) (orif ice t e m p e r a t u r e )
5 20
sampl ing r a t e a t 60°F= 9.49 ft ~ ~ , ' $ o r ~ H Of: 0.03 J'~~)!&O f f rom R a d e r ca l ibra t ions)
2. T o t a l S a m p l e Volume (TSV) TSV = (ASV) ( t i m e of s ample run) TSV = (9-39) ( /O ) =99,9 ft.3
3. hlole F r a c t i o n of Dry G a s (MD) MD = (100) - (pe rcen t mo i s tu re in exhaus t gas s t r e a m )
(100)
w h e r e p e r c e n t mo i s tu re in exhaus t gas s t r e a m is d e t e r m i n e d f rom t h e s a t u r a t i o n l i ne of a psychometr ic c h a r t because of t h e presence of liquid
t h e w a t e r in t h e gas s t r e a m , f o r a n exhaus t g a s t e m p e r a t u r e of 7 1- F p e r c e n t mo i s tu re is 1 . 6 "70 .
4. Volume Sampled a t S t anda rd Condit ions (Vmstd)
Vmstd = (17.7), (TSV x hlD) (ba rome t r i c pressure + (3 r I, if ice2t: ) ~ o r l l l c e t e m p e r a t u r e +'ibb
Vmstd =?3,&DSCF
1-
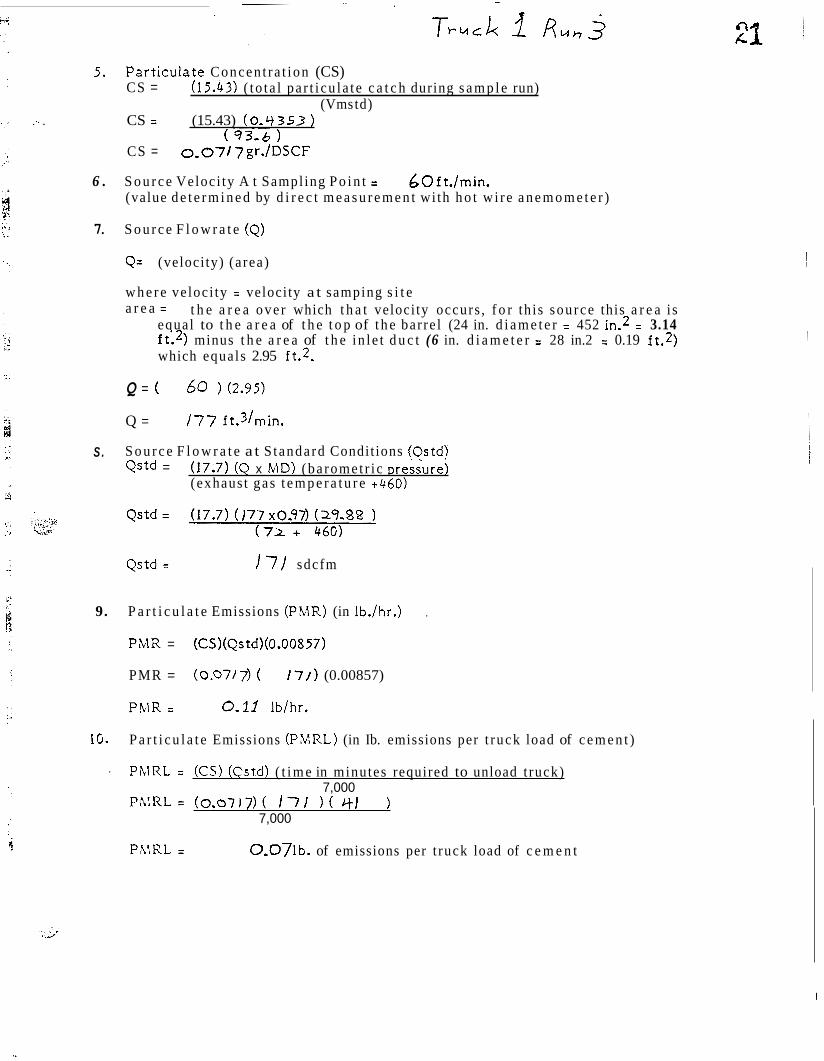
5. P a r t i c u l a t e Concen t r a t ion (CS) CS = (15.43) ( t o t a l pa r t i cu l a t e c a t c h during s a m p l e run)
(Vms td) .- . CS = (15.43) (0,9353)
(93-6 ) CS = 0,07/ 7gr. /DSCF
(value d e t e r m i n e d by d i r e c t m e a s u r e m e n t wi th h o t w i re a n e m o m e t e r ) 6 . S o u r c e Veloc i ty A t Sampl ing P o i n t = d O f t . / m i n .
7. S o u r c e F l o w r a t e (Q)
Q= (veloci ty) (a rea)
w h e r e ve loc i ty = veloci ty a t samping s i t e a r e a = t h e a r e a ove r which t h a t veloci ty occurs , f o r th is sou rce this a r e a i s
equal to t h e a r e a of t h e t o p of t h e bar re l (24 in. d i a m e t e r = 452 in.2 = 3.14 ft.2) minus t h e a r e a of t h e in l e t d u c t (6 in. d i a m e t e r = 28 in.2 = 0.19 ft.2) which equals 2.95 ft.2.
Q = ( 6 0 l(2.95)
Q = t77 ft.3Jmin.
S . S o u r c e F l o w r a t e a t S tanda rd Condit ions (Ostd) Qstd = (17.7) (Q x MD) (ba romet r i c presgure)
(exhaus t gas t e m p e r a t u r e +460)
Qstd = I 7 J sdcfm
9. P a r t i c u l a t e Emissions (PMR) (in lb./hr.) ,
PMR = (CS)(Q~td)(0.00857)
PMR = (0.0717) ( /71) (0.00857)
PMR = 0.11 lb/hr.
P a r t i c u l a t e Emissions (PVRL) (in Ib. emissions per t ruck load of c e m e n t )
PlZlRL = (CS) (Cstd) ( t i m e in minutes required to unload t ruck)
PR.!RL= (0.0717)( 1 7 1 YI )
10.
.
7,000
7,000
PhlRL = 0 .O7lb . of emissions per t ruck load of c e m e n t
l -
hi.
c
E
r
I
/
I..
I.
4.
D a t a - Sample Ident i f ica t ion T P L I L ~ 2. R u h 2 Sample T i m e I 0 h ; h r Exhaus t G a s T e m p e r a t u r e 9
Ori f i ce - L H 0 - 0 3 ;e. Ori f i ce T e m p e r a t u r e 2% Exhaus t Gas Veloci ty (at sampl ing s i t e )
- 1 , h n I P L I L k 2 H u h 1
Sample T i m e I 0 h ; h r Exhaus t G a s T e m p e r a t u r e 9
Ori f i ce - L H 0 - 0 3 ;e. HAQ
D i a m e t e r of Nozz le 3.717; h. B a r o m e t r i c P res su re >q Q Q ~ ~ - n - z > "
T o t a l P a r t i c u l a t e C a t c h During Sample Run 0, I 6 9 Tota l T i m e Reaui red to Unload Truck 38 h:h - -.,, ,
1. A v e r a g e Sample Volume (ASV) - ASV = (sampling r a t e a t 60°F) (orif ice t empera tu re )
520
sampl ing r a t e a t 600F= 9.q9#-?/,;,,forAH of 0-0 3 i n &,o (from R a d e r cal ibrat ions)
1 c
I
I 22
SAMPLE DATA AND CALCULATIONS
"WET SUPPRESSION SYSEM" SPECIALITY ALLOYS - GALLAWAY -JUNE 12, 1984
2. T o t a l Sample Volume (TSV) TSV = (ASV) ( t i m e of sample run) TSV = ( 9.96 ( lo 1 = 99-6 ft.3
3. Mole F rac t ion of Dry G a s (MD) MD = (100) - (pe rcen t mo i s tu re in exhaus t gas s t r e a m )
(1 00)
w h e r e p e r c e n t mois ture in exhaus t gas s t r e a m is de t e rmined f rom t h e sa tu ra t ion l ine of a psychometr ic c h a r t because of t h e presence of liauid w a t e r in t h e gas s t r e a m , f o r a n exhaus t gas t e m p e r a t u r e of pe rcen t mo i s tu re is 3.6 "70
2 1 " ~ ' t h e
XID = (100) - ( 3.C. (100)
)
Volume Sampled a t S tanda rd Condit ions (Vmstd)
Vmstd =qLbDSCF
5. P a r t i c u l a t e Concen t r a t ion (CS) CS = (15.43) ( t o t a l pa r t i cu l a t e c a t c h during s a m p l e run)
(Vmstd)
6 . Source Veloci ty A t Sampling Po in t = 6 0 ft./min. (value de t e rmined by d i r e c t measu remen t wi th hot wire anemomcte r )
7. S o u r c e F l o w r a t e (0)
Q= (veloci ty) (a rea)
w h e r e veloci ty = veloci ty a t samping s i t e a r e a = t h e a r e a ove r which t h a t veloci ty occurs , fo r this source this a r e a i s
equal to t h e a r e a of t h e t o p of the bar re l (24 in. d i a m e t e r = 452 in.* = 3.14 ft.2) minus t h e a r e a of t h e in le t d u c t (6 in. d i a m e t e r = 28 in.2 = 0.19 ft.2) which equals 2.95 ft.2.
Q = ( 6 0 (2.95)
Q = 1-77 ft.3lrnin.
S. S o u r c e F l o w r a t e a t Standard Conditions (Qstd) Qstd = (17.7) (Q x MD) (ba romet r i c pressure)
(exhaust gas t e m p e r a t u r e +460)
9. P a r t i c u l a t e Emissions (PMR) (in lb./hr.) .
P h'l R = 0.0q Ib/hr.
10. P a r t i c u l a t e Emissions (PMRL) (in lb. emissions per t ruck load of c e m e n t )
' Ph'IRL = (CS) (Cstd) ( t ime in minutes required t o unload truck) 7.000
PhlRL = 0 . O I l b . of emissions per t ruck load of c e m e n t
SAMPLE DATA.AND CALCULATIONS SPECIALITY ALLOYS - GALLAWAY - JUNE 12; 1984
"WET SUPPRESSION SYSTEM"
1. A v e r a g e S a m d e Volume (ASV)
I. D a t a - Sample Ident i f ica t ion T r u L k - 2 R u h l Sample T i m e / o m:h, Exhaus t G a s T e m p e r a t u r e g i ' F Ori f i ce - H 0 . 0 3 I ' n. ,$A0 Orif i c e T e m p e r a t u r e 0
Exhaus t Gas Veloci ty (at sampl ing s i t e )
D i a m e t e r o f N o z z l e 3. 7 27 Baromet r i c P res su re 29-29 T o t a l P a r t i c u l a t e C a t c h During Sample Run T o t a l T i m e Requi red to Unload Truck
6 o ~ t , /- ,In,
0. ) Y 1 q 38b.1:n.
" ASV = ( sami l ing r a t e a t ' 600F) (orif ice t empera tu re )
520
sampl ing r a t e a t 60°F= 9.49 f,r13/,,,;,,forAH of 0.03 ;,,, H,O (from R a d e r ca l ibra t ions)
2. T o t a l Sample Volume (TSV) TSV = (ASV) ( t i m e of s a m p l e run) TSV = (9.96 ) ( 10 1 =99-b ft.3
1:
a
I
3. Mole F r a c t i o n of Dry G a s (MD) MD = (100) - (pe rcen t mo i s tu re in exhaus t gas s t r e a m )
(100)
where p e r c e n t mo i s tu re in exhaus t gas s t r e a m is de t e rmined f rom t h e sa tu ra t ion l ine of a psychometr ic c h a r t because of t h e presence of liquid w a t e r in t h e gas s t r e a m , fo r a n exhaus t g a s t e m p e r a t u r e of 8 1 OF t h e pe rcen t mo i s tu re is 3-6 070 .
4. Volume Sampled a t Standard Condit ions (Vmstd)
(0 r i f i ce:".F! ) Vmstd = (17.71, (TSV x hlD) (ba romet r i c pressure + l j (OrlIlce t e m p e r a t u r e +ybu
Vmstd z92.6 DSCF
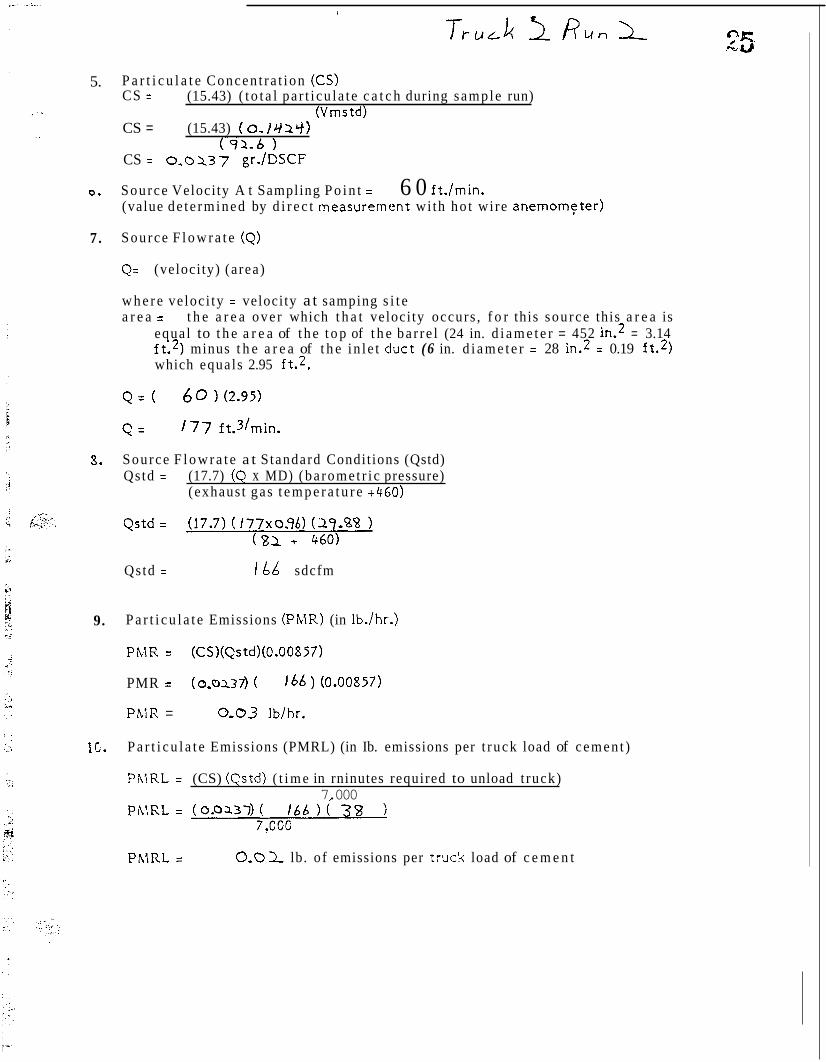
5.
0 .
7.
8.
9.
15.
P a r t i c u l a t e Concen t r a t ion (CS) CS =
CS = (15.43) ( O - / w + >
(15.43) ( t o t a l pa r t i cu l a t e c a t c h during sample run) (Vmstd)
(92-85 CS = 0 , 0 2 3 7 gr./CSCF
Source Veloci ty A t Sampling P o i n t = (value de t e rmined by d i r e c t measurerntmt wi th ho t wire anemomFte r )
6 0 ft./min.
Source F l o w r a t e (Q)
Q= (veloci ty) (a rea)
w h e r e ve loc i ty = veloci ty a t samping s i t e a r e a = t h e a r e a ove r which t h a t veloci ty occurs , f o r this sou rce this a r e a is
equal to t h e a r e a of t h e t o p of t h e ba r r e l (24 in. d i a m e t e r = 452 in.2 = 3.14 ft.2) minus t h e a r e a of t h e in l e t d u c t (6 in. d i a m e t e r = 28 in.2 = 0.19 ft.2) which equals 2.95 ft.2.
Source F l o w r a t e a t S tandard Condit ions (Qstd) Qstd = (17.7) (Q x MD) (ba romet r i c pressure)
(exhaus t gas t e m p e r a t u r e +460)
Qstd = 166 sdcfm
P a r t i c u l a t e Emissions (PklR) (in lb./hr.)
PhIR = (CS)(Q~td>(0.00857)
PMR = (0,0137) ( 166 (0.00857)
PhlR = 0-03 Ib/hr.
P a r t i c u l a t e Emissions (PMRL) (in Ib. emissions per t ruck load of cemen t )
PhlRL = (CS) (Qstd) ( t i m e in rninutes required to unload t ruck) 7.000
PhZRL = 0.01 lb. of emissions per t ruck load of c e m e n t
~~ . . . . ^ c
26
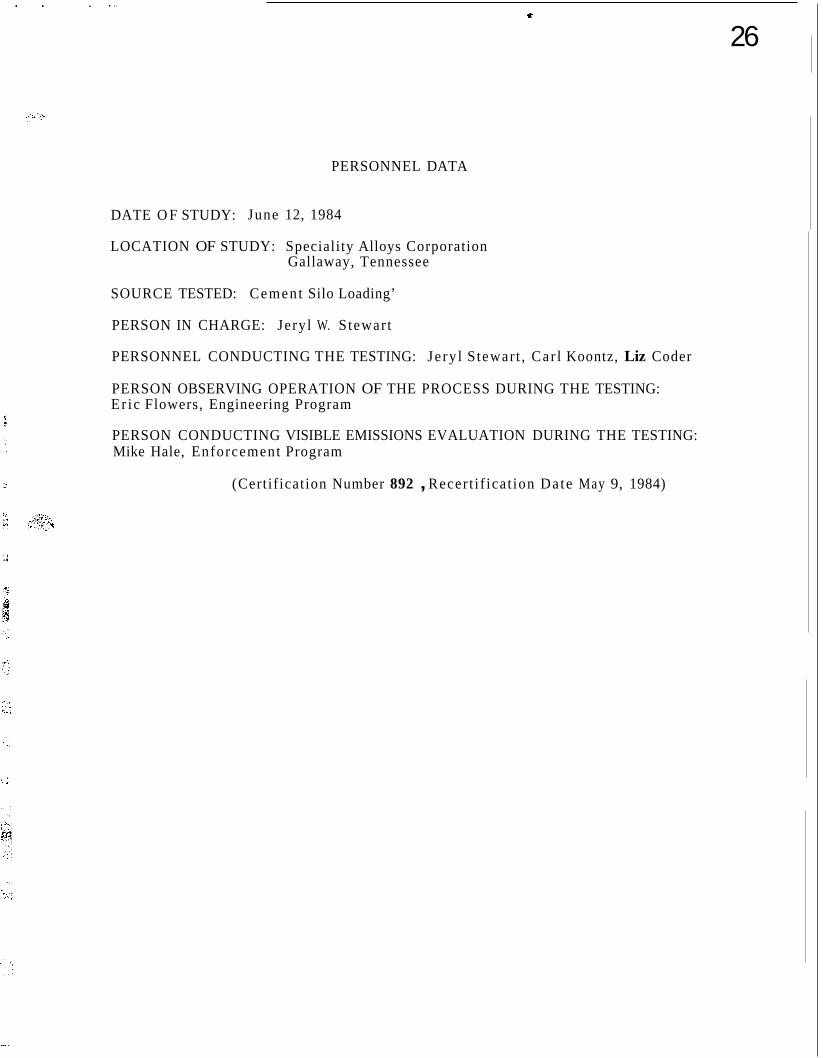
PERSONNEL DATA
DATE O F STUDY: June 12, 1984
LOCATION OF STUDY: Speciality Alloys Corporation Gallaway, Tennessee
SOURCE TESTED: Cement Silo Loading’
PERSON IN CHARGE: Jeryl W. Stewar t
PERSONNEL CONDUCTING THE TESTING: Je ry l Stewar t , Car l Koontz, Liz Coder
PERSON OBSERVING OPERATION OF THE PROCESS DURING THE TESTING: Er ic Flowers, Engineering Program
PERSON CONDUCTING VISIBLE EMISSIONS EVALUATION DURING THE TESTING: Mike Hale, Enforcement Program
(Certif ication Number 892 , Recer t i f ica t ion Da te May 9, 1984)
:; 1 . -
,. , - t
&' 1
c -.,
. . .. 1
" 1 "
1
2.7 I
111-11
I
I
Y
l 0 . 0 0 5 0 I 0 . 0 0 5 0
CALCULATION OF TOTAL. PARTICULATE CATCH DURING SAMPLE RUN (TP)
TP= FU'-FB+ AW - A B N
U'here:
FU' = gain in weight of f i l t e r dur ing a run (g.)
F B =
A'S' =
gain in weight of blank f i l t e r ( t o c o m p e n s a t e f o r f i l t e r handling) (g.)
gain in weight f r o m a c e t o n e wash of s ample r a t end of e a c h se r i e s of runs ( comple t e t e s t ) (g.)
A B = gain in weight of blank volume of a c e t o n e (to c o m p e n s a t e f o r impur i t i e s in a c e t o n e ) (g.)
N = number of runs in e a c h te:jt ove r which only a single probe wash o c c u r s
S a m p l e I T ruck 1 1 T r u c k v r u c k 1 Truck 2 , I Truck 2 R u n 3 Run 1 1 R u n 2 Run :2 I
I Ident i f ica t ion
i
i
FW
A B I I I
3 N . - . F . z
i T P i0.5311 10-3490
JS/bjs/APChold I . ;+ '..; : . .
,"..
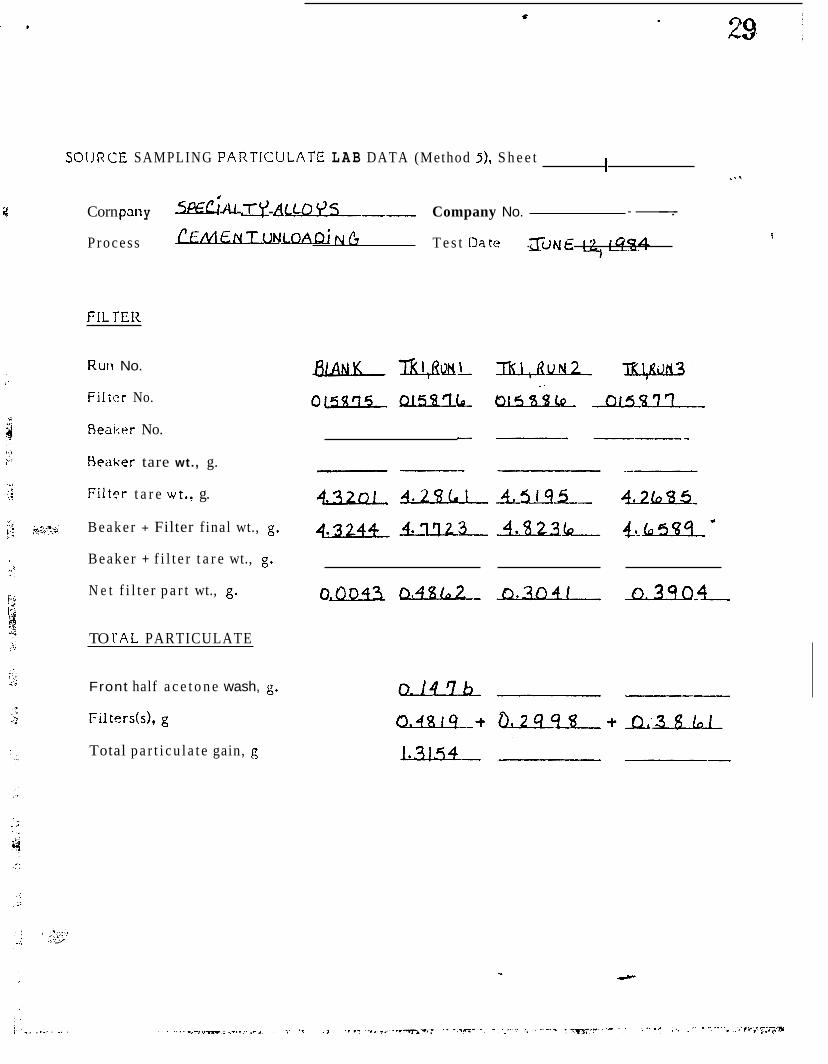
SOlJRCE SAMPLING PARTICIJLATE L A B DATA (Method 5 ) , S h e e t I . \ \
I
---.- E Corn pan y I A I .v A L ! L - - Company No.
i Process -uQ; Nt7 T e s t Date T U N E 12, 19544
. .
R u n No.
Fj l r e r No.
Reaim- No.
Hmker tare wt., g.
F i l tPr t a r e wt.? g.
Beake r + Filter f inal wt., g.
Beaker + f i l t e r t a r e wt., g.
N e t f i l t e r p a r t wt., g.
(.f e:..'-; 27
TO I'AL PARTICULATE
Front half a c e t o n e wash, g.
Fil terds), g
Total p a r t i c u l a t e gain, g
._. . .. .
" z
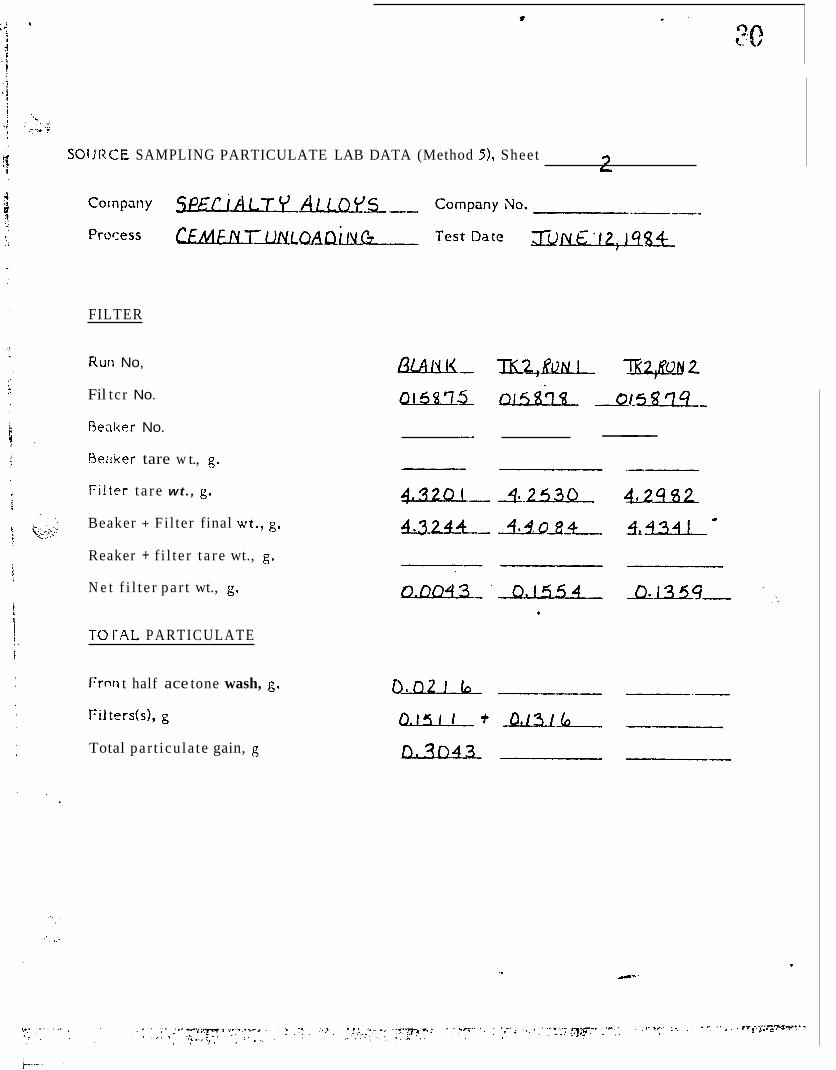
SOIlRCE SAMPLING PARTICULATE LAB DATA (Method 51, Sheet 7-
FILTER
R u n No,
Fil tcr No.
Realter No.
Beaker tare w t., g.
Fjltpr t a r e wt. , g.
Beaker + Fil ter final wt., g.
Reaker + f i l t e r t a r e wt., g.
N e t f i l t e r p a r t wt., g.
TO'I'AL PARTICULATE
Frnri t half ace tone wash, g.
Fil terds), g
Total pa r t i cu la te gain, g
-- ----
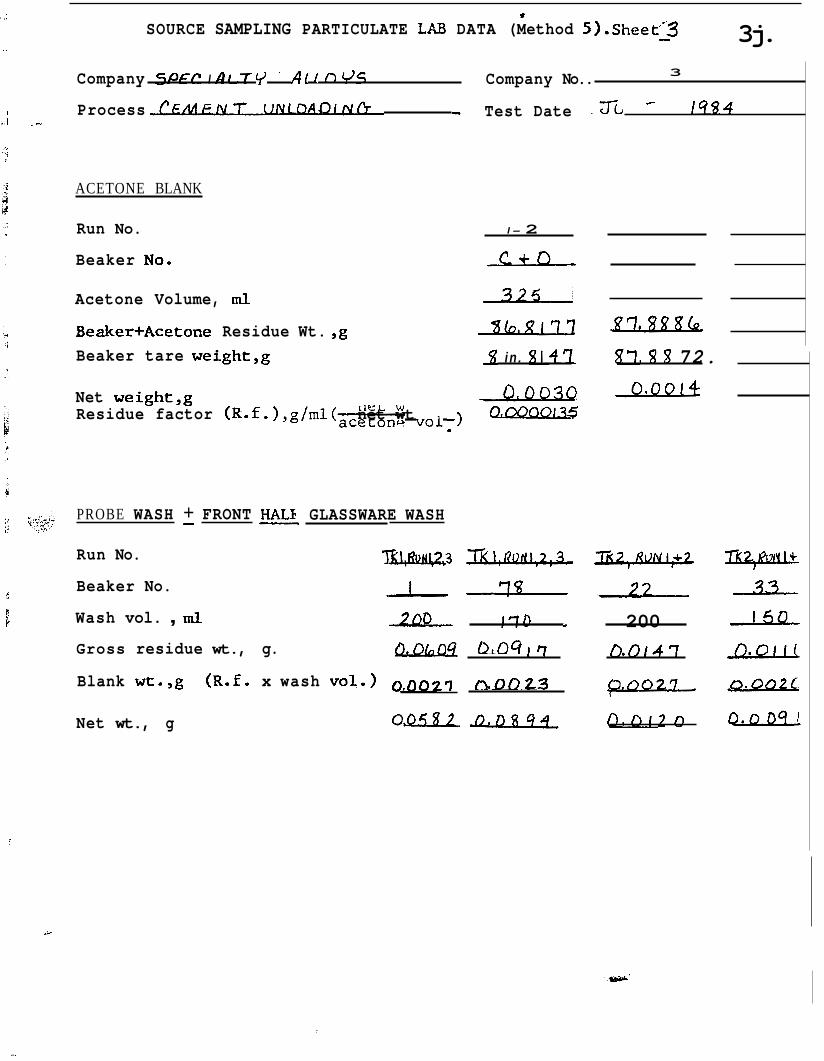
c SOURCE SAMPLING PARTICULATE LAB DATA (Method 5 ) .Sheet"3 3j. -
Company SPEP I A L T 9 A / I O QS Company No.. 3
I Process ,~ - Test Date 1984 c
, I _-
ACETONE BLANK
Run No. I - 2
Beaker No.
Acetone Volume, ml 32s Beaker+Acetone Residue Wt. ,g iudu22
in . 2147.
Net weight,g -AdUuQ
Beaker tare weight,g
- 1 -5 Residue factor (R.f .),g/ml(acetone net wt. vol
PROBE WASH + FRONT HALE GLASSWARE WASH - - Run No.
Beaker No.
Wash vol. , ml r a ?
87. S S 72.
.I& 22 200 I 7 0 I 200 u OIflQ r'l Gross residue wt., g.
Blank wt.,g ( R . f . x wash vol.) 0,0027 (3,0023
0.0147 - Net wt., g o w . J 2 ~ 0 ~ 0 1 2 0
k
j r
I...
7-.. :- .
. , :.. . .
FIN.AL WEIGHT
*
-
l
SOURCE SAhIPLING PARTICULATE LAB DATA (METHOD 5 ) , SHEET - 5
-__I. - .-__I-- 2 - 1 ' 4 53i]N&& -I_- ; 19 Sq_ --
. __________- .-
Final S a m p l e- Weight --i- (g) Tare W t . (g) Differences(g1 Number I 1st W t . I 2nd W t . I 3rd W t . I 4th W t . I
bate -
S t d . W t . Analys t JAO 1
T e m p . (OF) a l O % _I--.
---_. -
5. o 0 0 (3
I
Company SP&C i ALT Af COYS - t (184 Process 61 -- Run NO. 1-,3 Company No .
FINAL WEIGHT
4 th W t . C F i n a l Ta re ( g l _____- -
. .

Y
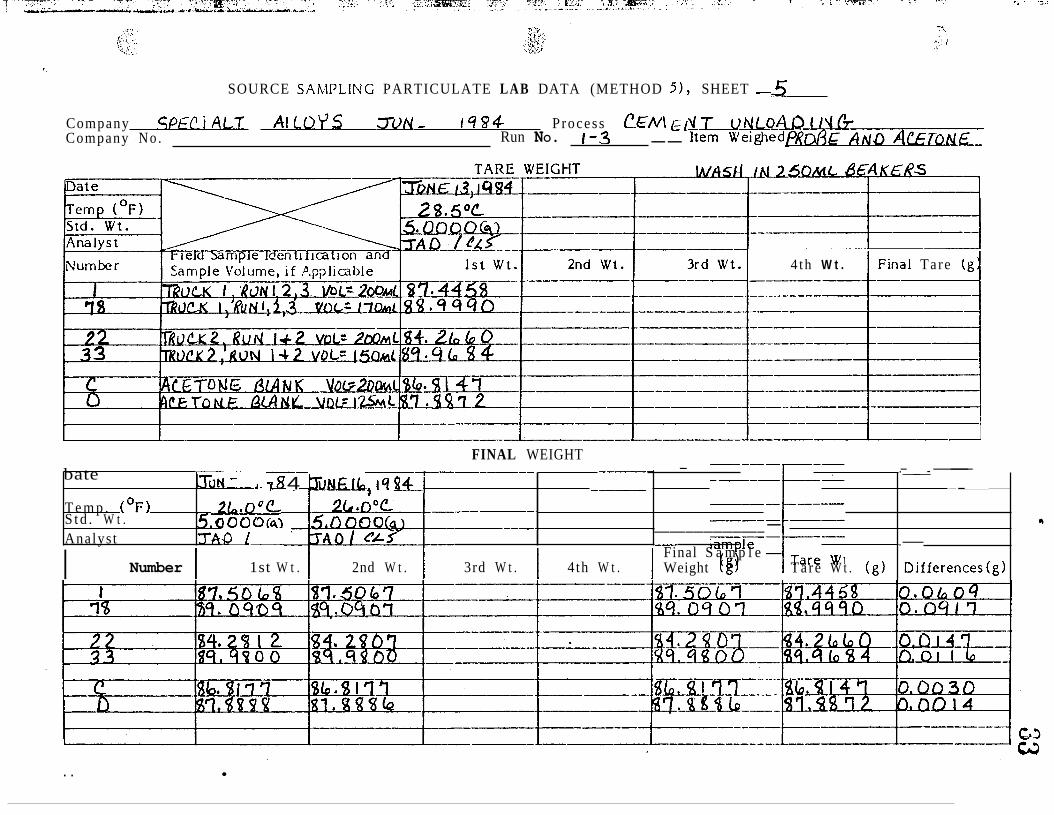
High-Volume Source Sampling Chain of Custody Documentation
Laboratory 1ssuanc:e
Hi-Vol f i l t e r s Nos. 0 j 597 5- 2 ,“1 8 $? 1, issued to Source
(laboratory supervisod. These were received hy‘ . \ > >,-, 11 ’ 1 - 7 / (Source Sampling Section team supervisor) on - 7 ,- - 5 1 ’ (date).
Sampling Section on TI, ,, , - 3 i ? 3 , 7 m a t e ) by ( ) 7 ’:,A; 1’ P. 2 k,.
Field Usage
These f i l t e r s remained in my possession or in a secure a r ea during t h e en t i re tes t ing period both before and a f t e r sample collection and until t h e f i l ters were returned to t h e laboratory. The probe washings were recovered in t h e field under my supervision and these remained in my possession or in a secure a r ea until they w e r e returned to t h e laboratory. These i tems were used in t h e source tes t ing of
5,Dec>n),”fr, / AiJol,s / (plant) on 2-\, p- /i,)984 ’(test dates)
\ , t c e h e h t iAh lood) h Q (sources tes ted) at
Laboratory Receipt of Samples
Hi-Vol f i l ters Nos. C15EI80- OI5985
?identification of (laboratory supervisor) on 4 0 / 3 - j+ - Z(d at e)
Figure 1
, .. -.,a
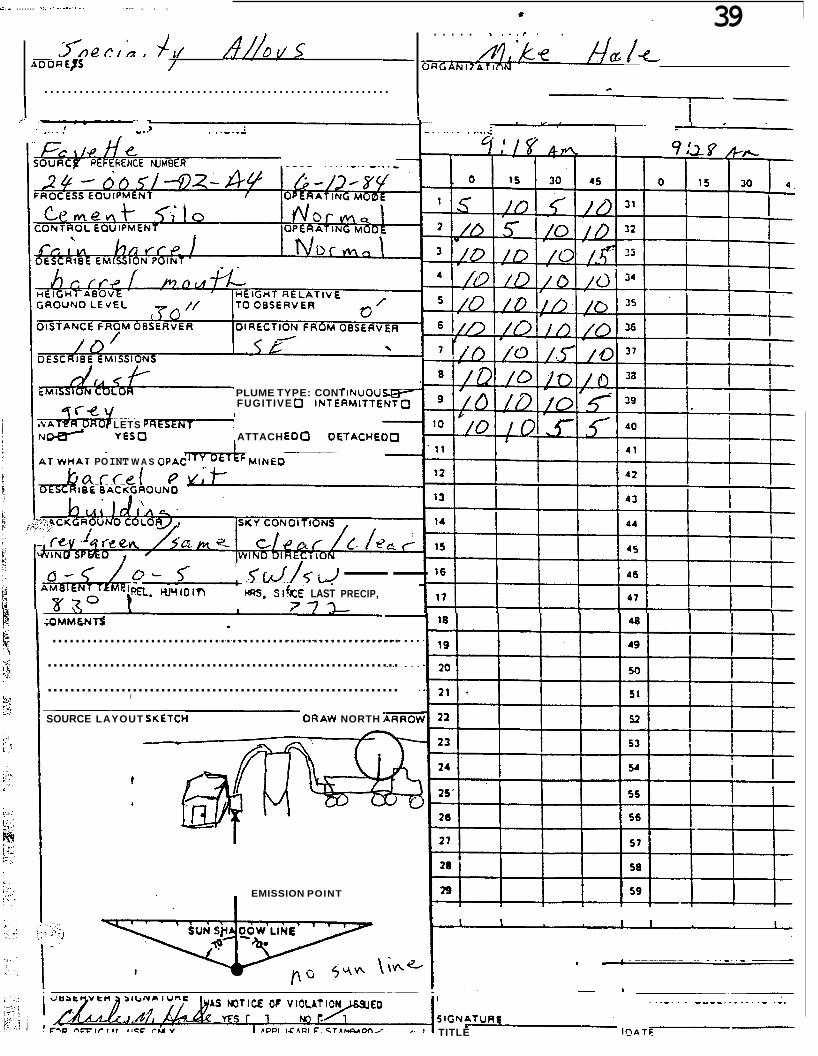
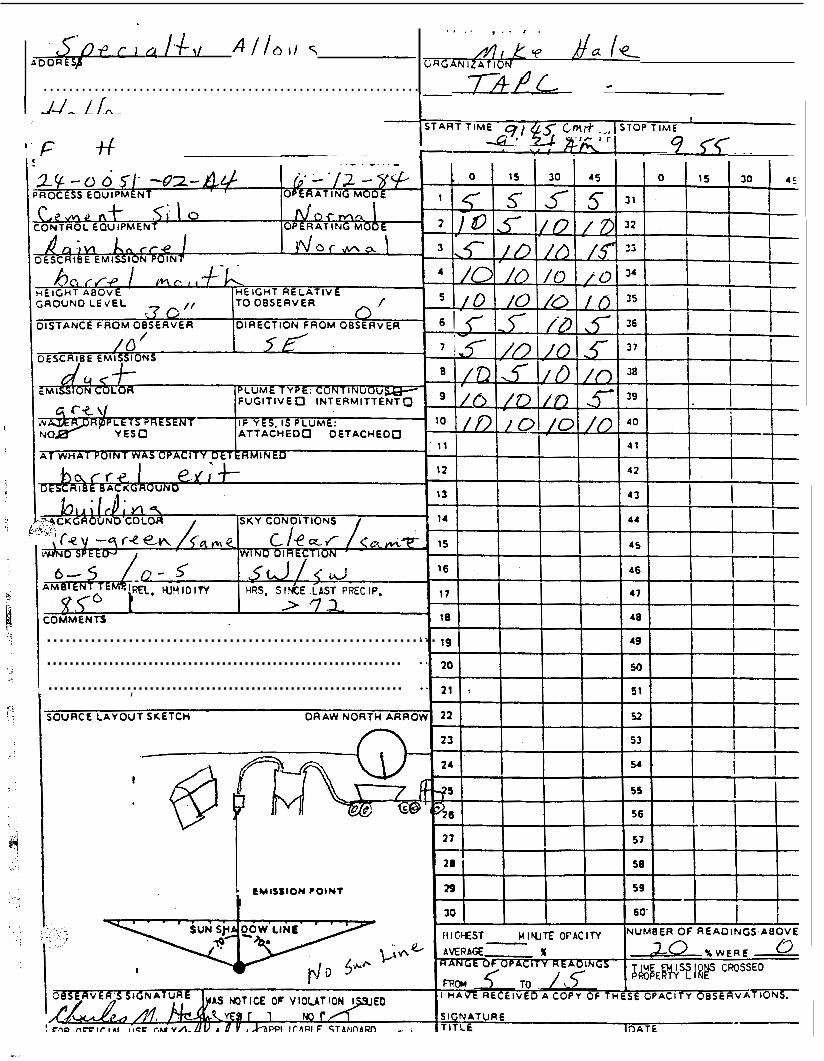
TENNESSEE AIR POLLUTION COXTROL DJl’ISlOh’ Kc . -
- I n s p e c t i o n R e p o r t - F ,‘L
, .., TDPH-APT
PH-0138 ( 1 / 7 7 )
I ...........................................................
I COMMENTS
................... .h.W?Z.. .. .L.c..*. .:n.FJ.. . - PI
......... m. .%.. ........................................
............................................................. I
SOURCE LAYOUT SUETCH ORAW NORTH ARROW
EMISSION P O l N t I
1-
* . . . . . . . . . . . . , . .
~
I I
i I
j
!
*
I
i;
I-
............................................................
\ / Z I P 1 PHONE
I\ cc- P L U M E TYPE. C O N T INlJOU FUGIT IVE 0 INTERMITTES;fT3;r
IF YES. Is PLUME: A T T A C H E 0 0 OETACHEOO
........... . : - . .p . l .KE?. . ...?:w.1:t-.l.(.'.n 3.....
.............................................................
............................................................. I
SOURCE LAYOUT SUETCH DRAW NORTH ARAOH
EMISSION POINT
3.7
r, a - I CERYIFKATIOL DATE
I I STOP T I M E S T A R T TIME
_.-
I i.::: I : . ;a
i.- ....... .>_.. _-_.,,. .__. . . .
L/ / -
ADOREPS
...........................................................
39 . . . . . , . . . I . . s
- /'
I N U O U ~ PLUME TYPE: CONT FUGITIVE 0 INTERMITTENTO
'
LETS 7 N D B " YESO ATTACH E D 0 DETACHED0
A T wnAr PO INT W A S OPAC MINED 1 a c t - e / P d-
I B E BAC<CIHCJUND
c d / L J -- HRS, S I k E LAST PRECIP,
- 7 7 L :OMMENTO
............................................................ .............................................................. ..............................................................
I
SOURCE LAYOUT SUETCH DRAW NORTH A m
EMISSION POINT
SIGNATURE TITLE 1 0 A T F
f f ) - * I+\, ...........................................................
..............................................................
...............................................................
............................................................... I
EMISSION POINT
. # . . , . - r .
mAN1zz:Nk '4
__ --.Z&PL -
t I I I I
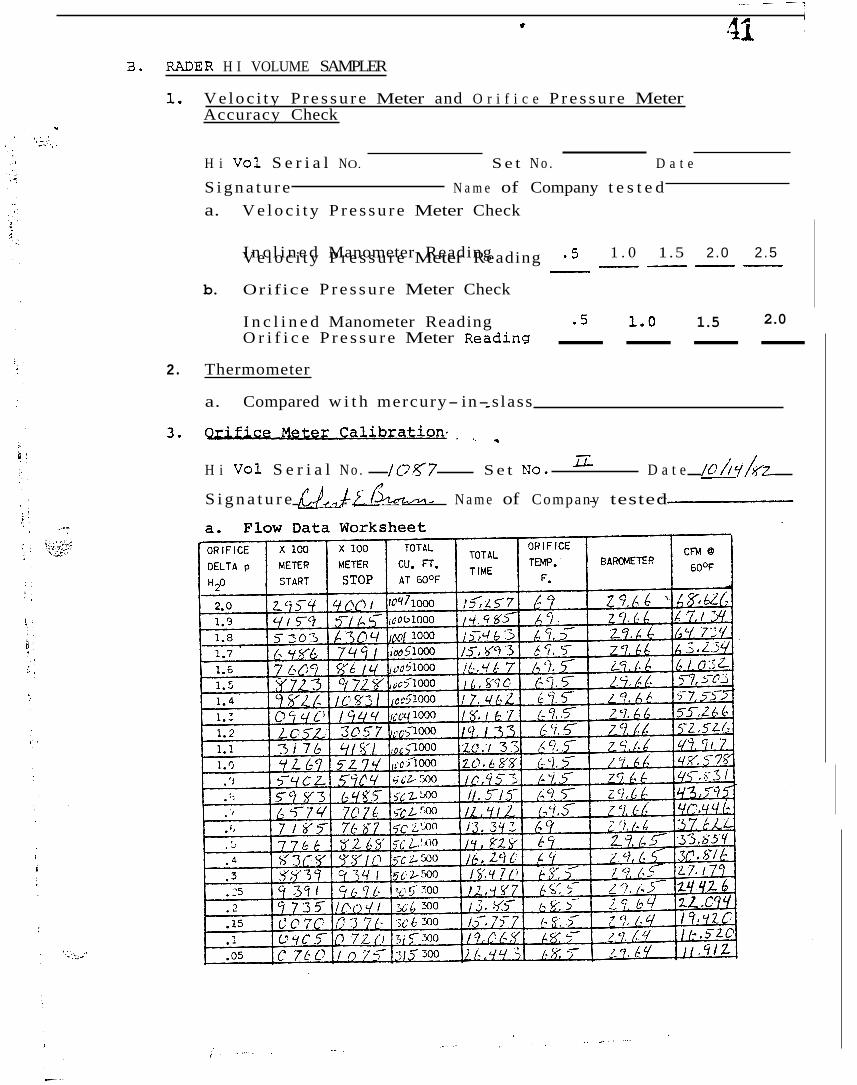
B, RADER H I VOLUME SAMPLER
1, Veloc i t y P r e s s u r e Meter and O r i f i c e P r e s s u r e Meter Accuracy Check
H i V o l S e r i a l NO. S e t N o . D a t e
S i g n a t u r e N a m e of Company t e s t e d a. V e l o c i t y P r e s s u r e Meter Check
I n c l i n e d Manometer Reading . 5 1 . 0 1 .5 2.0 2.5 - ---- V e l o c i t y P r e s s u r e Meter Reading
b. Orifice P r e s s u r e Meter Check
2.0 1.0 1.5 .5 I n c l i n e d Manometer Reading O r i f i c e P r e s s u r e Meter Readina a ----
2. Thermometer
a. Compared w i t h mercury- in- slass
H i V o l S e r i a l N o . lC347 S e t No. D a t e /C//y/&-
S i g n a t u r e uy,,J . &&-. N a m e of Company tested
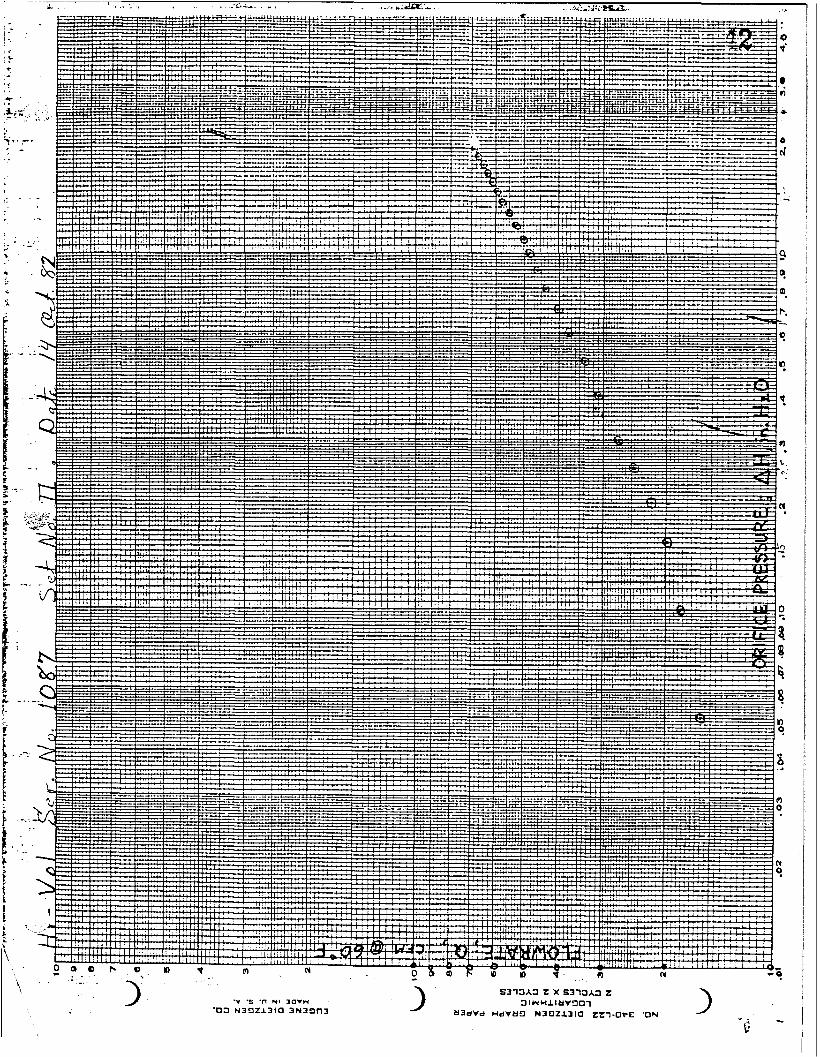
B. RADER H I VOLUME SAMPLER
1. Veloc i tv Pressure Meter and O r i f i c e Pressure Meter Accuracy Check
H i V o l Serial N o . S e t No. D a t e
S igna ture Name of Company tested
a. Veloc i ty Pressure Meter Check
Inc l ined Manometer Reading .1 .2 . 3 . 4 .5 ----- Veloci ty Pressure Meter Reading
b. O r i f i c e Pressure Meter Check
Inc l ined Manometer Reading . 5 1 . 0 1 . 5 2.0 O r i f i c e Pressure Meter Reading
2. Thermometer
a. Compared wi th mercury- in-glass . . 3. Orlflce Meter C a l i b r a t i o n
H i V o l Serial No. /o%? S e t No. D a t e 7,/ao/bV Signature &%N~-~ c, brh,Nanre of Company tested
a. Flow Data Worksheet
, . /
ANEMOMETER CALIBRATIW GRAPHS
MODEL 60 ANEMOTHERM@ AIR METER .a * .S.
M @ tmdomark of A
* . SCRANTON. PENNSYLVANIA . NAMICI CORPORATION OF A M
. .. . .-
.
ioo
f
i
I .
v
I-"
I
~. .
. . ..
. .
-.