Embed Size (px)
Citation preview
Tennessee Payment Reform Initiative
Provider stakeholder group meeting
PRELIMINARY WORKING DRAFT, SUBJECT TO CHANGE
June 19, 2013
1
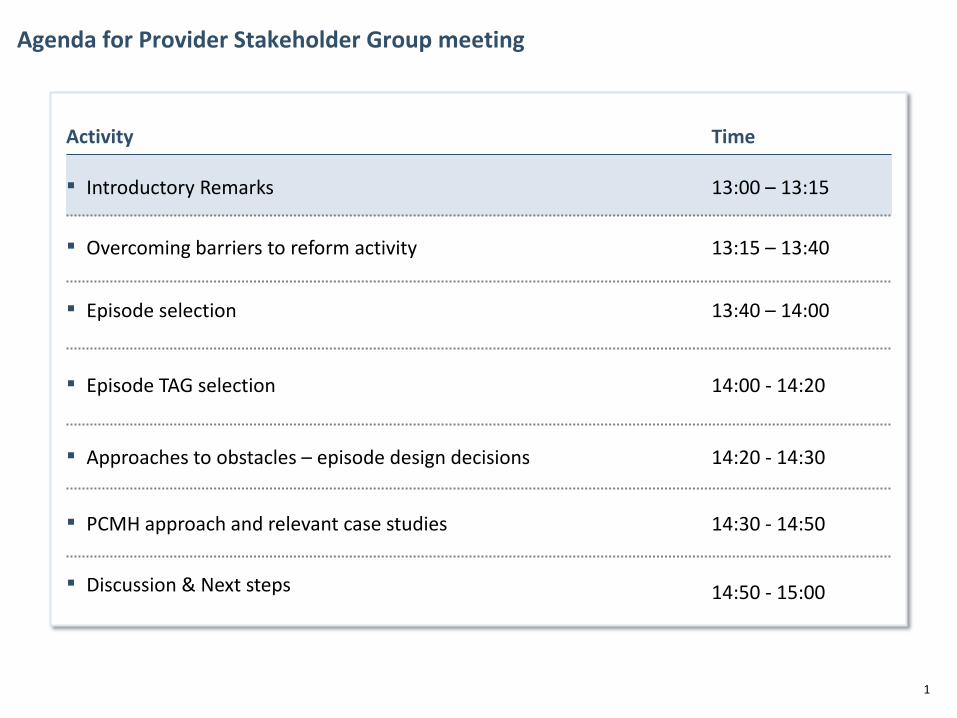
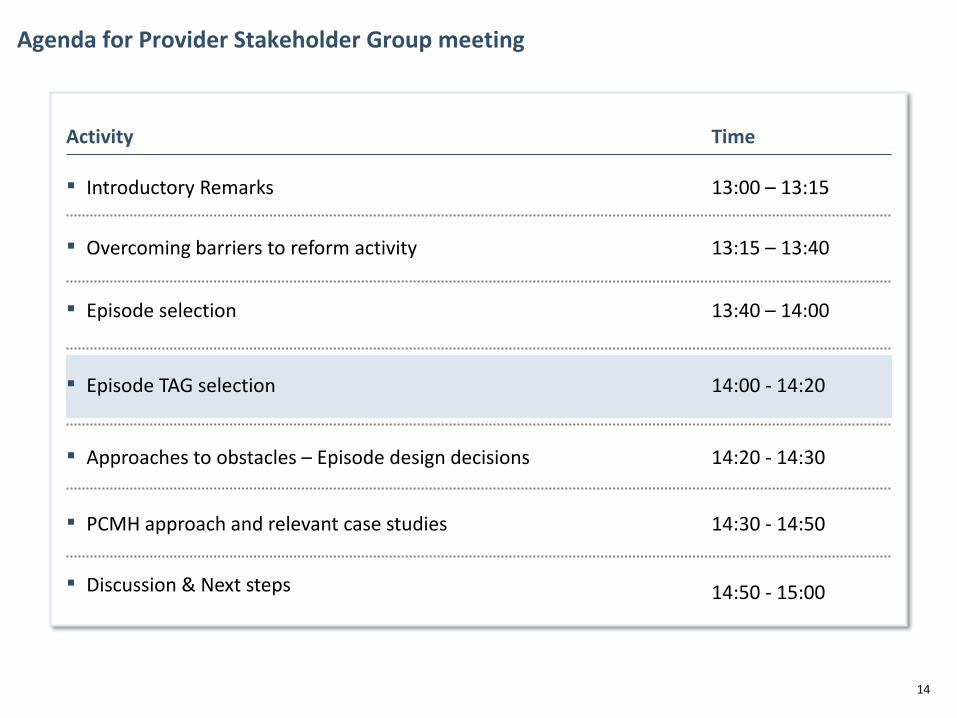
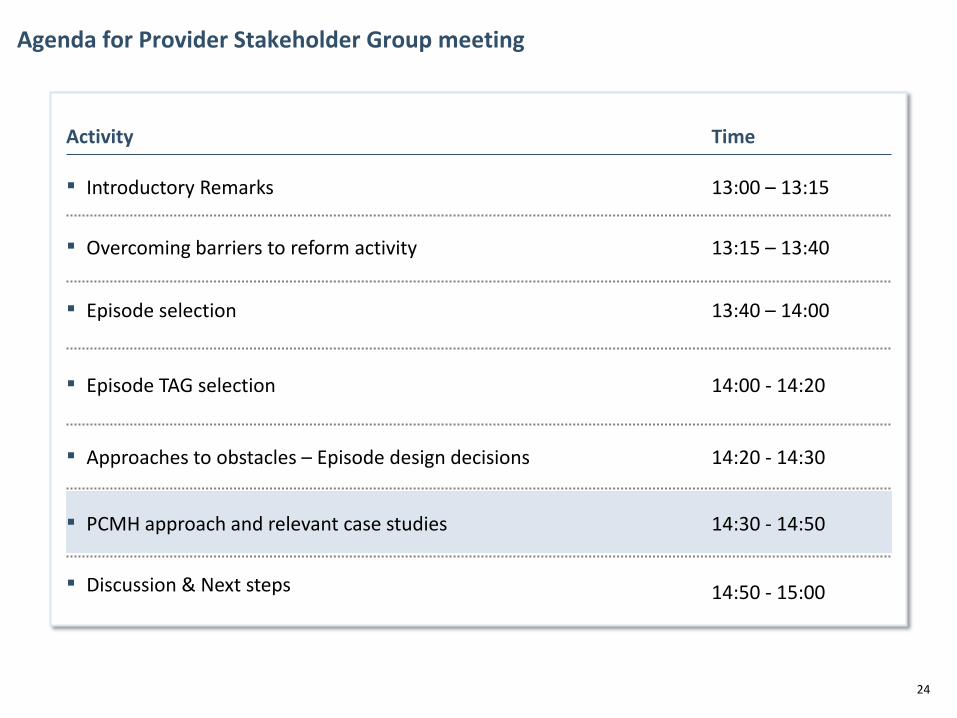
Agenda for Provider Stakeholder Group meeting
Time Activity
▪ Episode TAG selection 14:00 - 14:20
▪ Approaches to obstacles – episode design decisions 14:20 - 14:30
▪ PCMH approach and relevant case studies 14:30 - 14:50
▪ Episode selection 13:40 – 14:00
▪ Introductory Remarks 13:00 – 13:15
▪ Discussion & Next steps 14:50 - 15:00
▪ Overcoming barriers to reform activity 13:15 – 13:40
2
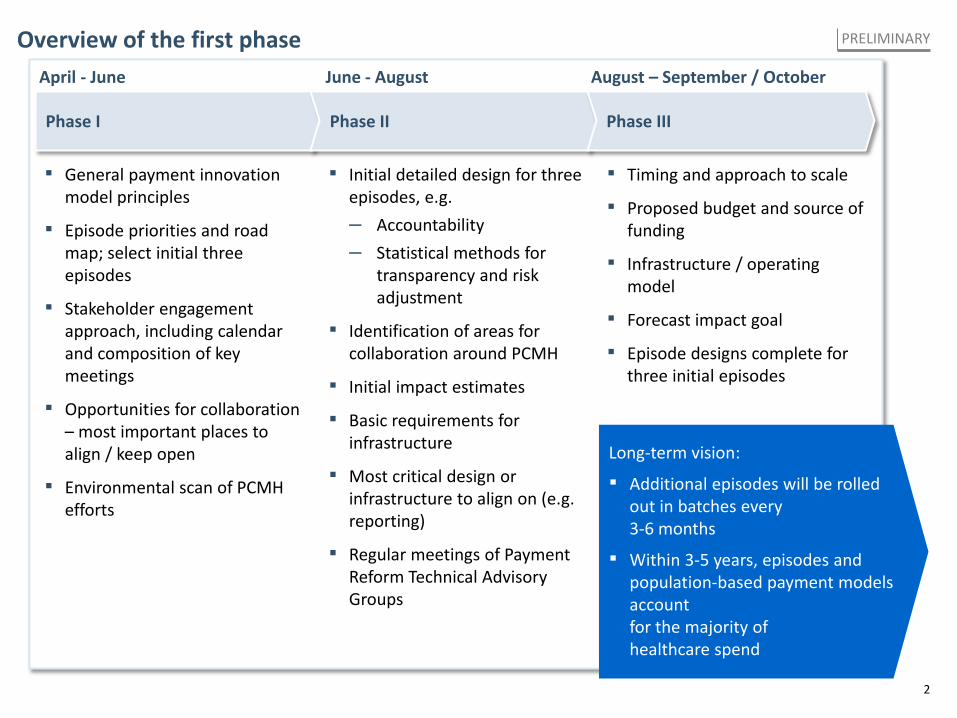
Overview of the first phase PRELIMINARY
Phase I Phase II Phase III
April - June June - August August – September / October
▪ Initial detailed design for three episodes, e.g. – Accountability – Statistical methods for
transparency and risk adjustment
▪ Identification of areas for collaboration around PCMH
▪ Initial impact estimates
▪ Basic requirements for infrastructure
▪ Most critical design or infrastructure to align on (e.g. reporting)
▪ Regular meetings of Payment Reform Technical Advisory Groups
▪ General payment innovation model principles
▪ Episode priorities and road map; select initial three episodes
▪ Stakeholder engagement approach, including calendar and composition of key meetings
▪ Opportunities for collaboration – most important places to align / keep open
▪ Environmental scan of PCMH efforts
▪ Timing and approach to scale
▪ Proposed budget and source of funding
▪ Infrastructure / operating model
▪ Forecast impact goal
▪ Episode designs complete for three initial episodes
Long-term vision:
▪ Additional episodes will be rolled out in batches every 3-6 months
▪ Within 3-5 years, episodes and population-based payment models account for the majority of healthcare spend
3
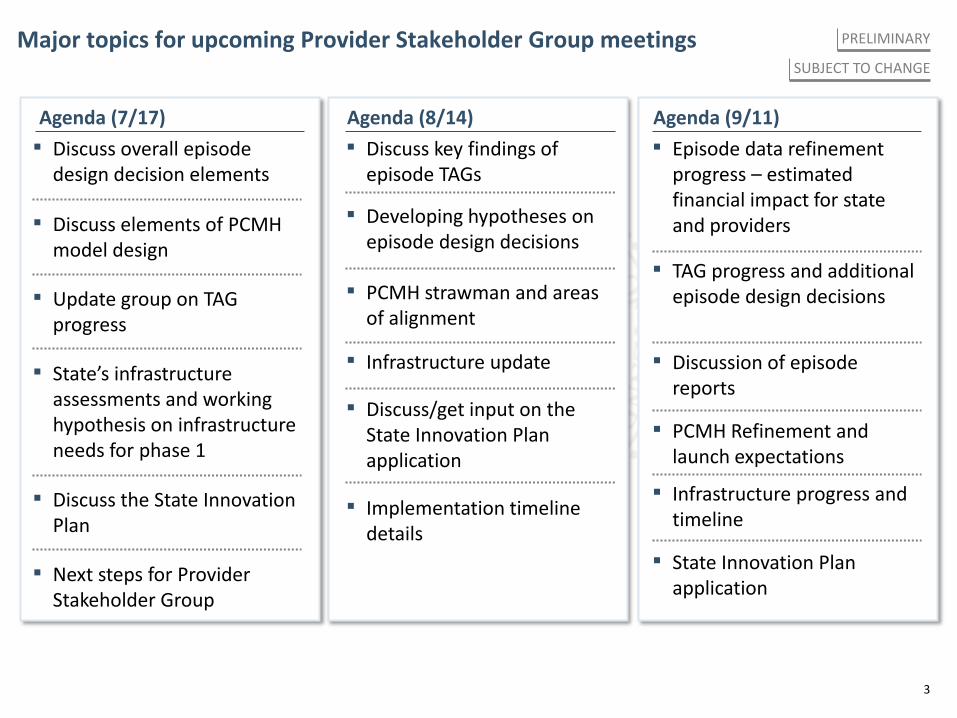
Major topics for upcoming Provider Stakeholder Group meetings PRELIMINARY
Agenda (8/14)
▪ Developing hypotheses on episode design decisions
▪ Discuss key findings of episode TAGs
▪ Infrastructure update
▪ Discuss/get input on the State Innovation Plan application
▪ PCMH strawman and areas of alignment
▪ Implementation timeline details
Agenda (9/11) Agenda (7/17)
▪ Discuss elements of PCMH model design
▪ State’s infrastructure assessments and working hypothesis on infrastructure needs for phase 1
▪ Discuss the State Innovation Plan
▪ Update group on TAG progress
▪ Next steps for Provider Stakeholder Group
▪ Discuss overall episode design decision elements
▪ TAG progress and additional episode design decisions
▪ Episode data refinement progress – estimated financial impact for state and providers
▪ Infrastructure progress and timeline
▪ State Innovation Plan application
▪ PCMH Refinement and launch expectations
▪ Discussion of episode reports
SUBJECT TO CHANGE
4
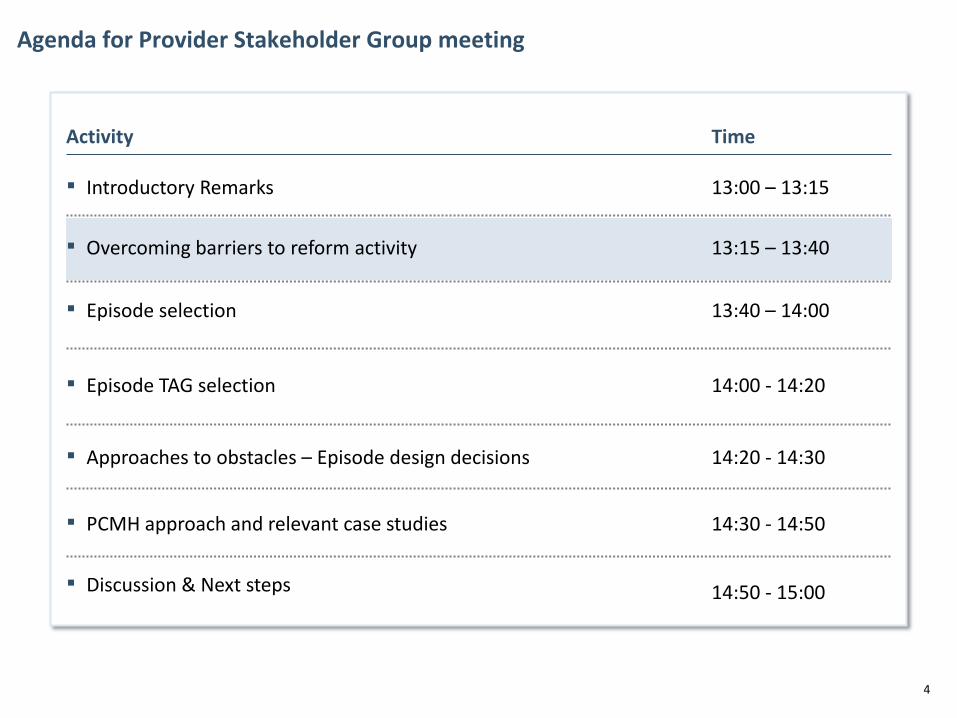
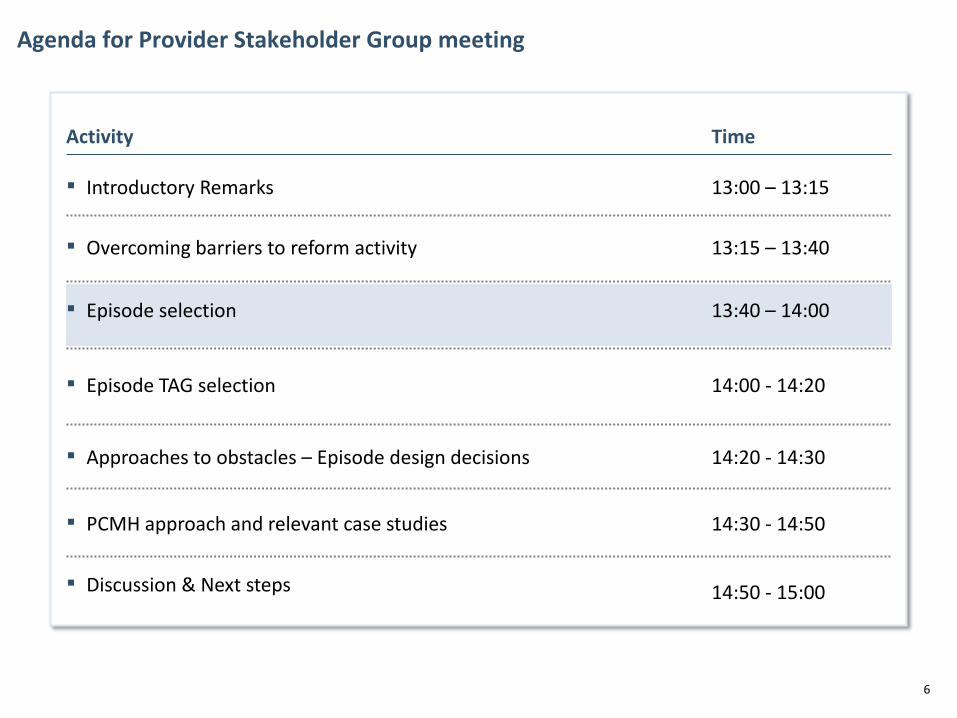
Agenda for Provider Stakeholder Group meeting
Time Activity
▪ Episode TAG selection 14:00 - 14:20
▪ Approaches to obstacles – Episode design decisions 14:20 - 14:30
▪ PCMH approach and relevant case studies 14:30 - 14:50
▪ Episode selection 13:40 – 14:00
▪ Introductory Remarks 13:00 – 13:15
▪ Discussion & Next steps 14:50 - 15:00
▪ Overcoming barriers to reform activity 13:15 – 13:40
5
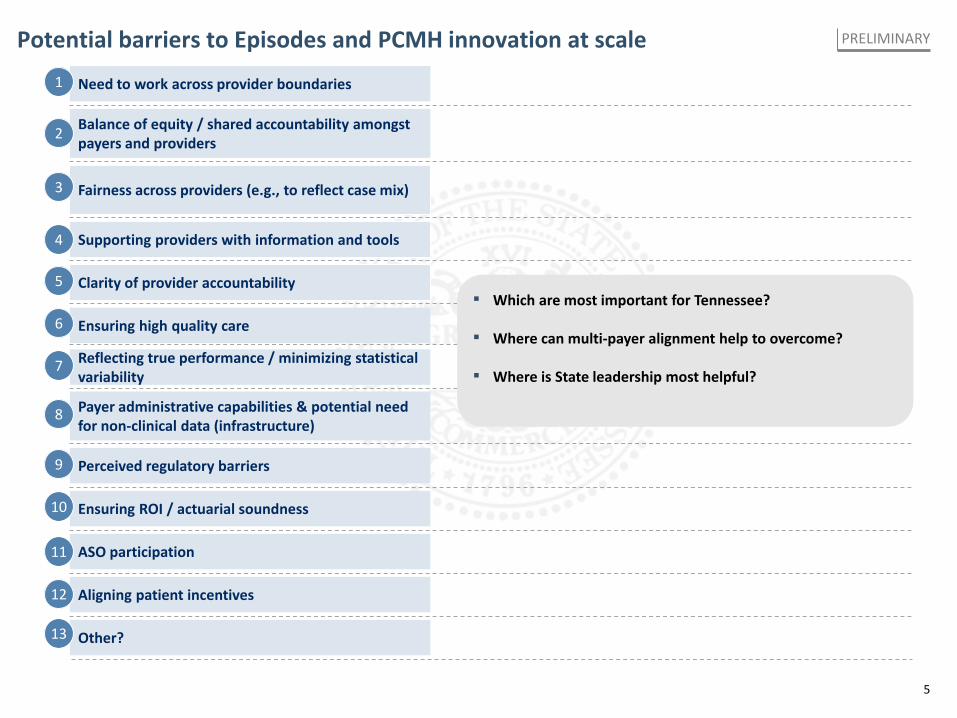
Potential barriers to Episodes and PCMH innovation at scale PRELIMINARY
Need to work across provider boundaries
Balance of equity / shared accountability amongst payers and providers
Fairness across providers (e.g., to reflect case mix)
Supporting providers with information and tools
Clarity of provider accountability
Ensuring high quality care
Payer administrative capabilities & potential need for non-clinical data (infrastructure)
Perceived regulatory barriers
Aligning patient incentives
Other?
Ensuring ROI / actuarial soundness
ASO participation
1
2
3
4
5
6
8
9
10
11
12
Reflecting true performance / minimizing statistical variability
7
13
▪ Which are most important for Tennessee?
▪ Where can multi-payer alignment help to overcome?
▪ Where is State leadership most helpful?
6
Agenda for Provider Stakeholder Group meeting
Time Activity
▪ Episode TAG selection 14:00 - 14:20
▪ Approaches to obstacles – Episode design decisions 14:20 - 14:30
▪ PCMH approach and relevant case studies 14:30 - 14:50
▪ Episode selection 13:40 – 14:00
▪ Introductory Remarks 13:00 – 13:15
▪ Discussion & Next steps 14:50 - 15:00
▪ Overcoming barriers to reform activity 13:15 – 13:40
7
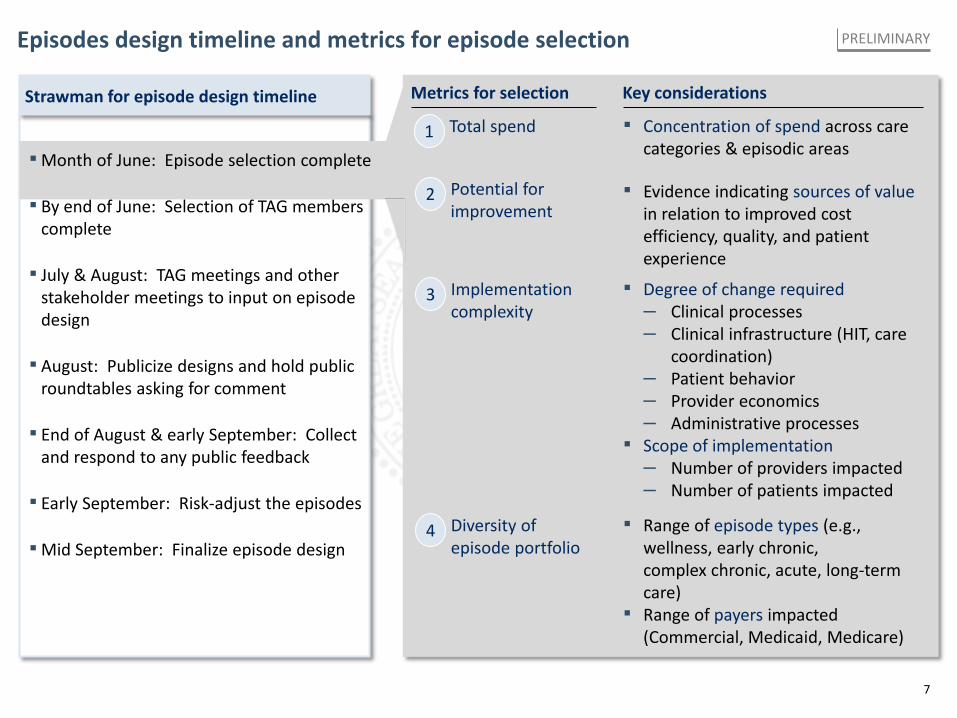
Episodes design timeline and metrics for episode selection
▪Month of June: Episode selection complete
▪ By end of June: Selection of TAG members complete
▪ July & August: TAG meetings and other stakeholder meetings to input on episode design
▪ August: Publicize designs and hold public roundtables asking for comment
▪ End of August & early September: Collect and respond to any public feedback
▪ Early September: Risk-adjust the episodes
▪Mid September: Finalize episode design
Strawman for episode design timeline
Total spend 1
Diversity of episode portfolio
4
Implementation complexity
3
Potential for improvement
2
Key considerations
▪ Concentration of spend across care categories & episodic areas
▪ Range of episode types (e.g., wellness, early chronic, complex chronic, acute, long-term care)
▪ Range of payers impacted (Commercial, Medicaid, Medicare)
▪ Degree of change required – Clinical processes – Clinical infrastructure (HIT, care
coordination) – Patient behavior – Provider economics – Administrative processes
▪ Scope of implementation – Number of providers impacted – Number of patients impacted
▪ Evidence indicating sources of value in relation to improved cost efficiency, quality, and patient experience
Metrics for selection
PRELIMINARY
8
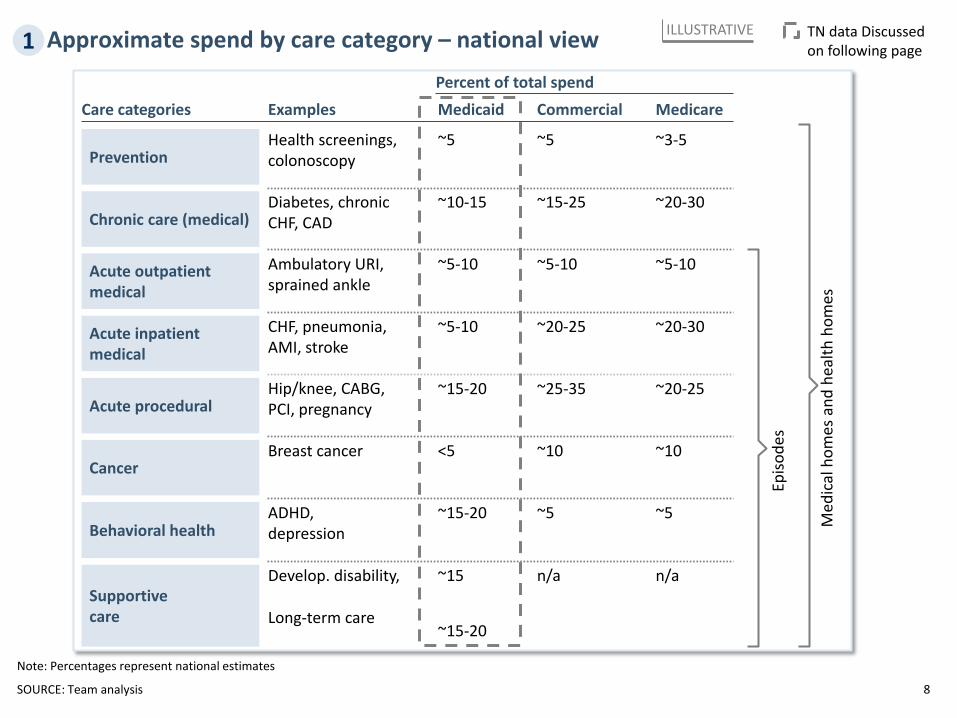
Approximate spend by care category – national view ILLUSTRATIVE 1
SOURCE: Team analysis
TN data Discussed on following page
Percent of total spend Medicaid Examples Commercial Medicare
Diabetes, chronic CHF, CAD
~15-25 ~10-15 ~20-30
Ambulatory URI, sprained ankle
~5-10 ~5-10 ~5-10 Acute outpatient medical
Acute inpatient medical
CHF, pneumonia, AMI, stroke
~20-25 ~5-10 ~20-30
Acute procedural Hip/knee, CABG, PCI, pregnancy
~25-35 ~15-20 ~20-25
Behavioral health ADHD, depression
~5 ~15-20 ~5
Supportive care
Develop. disability,
Long-term care
n/a ~15
~15-20
n/a
Chronic care (medical)
Prevention Health screenings, colonoscopy
~5 ~5 ~3-5
Cancer Breast cancer ~10 <5 ~10
Episo
des
Med
ical
hom
es a
nd h
ealth
hom
es
Care categories
Note: Percentages represent national estimates
9
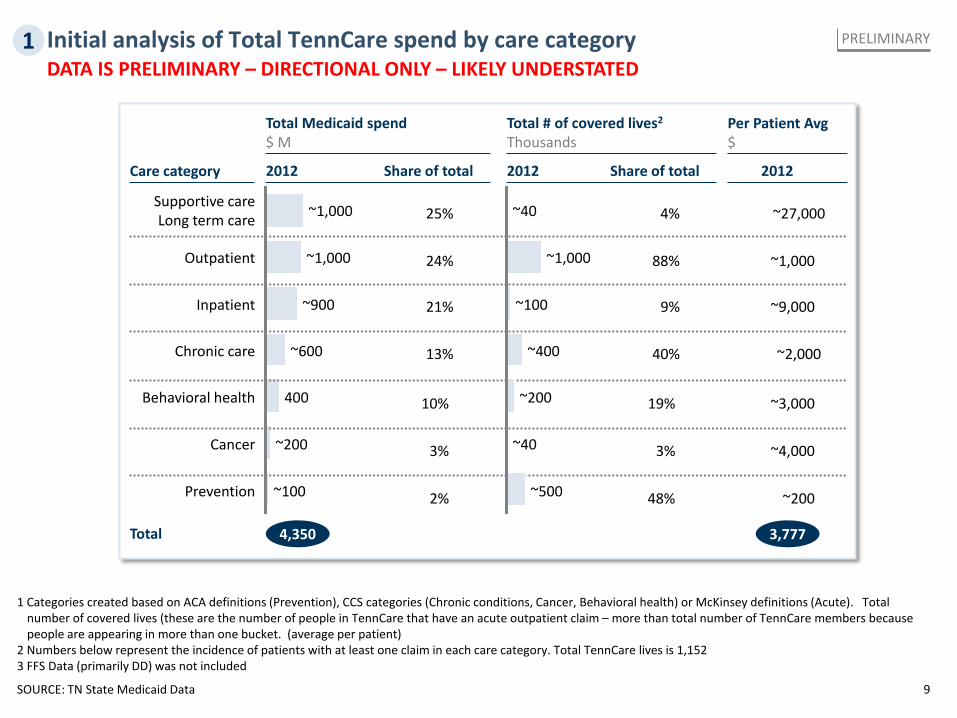
Initial analysis of Total TennCare spend by care category
SOURCE: TN State Medicaid Data
1 Categories created based on ACA definitions (Prevention), CCS categories (Chronic conditions, Cancer, Behavioral health) or McKinsey definitions (Acute). Total number of covered lives (these are the number of people in TennCare that have an acute outpatient claim – more than total number of TennCare members because people are appearing in more than one bucket. (average per patient)
2 Numbers below represent the incidence of patients with at least one claim in each care category. Total TennCare lives is 1,152 3 FFS Data (primarily DD) was not included
Total Medicaid spend $ M
~100
Cancer ~200
Behavioral health
Prevention
400
Chronic care ~600
Inpatient ~900
Outpatient ~1,000
Supportive care Long term care ~1,000
2012 Share of total
Total # of covered lives2
Thousands
4,350
25%
13%
21%
10%
3%
2%
2012 Share of total
3,777 Total
2012
Per Patient Avg $
Care category
24%
4%
9%
40%
19%
3%
88%
~27,000
~9,000
~2,000
~3,000
~4,000
~1,000
PRELIMINARY
48% ~200 ~500
~40
~100
~200
~400
~1,000
~40
1 DATA IS PRELIMINARY – DIRECTIONAL ONLY – LIKELY UNDERSTATED
10 SOURCE: TN Medicaid data, team analysis
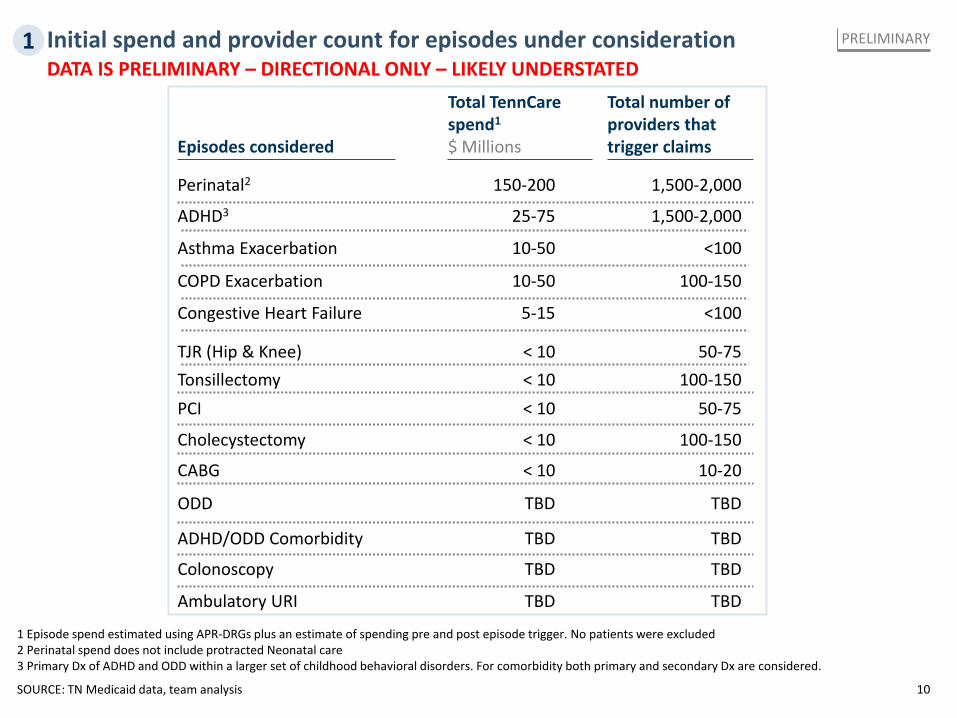
Initial spend and provider count for episodes under consideration PRELIMINARY
Total TennCare spend1
$ Millions
TBD
TBD
TBD
25-75
5-15
TBD
10-50
10-50
< 10
< 10
< 10
< 10
150-200
< 10
Total number of providers that trigger claims
TBD
TBD
TBD
1,500-2,000
<100
TBD
100-150
<100
50-75
100-150
50-75
1,500-2,000
100-150
Ambulatory URI
Colonoscopy
ODD
ADHD3
Congestive Heart Failure
ADHD/ODD Comorbidity
COPD Exacerbation
Asthma Exacerbation
PCI
Cholecystectomy
TJR (Hip & Knee)
CABG
Perinatal2
Tonsillectomy
Episodes considered
10-20
1 Episode spend estimated using APR-DRGs plus an estimate of spending pre and post episode trigger. No patients were excluded 2 Perinatal spend does not include protracted Neonatal care 3 Primary Dx of ADHD and ODD within a larger set of childhood behavioral disorders. For comorbidity both primary and secondary Dx are considered.
1 DATA IS PRELIMINARY – DIRECTIONAL ONLY – LIKELY UNDERSTATED
11
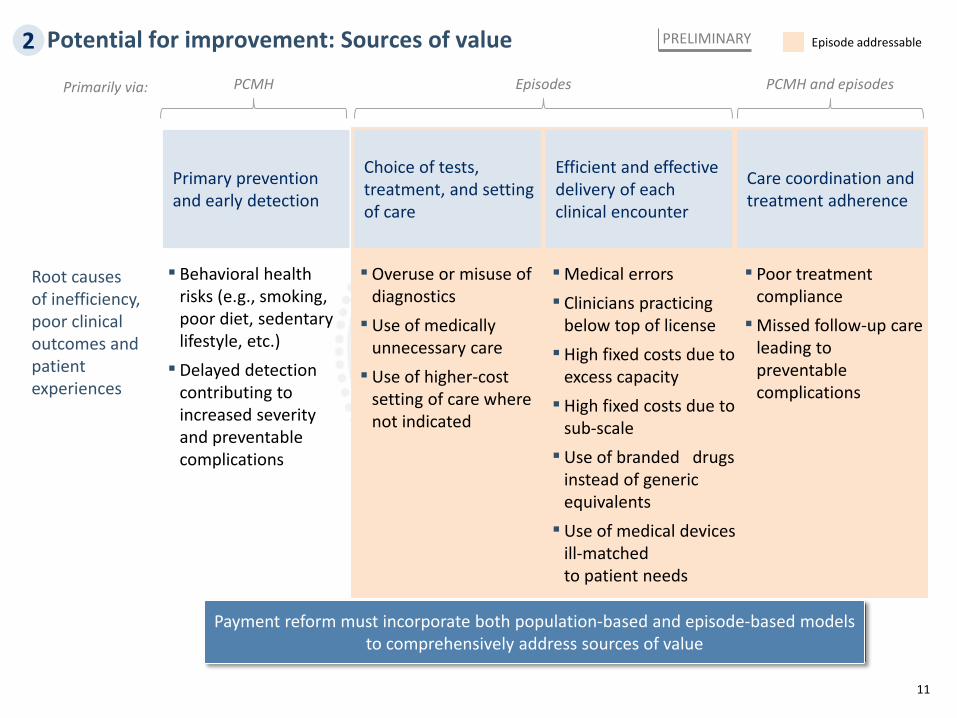
Potential for improvement: Sources of value
Primary prevention and early detection
Choice of tests, treatment, and setting of care
Efficient and effective delivery of each clinical encounter
Care coordination and treatment adherence
▪ Behavioral health risks (e.g., smoking, poor diet, sedentary lifestyle, etc.) ▪ Delayed detection
contributing to increased severity and preventable complications
▪Overuse or misuse of diagnostics ▪Use of medically
unnecessary care ▪Use of higher-cost
setting of care where not indicated
▪Medical errors ▪ Clinicians practicing
below top of license ▪ High fixed costs due to
excess capacity ▪ High fixed costs due to
sub-scale ▪Use of branded drugs
instead of generic equivalents ▪Use of medical devices
ill-matched to patient needs
▪ Poor treatment compliance ▪Missed follow-up care
leading to preventable complications
Root causes of inefficiency, poor clinical outcomes and patient experiences
Payment reform must incorporate both population-based and episode-based models to comprehensively address sources of value
PCMH PCMH and episodes Primarily via: Episodes
Episode addressable PRELIMINARY 2
12
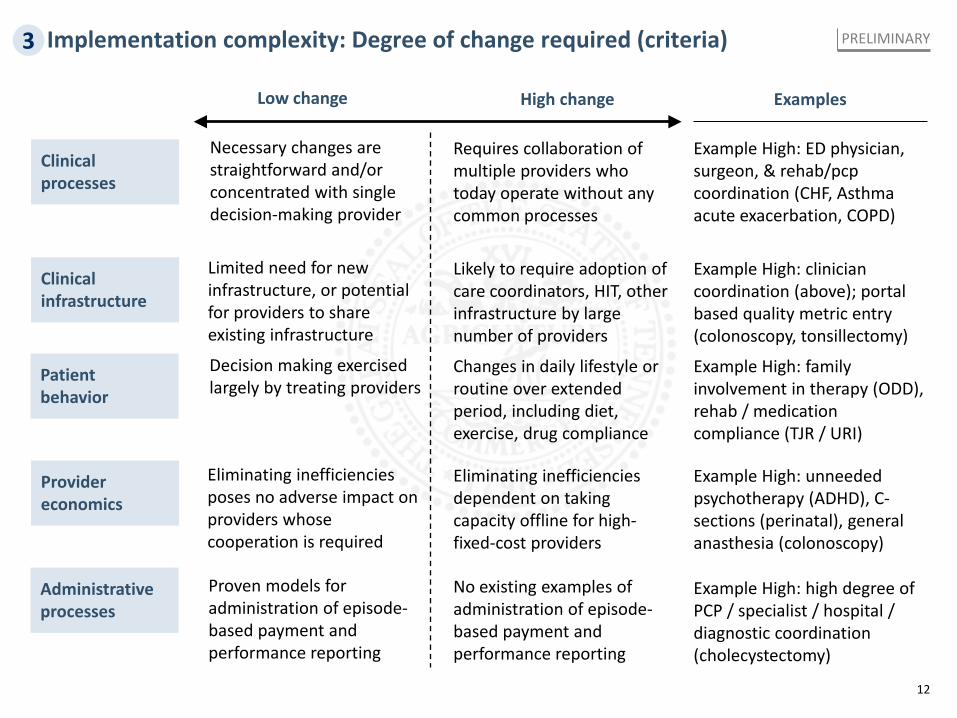
Implementation complexity: Degree of change required (criteria)
Clinical processes
Clinical infrastructure
Provider economics
Patient behavior
Administrative processes
Low change
Necessary changes are straightforward and/or concentrated with single decision-making provider
High change
Requires collaboration of multiple providers who today operate without any common processes
Limited need for new infrastructure, or potential for providers to share existing infrastructure
Likely to require adoption of care coordinators, HIT, other infrastructure by large number of providers
Decision making exercised largely by treating providers
Changes in daily lifestyle or routine over extended period, including diet, exercise, drug compliance
Eliminating inefficiencies poses no adverse impact on providers whose cooperation is required
Eliminating inefficiencies dependent on taking capacity offline for high-fixed-cost providers
Proven models for administration of episode-based payment and performance reporting
No existing examples of administration of episode-based payment and performance reporting
Examples
Example High: ED physician, surgeon, & rehab/pcp coordination (CHF, Asthma acute exacerbation, COPD)
Example High: clinician coordination (above); portal based quality metric entry (colonoscopy, tonsillectomy)
Example High: family involvement in therapy (ODD), rehab / medication compliance (TJR / URI)
Example High: unneeded psychotherapy (ADHD), C-sections (perinatal), general anasthesia (colonoscopy)
Example High: high degree of PCP / specialist / hospital / diagnostic coordination (cholecystectomy)
PRELIMINARY 3
13
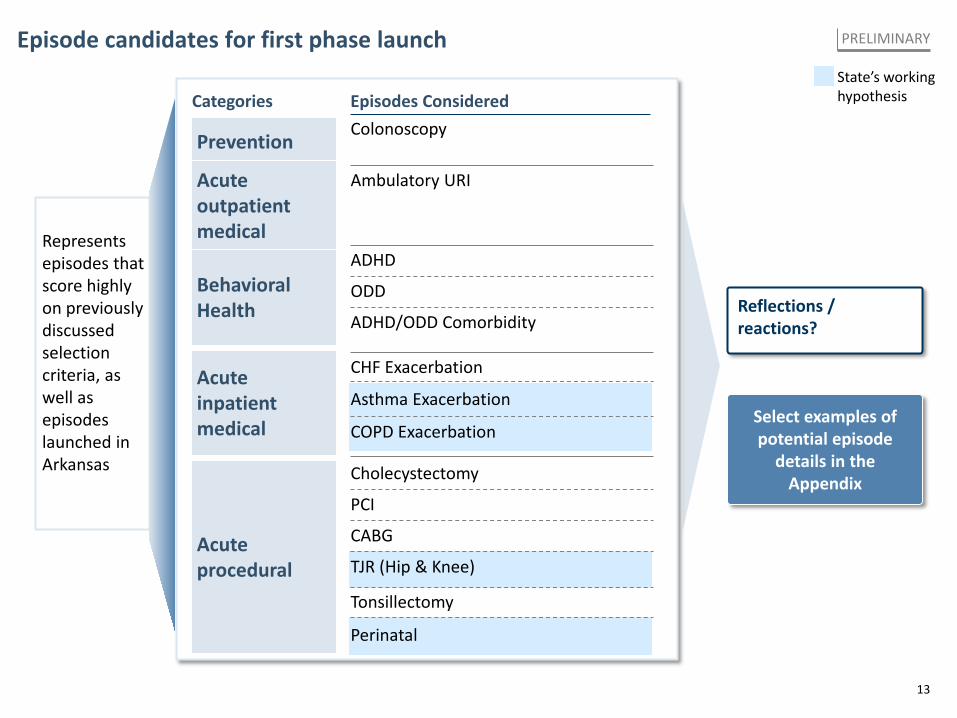
Episode candidates for first phase launch State’s working hypothesis
PRELIMINARY
Represents episodes that score highly on previously discussed selection criteria, as well as episodes launched in Arkansas
Reflections / reactions?
Categories
Behavioral Health
Acute procedural
Colonoscopy Prevention
Ambulatory URI Acute outpatient medical
ODD
ADHD
ADHD/ODD Comorbidity
CHF Exacerbation
Asthma Exacerbation
COPD Exacerbation
PCI
CABG
TJR (Hip & Knee)
Tonsillectomy
Cholecystectomy
Acute inpatient medical
Perinatal
Episodes Considered
Select examples of potential episode
details in the Appendix
14
Agenda for Provider Stakeholder Group meeting
Time Activity
▪ Episode TAG selection 14:00 - 14:20
▪ Approaches to obstacles – Episode design decisions 14:20 - 14:30
▪ PCMH approach and relevant case studies 14:30 - 14:50
▪ Episode selection 13:40 – 14:00
▪ Introductory Remarks 13:00 – 13:15
▪ Discussion & Next steps 14:50 - 15:00
▪ Overcoming barriers to reform activity 13:15 – 13:40
15
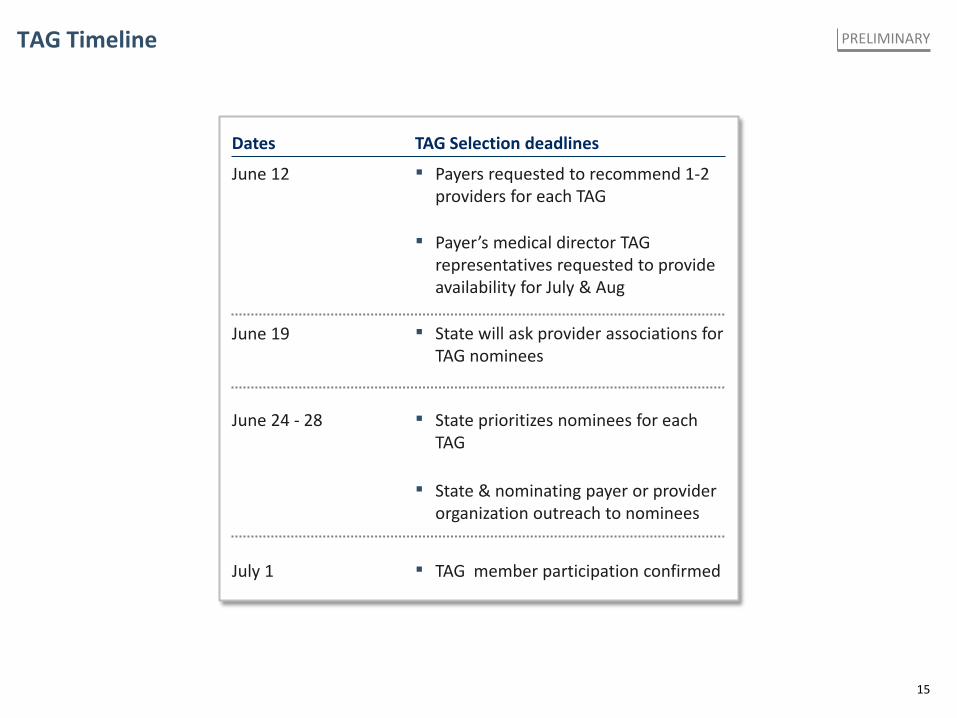
TAG Timeline PRELIMINARY
TAG Selection deadlines Dates
June 12 ▪ Payers requested to recommend 1-2 providers for each TAG
▪ Payer’s medical director TAG representatives requested to provide availability for July & Aug
▪ State will ask provider associations for TAG nominees
June 19
June 24 - 28 ▪ State prioritizes nominees for each TAG
▪ State & nominating payer or provider organization outreach to nominees
July 1 ▪ TAG member participation confirmed
16
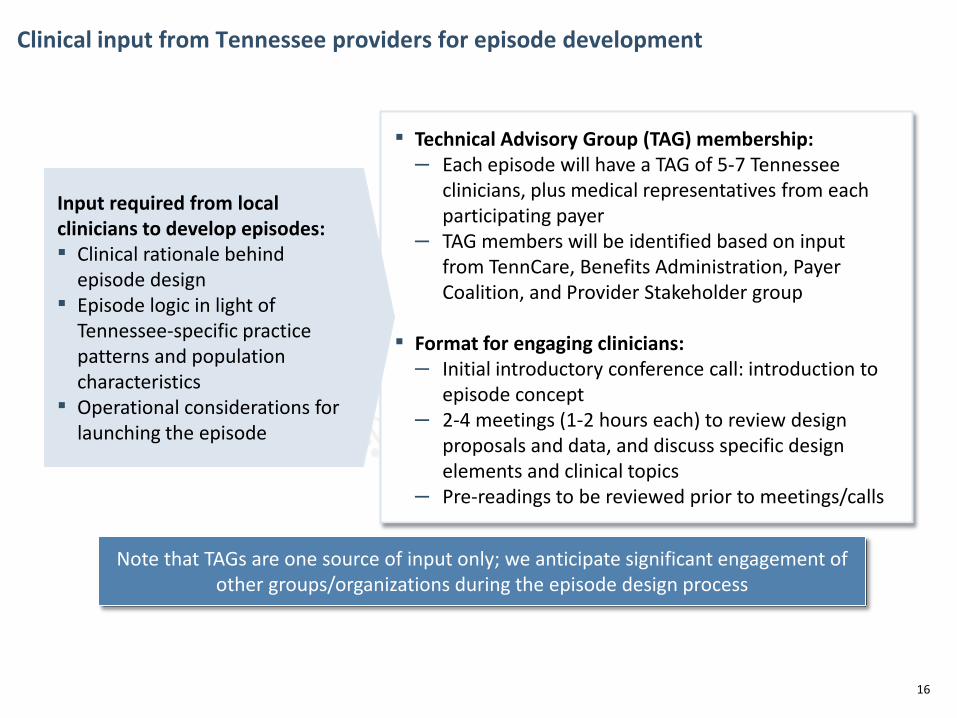
Clinical input from Tennessee providers for episode development
▪ Technical Advisory Group (TAG) membership: – Each episode will have a TAG of 5-7 Tennessee
clinicians, plus medical representatives from each participating payer
– TAG members will be identified based on input from TennCare, Benefits Administration, Payer Coalition, and Provider Stakeholder group
▪ Format for engaging clinicians:
– Initial introductory conference call: introduction to episode concept
– 2-4 meetings (1-2 hours each) to review design proposals and data, and discuss specific design elements and clinical topics
– Pre-readings to be reviewed prior to meetings/calls
Input required from local clinicians to develop episodes: ▪ Clinical rationale behind
episode design ▪ Episode logic in light of
Tennessee-specific practice patterns and population characteristics
▪ Operational considerations for launching the episode
Note that TAGs are one source of input only; we anticipate significant engagement of other groups/organizations during the episode design process
17
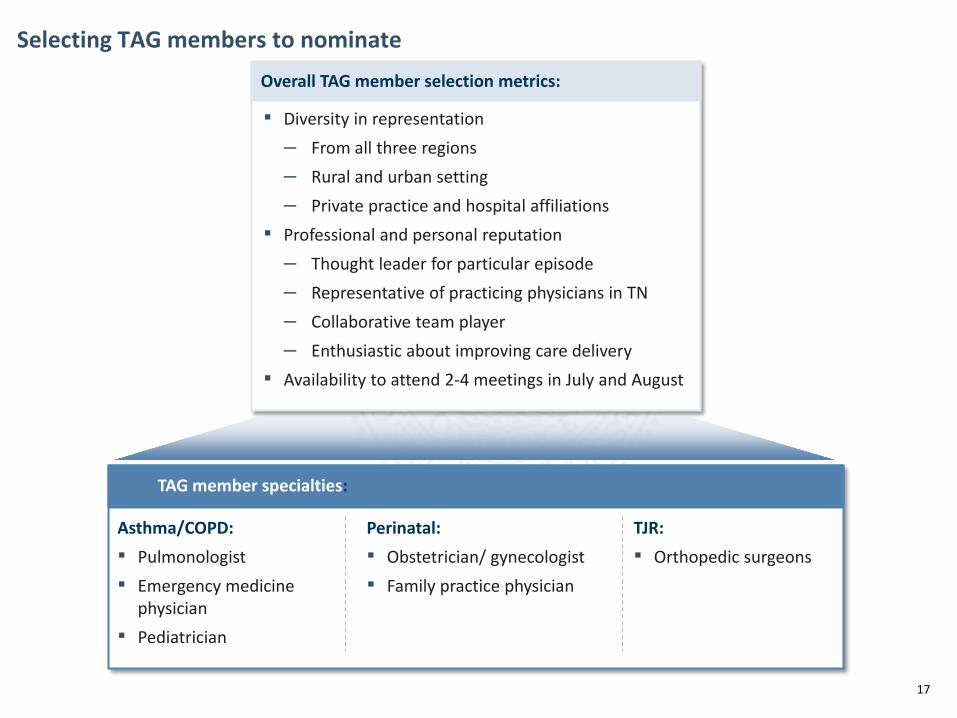
Selecting TAG members to nominate Overall TAG member selection metrics:
▪ Diversity in representation – From all three regions – Rural and urban setting – Private practice and hospital affiliations
▪ Professional and personal reputation – Thought leader for particular episode – Representative of practicing physicians in TN – Collaborative team player – Enthusiastic about improving care delivery
▪ Availability to attend 2-4 meetings in July and August
TAG member specialties:
Asthma/COPD: ▪ Pulmonologist ▪ Emergency medicine
physician ▪ Pediatrician
Perinatal: ▪ Obstetrician/ gynecologist ▪ Family practice physician
TJR: ▪ Orthopedic surgeons
18
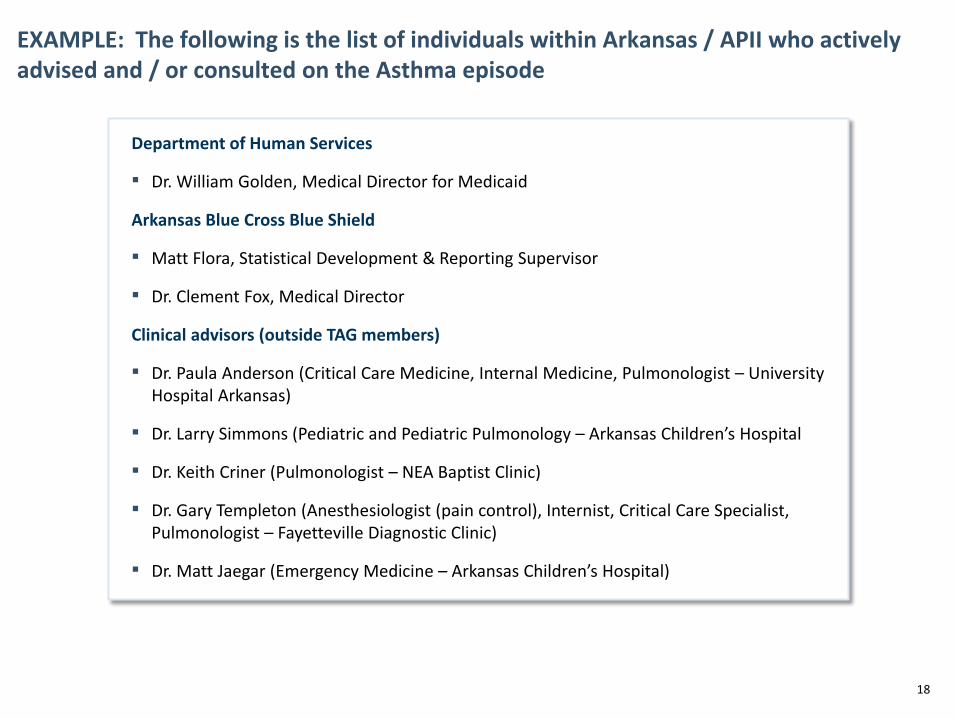
Department of Human Services
▪ Dr. William Golden, Medical Director for Medicaid
Arkansas Blue Cross Blue Shield
▪ Matt Flora, Statistical Development & Reporting Supervisor
▪ Dr. Clement Fox, Medical Director
Clinical advisors (outside TAG members)
▪ Dr. Paula Anderson (Critical Care Medicine, Internal Medicine, Pulmonologist – University Hospital Arkansas)
▪ Dr. Larry Simmons (Pediatric and Pediatric Pulmonology – Arkansas Children’s Hospital
▪ Dr. Keith Criner (Pulmonologist – NEA Baptist Clinic)
▪ Dr. Gary Templeton (Anesthesiologist (pain control), Internist, Critical Care Specialist, Pulmonologist – Fayetteville Diagnostic Clinic)
▪ Dr. Matt Jaegar (Emergency Medicine – Arkansas Children’s Hospital)
EXAMPLE: The following is the list of individuals within Arkansas / APII who actively advised and / or consulted on the Asthma episode
19
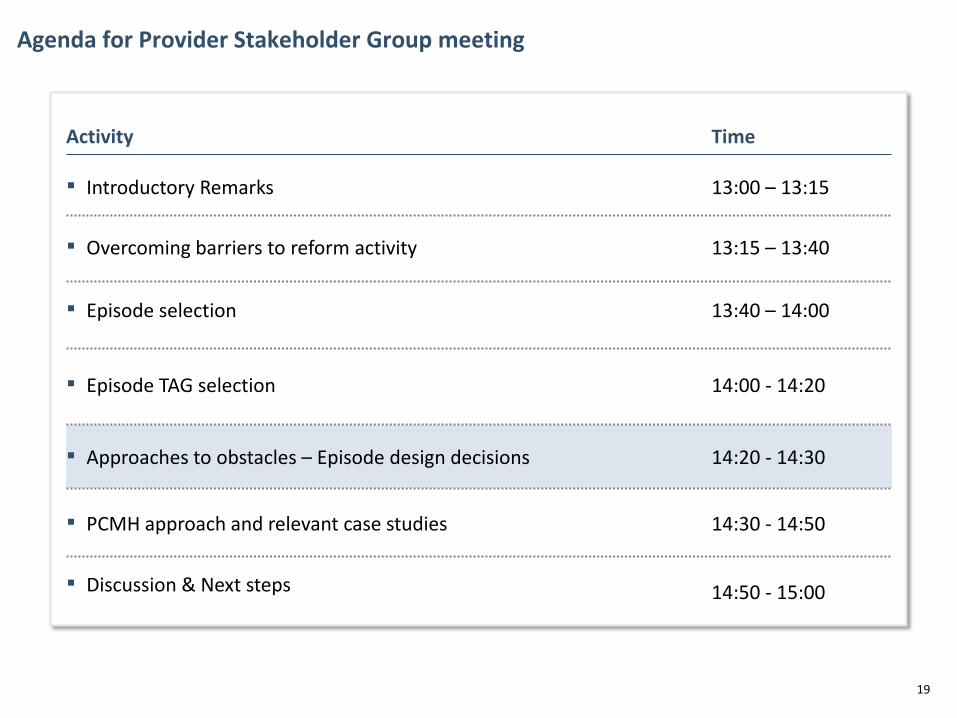
Agenda for Provider Stakeholder Group meeting
Time Activity
▪ Episode TAG selection 14:00 - 14:20
▪ Approaches to obstacles – Episode design decisions 14:20 - 14:30
▪ PCMH approach and relevant case studies 14:30 - 14:50
▪ Episode selection 13:40 – 14:00
▪ Introductory Remarks 13:00 – 13:15
▪ Discussion & Next steps 14:50 - 15:00
▪ Overcoming barriers to reform activity 13:15 – 13:40
20
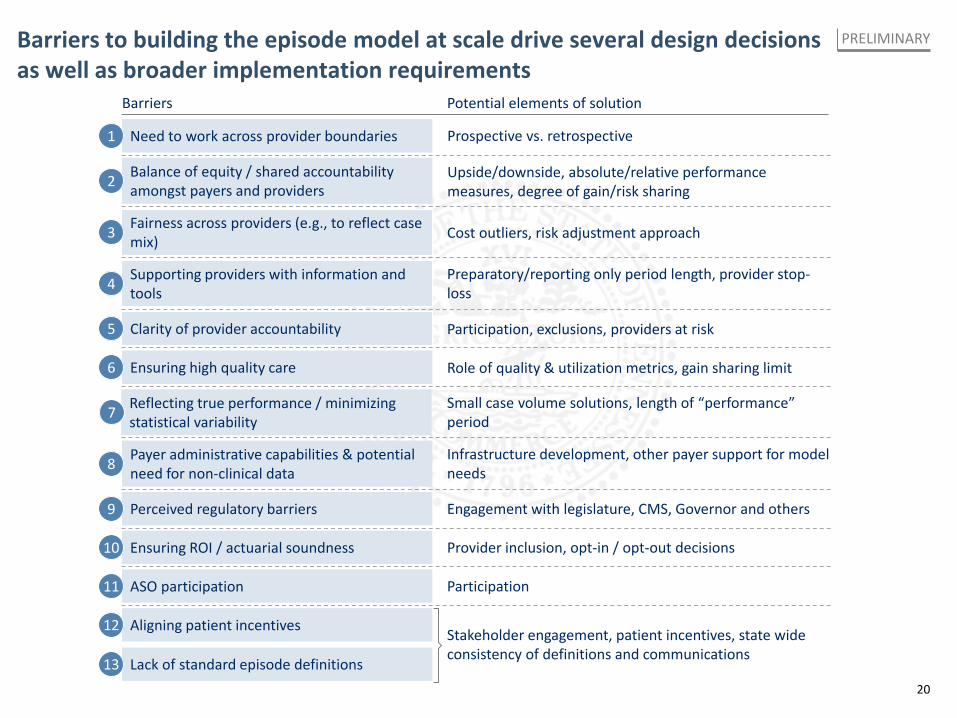
Barriers to building the episode model at scale drive several design decisions as well as broader implementation requirements
PRELIMINARY
Barriers Potential elements of solution
Prospective vs. retrospective Need to work across provider boundaries 1
Upside/downside, absolute/relative performance measures, degree of gain/risk sharing
Balance of equity / shared accountability amongst payers and providers 2
Cost outliers, risk adjustment approach Fairness across providers (e.g., to reflect case mix) 3
Preparatory/reporting only period length, provider stop-loss
Supporting providers with information and tools 4
Participation, exclusions, providers at risk Clarity of provider accountability 5
Role of quality & utilization metrics, gain sharing limit Ensuring high quality care 6
Infrastructure development, other payer support for model needs
Payer administrative capabilities & potential need for non-clinical data 8
Engagement with legislature, CMS, Governor and others Perceived regulatory barriers 9
ASO participation Participation
Provider inclusion, opt-in / opt-out decisions Ensuring ROI / actuarial soundness 10
Reflecting true performance / minimizing statistical variability 7 Small case volume solutions, length of “performance”
period
Stakeholder engagement, patient incentives, state wide consistency of definitions and communications
Aligning patient incentives 12
Lack of standard episode definitions 13
11
21
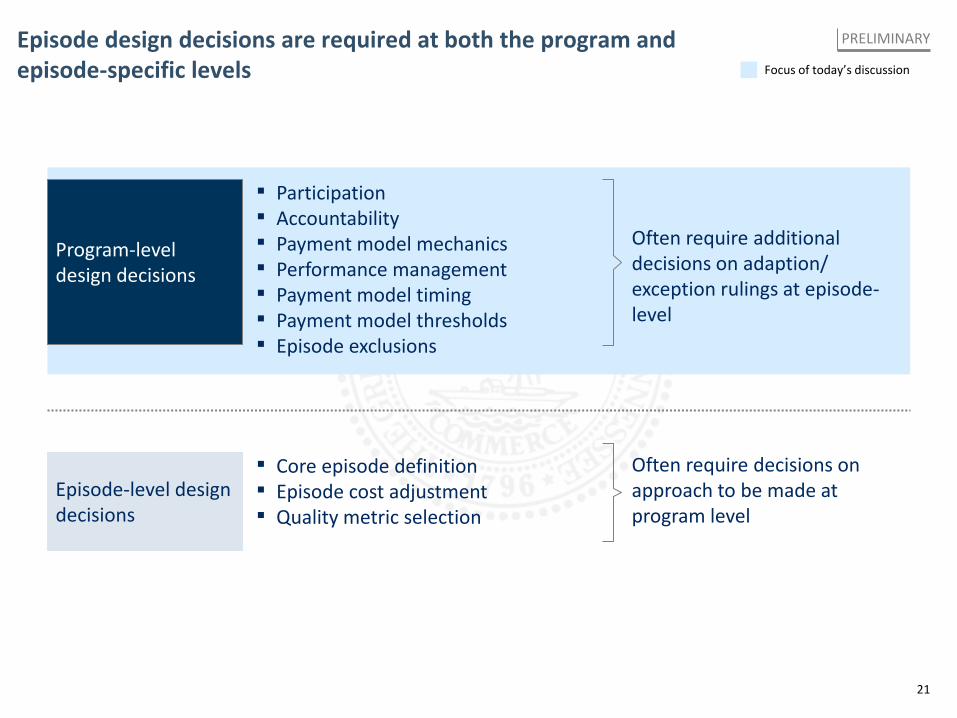
Episode design decisions are required at both the program and episode-specific levels
Program-level design decisions
Episode-level design decisions
▪ Participation ▪ Accountability ▪ Payment model mechanics ▪ Performance management ▪ Payment model timing ▪ Payment model thresholds ▪ Episode exclusions
▪ Core episode definition ▪ Episode cost adjustment ▪ Quality metric selection
Often require additional decisions on adaption/ exception rulings at episode-level
Often require decisions on approach to be made at program level
Focus of today’s discussion
PRELIMINARY
22
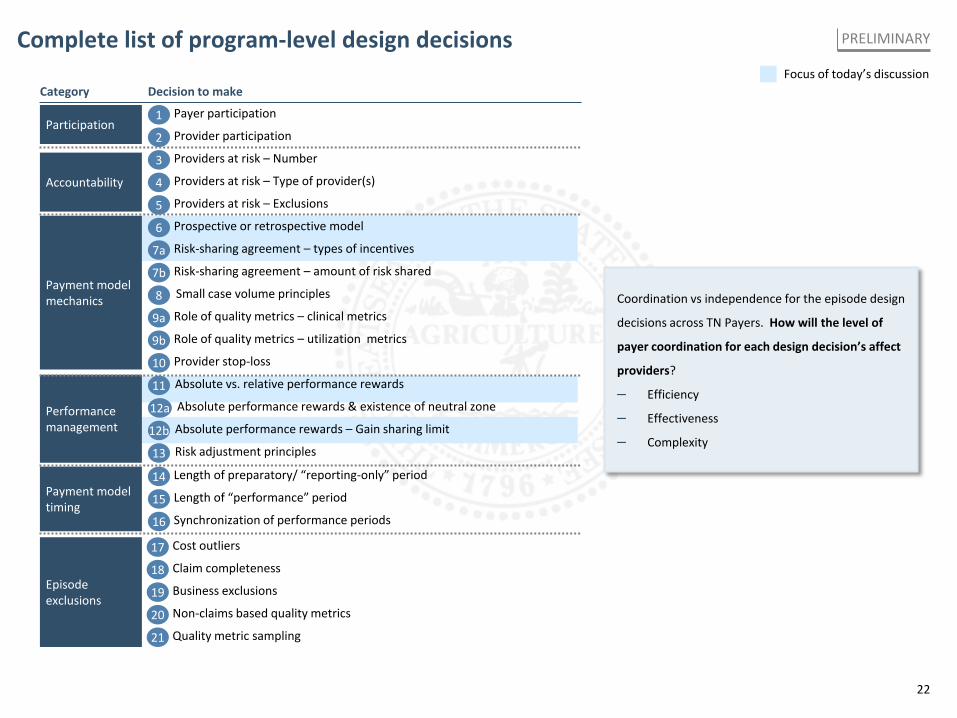
Complete list of program-level design decisions Focus of today’s discussion
PRELIMINARY
Coordination vs independence for the episode design
decisions across TN Payers. How will the level of
payer coordination for each design decision’s affect
providers?
– Efficiency
– Effectiveness
– Complexity
Category Decision to make
Accountability
Payment model timing
Performance management
Payment model mechanics
Participation Payer participation 1 Provider participation 2 Providers at risk – Number 3 Providers at risk – Type of provider(s) 4 Providers at risk – Exclusions 5
Risk-sharing agreement – types of incentives 7a Risk-sharing agreement – amount of risk shared 7b
Role of quality metrics – clinical metrics 9a Role of quality metrics – utilization metrics 9b
Prospective or retrospective model 6
Provider stop-loss 10
Small case volume principles 8
Absolute vs. relative performance rewards 11
Risk adjustment principles 13
Absolute performance rewards & existence of neutral zone 12a Absolute performance rewards – Gain sharing limit 12b
Length of “performance” period 15
Length of preparatory/ “reporting-only” period 14
Synchronization of performance periods 16
Episode exclusions
Claim completeness 18 Business exclusions 19
Cost outliers 17
Non-claims based quality metrics 20 Quality metric sampling 21
23
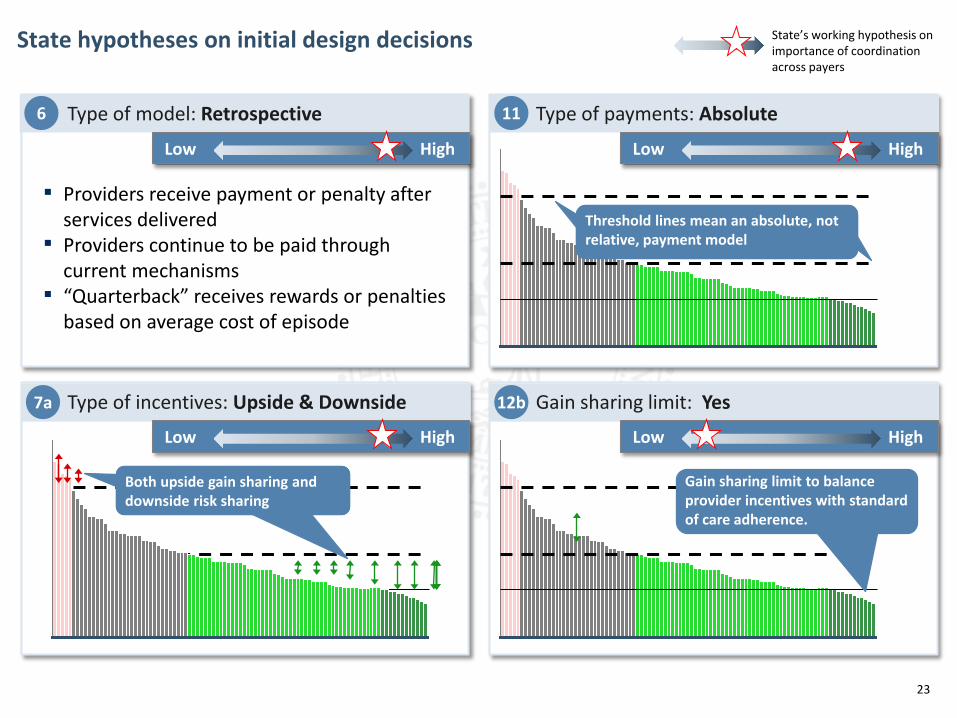
State hypotheses on initial design decisions
Gain sharing limit to balance provider incentives with standard of care adherence.
Both upside gain sharing and downside risk sharing
Threshold lines mean an absolute, not relative, payment model
11
12b 7a
Type of payments: Absolute
Gain sharing limit: Yes Type of incentives: Upside & Downside
6 Type of model: Retrospective
▪ Providers receive payment or penalty after services delivered
▪ Providers continue to be paid through current mechanisms
▪ “Quarterback” receives rewards or penalties based on average cost of episode
Low High
Low High
Low High
Low High
State’s working hypothesis on importance of coordination across payers
24
Agenda for Provider Stakeholder Group meeting
Time Activity
▪ Episode TAG selection 14:00 - 14:20
▪ Approaches to obstacles – Episode design decisions 14:20 - 14:30
▪ PCMH approach and relevant case studies 14:30 - 14:50
▪ Episode selection 13:40 – 14:00
▪ Introductory Remarks 13:00 – 13:15
▪ Discussion & Next steps 14:50 - 15:00
▪ Overcoming barriers to reform activity 13:15 – 13:40
25
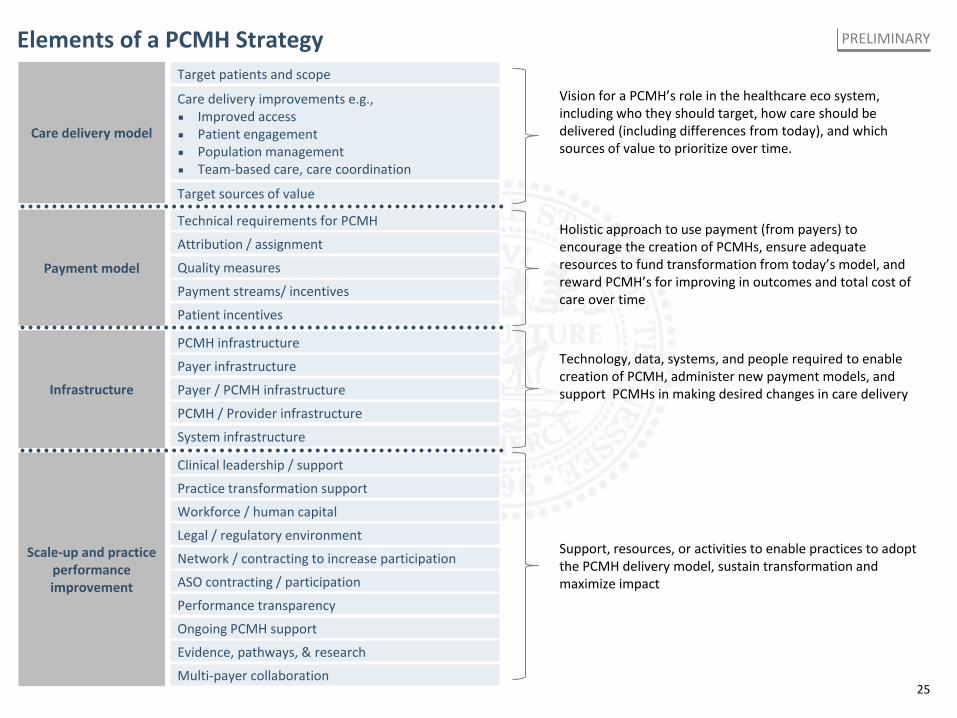
Elements of a PCMH Strategy PRELIMINARY
Vision for a PCMH’s role in the healthcare eco system, including who they should target, how care should be delivered (including differences from today), and which sources of value to prioritize over time.
Target patients and scope
Target sources of value
Care delivery improvements e.g., ▪ Improved access ▪ Patient engagement ▪ Population management ▪ Team-based care, care coordination
Care delivery model
Holistic approach to use payment (from payers) to encourage the creation of PCMHs, ensure adequate resources to fund transformation from today’s model, and reward PCMH’s for improving in outcomes and total cost of care over time
Technical requirements for PCMH
Payment streams/ incentives
Attribution / assignment
Patient incentives
Quality measures Payment model
Technology, data, systems, and people required to enable creation of PCMH, administer new payment models, and support PCMHs in making desired changes in care delivery Infrastructure
Payer infrastructure
PCMH infrastructure
Payer / PCMH infrastructure
PCMH / Provider infrastructure
System infrastructure
Support, resources, or activities to enable practices to adopt the PCMH delivery model, sustain transformation and maximize impact
Scale-up and practice performance improvement ASO contracting / participation
Network / contracting to increase participation
Workforce / human capital
Legal / regulatory environment
Clinical leadership / support
Practice transformation support
Performance transparency
Evidence, pathways, & research
Multi-payer collaboration
Ongoing PCMH support
26
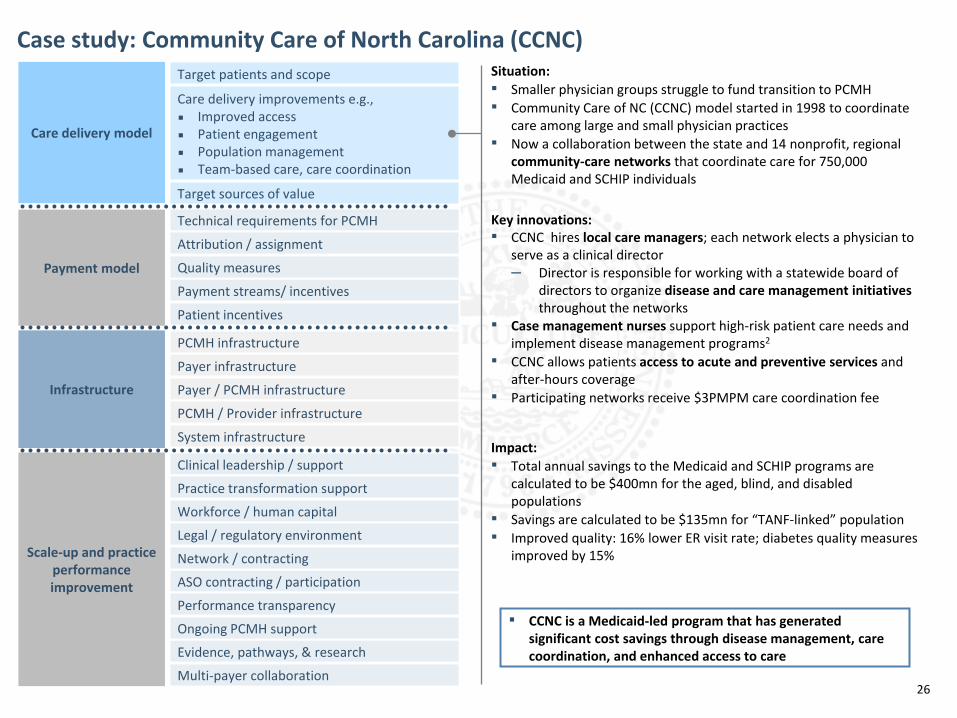
Case study: Community Care of North Carolina (CCNC) Target patients and scope
Target sources of value
Care delivery improvements e.g., ▪ Improved access ▪ Patient engagement ▪ Population management ▪ Team-based care, care coordination
Care delivery model
Technical requirements for PCMH
Payment streams/ incentives
Attribution / assignment
Patient incentives
Quality measures Payment model
Infrastructure
Payer infrastructure
PCMH infrastructure
Payer / PCMH infrastructure
PCMH / Provider infrastructure
System infrastructure
Scale-up and practice performance improvement ASO contracting / participation
Network / contracting
Workforce / human capital
Legal / regulatory environment
Clinical leadership / support
Practice transformation support
Performance transparency
Evidence, pathways, & research
Multi-payer collaboration
Ongoing PCMH support
Situation: ▪ Smaller physician groups struggle to fund transition to PCMH ▪ Community Care of NC (CCNC) model started in 1998 to coordinate
care among large and small physician practices ▪ Now a collaboration between the state and 14 nonprofit, regional
community-care networks that coordinate care for 750,000 Medicaid and SCHIP individuals
Key innovations: ▪ CCNC hires local care managers; each network elects a physician to
serve as a clinical director – Director is responsible for working with a statewide board of
directors to organize disease and care management initiatives throughout the networks
▪ Case management nurses support high-risk patient care needs and implement disease management programs2
▪ CCNC allows patients access to acute and preventive services and after-hours coverage
▪ Participating networks receive $3PMPM care coordination fee
Impact: ▪ Total annual savings to the Medicaid and SCHIP programs are
calculated to be $400mn for the aged, blind, and disabled populations
▪ Savings are calculated to be $135mn for “TANF-linked” population ▪ Improved quality: 16% lower ER visit rate; diabetes quality measures
improved by 15%
▪ CCNC is a Medicaid-led program that has generated significant cost savings through disease management, care coordination, and enhanced access to care
27
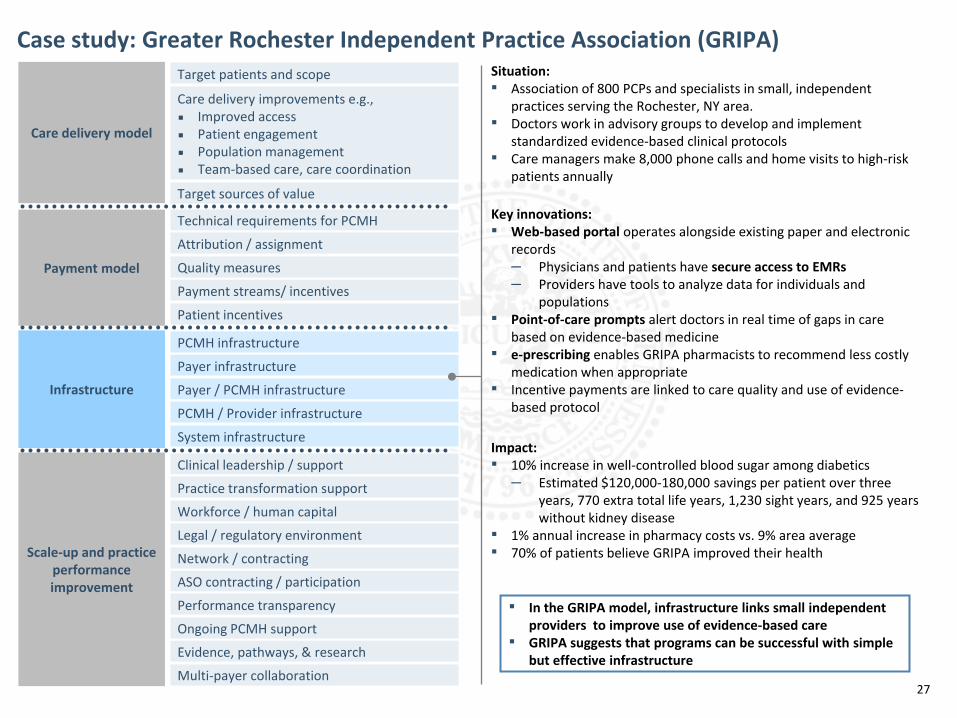
Case study: Greater Rochester Independent Practice Association (GRIPA) Target patients and scope
Target sources of value
Care delivery improvements e.g., ▪ Improved access ▪ Patient engagement ▪ Population management ▪ Team-based care, care coordination
Care delivery model
Technical requirements for PCMH
Payment streams/ incentives
Attribution / assignment
Patient incentives
Quality measures Payment model
Infrastructure
Payer infrastructure
PCMH infrastructure
Payer / PCMH infrastructure
PCMH / Provider infrastructure
System infrastructure
Scale-up and practice performance improvement ASO contracting / participation
Network / contracting
Workforce / human capital
Legal / regulatory environment
Clinical leadership / support
Practice transformation support
Performance transparency
Evidence, pathways, & research
Multi-payer collaboration
Ongoing PCMH support
Situation: ▪ Association of 800 PCPs and specialists in small, independent
practices serving the Rochester, NY area. ▪ Doctors work in advisory groups to develop and implement
standardized evidence-based clinical protocols ▪ Care managers make 8,000 phone calls and home visits to high-risk
patients annually
Key innovations: ▪ Web-based portal operates alongside existing paper and electronic
records – Physicians and patients have secure access to EMRs – Providers have tools to analyze data for individuals and
populations ▪ Point-of-care prompts alert doctors in real time of gaps in care
based on evidence-based medicine ▪ e-prescribing enables GRIPA pharmacists to recommend less costly
medication when appropriate ▪ Incentive payments are linked to care quality and use of evidence-
based protocol
Impact: ▪ 10% increase in well-controlled blood sugar among diabetics
– Estimated $120,000-180,000 savings per patient over three years, 770 extra total life years, 1,230 sight years, and 925 years without kidney disease
▪ 1% annual increase in pharmacy costs vs. 9% area average ▪ 70% of patients believe GRIPA improved their health
▪ In the GRIPA model, infrastructure links small independent providers to improve use of evidence-based care
▪ GRIPA suggests that programs can be successful with simple but effective infrastructure
28
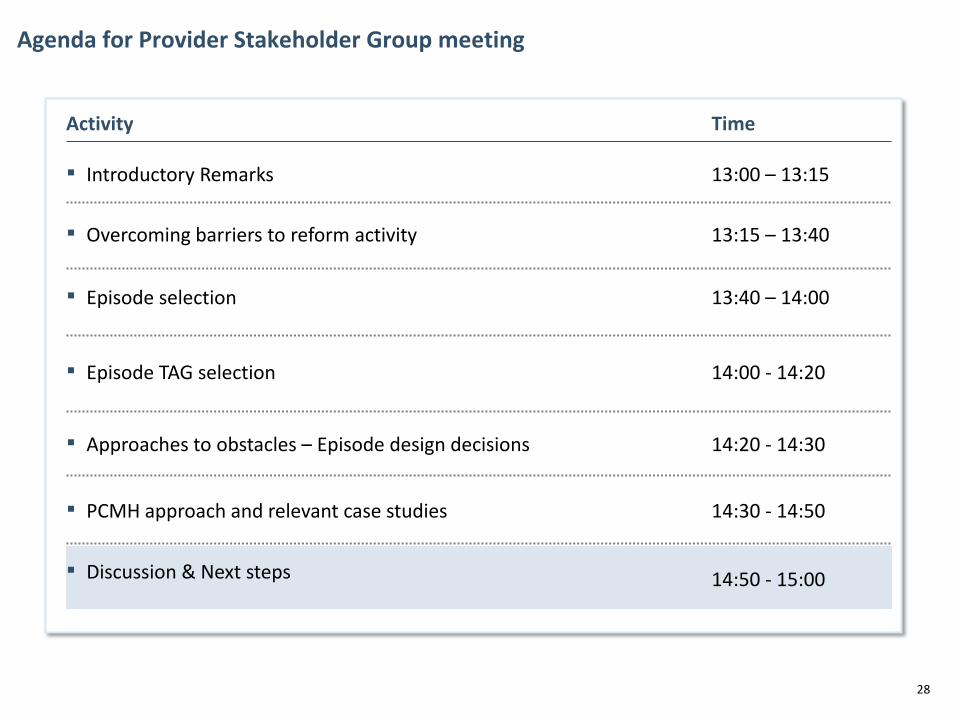
Agenda for Provider Stakeholder Group meeting
Time Activity
▪ Episode TAG selection 14:00 - 14:20
▪ Approaches to obstacles – Episode design decisions 14:20 - 14:30
▪ PCMH approach and relevant case studies 14:30 - 14:50
▪ Episode selection 13:40 – 14:00
▪ Introductory Remarks 13:00 – 13:15
▪ Discussion & Next steps 14:50 - 15:00
▪ Overcoming barriers to reform activity 13:15 – 13:40

29
Soliciting perspectives on the discussion so far
▪ What items discussed so far have you considered most important? What topics do you hope are discussed in the near future?
▪ What are your largest concerns / what do you think are the largest barriers to reform in Tennessee?
▪ What are your reflections on the episodes the state desires to pursue? Are there unique aspects of the selected episodes in Tennessee to be mindful of?
▪ Do any episode design elements discussed today give you pause?
▪ Where do you think payer coordination is more / least important?
▪ What are your thoughts on the timing goals for payment reform?
▪ How if at all can the State better engage with providers outside of this forum?
30
Other updates and housekeeping items
▪ First public roundtable meeting will be next week (Wednesday, 6/26)
▪ First employer stakeholder group meeting will be next week (Thursday, 6/27)
▪ Reminder to submit TAG nominees. (Email Brooks Daverman by end of week, Friday 6/21).
31
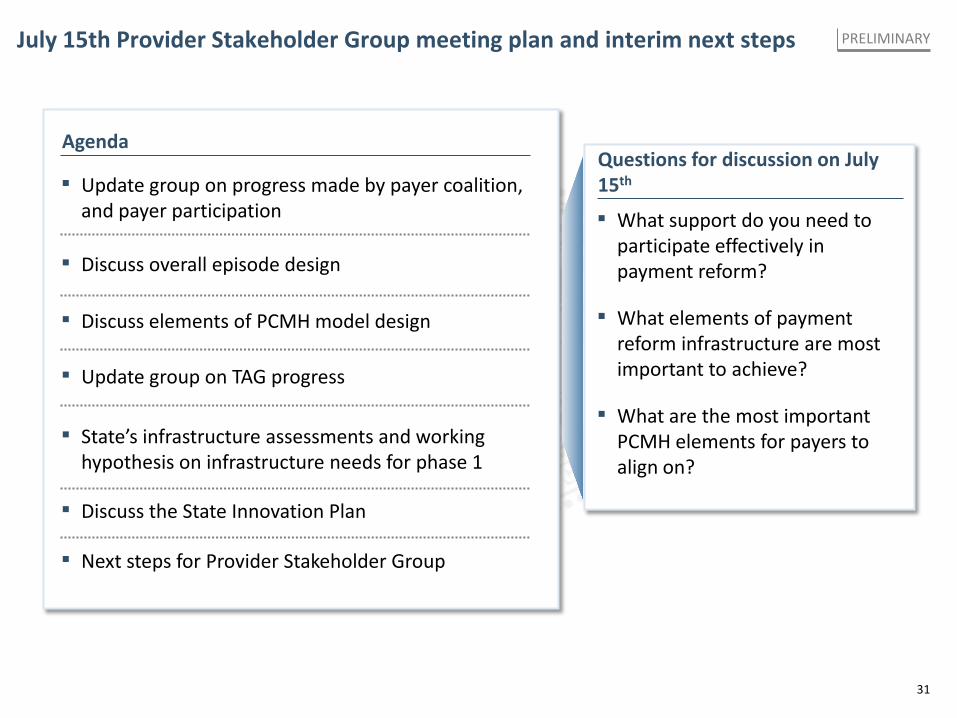
July 15th Provider Stakeholder Group meeting plan and interim next steps PRELIMINARY
Agenda
▪ Discuss elements of PCMH model design
▪ Update group on progress made by payer coalition, and payer participation
▪ State’s infrastructure assessments and working hypothesis on infrastructure needs for phase 1
▪ Discuss the State Innovation Plan
Questions for discussion on July 15th
▪ What support do you need to participate effectively in payment reform?
▪ What elements of payment reform infrastructure are most important to achieve?
▪ What are the most important PCMH elements for payers to align on?
▪ Update group on TAG progress
▪ Next steps for Provider Stakeholder Group
▪ Discuss overall episode design
Tennessee Payment Reform Initiative
Provider stakeholder group meeting
PRELIMINARY WORKING DRAFT, SUBJECT TO CHANGE
APPENDIX
June 19, 2013

34
Contents
▪ Appendix
– Asthma
– Perinatal
– TJR (Hip & Knee)
35
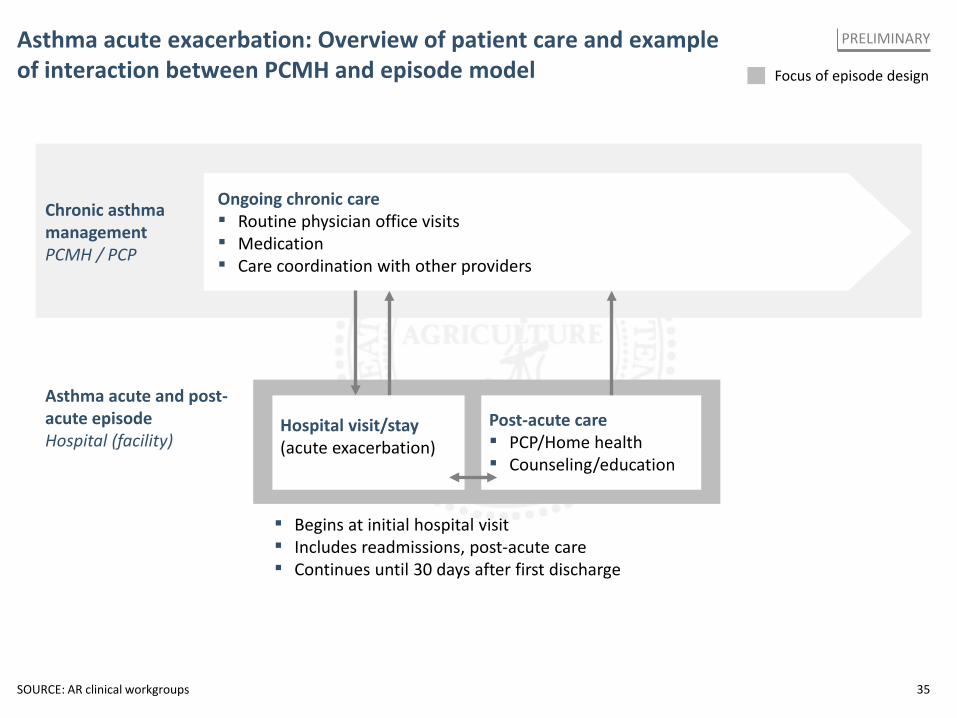
Asthma acute exacerbation: Overview of patient care and example of interaction between PCMH and episode model
SOURCE: AR clinical workgroups
Focus of episode design
PRELIMINARY
Hospital visit/stay (acute exacerbation)
Chronic asthma management PCMH / PCP
Ongoing chronic care ▪ Routine physician office visits ▪ Medication ▪ Care coordination with other providers
▪ Begins at initial hospital visit ▪ Includes readmissions, post-acute care ▪ Continues until 30 days after first discharge
Post-acute care ▪ PCP/Home health ▪ Counseling/education
Asthma acute and post-acute episode Hospital (facility)
36
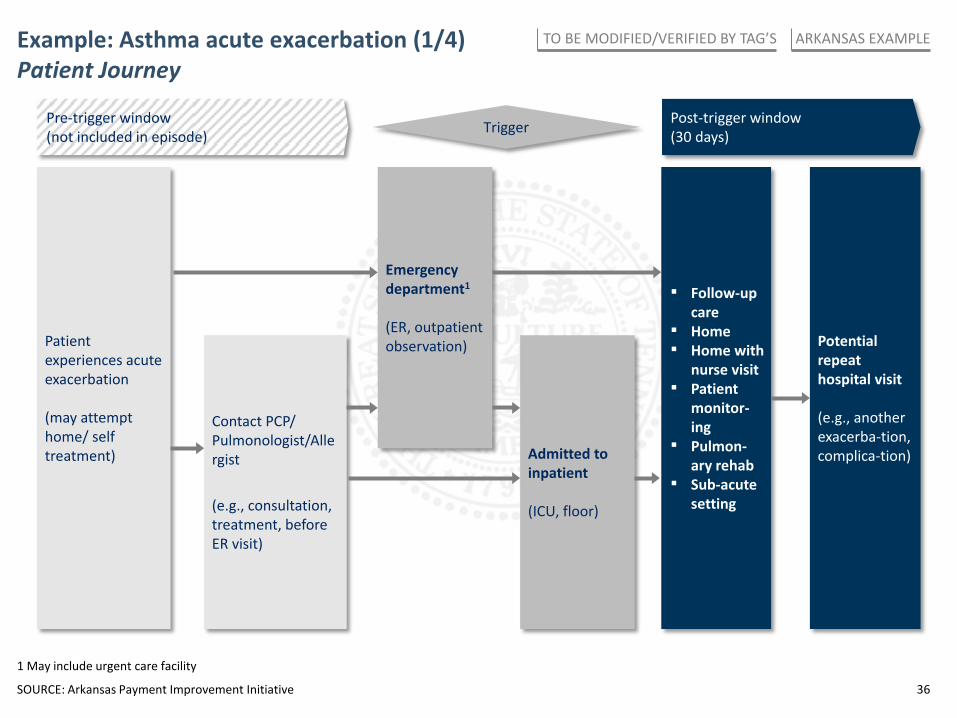
Example: Asthma acute exacerbation (1/4) Patient Journey
Post-trigger window (30 days)
Patient experiences acute exacerbation (may attempt home/ self treatment)
Potential repeat hospital visit (e.g., another exacerba-tion, complica-tion)
Trigger
Admitted to inpatient (ICU, floor)
Emergency department1 (ER, outpatient observation)
Contact PCP/ Pulmonologist/Allergist (e.g., consultation, treatment, before ER visit)
Pre-trigger window (not included in episode)
SOURCE: Arkansas Payment Improvement Initiative
1 May include urgent care facility
ARKANSAS EXAMPLE TO BE MODIFIED/VERIFIED BY TAG’S
▪ Follow-up care
▪ Home ▪ Home with
nurse visit ▪ Patient
monitor-ing
▪ Pulmon-ary rehab
▪ Sub-acute setting
37
▪ Follow-up care
▪ Home ▪ Home with
nurse visit ▪ Patient
monitor-ing
▪ Pulmon-ary rehab
▪ Sub-acute setting
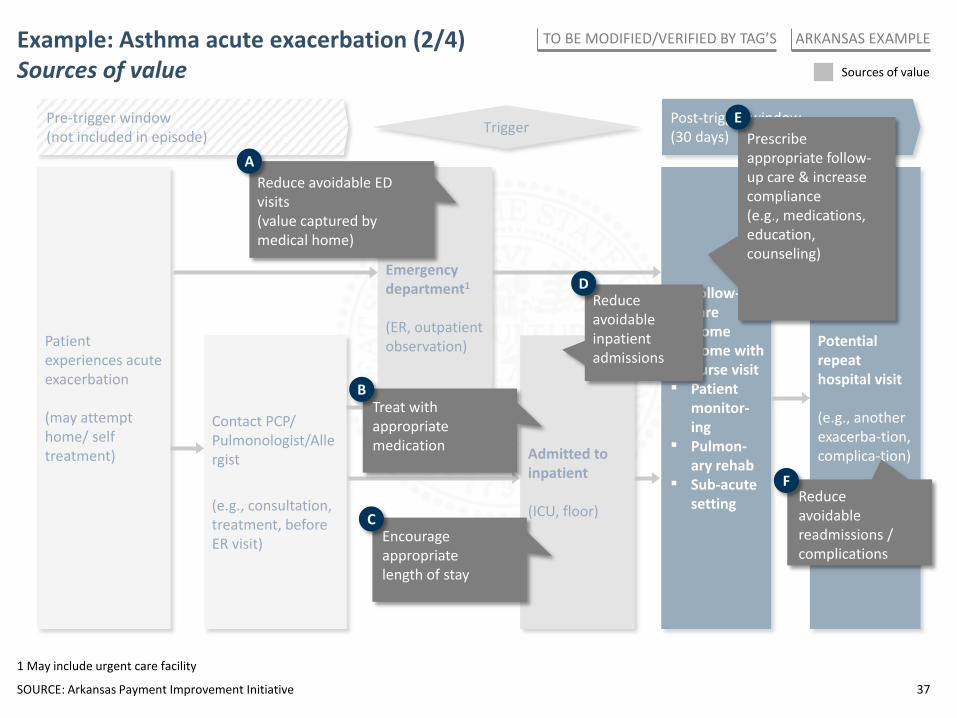
Example: Asthma acute exacerbation (2/4) Sources of value
Post-trigger window (30 days)
Patient experiences acute exacerbation (may attempt home/ self treatment)
Potential repeat hospital visit (e.g., another exacerba-tion, complica-tion)
Trigger
Admitted to inpatient (ICU, floor)
Emergency department1 (ER, outpatient observation)
Contact PCP/ Pulmonologist/Allergist (e.g., consultation, treatment, before ER visit)
Pre-trigger window (not included in episode)
Sources of value
SOURCE: Arkansas Payment Improvement Initiative
1 May include urgent care facility
ARKANSAS EXAMPLE TO BE MODIFIED/VERIFIED BY TAG’S
Prescribe appropriate follow-up care & increase compliance (e.g., medications, education, counseling)
E
Reduce avoidable readmissions / complications
F
Reduce avoidable inpatient admissions
D
Treat with appropriate medication
B
Encourage appropriate length of stay
C
Reduce avoidable ED visits (value captured by medical home)
A
38
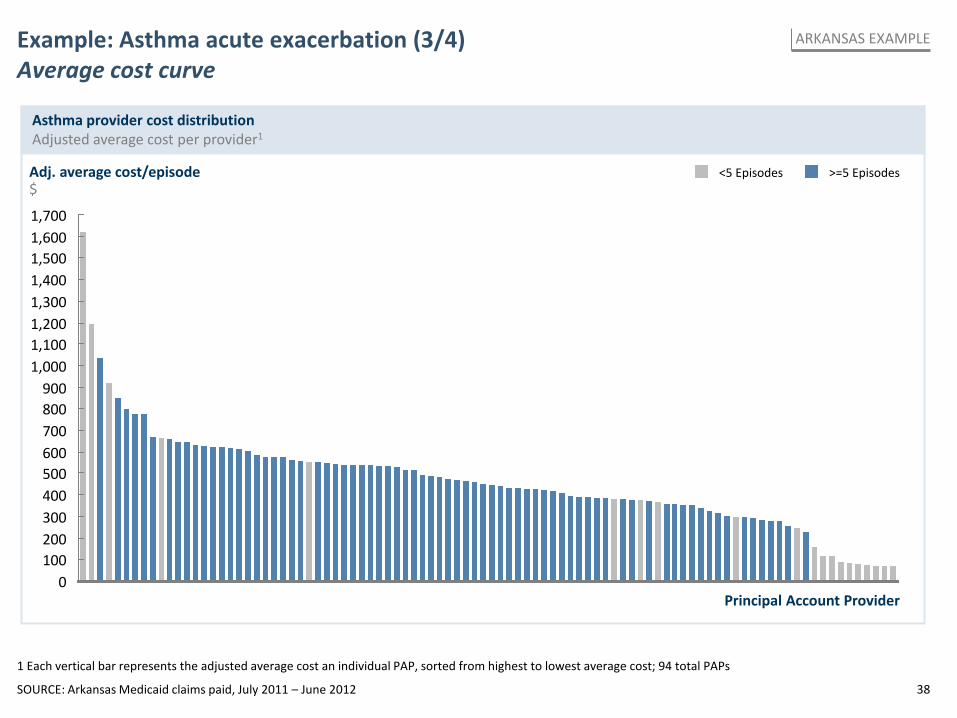
0100200300400500600700800900
1,0001,1001,2001,3001,4001,5001,6001,700
Adj. average cost/episode $
Principal Account Provider
1 Each vertical bar represents the adjusted average cost an individual PAP, sorted from highest to lowest average cost; 94 total PAPs
Example: Asthma acute exacerbation (3/4) Average cost curve
Asthma provider cost distribution Adjusted average cost per provider1
SOURCE: Arkansas Medicaid claims paid, July 2011 – June 2012
>=5 Episodes <5 Episodes
ARKANSAS EXAMPLE
39
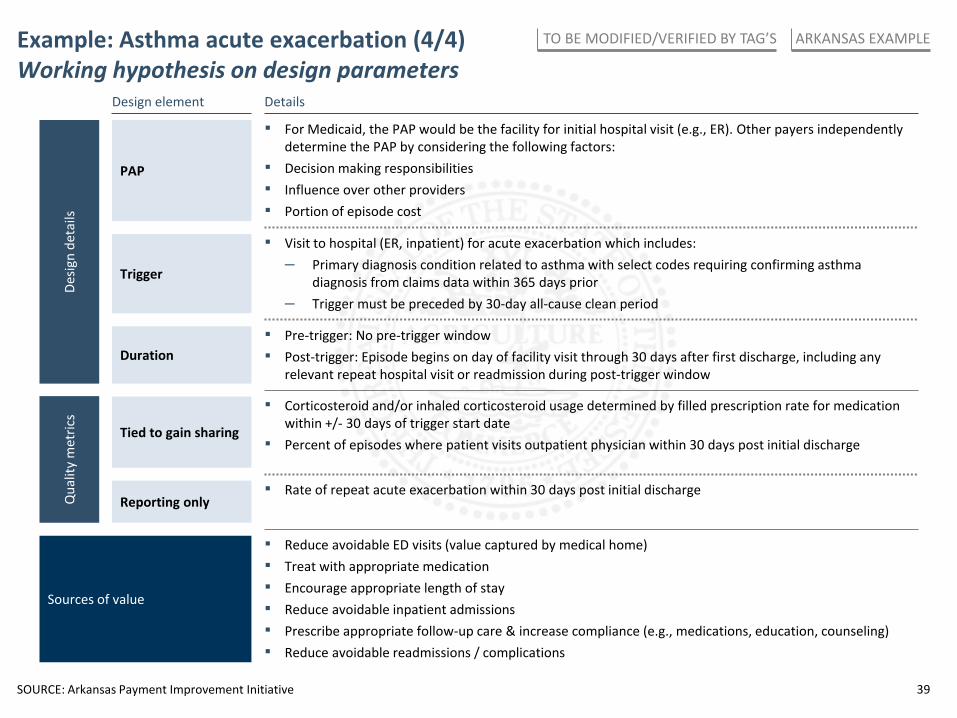
Example: Asthma acute exacerbation (4/4) Working hypothesis on design parameters
Trigger
▪ Visit to hospital (ER, inpatient) for acute exacerbation which includes: – Primary diagnosis condition related to asthma with select codes requiring confirming asthma
diagnosis from claims data within 365 days prior – Trigger must be preceded by 30-day all-cause clean period
Sources of value
▪ Reduce avoidable ED visits (value captured by medical home) ▪ Treat with appropriate medication ▪ Encourage appropriate length of stay ▪ Reduce avoidable inpatient admissions ▪ Prescribe appropriate follow-up care & increase compliance (e.g., medications, education, counseling) ▪ Reduce avoidable readmissions / complications
▪ For Medicaid, the PAP would be the facility for initial hospital visit (e.g., ER). Other payers independently determine the PAP by considering the following factors:
▪ Decision making responsibilities ▪ Influence over other providers ▪ Portion of episode cost
PAP
Duration ▪ Pre-trigger: No pre-trigger window ▪ Post-trigger: Episode begins on day of facility visit through 30 days after first discharge, including any
relevant repeat hospital visit or readmission during post-trigger window
▪ Corticosteroid and/or inhaled corticosteroid usage determined by filled prescription rate for medication within +/- 30 days of trigger start date
▪ Percent of episodes where patient visits outpatient physician within 30 days post initial discharge Tied to gain sharing
Reporting only ▪ Rate of repeat acute exacerbation within 30 days post initial discharge
Design element Details
Qua
lity
met
rics
Desig
n de
tails
ARKANSAS EXAMPLE TO BE MODIFIED/VERIFIED BY TAG’S
SOURCE: Arkansas Payment Improvement Initiative
40
Contents
▪ Appendix
– Asthma
– Perinatal
– TJR (Hip & Knee)
41
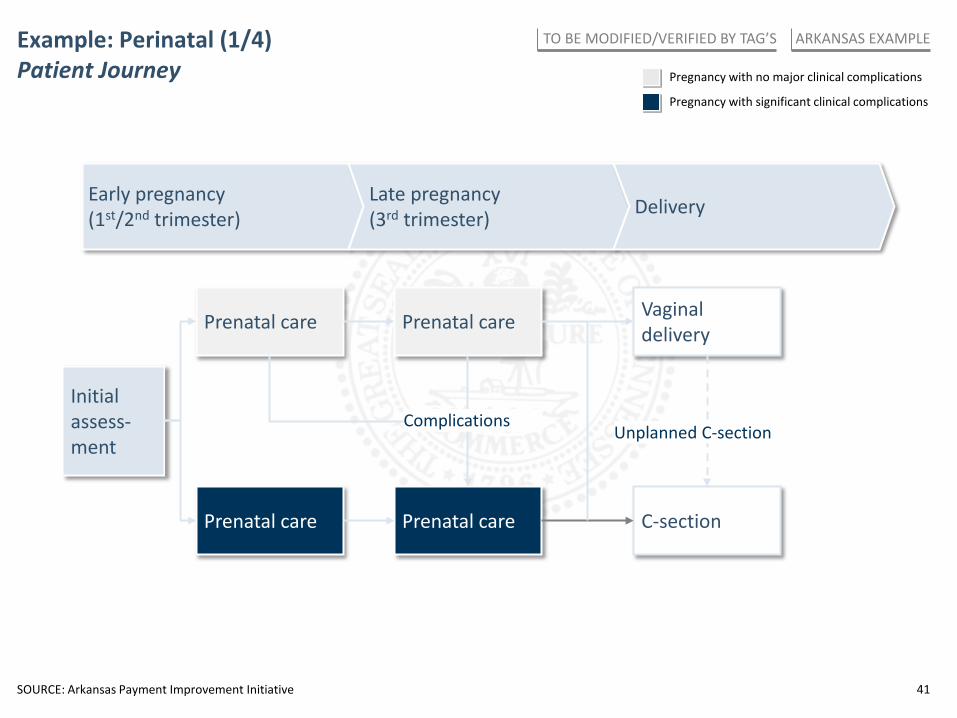
Example: Perinatal (1/4) Patient Journey Pregnancy with no major clinical complications
Pregnancy with significant clinical complications
Early pregnancy (1st/2nd trimester)
Late pregnancy (3rd trimester) Delivery
Prenatal care Prenatal care
Prenatal care Prenatal care
Initial assess-ment
Vaginal delivery
C-section
Complications Unplanned C-section
SOURCE: Arkansas Payment Improvement Initiative
ARKANSAS EXAMPLE TO BE MODIFIED/VERIFIED BY TAG’S
42
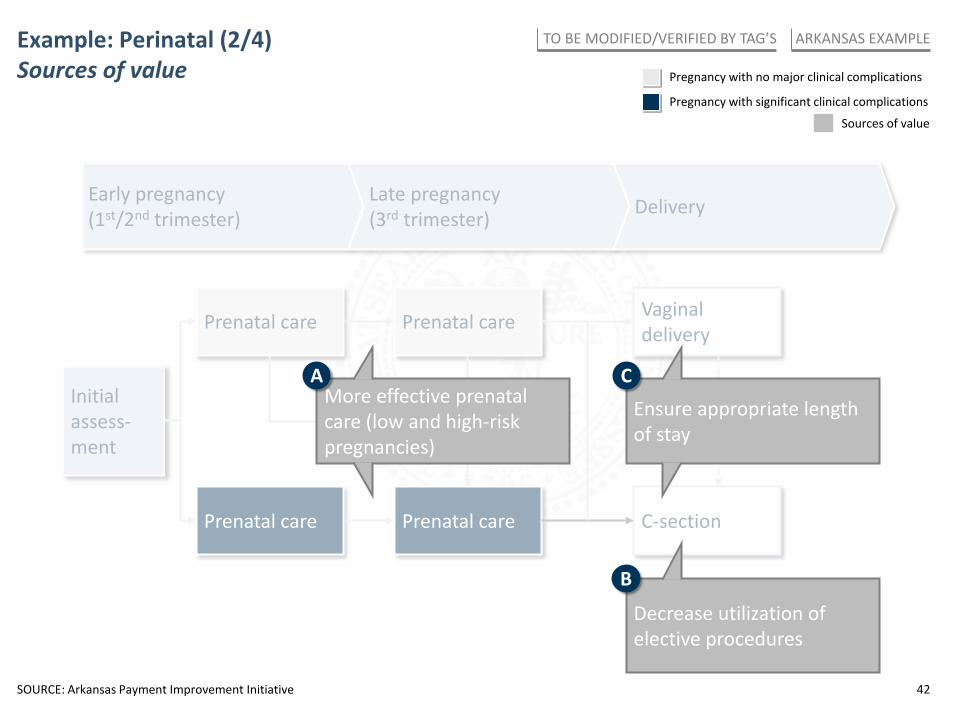
Example: Perinatal (2/4) Sources of value
Early pregnancy (1st/2nd trimester)
Late pregnancy (3rd trimester) Delivery
Prenatal care Prenatal care
Prenatal care Prenatal care
Initial assess-ment
Vaginal delivery
C-section
Complications Unplanned C-section
Sources of value
SOURCE: Arkansas Payment Improvement Initiative
ARKANSAS EXAMPLE TO BE MODIFIED/VERIFIED BY TAG’S
Decrease utilization of elective procedures
Ensure appropriate length of stay
More effective prenatal care (low and high-risk pregnancies)
A C
B
Pregnancy with no major clinical complications
Pregnancy with significant clinical complications
43
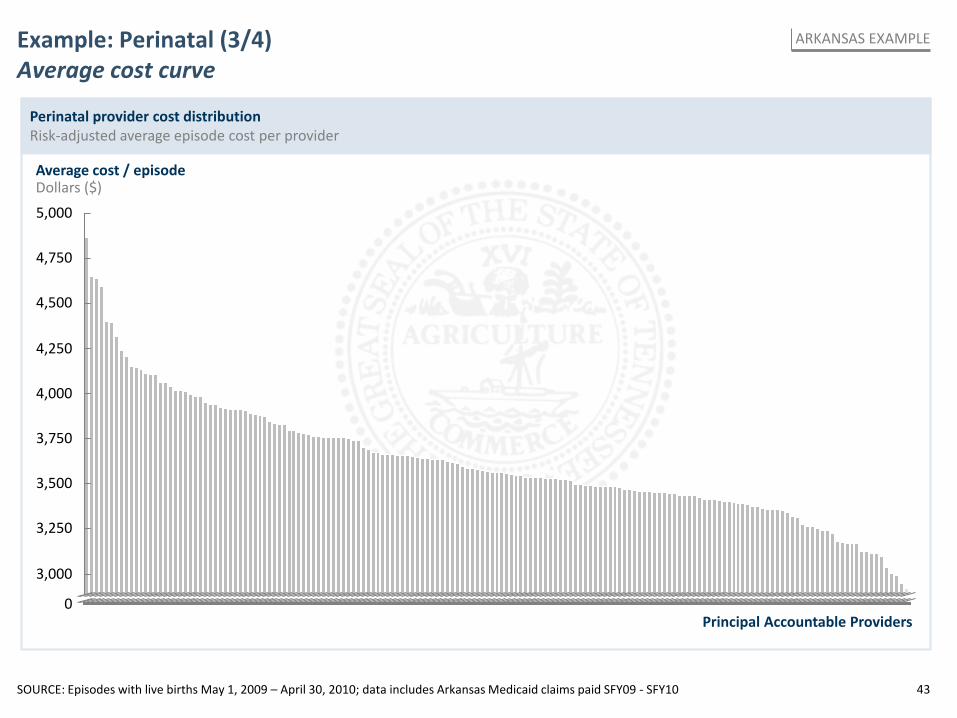
Example: Perinatal (3/4) Average cost curve
Perinatal provider cost distribution Risk-adjusted average episode cost per provider
Average cost / episode Dollars ($)
3,250
3,750
4,500
3,000
Principal Accountable Providers
4,750
4,000
3,500
5,000
0
4,250
SOURCE: Episodes with live births May 1, 2009 – April 30, 2010; data includes Arkansas Medicaid claims paid SFY09 - SFY10
ARKANSAS EXAMPLE
44
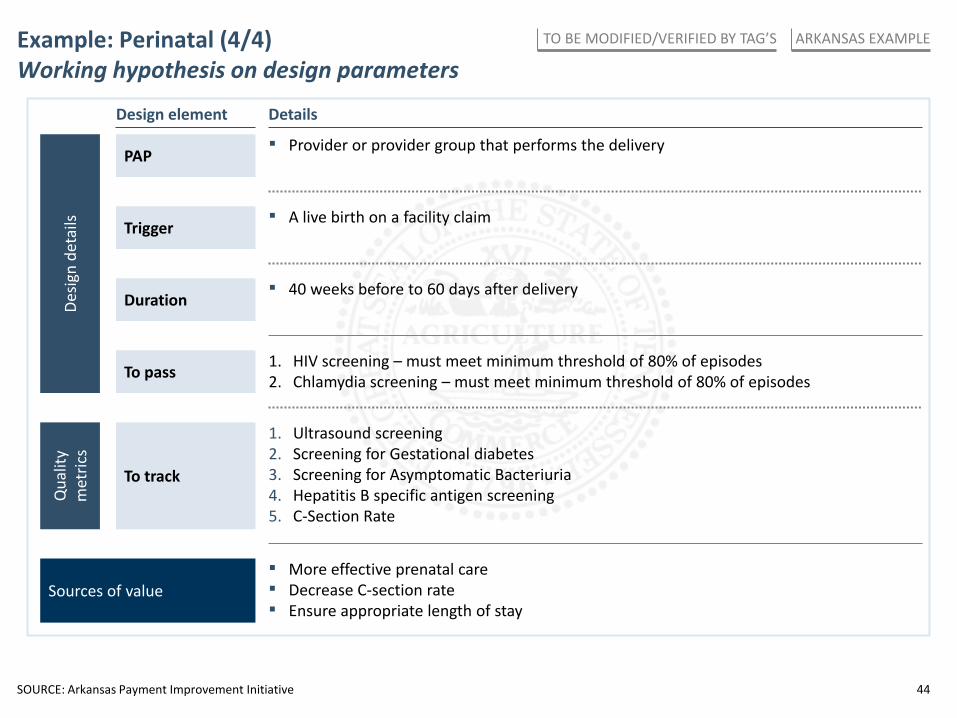
Example: Perinatal (4/4) Working hypothesis on design parameters
Sources of value ▪ More effective prenatal care ▪ Decrease C-section rate ▪ Ensure appropriate length of stay
Trigger ▪ A live birth on a facility claim
▪ Provider or provider group that performs the delivery PAP
▪ 40 weeks before to 60 days after delivery Duration
1. HIV screening – must meet minimum threshold of 80% of episodes 2. Chlamydia screening – must meet minimum threshold of 80% of episodes To pass
To track
1. Ultrasound screening 2. Screening for Gestational diabetes 3. Screening for Asymptomatic Bacteriuria 4. Hepatitis B specific antigen screening 5. C-Section Rate
Design element Details
Qua
lity
met
rics
Desig
n de
tails
SOURCE: Arkansas Payment Improvement Initiative
ARKANSAS EXAMPLE TO BE MODIFIED/VERIFIED BY TAG’S
45
Contents
▪ Appendix
– Asthma
– Perinatal
– TJR (Hip & Knee)
46
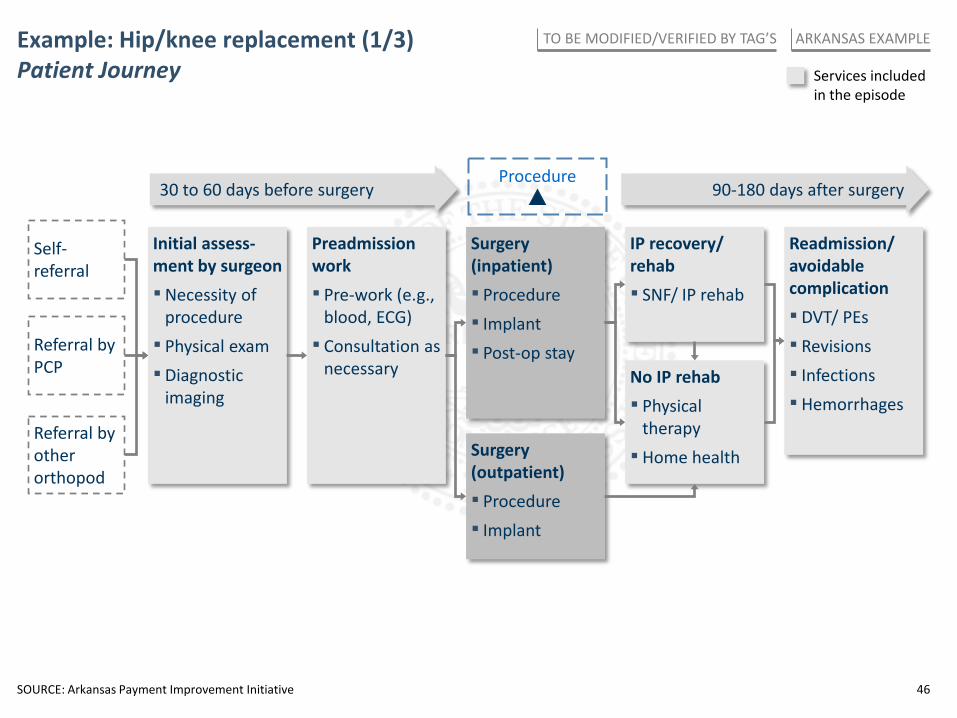
Example: Hip/knee replacement (1/3) Patient Journey Services included
in the episode
Self-referral
Initial assess-ment by surgeon ▪Necessity of
procedure ▪ Physical exam ▪ Diagnostic
imaging
Referral by PCP
Preadmission work ▪ Pre-work (e.g.,
blood, ECG) ▪ Consultation as
necessary
Surgery (inpatient) ▪ Procedure ▪ Implant ▪ Post-op stay
IP recovery/ rehab ▪ SNF/ IP rehab
No IP rehab ▪ Physical
therapy ▪ Home health
Readmission/ avoidable complication ▪ DVT/ PEs ▪ Revisions ▪ Infections ▪ Hemorrhages
Surgery (outpatient) ▪ Procedure ▪ Implant
Referral by other orthopod
30 to 60 days before surgery 90-180 days after surgery Procedure
SOURCE: Arkansas Payment Improvement Initiative
ARKANSAS EXAMPLE TO BE MODIFIED/VERIFIED BY TAG’S
47
Self-referral
Initial assess-ment by surgeon ▪Necessity of
procedure ▪ Physical exam ▪ Diagnostic
imaging
Referral by PCP
Preadmission work ▪ Pre-work (e.g.,
blood, ECG) ▪ Consultation as
necessary
Surgery (inpatient) ▪ Procedure ▪ Implant ▪ Post-op stay
IP recovery/ rehab ▪ SNF/ IP rehab
No IP rehab ▪ Physical
therapy ▪ Home health
Readmission/ avoidable complication ▪ DVT/ PEs ▪ Revisions ▪ Infections ▪ Hemorrhages
Surgery (outpatient) ▪ Procedure ▪ Implant
Referral by other orthopod
30 to 60 days before surgery 90-180 days after surgery Procedure
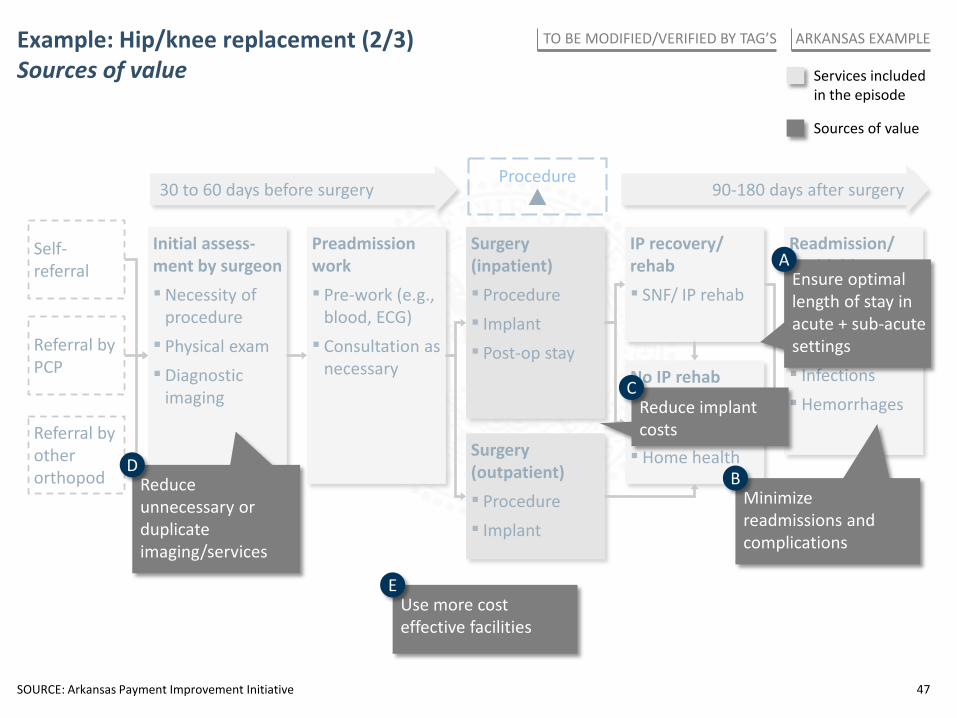
Example: Hip/knee replacement (2/3) Sources of value Services included
in the episode
Sources of value
Ensure optimal length of stay in acute + sub-acute settings
A
Minimize readmissions and complications
B
Reduce implant costs
C
Reduce unnecessary or duplicate imaging/services
D
Use more cost effective facilities
E
SOURCE: Arkansas Payment Improvement Initiative
ARKANSAS EXAMPLE TO BE MODIFIED/VERIFIED BY TAG’S
48
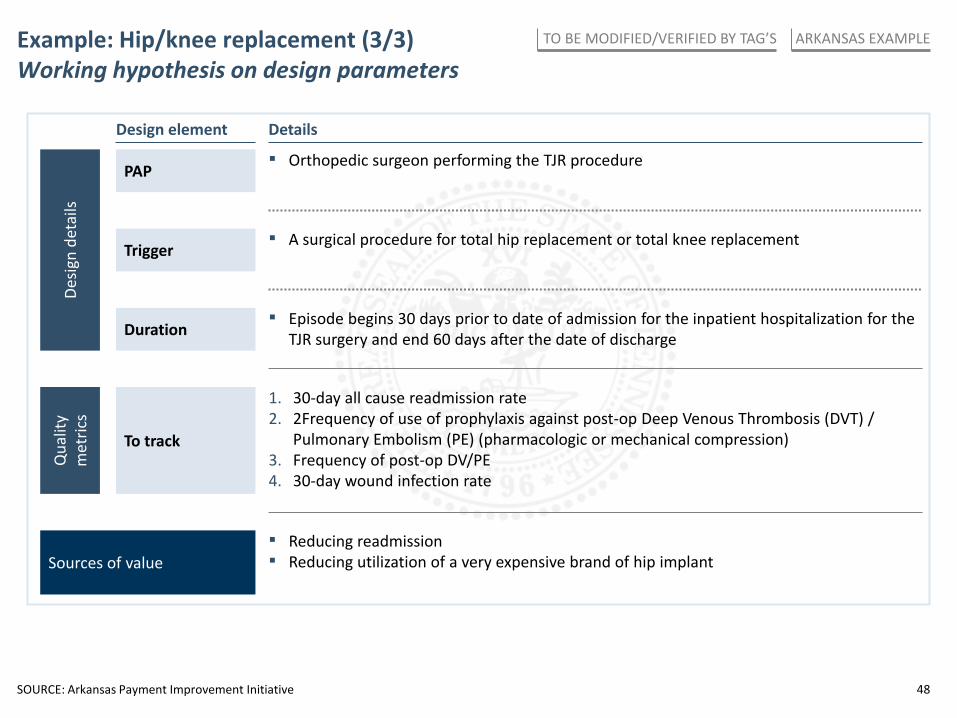
Example: Hip/knee replacement (3/3) Working hypothesis on design parameters
Sources of value ▪ Reducing readmission ▪ Reducing utilization of a very expensive brand of hip implant
Trigger ▪ A surgical procedure for total hip replacement or total knee replacement
▪ Orthopedic surgeon performing the TJR procedure PAP
▪ Episode begins 30 days prior to date of admission for the inpatient hospitalization for the TJR surgery and end 60 days after the date of discharge Duration
Design element Details
To track
1. 30-day all cause readmission rate 2. 2Frequency of use of prophylaxis against post-op Deep Venous Thrombosis (DVT) /
Pulmonary Embolism (PE) (pharmacologic or mechanical compression) 3. Frequency of post-op DV/PE 4. 30-day wound infection rate
Qua
lity
met
rics
Desig
n de
tails
SOURCE: Arkansas Payment Improvement Initiative
ARKANSAS EXAMPLE TO BE MODIFIED/VERIFIED BY TAG’S
Tennessee Payment Reform Initiative
Provider stakeholder group meeting
PRELIMINARY WORKING DRAFT, SUBJECT TO CHANGE
PAYER RESULTS FOR BARRIERS ACTIVITY
June 19, 2013
50
8 5 4
2 3 0
3 3 6
8 1 0
6 8 16
1 0 4
2 0 0
6 3 6
0 0 1
2 6 0
0 0 0
0 0 2
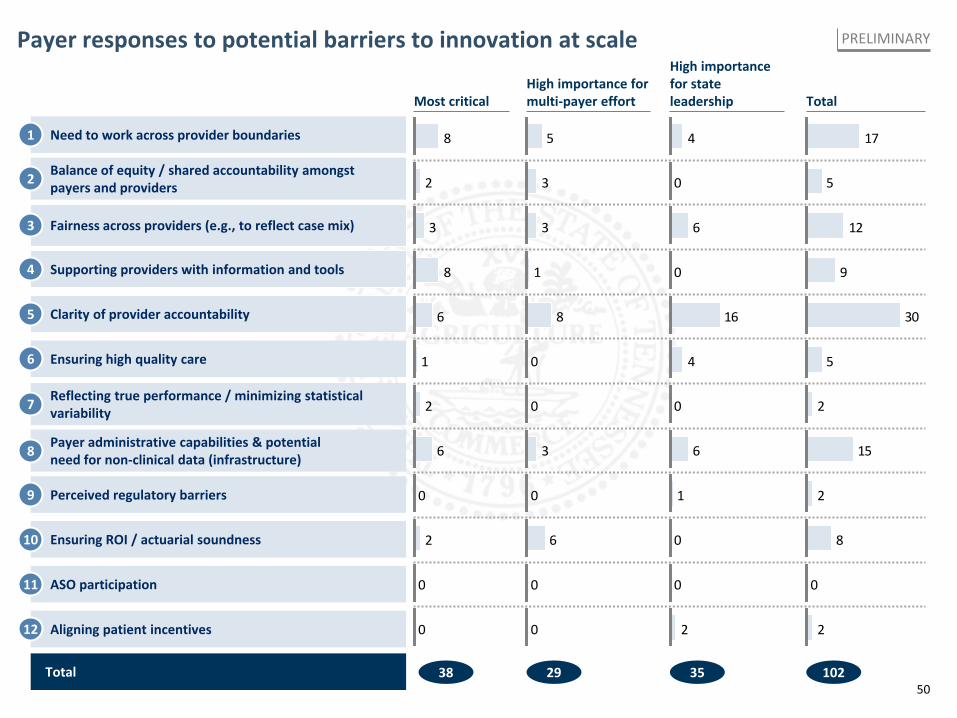
Payer responses to potential barriers to innovation at scale PRELIMINARY
Reflecting true performance / minimizing statistical variability
Payer administrative capabilities & potential need for non-clinical data (infrastructure)
Perceived regulatory barriers
Ensuring ROI / actuarial soundness
ASO participation
Aligning patient incentives
Most critical High importance for multi-payer effort
High importance for state leadership
Total 38 29 35
17
5
12
9
30
5
2
15
2
8
0
2
Total
102
7
8
9
10
11
12
Need to work across provider boundaries
Balance of equity / shared accountability amongst payers and providers
Fairness across providers (e.g., to reflect case mix)
Supporting providers with information and tools
Clarity of provider accountability
Ensuring high quality care
1
2
3
4
5
6