Embed Size (px)
Citation preview
NATL INST. OF STAND & TECH
AlllOb TTfl^DD
NBSIR 83-1684
TENSILE, COMPRESSIVE, ANDPROPERTIES OF A 64-kg/m3
POLYURETHANE FOAM ATLOW TEMPERATURES
J.M. Arvidson
L.L. Sparks
Chen Guobang
National Bureau of Standards
U.S. Department of CommerceBoulder, Colorado 80303
February 1983


NATIONAL BUREAUOF STANDARDS
LIBRARY
NBSIR 83-1684
TENSILE, COMPRESSIVE, AND SHEARPROPERTIES OF A 64-kg/m3
POLYURETHANE FOAM ATLOW TEMPERATURES
‘Fracture and Deformation Division
National Measurement Laboratory
“Thermophysical Properties Division
National Engineering Laboratory
National Bureau of StandardsU.S. Department of CommerceBoulder, Colorado 80303
fGuest worker at NBS. Department of Thermal Science, Zhejiang University,
Hangzhon, Zhejiang Province, People’s Republic of China
February 1983
Prepared for:
Gas Research Institute
8600 West Bryn Mawr AvenueChicago, Illinois 60631
U.S. DEPARTMENT OF COMMERCE, Malcolm Baldrige, Secretary
J.M. Arvidson*
L.L. Sparks**Chen Guobangt
NATIONAL BUREAU OF STANDARDS, Ernest Ambler, Director

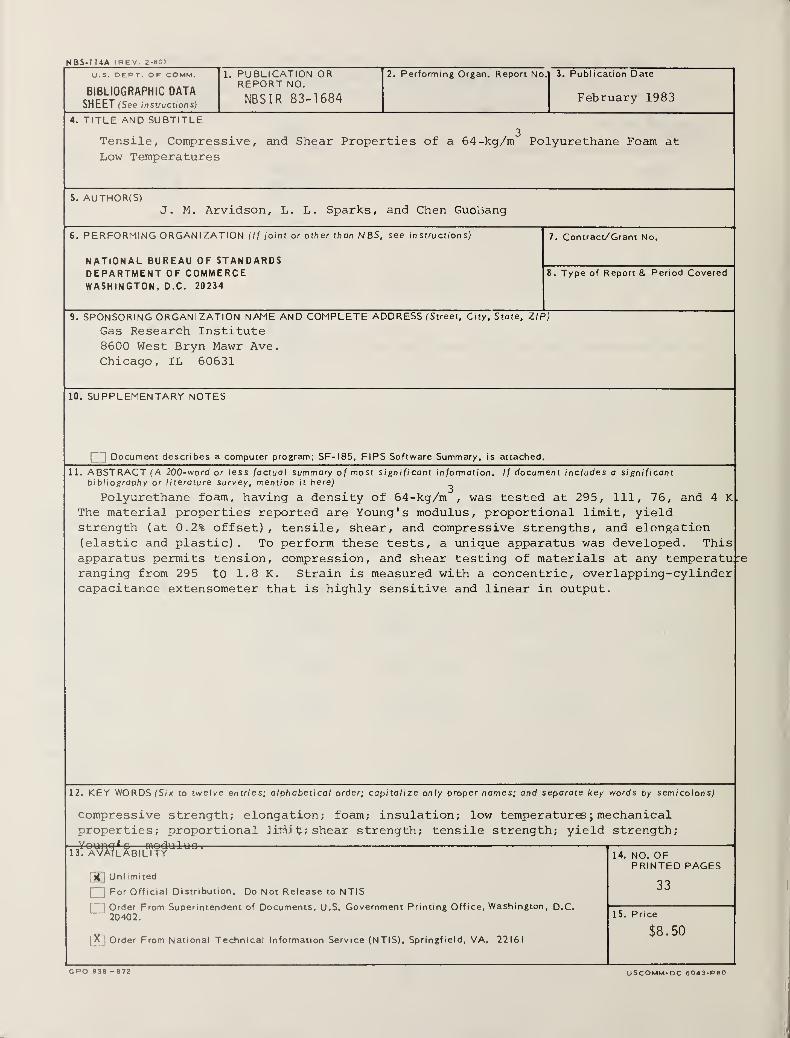
3Tensile, Compressive, and Shear Properties of a 64-kg/m
Polyurethane Foam at Low Temperatures
J. M. Arvidson, L. L. Sparks, and Chen Guobang
Polyurethane foam, having a density of 64 kg/m 3, was tested at 295, 111,
76, and 4 K. The material properties reported are Young's modulus,
proportional limit, yield strength (at 0.2% offset), tensile, shear, and
compressive strengths, and elongation (elastic and plastic). To perform these
tests, a unique apparatus was developed. This apparatus permits tension,
compression, and shear testing of materials at any temperature ranging from
295 to 1.8 K. Strain is measured with a concentric, overl apping-cyl inder
capacitance extensometer that is highly sensitive and linear in output.
Key words:
temperatures
;
compressive strength;
mechanical properties;
elongation; foam; insulation; low
proportional limit; shear strength;
tensile strength; yield strength; Young's modulus.

1. INTRODUCTION
Polyurethane foams are used in many structural as well as insulating
applications in which knowledge of material performance in extreme
environments (e.g., at liquefied natural gas, liquid nitrogen, and liquid
helium temperatures ) is essential. Accurate data, predictive capability, and
standardized methods and materials improve the selection and development of
materials for these applications. The mechanical properties reported here are
part of a broader effort to understand and predict the thermal and mechanical
behavior of expanded plastics (foams) in cryogenic environments.
The tensile, compressive, and shear properties of polyurethane foam,
having a density of 64 kg/m 3, were determined using a test fixture developed
specifically for this program [1]. This fixture provides the capability of
determining the above material properties at any temperature from ambient
(295 K) to 1.8 K. Tests can be done in a cold gaseous atmosphere or in
liquids, such as helium (4 K), nitrogen (76 K), and dry ice and alcohol
(195 K). The fixture has also been designed to test materials at the above
temperatures while under static pressures ranging from subatmospheric to
approximately 0.3 MPa (43.7 psia).
A strain extensometer that was developed for use with soft viscoelastic
materials utilizes concentric overlapping cylinders and the change in electrical
capacitance to detect specimen strain [2]. This type of extensometer does not
attach directly to the specimen, so the effect of instrumentation on the
experimental results is negligible (verified to contribute <2.5 x 10 m for
our specimen geometry). The extensometer works well in cryogenic environments,
is accurate, and is linear for large strains [3,4]. The capacitance extensometer
system designed for this work had a linearity range in excess of 2.5 cm when
used with the current foam specimen geometry (2.9-cm diameter by 9.9-cm length).
1
Similar extensometers can be designed for specific sensitivities and extents
of linearity [5]. As long as the capacitance extensometer is situated in a
stable fluid (i.e., single phase and nonboiling) the resultant is a very high
signal-to-noise ratio. These sensors function in gases as well as in liquids
and the device is only sensitive to the dielectric constant of the test
medium. The original calibration of the system, for example, can be performed
at room temperature in air. To conduct a test in any other medium (e.g.,
liquid nitrogen) the original calibration need only be corrected for the
change in dielectric constant [6].
2. MATERIAL CHARACTERIZATION
The material tested in this study is a nominal 64-kg/m 3 polyurethane foam
designated as GM35. This amorphous organic polymer is a thermosetting foam.
Our supply of this material was obtained from the NBS Office of Standard
Reference Materials (OSRM) in Gaithersburg, Maryland. The OSRM distributed
this and other expanded plastics for the Products Research Committee [7,8].
These materials were commercially produced and designated as General
Material s
.
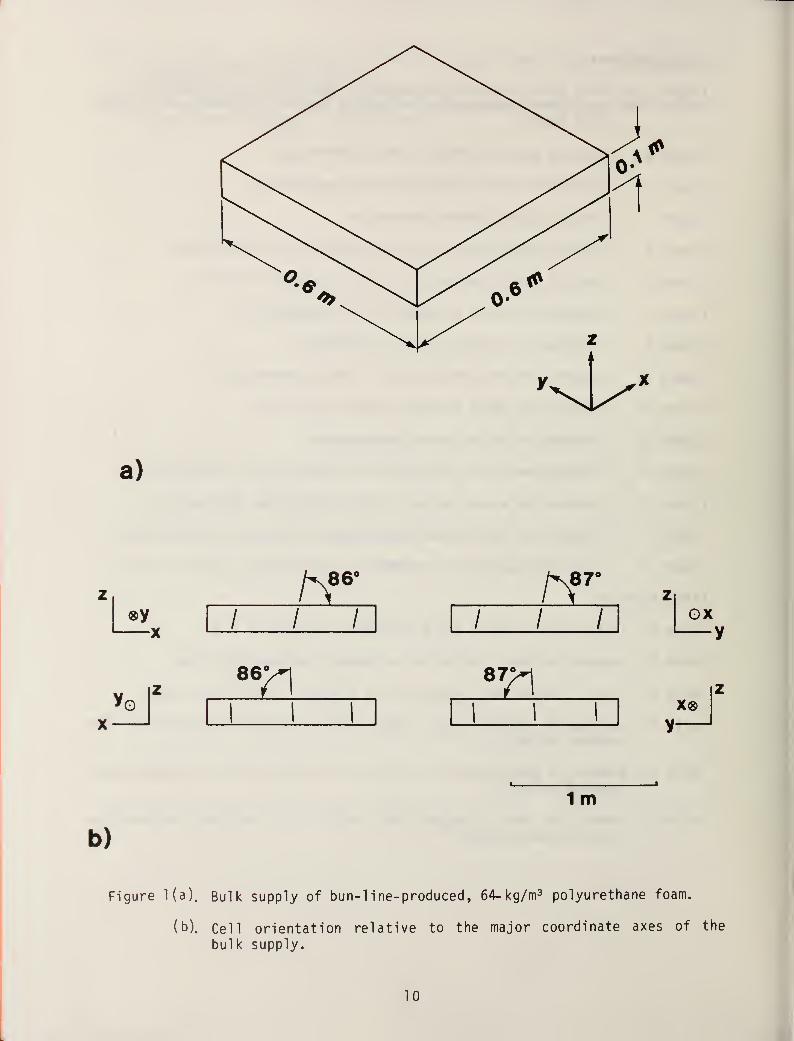
The bulk supply of GM35 was a 0.1-m x 0.6-m x 0.6-m slab (figure la).
The orientation of the elongated cell axis for the material used in the
physical properties tests was determined optically from statistical evaluation
of photomicrographs . The ratios of cell height to cell width for the
principal orthogonal planes of the physical test specimens were: x/y = 0.94 ±
0.34, z/x = 1.60 ± 0.65, z/y = 1.51 ± 0.58. The uncertainties given represent
estimates of one standard deviation. The cell orientations relative to the
orthogonal axes of the bulk slab are shown in figure lb.
2
The density of this res in- gas composite was found to be 62.22 ± 0.28
kg/m 3, 62.52 ± 0.11 kg/m 3
, and 62.56 ± 0.13 kg/m 3 after conditioning at 23°C
and 24, 50, and 92 percent relative humidity respectively. The uncertainties
given are estimates of one standard deviation.
3. SPECIMENS
Test specimens taken from the x/y or z/x plane in the bulk supply (see
figure 1) are designated "longitudinal" when loaded parallel to the z direction.
Conversely, specimens taken from the x/y plane and loaded parallel to either
the x or y direction are designated "transverse"
.
The tensile specimens were rods 9.9-cm long and 2.9-cm in diameter. This
specimen was used to determine Young's modulus, proportional limit, yield
strength (at 0.2% offset) , and elongation (extrapolated using ultimate
tensile strength). For the determination of ultimate tensile strength, a
reduced section specimen was used. Its gage length was 5.1 cm and its
diameter was 1.9 cm. All tensile specimens were epoxied to polycarbonate
grips, which were threaded to accomodate the tensile pull-rod system. The
reduced-section geometry forced fracture to occur within the gage length,
thereby eliminating the effect of biaxial stresses at the grip ends.
The compression specimens were 2.54-cm long and 2.9-cm in diameter.
These specimens did not require grips.
Shear specimens were 1.9 cm x 2.54 cm x 0.4 cm. The specimens were
epoxied to two flat plates and each plate was attached to the upper and lower
tensile pull-rod system, respectively. An aluminum cylinder was slipped over
the specimen and plates to help maintain alignment and minimize induced torque
during testing. In addition, the cylinder has a built-in resistive heater
that is controlled by a thermocouple to produce and maintain the desired test
temperature.
3
4. TEST PROCEDURES
Most tests were conducted at 295 K(air), 111 K(gaseous helium), 76 Illiquid
nitrogen), and 4 K (liquid helium). To minimize thermal shock to the specimen,
the liquid helium or nitrogen was transferred at a very slow rate. The tensile
and compressive properties included: Young's modulus, proportional limit,
yield strength (at 0.2 percent offset), tensile and compressive strengths, and
elongation (elastic and plastic).
Since an ASTM shear strength test method is not available for soft
cellular materials such as these foams, several methods were carefully consid-
ered, and a version of the guil lotine-type shear test was selected. Many
specimen geometries (thicknesses and widths) were tested to find the best
combination that most consistently failed in shear. At least three tests were
conducted at each temperature; in some cases, more tests were run to determine
material variability. Prior to testing, all specimens were "conditioned" in
an environmental chamber for not less than four days at 23°C and 50 percent
relative humidity. Each specimen was tested shortly after removal from the
environmental chamber. All tests were conducted in a conventional compression/
tension test machine at a strain rate of 5 x 10 min . (Varying the rate-4-2-1 x
from 5 x 10 to 5 x 10 min had no measurable effect on results.)
5. RESULTS
Results are presented in figures 2 through 15 and tables 1 through 6.
The bars on the figures indicate the data spread from replicate tests.
Scatter is typically higher for compression and shear than for tensile tests;
this is because the compressive and shear tests are more sensitive to problems
such as misalignment (tensile specimens self-align during the test). Unlike
the 32-kg/m 3 foam that was tested previously [1], the cell orientation of the
64-kg/m 3 material agreed very well with the bun-line orientation
4
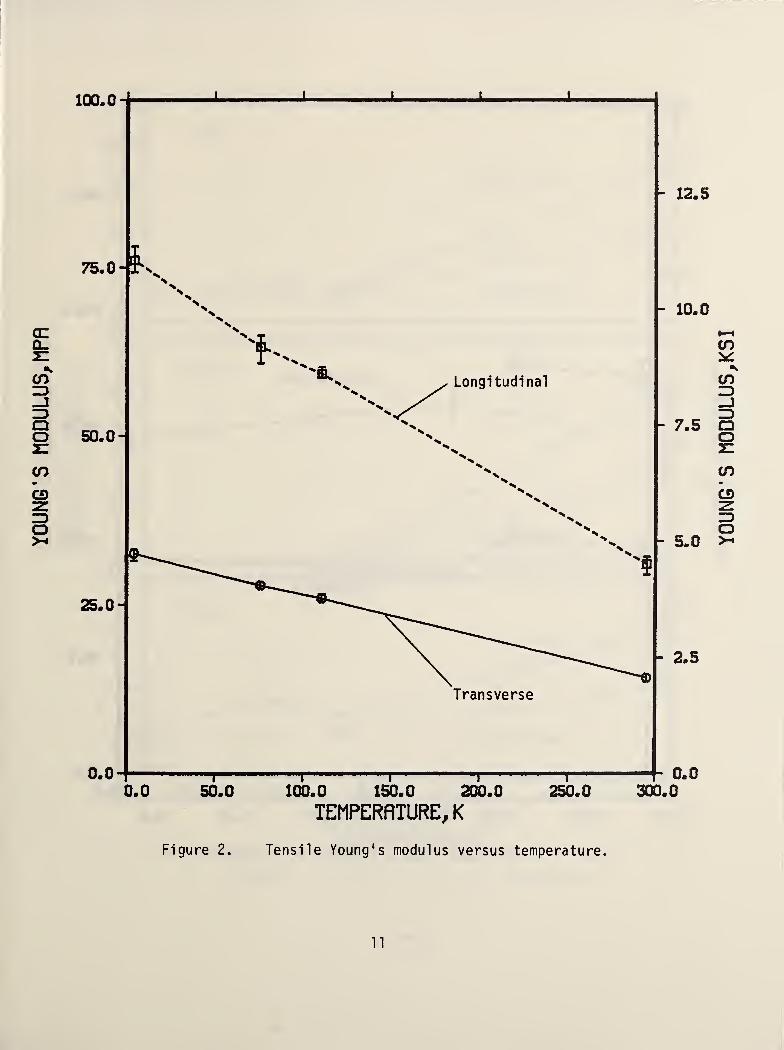
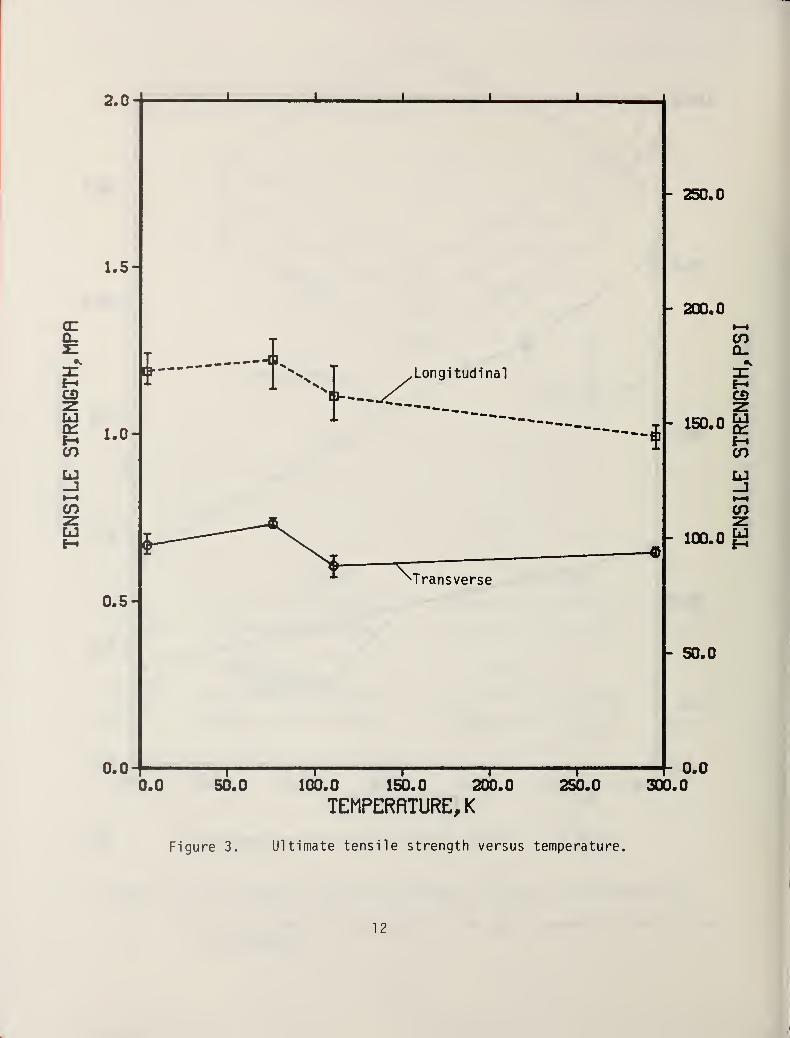
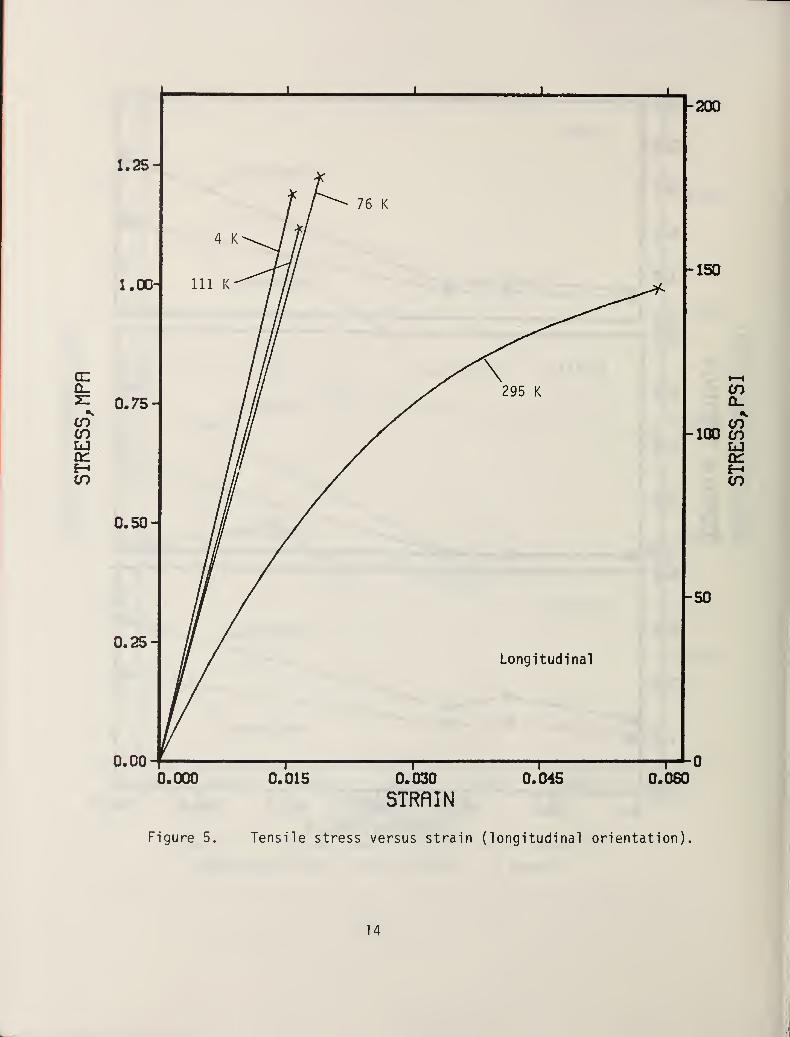
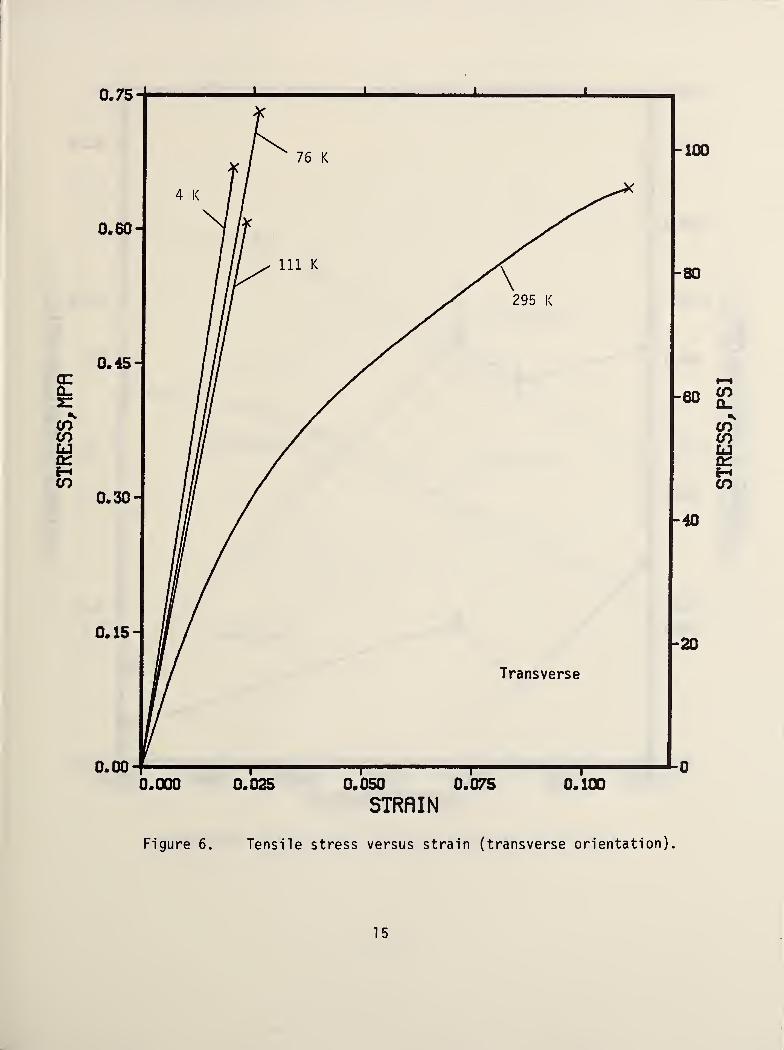
(i.e., the vertical or "rise" direction is denoted as longitudinal). Tensile
results shown in figures 2 through 6 are Young's modulus, ultimate strength,
and strain-versus- temperature, as well as stress-versus-strain curves for all
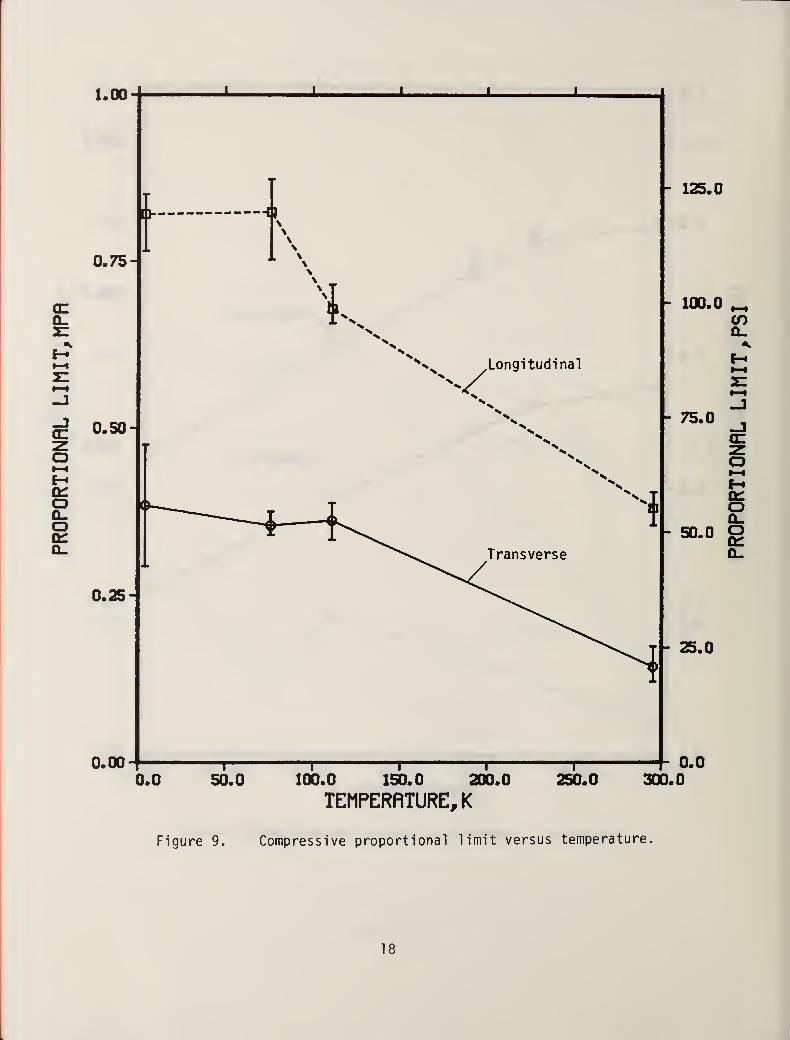
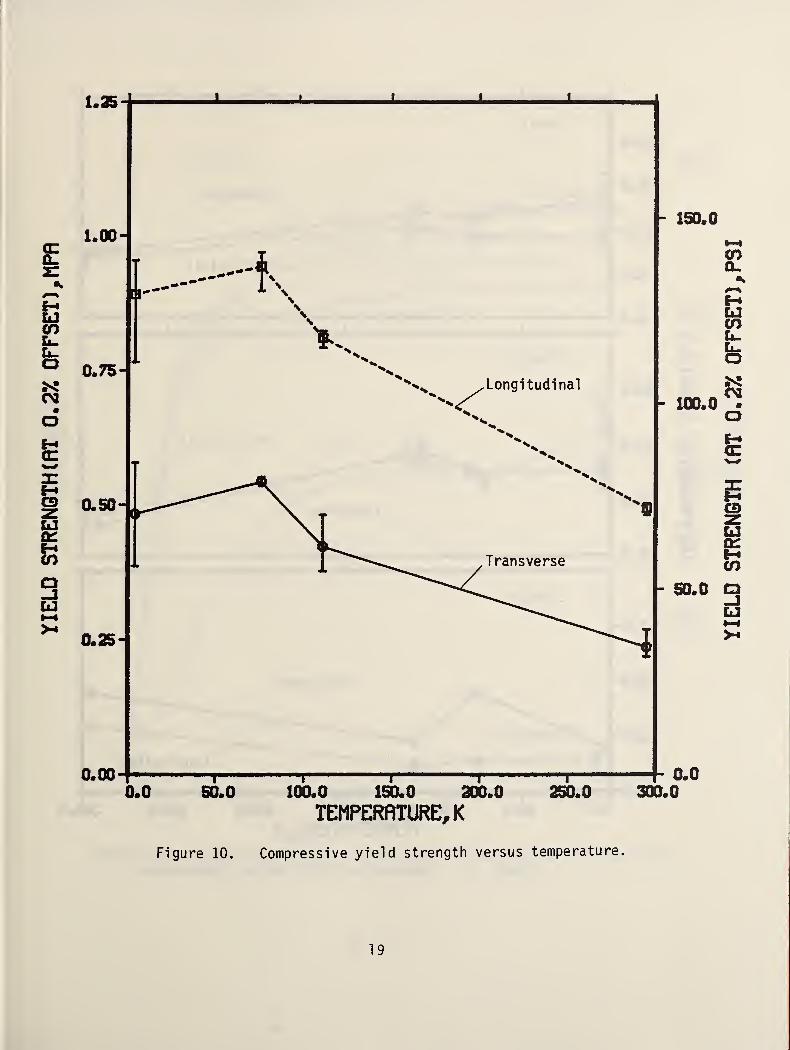
temperatures. In addition to the above properties, compressive results
include yield strength (at 0.2% offset), proportional limit versus temperature,
and a typical load-versus-displacement curve, as shown in figures 7 through
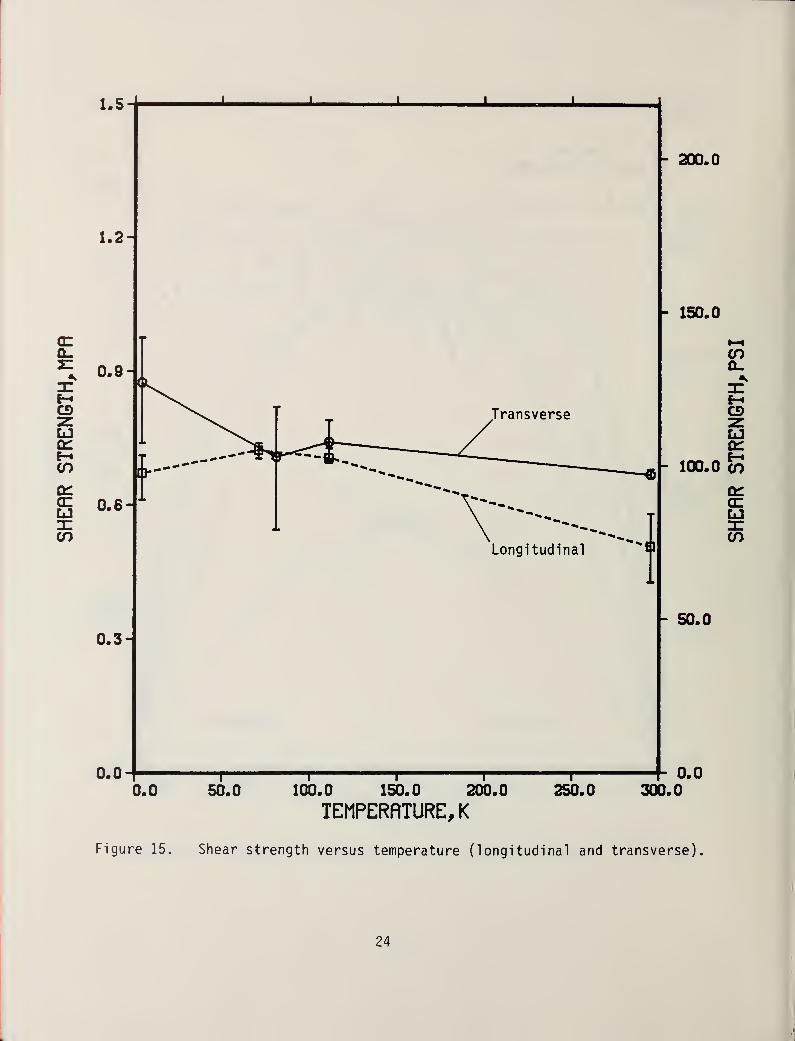
14. The shear results are given in figure 15.
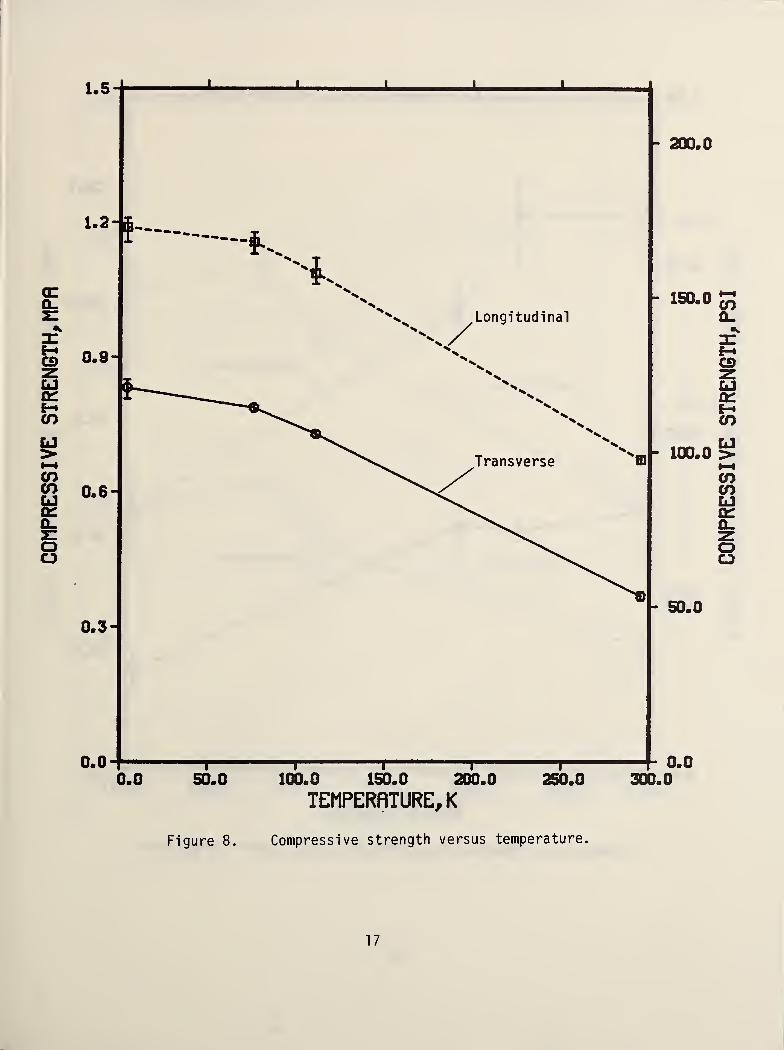
Tensile, Young's modulus, proportional limit, yield strength, ultimate
strength, and shear strength values all increase as temperature decreases from
295 K to 4 K. The longitudinal orientation results have the highest values.
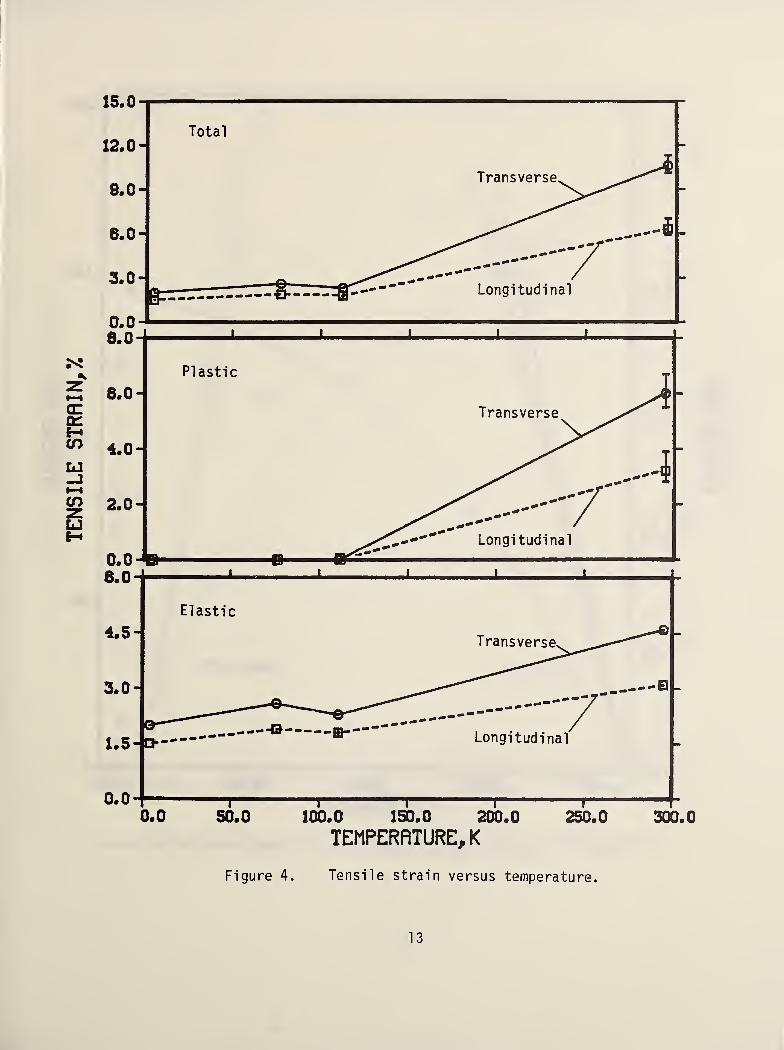
As shown in figure 4, tensile strain decreases with temperature, and the
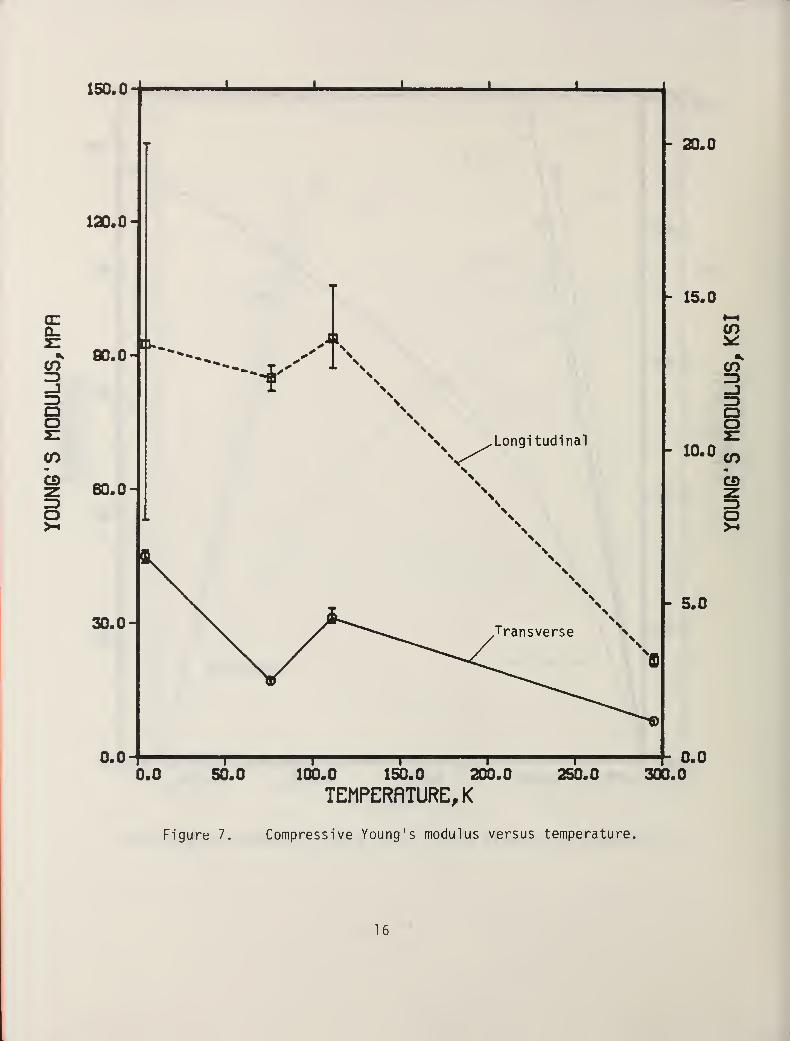
material becomes brittle at temperatures below 111 K. The compressive Young's
modulus versus temperature, as shown in figure 7, indicates a decrease in mean
values from 111 K to 76 K, for both longitudinal and transverse specimens.
The same behavior was also noted for a 32-kg/m 3 polyurethane foam material
that was previously tested [1], Using the Student's "t" test for small sample
size, the longitudinal and transverse compressive data were calculated for 76
and 111 K. The results indicate a level of confidence of >99.95% for the
transverse and 88% for longitudinal tests that the mean compressive modulus at
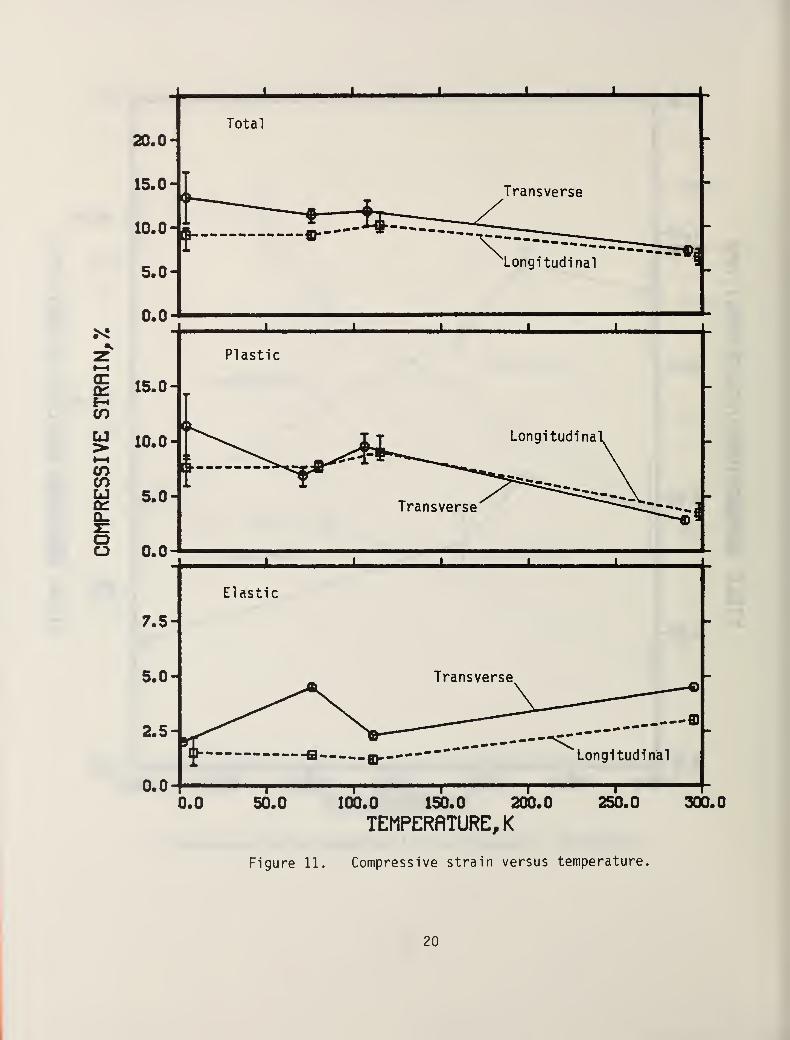
76 K is lower than the mean compressive modulus at 111 K [9]. Figure 11
indicates a deformation capability during compression at low temperatures.
However, since the polyurethane material is incapable of true plastic
deformation at cryogenic temperatures, this apparent plastic strain is caused
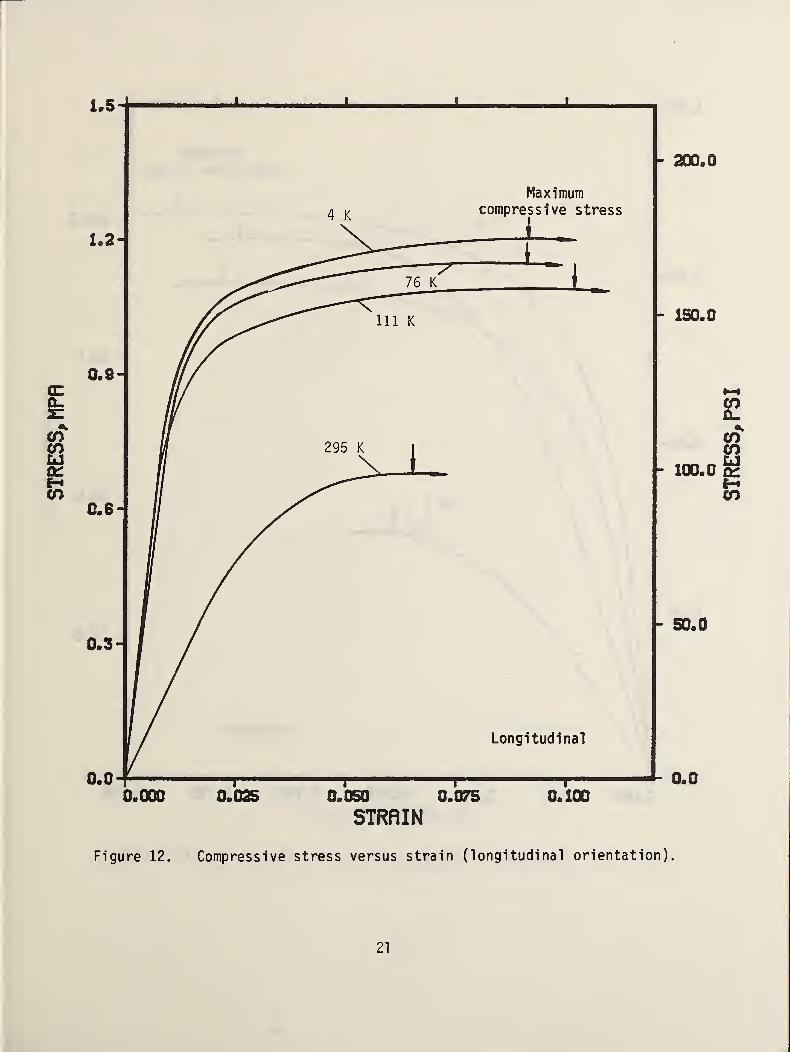
by individual cells that collapse during testing. Figures 12 and 13 show the
stress-versus-strain behavior of longitudinal and transverse specimens at 295,
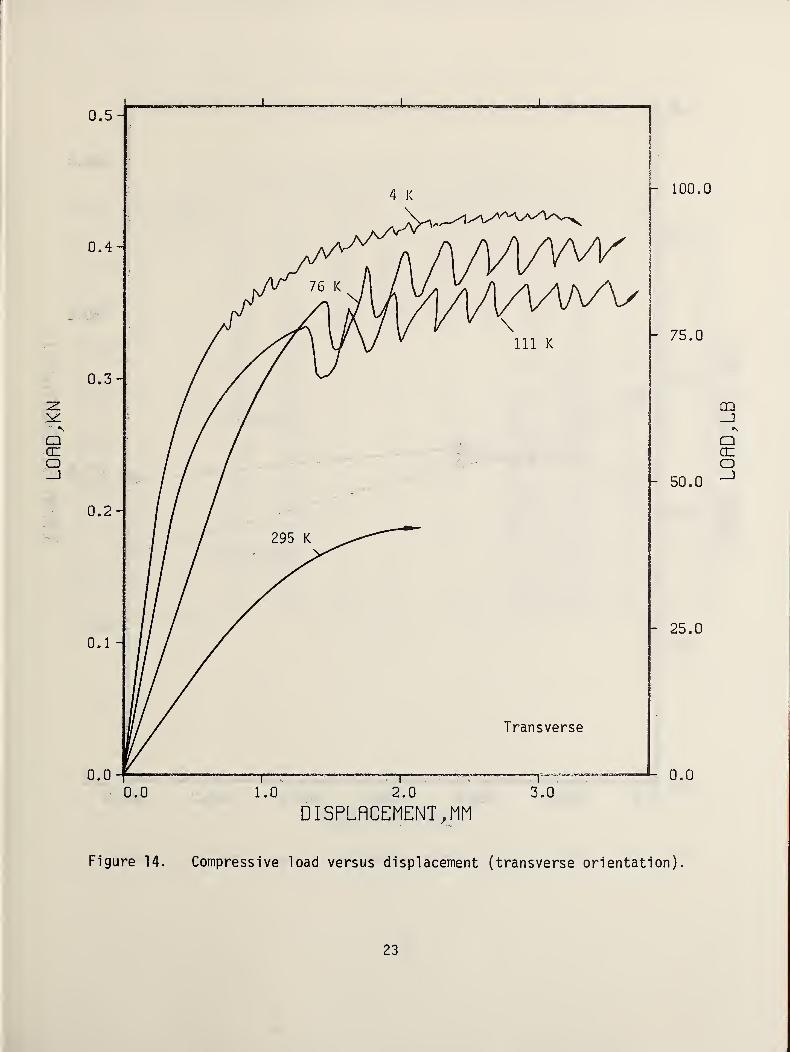
111, 76, and 4 K. Figure 14 is an actual record of load-versus-displacement
for a typical specimen. The load drops illustrate points
5
at which individual or multiple cells fail under stress. Owing to material
variability, the stress-strain graphs were plotted as smooth curves, which do
not show the cell failure phenomena. Each stress-strain curve, at a given
temperature and orientation, is the average of three or more specimens tested.
6. DISCUSSION
Polyurethane foam behavior is typical of polymers in general, with large
mechanical property changes such as a complete loss of ductility and a doubling
of Ej (Young's modulus-tension) following a temperature reduction from 295 K
to 4 K. Certain longitudinal properties, like shear strength and E^ (Young's
modulus-compression), exhibit maximum values between the two extreme
temperature limits; however this is probably not a true material behavior but
an effect influenced by material variability and orientation irregularities.
The anomalous behavior of compressive Young's modulirs as shown in figure 7
appears to be a real effect. As stated previously, the 32-kg/m 3 polyurethane
foam tested exhibited the same drop in modulus from 111 to 76 K. In addition,
a third density of polyurethane foam (96-kg/m 3) has recently been tested and
it shows the same trend.
Sectioning after testing revealed that cell orientation varied slightly
from the orientation of the mold axes (see figure 1). It is generally thought
that foam specimens from the center of a large billet have uniform cells
oriented with respect to the vertical, but this is not true of foams formed on
a continuous or bun-line production facility. The cell orientation reflects
the movement of the foaming resin. However, as shown in this higher density
foam, the problem of cell orientation with respect to vertical is not as
severe as with less dense materials. Cells in the x-z plane of the material
reported here have only a 86 to 87° inclination to the x-axis (figure 1).
6
Specimens tested previously in liquid nitrogen [1] appeared to have
slightly lower shear strength values than those tested at the same temperature
in cold helium gas. This may be an indication of environmental sensitivity.
Nitrogen at low temperatures is deleterious to a number of other polymeric
materials. Thermoplastics have exhibited crazing or reduced fracture strengths,
or both when tensile tested in cold liquid or gaseous nitrogen, but not in
vacuum or helium environments [10]. Environmental effects must ultimately be
taken into account in design applications.
The authors are indebted to Robert S. Bell and Ronald D. Kriz for their
assistance in the preparation of this manuscript for publication.
References
[1] J. M. Arvidson and L. L. Sparks, "Low Temperature Mechanical Propertiesof a Polyurethane Foam", NBSIR 81-1654, National Bureau of Standards,Boulder, Colorado (November, 1981).
[2] R. P. Reed, J. M. Arvidson, and R. L. Durcholz, Tensile properties of
polyurethane and polystyrene foams from 76 to 300 K, in: "Advances in
Cryogenic Engineering," Vol . 18, K. D. Timmerhaus, ed., “Plenum Press, NewYork (1973), pp. 184-193.
[3] J. M. Roberts, R. B. Herring, and D. E. Hartman, The use of capacitancegauge sensors to make precision mechanical property measurements, jm:"Materials Technology," American Society for Mechanical Engineers, NewYork (1968), pp. 87-96.
[4] "High-Temperature Capacitive Strain Measurement System," NASA Tech. BriefB75- 10069, NASA (1975).
[5] P. C. F. Woldendale, Capacitive displacement transducers with high
accuracy and resolution, J. Sci. Instrum. ( J. Phys. E) 1:817 (1968).
[6] G. R. White, Measurement of thermal expansion at low temperatures,Cryogenics , 2:151 (1961).
[7] "Materials Bank Compendium of Fire Property Data," Products ResearchCommittee, J. W. Lyons, chairman. National Bureau of Standards,Washington, D.C. (1980).
[8] W. G. Jurevic, "Structural Plastics Applications Handbook Supplement 1
Test Methods," Technical Report AFML-TR-67-332 (1969).
7
[9] J. W. Dally, Statistical treatment of experimental data, Experimental
Mechanics 19(11) : 42 1 (1979).
[10] A. Hiltner and E. Baer, Mechanical properties of polymers at cryogenic
temperatures, Polymer 15:805 (1974).
3
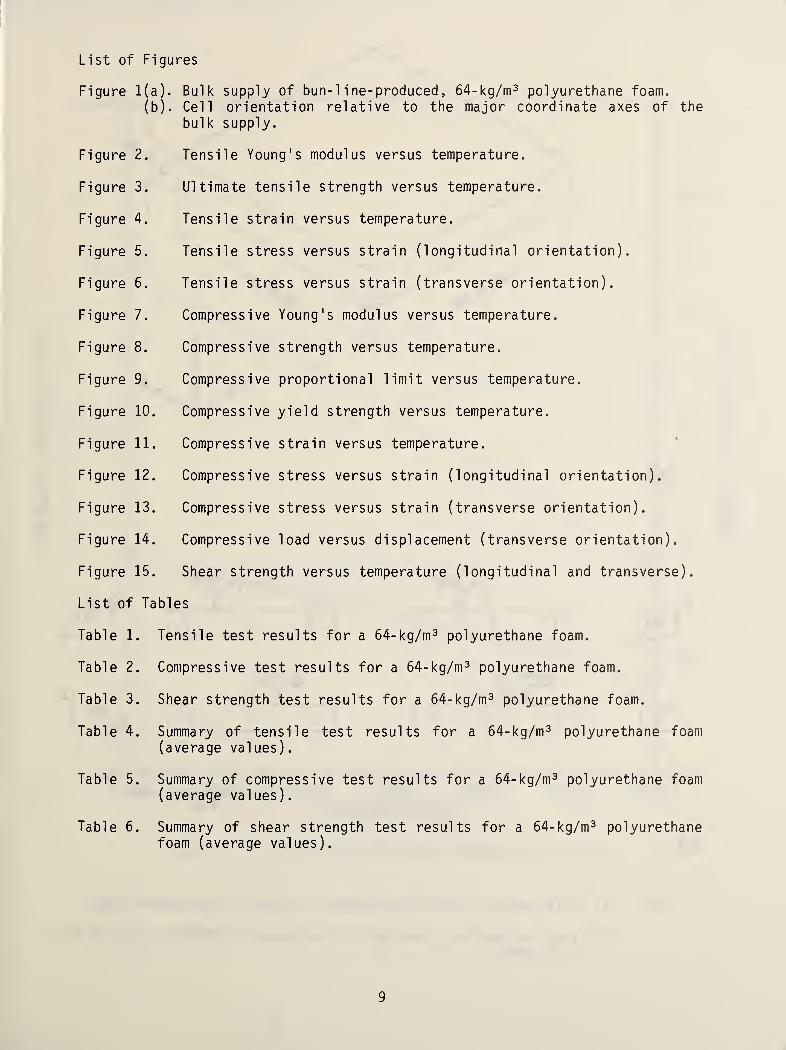
List of Figures
Figure 1(a). Bulk supply of bun-line-produced, 64-kg/m 3 polyurethane foam.
(b). Cell orientation relative to the major coordinate axes of the
bulk supply.
Figure 2. Tensile Young's modulus versus temperature.
Figure 3. Ultimate tensile strength versus temperature.
Figure 4. Tensile strain versus temperature.
Figure 5. Tensile stress versus strain (longitudinal orientation).
Figure 6. Tensile stress versus strain (transverse orientation).
Figure 7. Compressive Young's modulus versus temperature.
Figure 8. Compressive strength versus temperature.
Figure 9. Compressive proportional limit versus temperature.
Figure 10. Compressive yield strength versus temperature.
Figure 11. Compressive strain versus temperature.
Figure 12. Compressive stress versus strain (longitudinal orientation).
Figure 13. Compressive stress versus strain (transverse orientation).
Figure 14. Compressive load versus displacement (transverse orientation).
Figure 15. Shear strength versus temperature (longitudinal and transverse).
List of Tables
Table 1. Tensile test results for a 64-kg/m 3 polyurethane foam.
Table 2. Compressive test results for a 64-kg/m 3 polyurethane foam.
Table 3. Shear strength test results for a 64-kg/m 3 polyurethane foam.
Table 4. Summary of tensile test results for a 64-kg/m 3 polyurethane foam(average values).
Table 5. Summary of compressive test results for a 64-kg/m 3 polyurethane foam(average values).
Table 6. Summary of shear strength test results for a 64-kg/m 3 polyurethanefoam (average values).
9
a)
z
®yX
b)
Figure
ht* ff7*
z
1 1 1 / / /ox
86^ 00
1 MX®
y
z
L - .. - . J
1 m
1(a). Bulk supply of bun-line-produced, 64-kg/m 3 polyurethane foam.
(b). Cell orientation relative to the major coordinate axes of the
bulk supply.
10
YOUNG'S
MODULUS,
MPR
12.5
10.0
7.5
5.0
2.5
0.00
11
YOUNG'S
MODULUS,
KS
I
TENSILE
STRENGTH,
MPfl
TEMPERRTURE,
K
Figure 3. Ultimate tensile strength versus temperature.
12
TENSILE
STRENGTH,
PS
I
TENSILE
STRAIN,
X
15.0
12. 0 -
8. 0 -
8. 0 -
3.0 -
Total
13
STRESS,
MPfl
Figure 5. Tensile stress versus strain (longitudinal orientation).
14
STRESS,
PS
I
STRESS,
MPfl
15
STRESS,
PS
I
YOUNG
1S
MODULUS,
MPfl
150.0
120. 0 -
90.0
60. 0 -
30. 0 -
0.0
J I I L
- 20.0
0.0 50.0 100.0 150.0 200.0
TEMPERRTURE,
K
250.0—h 0.0300.0
Figure 7. Compressive Young's modulus versus temperature.
16
YOUNG'S
MODULUS,
KSI
COMPRESS
IVE
STRENGTH,
MPR
Figure 8. Compressive strength versus temperature.
17
CONPRESS
IVE
STRENGTH,
PS
I
PROPORT
IONRL
LIMIT,
MPfl
TEMPERATURE,
K
Figure 9. Compressive proportional limit versus temperature.
18
PROPORTIONAL
LIMIT,
PS
I
YIELD
STRENGTH
(fiT
0.2%
OFFSET
),MPR
- 150.0
100.0
- 50.0
19
YIELD
STRENGTH
(AT
0.2%
OFFSET),
PSI
COMPRESSIVE
STRAIN,
X
20
STRESS,
MPR
STRAIN
Figure 12. Compressive stress versus strain (longitudinal orientation).
21
STRESS,
PS
I

STRESS,
MPfl
STRAIN
Figure 13. Compressive stress versus strain (transverse orientation).
22
STRESS,
PS
I
LOflD/KN
100.0
75.0
50.0
25.0
0.0
Figure 14. Compressive load versus displacement (transverse orientation).
23
LORD,
LB
SHEAR
STRENGTH,
MPfl
TEMPERRTURE,
K
Figure 15. Shear strength versus temperature (longitudinal and transverse).
24
SHEAR
STRENGTH,
PS
I
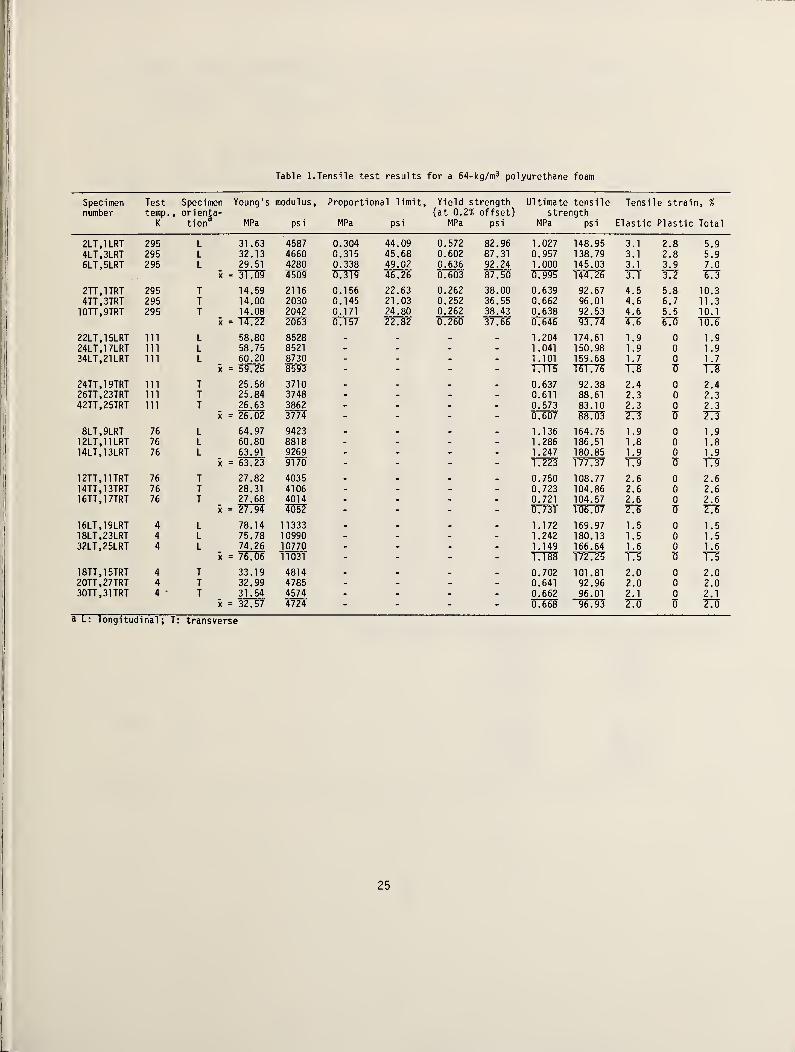
Table 1. Tensile test results for a 64-kg/m 3 polyurethane foam
Specimennumber
Testtemp.
,
K
Specimen Young'sorienta-tion
3MPa
modul us
,
psi
Proportional limit,
MPa psi
Yield strength(at 0.2% offset)
MPa psi
Ultimate tensilestrength
MPa psi
Tensile strain, %
Elastic Plastic Total
2LT.1LRT 295 L 31 .63 4587 0.304 44.09 0.572 82.96 1.027 148.95 3.1 2.8 5.94LT.3LRT 295 L 32.13 4660 0.315 45.68 0.602 87.31 0.957 138.79 3.1 2.8 5.9
6LT,5LRT 295 L 29.51 4280 0.338 49.02 0.636 92.24 1.000 145.03 3.1 3.9 7.0
x = 31.09 4509 0.319 46.26 0.603 87.50 0.995 144.26 3.1 3.2 6.3
2TT.1TRT 295 T 14.59 2116 0.156 22.63 0.262 38.00 0.639 92.67 4.5 5.8 10.34TT.3TRT 295 T 14.00 2030 0.145 21 .03 0.252 36.55 0.662 96.01 4.6 6.7 11.310TT.9TRT 295 T 14.08 2042 0.171 24.80 0.262 38.43 0.638 92.53 4.6 5.5 10.1
x = 14.22 2063 0.157 22.82 0.260 37.66 0.646 93.74 4.6 6.0 10.6
22LT.15LRT 111 L 58.80 8528 - - - - 1.204 174.61 1 .9 0 1.924LT.17LRT 111 L 58.75 8521 - - - - 1 .041 150.98 1 .9 0 1.934LT.21LRT 111 L 60.20 8730 - - - - 1.101 159.68 1.7 0 1.7
i = 5972F M - - - - 1.115 161.76 T3 U T324TT.19TRT 111 T 25.58 3710 . - - . 0.637 92.38 2.4 0 2.426TT.23TRT 111 T 25.84 3748 - - - - 0.611 88.61 2.3 0 2.342TT.25TRT 111 T 26.63 3862 - - . - 0.573 83.10 2.3 0 2.3
x = 20? 3774" - - - - 0.607 88.03 23 7 738LT.9LRT 76 L 64.97 9423 - - - - 1.136 164.75 1 .9 0 1.912LT.11LRT 76 L 60.80 8818 - - - - 1.286 186.51 1 .8 0 1.814LT.13LRT 76 L 63.91 9269 - - - - 1.247 180.85 1 .9 0 1.9
x = 63.23 9170 - - - - 1.223 177.37 1.9 0 1.9
12TT.11TRT 76 T 27.82 4035 - - - - 0.750 108.77 2.6 0 2.614TT.13TRT 76 T 28.31 4106 - - - - 0.723 104.86 2.6 0 2.616TT.17TRT 76 T 27.68 4014 - - - - 0.721 104.57 2.6 0 2.6
x = 27.94 4U5? - - - - 0.731 106.0? 73 7 7316LT.19LRT 4 L 78.14 11333 - - - - 1.172 169.97 1.5 0 1.518LT.23LRT 4 L 75.78 10990 - - - - 1.242 180.13 1.5 0 1.532LT.25LRT 4 L 74.26 10770 - - - - 1.149 166.64 1 .6 0 1.6
x = 706 11031 - - - - 1.188 172.25 1.5 0 1.5
18TT.15TRT 4 T 33.19 4814 . - . - 0.702 101 .81 2.0 0 2.020TT.27TRT 4 T 32.99 4785 - - - - 0.641 92.96 2.0 0 2.030TT.31TRT 4 T 31.54 4574 - - - - 0.662 96.01 2.1 0 2.1
x = 32.57 4724 - - - - 0.668 96.93 2.0 0 2.0
a L: longitudinal; T: transverse
25
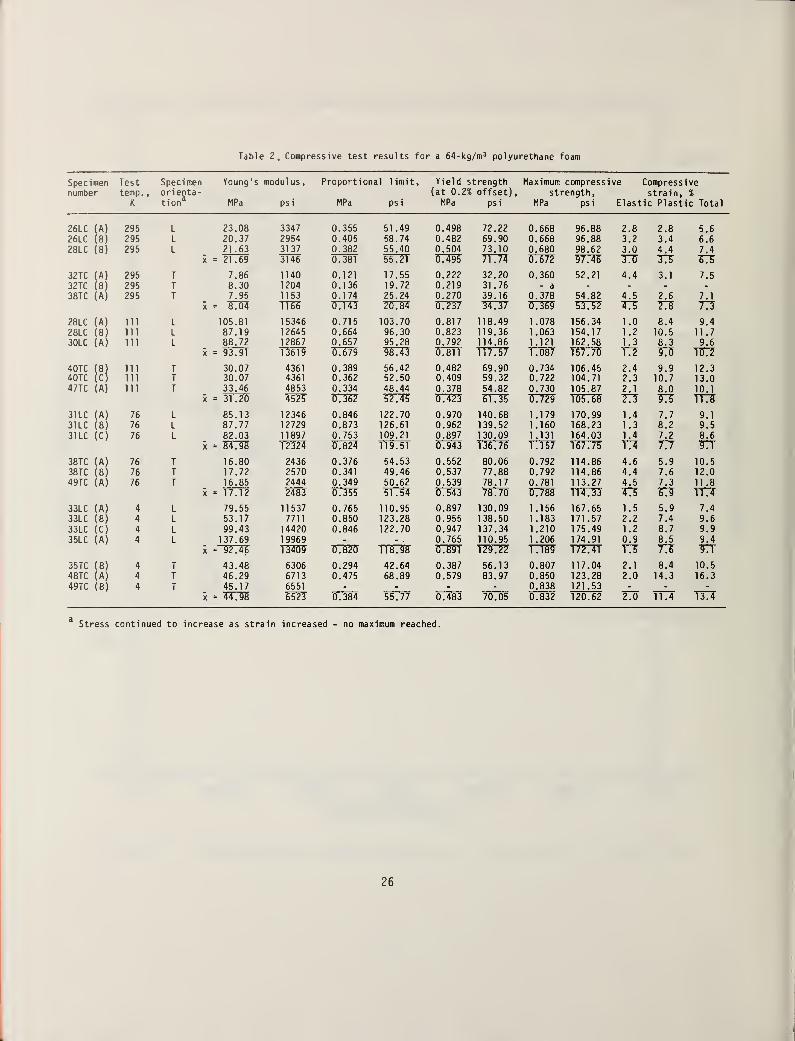
Table 2. Compressive test results for a 64-kg/m 3 polyurethane foam
Specimen Test Specimeni Young's modul us
,
Proportional limit. Yield strength Maximum compressive Compressivenumber temp.
,
orienta- (at 0.2% offset). strength, strain. %K tion
aMPa psi MPa psi MPa psi MPa psi Elastic Plastic Total
26LC (A) 295 L 23.08 3347 0.355 51.49 0.498 72.22 0.668 96.88 2.8 2.8 5.626LC (B) 295 L 20.37 2954 0.405 58.74 0.482 69.90 0.668 96.88 3.2 3.4 6.628LC (B) 295 L 21.63 3137 0.382 55.40 0.504 73.10 0.680 98.62 3.0 4.4 7.4
x = 21.69 3146 0.381 507 095 77777 0.672 97779 93 93 9332TC (A) 295 T 7.86 1140 0.121 17.55 0.222 32.20 0.360 52.21 4.4 3.1 7.532TC (B) 295 T 8.30 1204 0.136 19.72 0.219 31.76 - a - - - -
38TC (A) 295 T 7.95 1153 0.174 25.24 0.270 39.16 0.378 54.82 4.5 2.6 7.1
; = 04 7799 97f7? 20.84 037 34.37 07369 53 . 52 779 93 7328LC (A) 111 L 105.81 15346 0.715 103.70 0.817 118.49 1 .078 156.34 1.0 8.4 9.4
28LC (B) 111 L 87.19 12645 0.664 96.30 0.823 119.36 1 .063 154.17 1.2 10.5 11.7
30LC (A) 111 L 88.72 12867 0.657 95.28 0.792 114.86 1.121 162.58 1.3 8.3 9.6* = 93.91 79979 0.679 98.43 9.81) 1 T7 . 57 1 .087 157.70 772" 93 793
40TC (B) 111 T 30.07 4361 0.389 56.42 0.482 69.90 0.734 106.45 2.4 9.9 12.340TC (C) 111 T 30.07 4361 0.362 52.50 0.409 59.32 0.722 104.71 2.3 10.7 13.047TC (A) 111 T 33.46 4853 0.334 48.44 0.378 54.82 0.730 105.87 2.1 8.0 10.1
x = "31720 4525 062 52.45 0.423 61 .35 97729 105.68 73 93 77331 LC (A) 76 L 85.13 12346 0.846 122.70 0.970 140.68 1.179 170.99 1 .4 7.7 9.1
31LC (B) 76 L 87.77 12729 0.873 126.61 0.962 139.52 1.160 168.23 1 .3 8.2 9.5
31 LC (C) 76 L 82.03 11897 0.753 109.21 0.897 130.09 1.131 164.03 1 .4 7.2 8.6
x = 8479$ 7232? 027 119.51 97973 795779 77797 797779 777 777 9338TC (A) 76 T 16.80 2436 0.376 54.53 0.552 80.06 0.792 114.86 4.6 5.9 10.538TC (B) 76 T 17.72 2570 0.341 49.46 0.537 77.88 0.792 114.86 4.4 7.6 12.049TC (A) 76 T 16.85 2444 0.349 50.62 0.539 78.17 0.781 113.27 4.5 7.3 11.8
x = 17.12 1483 055 57757 97573 709 97788 777799 73 93 7777
33LC (A) 4 L 79.55 11537 0.765 110.95 0.897 130.09 1.156 167.65 1.5 5.9 7.4
33LC (B) 4 L 53.17 7711 0.850 123.28 0.955 138.50 1 .183 171.57 2.2 7.4 9.6
33LC (C) 4 L 99.43 14420 0.846 122.70 0.947 137.34 1.210 175.49 1.2 8.7 9.9
35LC (A) 4 L 137.69 19969 - 0.765 110.95 1.206 174.91 0.9 8.5 9.4
x = 92.46 13M 02? 118.98 97S9T 129.32 77799 772777 1 .5 7.6 9335TC (B) 4 T 43.48 6306 0.294 42.64 0.387 56.13 0.807 117.04 2.1 8.4 10.548TC (A) 4 T 46.29 6713 0.475 68.89 0.579 83.97 0.850 123.28 2.0 14.3 16.3
49TC (B) 4 T 45.17 6551 - - - - 0.838 121.53 - - -
x = 44.98 6523 0.384 55.77 0.483 70.05 0.832 120.62 2.0 11.4 13.4
Stress continued to increase as strain increased - no maximum reached.
26
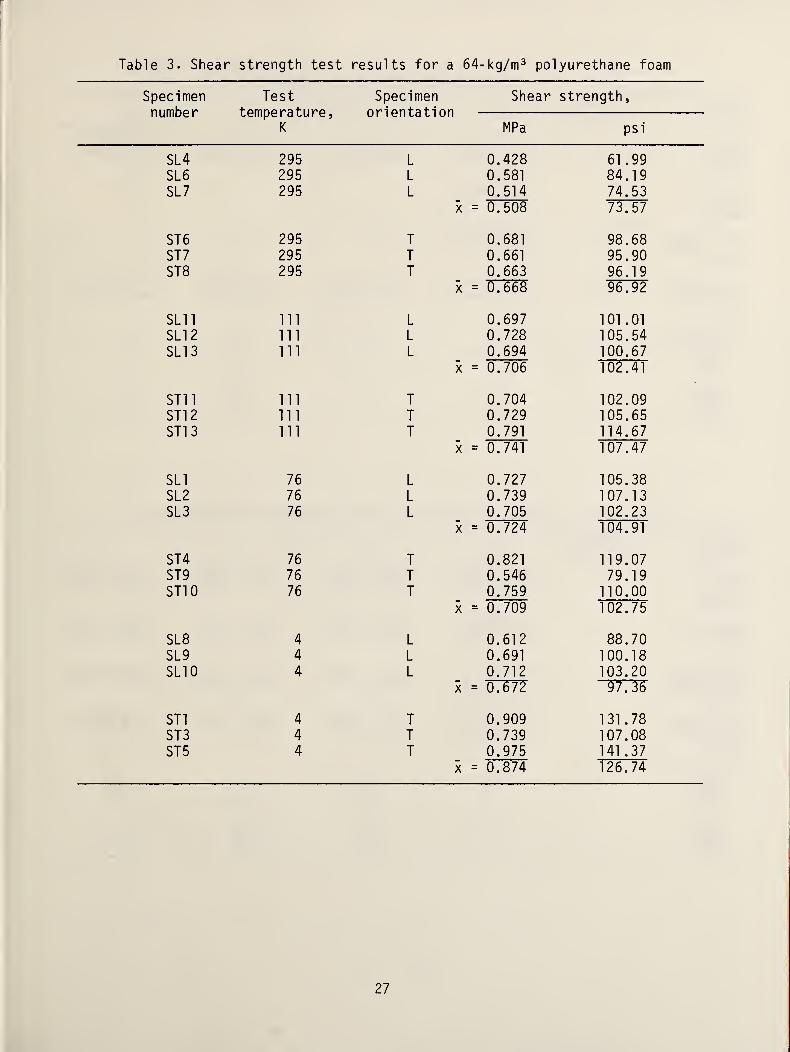
Table 3. Shear strength test results for a 64-kg/m 3 polyurethane foam
Specimennumber
Testtemperature,
K
Specimenorientatior
Shear strength,
MPa psi
SL4 295 L 0.428 61 .99
SL6 295 L 0.581 84.19SL7 295 L 0.514
x = 0.50874.5373.57
ST6 295 T 0.681 98.68ST7 295 T 0.661 95.90ST8 295 T 0.663
x = 0.66896.1996.92
SL1
1
111 L 0.697 101.01
SL1
2
111 L 0.728 105.54SL1 3 111 L 0.694
x = 0.706100.67102.41
ST1
1
111 T 0.704 102.09ST1
2
111 T 0.729 105.65ST1
3
111 T 0.791
x = 0.741
114.67107.47
SL1 76 L 0.727 105.38SL2 76 L 0.739 107.13SL3 76 L 0.705
x = 0.724102.23104.91
ST4 76 T 0.821 119.07ST9 76 T 0.546 79.19ST1
0
76 T 0.759x = 0.709
110.00102.75
SL8 4 L 0.612 88.70SL9 4 L 0.691 100.18SL1
0
4 L 0.712x = 0.672
103.2097.36
ST1 4 T 0.909 131.78ST3 4 T 0.739 107.08ST5 4 T 0.975
x = 0.874141 .37
126.74
27
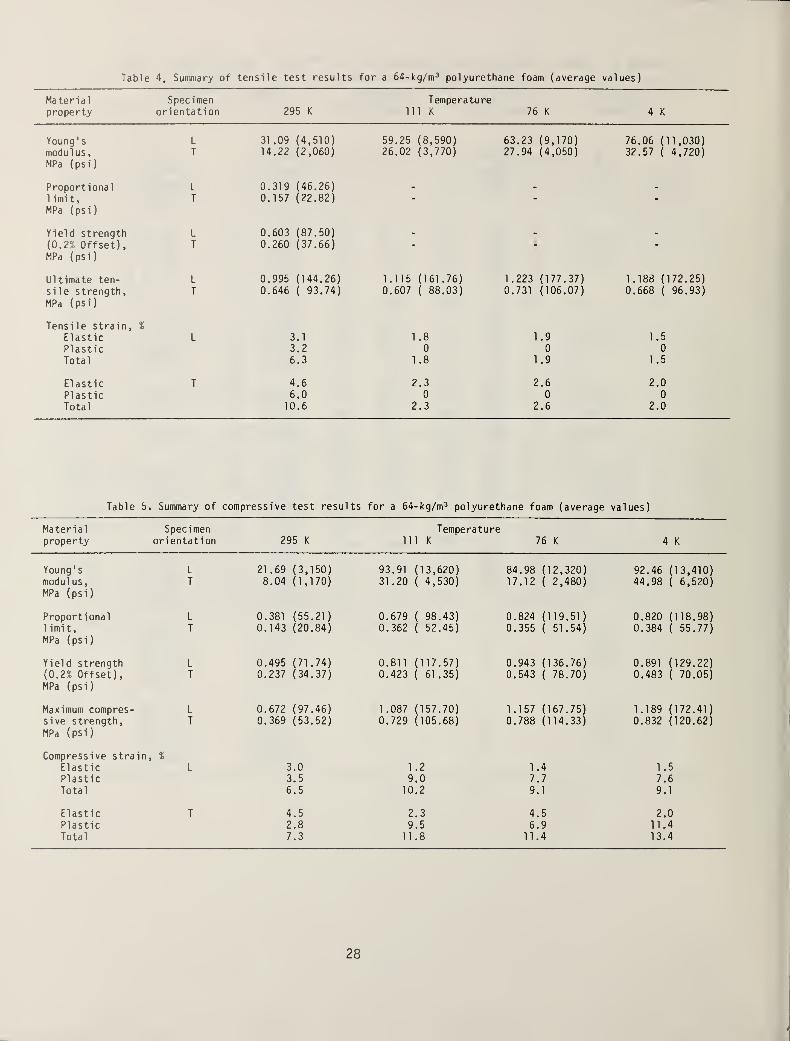
Table 4. Summary of tensile test results for a 64-kg/m 3 polyurethane foam (average values)
Materialproperty
Specimenorientation 295 K
Temperature111 K 76 K 4 K
Young ' s L 31.09 (4,510) 59.25 (8,590) 63.23 (9,170) 76.06 (11,030)modulus
,
MPa (psi)
T 14.22 (2,060) 26.02 (3,770) 27.94 (4,050) 32.57 ( 4,720)
Proportional L 0.319 (46.26) - - -
limit,MPa (psi)
T 0.157 (22.82)
Yield strength L 0.603 (87.50) - . -
( 0 . 2% Offset),MPa (psi)
T 0.260 (37.66)
Ultimate ten- L 0.995 (144.26) 1.115 (161.76) 1.223 (177.37) 1.188 (172.25)
sile strength,
MPa (psi)
Tensile strain,
T
%
0.646 ( 93.74) 0.607 ( 88.03) 0.731 (106.07) 0.668 ( 96.93)
Elastic L 3.1 1 .8 1 .9 1 .5
Plastic 3.2 0 0 0
Total 6.3 1 .8 1 .9 1.5
Elastic T 4.6 2.3 2.6 2.0
Plastic 6.0 0 0 0
Total 10.6 2.3 2.6 2.0
Table 5. Summary of compressive test results for a 64-kg/m 3 polyurethane foam (average values)
Material Specimen Temperatureproperty orientation 295 K 111 K 76 K 4 K
Young's L 21.69 (3,150) 93.91 (13,620) 84.98 (12,320) 92.46 (13,410)modul us
,
MPa (psi)
T 8.04 (1,170) 31.20 ( 4,530) 17.12 ( 2,480) 44.98 ( 6,520)
Proportional L 0.381 (55.21) 0.679 ( 98.43) 0.824 (119.51) 0.820 (118.98)1 imit,
MPa (psi)
T 0.143 (20.84) 0.362 ( 52.45) 0.355 ( 51.54) 0.384 ( 55.77)
Yield strength L 0.495 (71.74) 0.811 (117.57) 0.943 (136.76) 0.891 (129.22)(0.2% Offset),MPa (psi)
T 0.237 (34.37) 0.423 ( 61.35) 0.543 ( 78.70) 0.483 ( 70.05)
Maximum compres- L 0.672 (97.46) 1.087 (157.70) 1.157 (167.75) 1.189 (172.41)sive strength,
MPa (psi)
T 0.369 (53.52) 0.729 (105.68) 0.788 (114.33) 0.832 (120.62)
Compressive strain. %
Elastic L 3.0 1 .2 1 .4 1.5
Plastic 3.5 9.0 7.7 7.6Total 6.5 10.2 9.1 9.1
Elastic T 4.5 2.3 4.5 2.0Plastic 2.8 9.5 6.9 11.4
Total 7.3 11.8 11.4 13.4
28
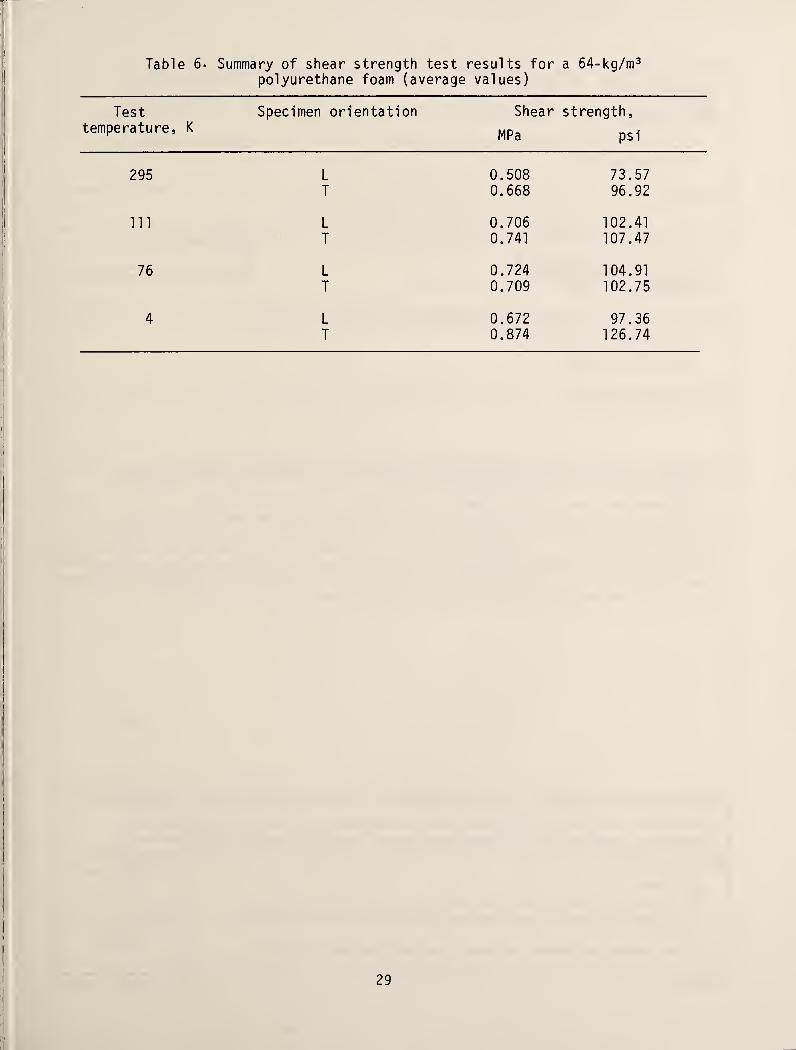
Table 6. Summary of shear strength test results for a 64-kg/m 3
polyurethane foam (average values)
Testtemperature, K
Specimen orientation Shear
MPa
strength,
psi
295 L 0.508 73.57T 0.668 96.92
111 L 0.706 102.41
T 0.741 107.47
76 L 0.724 104.91
T 0.709 102.75
4 L 0.672 97.36T 0.874 126.74
29
NBS-114A jREV. 2-80
U.S. DEPT. OF COMM.
BIBLIOGRAPHIC DATASHEET (See instructions)
1. PUBLICATION ORREPORT NO.
NBSIR 83-1684
2. Performing Organ. Report No 3. Publication Date
February 1983
4. TITLE AND SUBTITLE
Tensile, Compressive, and Shear Properties of a 64 -kg/m Polyurethane Foam at
Low Temperatures
5. AUTHOR(S)J. M. Arvidson, L. L. Sparks, and Chen Guobang
6 . PERFORMING ORGANIZATION (If joint or other than N BS, see instructions) 7 . Contract/Grant No.
national bureau of standardsDEPARTMENT OF COMMERCEWASHINGTON, D.C. 20234
8
.
Type of Report & Period Covered
9.
SPONSORING ORGANIZATION NAME AND COMPLETE ADDRESS (Street. City, State, ZIP)
Gas Research Institute8600 West Bryn Mawr Ave.
Chicago, IL 60631
10.
SUPPLEMENTARY NOTES
/ ]Document describes a computer program; SF-185, FIPS Software Summary, is attached.
11.
ABSTRACT (A 200-word or less factual summary of most significant in formation . If document includes a si gn i fi cantbibliography or literature survey, mention it here)
Polyurethane foam, having a density of 64-kg/m , was tested at 295, 111, 76, and 4 KThe material properties reported are Young's modulus, proportional limit, yieldstrength (at 0.2% offset), tensile, shear, and compressive strengths, and elongation(elastic and plastic). To perform these tests, a unique apparatus was developed. Thisapparatus permits tension, compression, and shear testing of materials at any temperaturanging from 295 to 1.8 K. Strain is measured with a concentric, overlapping-cylindercapacitance extensometer that is highly sensitive and linear in output.
:e
12. KEY WORDS (Six to twelve entries; alphabetical order; capi ta 1 i ze only proper names; and separate key words by semi colon s)
compressive strength; elongation; foam; insulation; low temperatures;mechanical
properties; proportional ]imit; shear strength; tensile strength; yield strength;
13: avATlAbility
[»[] Unlimited
[~ '
'jFor Official Distribution. Do Not Release to NTIS
1 Order From Superintendent of Documents, U.S. Government Printing Office, Washington, D.C.20402.
[X Order From National Technical Information Service (NTIS), Springfield, VA. 22161
14. NO. OFPRINTED PAGES
33
15. Price
$8.50
SPO 838 - 872 USCOMM-DC 8043-P80


’


![Compressibility and thermal expansion of petroleum …nvlpubs.nist.gov/nistpubs/jres/5/jresv5n5p985_A2b.pdf · Jessup] CompressibilityofOils 987 mountedbehindthecapillaryUtube,gh.Theentireapparatus](https://img.pdfslide.net/doc/110x75/5aa76b257f8b9a294b8c0aae/compressibility-and-thermal-expansion-of-petroleum-compressibilityofoils-987.jpg)