Embed Size (px)
Citation preview
Tenth draft. Please do not cite or quote.
Valuing congestion costs in the British Museum
By David Maddison (Department of Economics, University College London, Gower Street, London, WC1E 6BT; also HamburgUniversity) and Terry Foster (Goldman Sachs).
Abstract
Museums are potentially congestible resources because the exhibits they contain are, in any relevant sense of the
word, irreproducible. Insofar as visitor congestion diminishes the value of individuals’ visits it constitutes an
additional reason for charging for admission to museums, albeit one not previously considered. A policy of free
access to a museum containing unique treasures may dissipate the economic benefits of the museum.
Within the context of an empirical study undertaken using valuation techniques it is shown that the congestion
cost posed by the marginal visitor to the British Museum is £8.05. Notwithstanding the argument that visits to themuseum may possess external benefits, this points to the desirability of instigating charges for admission.
Insofar as congestion is a widespread phenomenon in important museums and galleries the issues raised in thispaper as well as the methodology devised to determine congestion costs could have widespread application.
1. Introduction
The British Museum in Bloomsbury in London, one of the greatest museums in the world, was founded by Act of
Parliament in 1753. Originally comprising the collections of Sir Hans Sloane and the Halerian collection of
manuscripts, the museum was first opened to the public in 1759. Today the museum is largely funded by aGovernment grant with additional income secured through sponsorship and a wide range of commercial and
other fund raising activities. The collections of the museum are at the time of writing held in ten departments:
Coins and Medals; Egyptian Antiquities; Ethnography; Greek and Roman Antiquities; Japanese Antiquities;
Mediaeval and Later Antiquities; Oriental Antiquities; Prehistoric and Romano-British Antiquities; Prints and
Drawings; and Western Asiatic Antiquities.
Apart from a brief period in the early 1970s, admission to the British Museum has always been free to visitors
(although a charge is sometimes made for temporary collections). The official attendance figure for the museum in
1999 stood at 5.4 million visitors. Unfortunately, the large number of visitors that the museum attracts can
adversely affect the quality of the experience that it provides. Overcrowding results in queuing, noise, occasional
shoving and ultimately in an inability to view the exhibits. Even on days when there are relatively few visitors,
there may still be an external cost imposed by visitors on each other. The possibility of increased attendanceleading to congestion and disagreeable visiting conditions such that that overall benefit actually declines is also
acknowledged by those with expertise in museum management (see for example Cannon-Brookes 2001).
The objective of this study is to value the congestion costs imposed by visitors to the British Museum on their
fellows. This is achieved by means of a valuation technique (paired comparisons) in which a random sample of
visitors to the British Museum were invited to choose between alternative scenarios described by different levels
of admission charges and differing degrees of congestion. An important advantage of the method used is that it
does not artificially limit the reasons why individuals dislike congestion. This paper represents a first attempt to
devise a methodology for exploring these issues and the technique may be applicable to any site under pressurefrom mass visitation.
There is an existing literature relevant to this paper. The seminal paper of Peacock and Godfrey (1974) sets the
stage for thinking about museums from an economics perspective with the museum as a firm producing anunusual type of product and with specialised labour and the exhibits themselves as the inputs. The issue of
congestion has of course been fully explored in the context of road transport (see for example Newbery 1992).Elsewhere, economic valuation techniques have been applied to cultural issues in the United Kingdom (see
Forrest et al, 2000). There are no examples of such valuation techniques being applied to value the congestionexperienced during visits to museums or galleries. Nor even of use of the technique to value access to museums
in the United Kingdom although see Martin (1994) for the only published attempt to determine the totaleconomic value of a museum (located in Quebec). There is some evidence that individuals dislike experiencing
congestion in other contexts. For example Adamowicz et al (1997) demonstrate that Moose hunters in Albertaare willing to pay more for hunting if there are no other hunters around.
The remainder of the paper is organised as follows. The next section considers arguments for and againstcharging for access to museums. The third section develops a methodology for empirically determining the extent
of congestion costs in the context of a museum. In section four issues related to the empirical implementation ofthe model are discussed. In section five the results of the survey are econometrically analysed and in section six
the results discussed. The final section concludes.
2. Arguments for and against charging for admission to museums
Charging for admission to museums is extraordinarily controversial, perhaps even more so than the pricing of
roads. Historically entrance to museums in Britain has been free but now between 48 and 58 percent of themcharge for admission (see Creigh-Tyte and Selwood 1998). Remaining true to their founding principles the
trustees of the British Museum have always been implacably opposed to charging.
We now consider the arguments for and against subsidising admission to museums, beginning with thedistributional ones. But before doing so it is important to emphasise that what follows are arguments for and
against subsidising visits to museums and not arguments for subsidising museums. This distinction follows from themultiple functions that museums are argued to perform: providing opportunities for recreation and education, and
maintaining collections as a necessary component of nationhood. The latter is a pure public good and thetheoretical case for subsidising pure public goods is clear-cut.
What evidence there is suggests that those people who visit museums come predominantly from the higher social
classes. This immediately suggests that the practice of subsidising visits to the museums is favourable to the richand hardly likely to be an effective way of transferring welfare to poorer people. It appears therefore to be very
difficult to construct an argument for subsidising museum visits on distributional grounds.
The argument heard most often in favour of the continuation of free entry is that the marginal costs of admissionto museums are zero. This argument is overused flawed since additional visitors do indeed impose costs in termsof the security, maintenance and upkeep. Furthermore, whilst it may be true that the marginal costs of visiting a
museum are below the average cost of visiting a museum, this would imply a subsidy for economic efficiency nota zero admission price (see Bailey and Falconer, 1998). It is also, as we shall soon see, incomplete in that it
considers only those costs borne by the museum itself.
There is an argument – unsubstantiated by any empirical evidence – that efforts at revenue raising do not result inadditional overall revenues because the revenues gained are offset to some extent by reductions in government
grants and donations from benefactors and visitors. If this is the case then there is an incentive for museums notto charge (Anderson 1998). Furthermore under a regime of charging museum curators would then be obliged tomount only populist ‘impressionist’ exhibitions to the detriment of the education of the visitors. Whether this is in
fact detrimental or beneficial is highly contentious. But insofar as it might encourage museum curators to adjust
their opening hours for the convenience of visitors it seems like an unambiguously good thing.
It is sometimes suggested that high transactions-costs mean that it is inefficient to charge for entry. This argument
may have some relevance when the dead-weight losses from not charging are outweighed by the resource costsof collecting the admission charges. But transaction technologies are now so advanced that such arguments
cannot really be taken seriously.
Possibly the most respectable argument for the retention of free admissions is the likely although empiricallyunproven existence of positive externalities from such visits (see for example Robbins, 1971). Of course the
presence of external benefits does not in itself represent an argument for free admission, rather it represents an
argument in favour of subsidising visits to the extent that additional subsidies provide benefits at the margin. Some
would say that there ‘external benefits’ in terms of the effects of the museum on the hotels and other businesses inthe proximity of museums that benefit from the free admission policy of museums. This is undoubtedly true but
these are not an external benefit so much as a pecuniary benefit. Pecuniary benefits arising from a policy of free
admission may be of concern if the goal is economic regeneration.
Turning to the arguments in favour of charging, a major argument is that large fractions of the visitors will be from
abroad. Insofar as the government cares only about the welfare of its own citizens then it would presumablyallow free entry for them and profit maximising charges for the foreigners, or at very least a charge that reflects
the mixture of foreign and national visitors (see for example O’Hagan, 1995). Price discrimination on the basis of
nationality will typically be impossible but may be a sensible strategy for museums in less developed countries,especially where there is a large disparity between the incomes of local people and those of foreign tourists. The
imposition of charges for foreign visits represents, according to some, an almost unanswerable case for charging
(see for example O'Hagan 1995) especially when it is considered that foreign
However, the main The final argument in favour of charging for museums is one that has so far received little if
any attention and is the focus of this paper: the need to prevent overcrowding. The basic problem is that, whilstindividuals might make some ex-ante assessment of the likely crowds before deciding whether or not to go to the
museum, no visitor rationally takes account of the congestion that their visit might inflict upon others. In such a
situation a charge is in order to confront individuals with the congestion cost that their presence imposes upon
others. This charge would depend upon the level of demand and might vary considerably with the season. If it istaken at face value, a policy of promoting ‘access for the many rather than for the few’ collides headlong with the
proposition that the contents of museums are congestible resources and that congestion might diminish the value
of the experience to the visitor.
In transport economics the existence of high congestion costs points to the inadequacy of transport infrastructureand suggests that the transport infrastructure should be expanded. In the case of museums however there is
doubt concerning the extent to which increasing floor space could in fact alleviate congestion. The reason is that
the museum exhibits are, in any relevant sense, irreproducible. Increasing floor space cannot reduce congestion
because only the space around the exhibits matters although increasing opening hours might. For this reasoncongestion costs are likely to be an irreducible component of the cost of visiting museums. Yet surprisingly the
argument that congestion costs are significant and represent an important reason why the most popular museums
should charge has not received any attention in the literature.
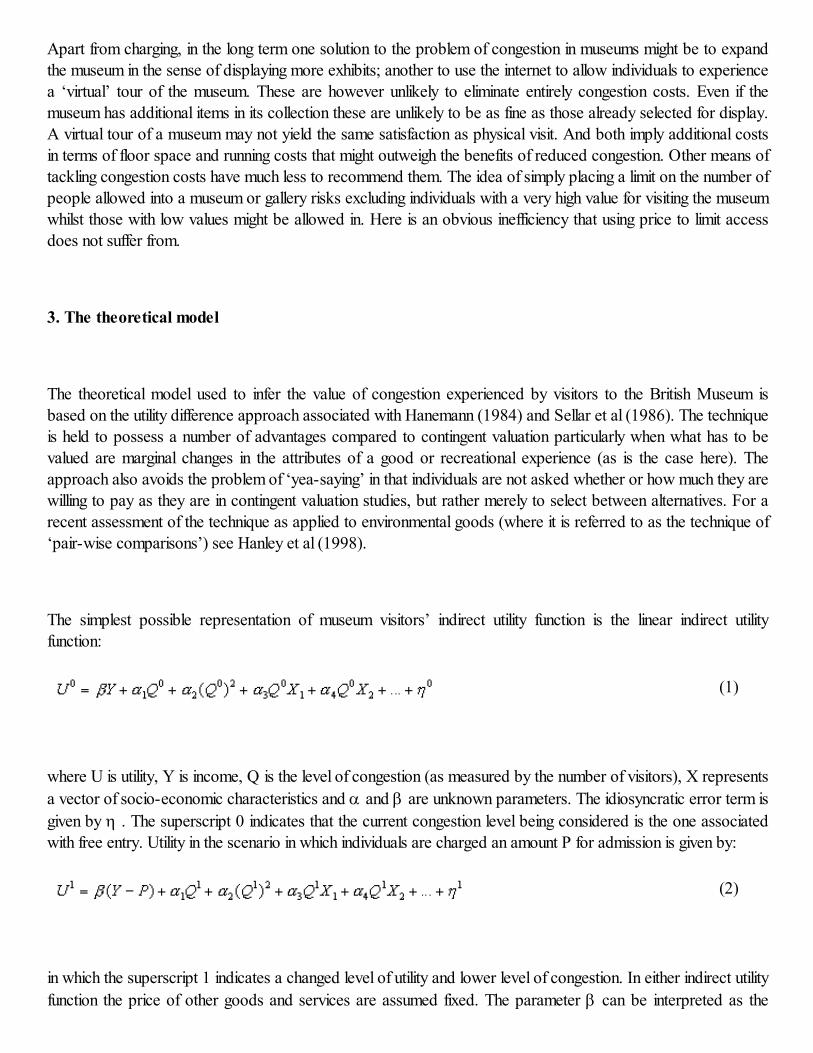
Apart from charging, in the long term one solution to the problem of congestion in museums might be to expand
the museum in the sense of displaying more exhibits; another to use the internet to allow individuals to experience
a ‘virtual’ tour of the museum. These are however unlikely to eliminate entirely congestion costs. Even if themuseum has additional items in its collection these are unlikely to be as fine as those already selected for display.
A virtual tour of a museum may not yield the same satisfaction as physical visit. And both imply additional costs
in terms of floor space and running costs that might outweigh the benefits of reduced congestion. Other means of
tackling congestion costs have much less to recommend them. The idea of simply placing a limit on the number ofpeople allowed into a museum or gallery risks excluding individuals with a very high value for visiting the museum
whilst those with low values might be allowed in. Here is an obvious inefficiency that using price to limit access
does not suffer from.
3. The theoretical model
The theoretical model used to infer the value of congestion experienced by visitors to the British Museum isbased on the utility difference approach associated with Hanemann (1984) and Sellar et al (1986). The technique
is held to possess a number of advantages compared to contingent valuation particularly when what has to be
valued are marginal changes in the attributes of a good or recreational experience (as is the case here). The
approach also avoids the problem of ‘yea-saying’ in that individuals are not asked whether or how much they arewilling to pay as they are in contingent valuation studies, but rather merely to select between alternatives. For a
recent assessment of the technique as applied to environmental goods (where it is referred to as the technique of
‘pair-wise comparisons’) see Hanley et al (1998).
The simplest possible representation of museum visitors’ indirect utility function is the linear indirect utility
function:
(1)
where U is utility, Y is income, Q is the level of congestion (as measured by the number of visitors), X represents
a vector of socio-economic characteristics and a and b are unknown parameters. The idiosyncratic error term is
given by h . The superscript 0 indicates that the current congestion level being considered is the one associatedwith free entry. Utility in the scenario in which individuals are charged an amount P for admission is given by:
(2)
in which the superscript 1 indicates a changed level of utility and lower level of congestion. In either indirect utility
function the price of other goods and services are assumed fixed. The parameter b can be interpreted as the
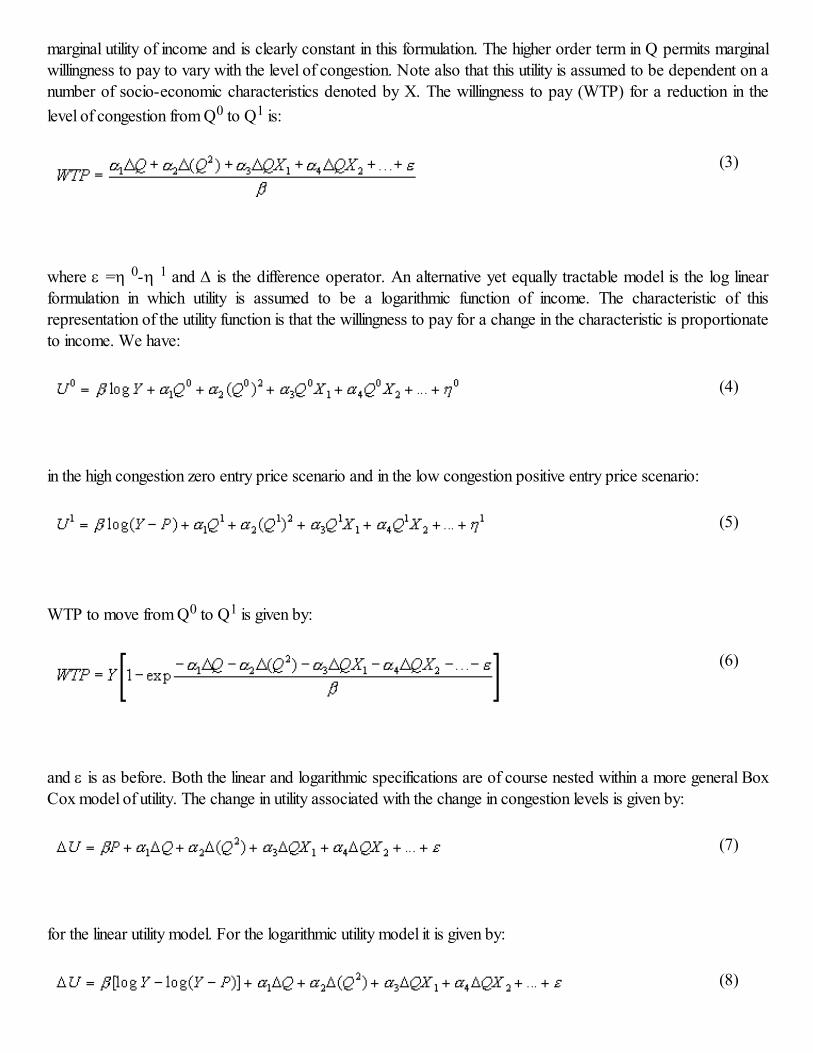
marginal utility of income and is clearly constant in this formulation. The higher order term in Q permits marginal
willingness to pay to vary with the level of congestion. Note also that this utility is assumed to be dependent on a
number of socio-economic characteristics denoted by X. The willingness to pay (WTP) for a reduction in the
level of congestion from Q0 to Q1 is:
(3)
where e =h 0-h 1 and D is the difference operator. An alternative yet equally tractable model is the log linear
formulation in which utility is assumed to be a logarithmic function of income. The characteristic of this
representation of the utility function is that the willingness to pay for a change in the characteristic is proportionateto income. We have:
(4)
in the high congestion zero entry price scenario and in the low congestion positive entry price scenario:
(5)
WTP to move from Q0 to Q1 is given by:
(6)
and e is as before. Both the linear and logarithmic specifications are of course nested within a more general Box
Cox model of utility. The change in utility associated with the change in congestion levels is given by:
(7)
for the linear utility model. For the logarithmic utility model it is given by:
(8)
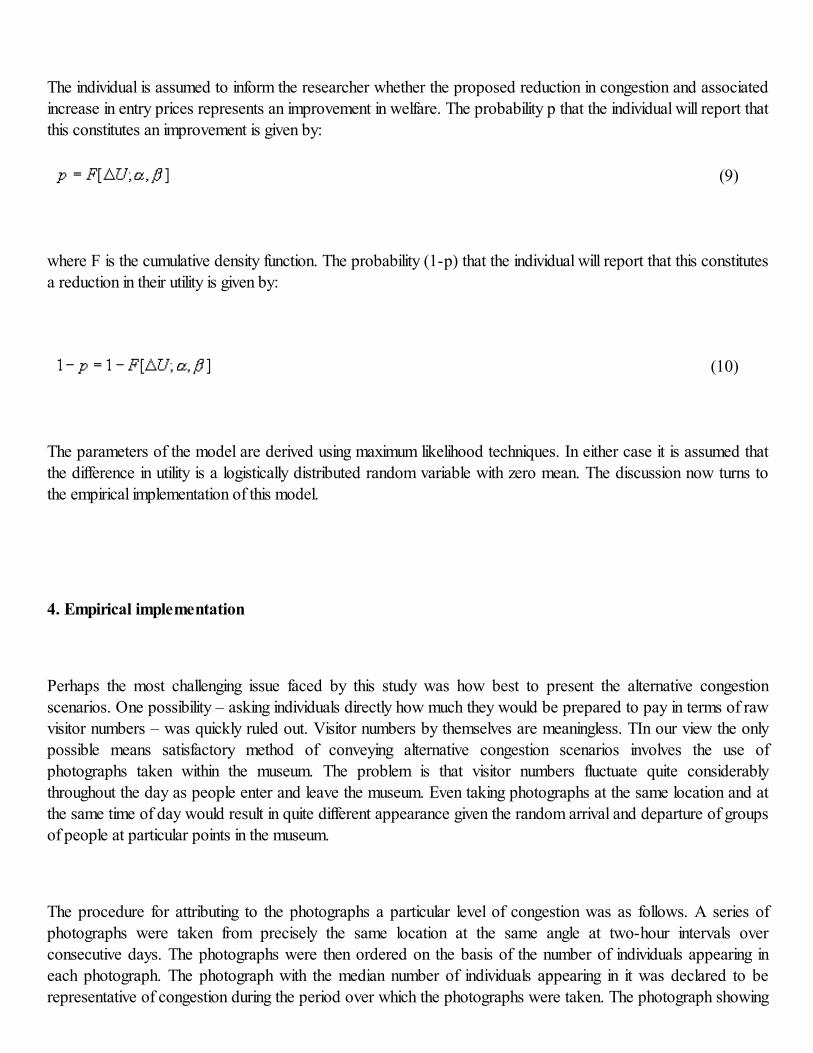
The individual is assumed to inform the researcher whether the proposed reduction in congestion and associated
increase in entry prices represents an improvement in welfare. The probability p that the individual will report that
this constitutes an improvement is given by:
(9)
where F is the cumulative density function. The probability (1-p) that the individual will report that this constitutes
a reduction in their utility is given by:
(10)
The parameters of the model are derived using maximum likelihood techniques. In either case it is assumed that
the difference in utility is a logistically distributed random variable with zero mean. The discussion now turns to
the empirical implementation of this model.
4. Empirical implementation
Perhaps the most challenging issue faced by this study was how best to present the alternative congestion
scenarios. One possibility – asking individuals directly how much they would be prepared to pay in terms of raw
visitor numbers – was quickly ruled out. Visitor numbers by themselves are meaningless. TIn our view the only
possible means satisfactory method of conveying alternative congestion scenarios involves the use ofphotographs taken within the museum. The problem is that visitor numbers fluctuate quite considerably
throughout the day as people enter and leave the museum. Even taking photographs at the same location and at
the same time of day would result in quite different appearance given the random arrival and departure of groups
of people at particular points in the museum.
The procedure for attributing to the photographs a particular level of congestion was as follows. A series of
photographs were taken from precisely the same location at the same angle at two-hour intervals over
consecutive days. The photographs were then ordered on the basis of the number of individuals appearing in
each photograph. The photograph with the median number of individuals appearing in it was declared to be
representative of congestion during the period over which the photographs were taken. The photograph showing
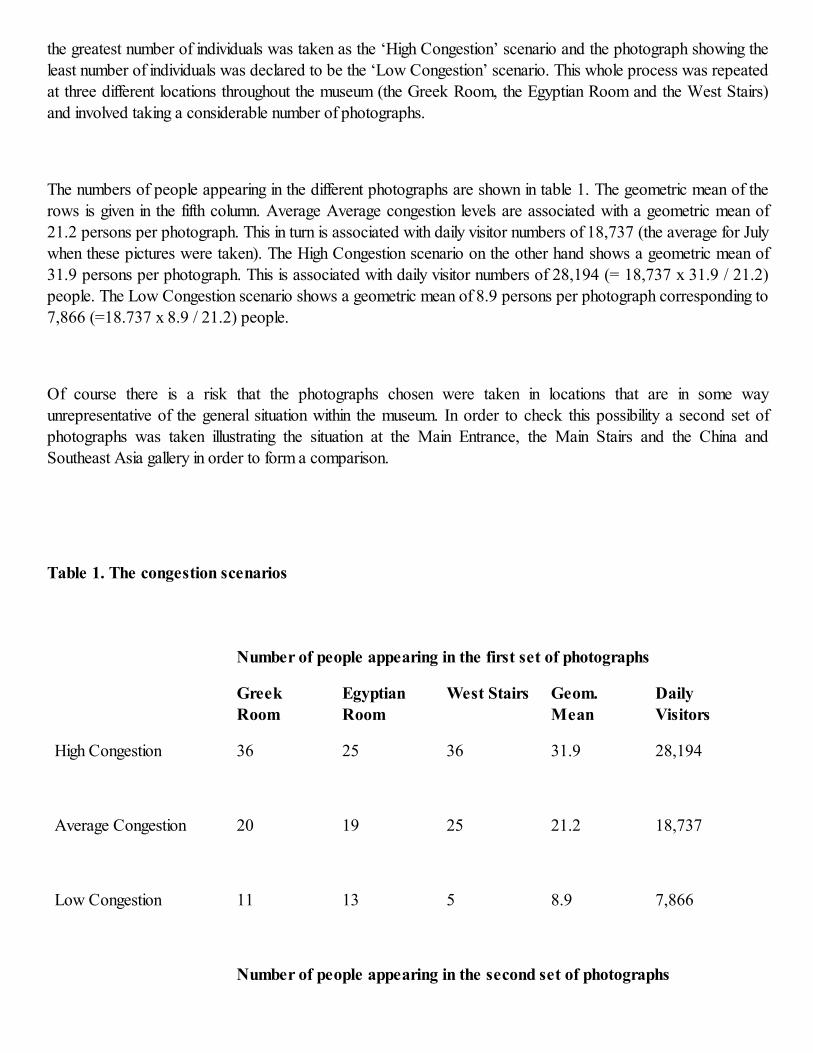
the greatest number of individuals was taken as the ‘High Congestion’ scenario and the photograph showing theleast number of individuals was declared to be the ‘Low Congestion’ scenario. This whole process was repeated
at three different locations throughout the museum (the Greek Room, the Egyptian Room and the West Stairs)
and involved taking a considerable number of photographs.
The numbers of people appearing in the different photographs are shown in table 1. The geometric mean of therows is given in the fifth column. Average Average congestion levels are associated with a geometric mean of
21.2 persons per photograph. This in turn is associated with daily visitor numbers of 18,737 (the average for July
when these pictures were taken). The High Congestion scenario on the other hand shows a geometric mean of
31.9 persons per photograph. This is associated with daily visitor numbers of 28,194 (= 18,737 x 31.9 / 21.2)
people. The Low Congestion scenario shows a geometric mean of 8.9 persons per photograph corresponding to
7,866 (=18.737 x 8.9 / 21.2) people.
Of course there is a risk that the photographs chosen were taken in locations that are in some way
unrepresentative of the general situation within the museum. In order to check this possibility a second set of
photographs was taken illustrating the situation at the Main Entrance, the Main Stairs and the China and
Southeast Asia gallery in order to form a comparison.
Table 1. The congestion scenarios
Number of people appearing in the first set of photographs
GreekRoom
EgyptianRoom
West Stairs Geom.Mean
DailyVisitors
High Congestion
36 25 36 31.9 28,194
Average Congestion
20 19 25 21.2 18,737
Low Congestion
11 13 5 8.9 7,866
Number of people appearing in the second set of photographs

Main
Entrance
Main Stairs Asia Room Geom.
Mean
Daily
Visitors
High Congestion
17 49 25 27.5 25,763
Average Congestion
14 30 19 20.0 18,737
Low Congestion
4 23 13 10.6 9,931
Source: Own calculations.
Each pair-wise comparison involved the individual comparing two alternative scenarios distinguished by the level
of congestion and the existence of an entry charge. Charges of £3, £6, £12 and £20 were randomly chosen. In
order to avoid the choice appearing a purely hypothetical one of the alternatives always involved free admission.Each individual was presented with two different pair-wise comparisons in which the congestion levels and
charges varied.
As an example the individual might have been asked ‘Do you prefer the current scenario with free admission
[show the photomontage depicting High Congestion] or the alternative scenario with an admission charge of
£3 per adult [show the photomontage depicting Average Congestion]? Do you prefer the current scenariowith free admission [show the photomontage depicting High Congestion] or the alternative scenario with an
admission charge of £12 per adult [show the photomontage depicting Low Congestion]?’
Note that in order to make the valuation-experiment acceptable to respondents it was suggested that these
charges would be applied only to persons aged 16 or above. The need to do this is in itself an interesting finding
suggesting suggestive that individuals might see potential benefits for society in the visits of young people. A finalconcern was that rather than basing their decisions on the photomontages presented to them, respondents might
base their decisions on their own experiences gained during their current visit. In order to test for this effect,
individuals were questioned on their way into the museum as well as on their way out.
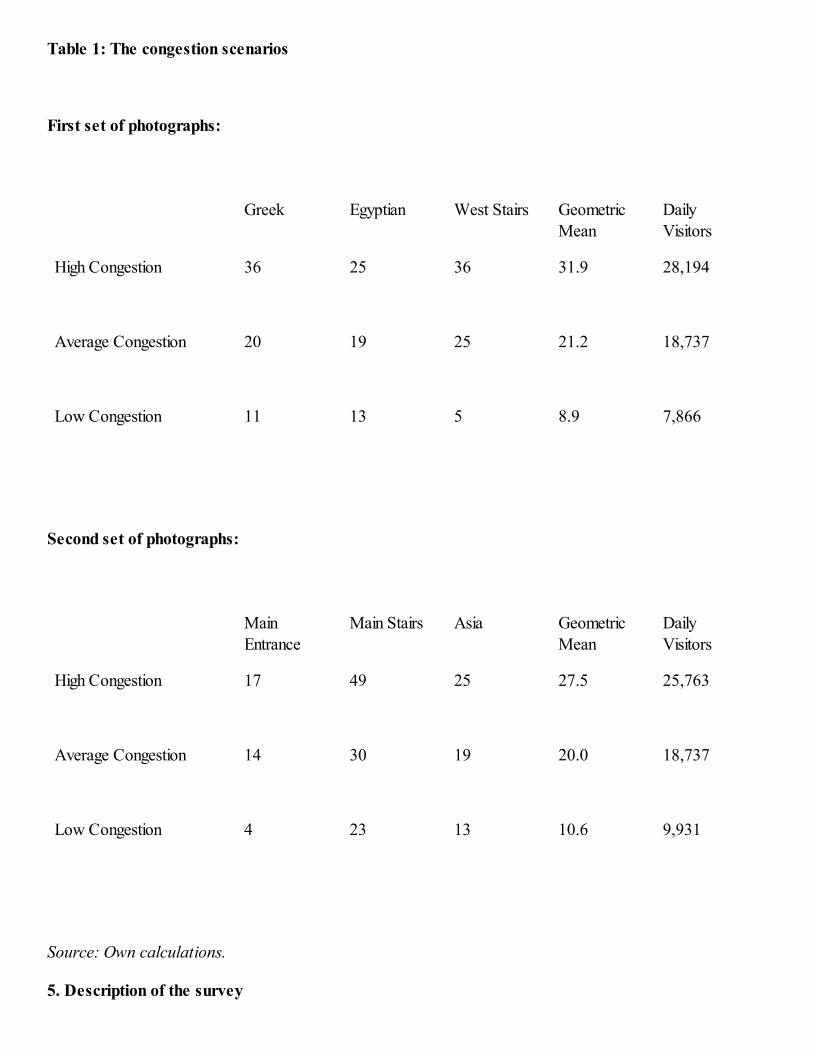
Table 1: The congestion scenarios
First set of photographs:
Greek Egyptian West Stairs Geometric
Mean
Daily
Visitors
High Congestion
36 25 36 31.9 28,194
Average Congestion
20 19 25 21.2 18,737
Low Congestion
11 13 5 8.9 7,866
Second set of photographs:
MainEntrance
Main Stairs Asia GeometricMean
DailyVisitors
High Congestion
17 49 25 27.5 25,763
Average Congestion
14 30 19 20.0 18,737
Low Congestion
4 23 13 10.6 9,931
Source: Own calculations.
5. Description of the survey

The survey instrument went through a number of design phases including focus group analysis and a pilot survey
prior to the main survey. The final questionnaire was divided into three sections. In the first section individuals
were asked about their current use of and attitudes towards the British Museum. The second section dealt with
the valuation of congestion externalities using the method outlined above. The third section collected information
on respondents'’ socio-economic characteristics (chiefly their age, sex, family size, level of education and country
of residence). The survey was conducted by means of face-to-face interviews with individuals entering andleaving the British Museum. Individuals were recruited at random without being informed about the purpose of
the survey. In total 400 individuals were interviewed during August 2000.
Attention should be drawn to one important shortcoming of the sampling of the individuals entering and leaving
the museum. This is the fact that the interviews were conducted only in English. This might have been expected tolead to an over representation of individuals from Britain, North America and other English speaking countries at
the expense of those from South East Asia and Japan. This is a frequent problem with studies of sites with an
international focus. In fact however the percentage of visitors from the United Kingdom included in the very
sample (27 percent) is almost identical to the 25 percent cited on the British Museum’s web-site.
Notwithstanding this potential defect three very notable aspects of the visitor profile are that the visitors to the
museum are extremely highly educated, have after tax household incomes that are far higher than average and are
more often than not, from abroad.
Table 2. Definition of the variables
Variable
Definition
PRICE
Price paid for admission (£s)
D VISITORS
Difference in daily visitor numbers offered to the respondent (thousands)
INCOME
After tax household income (£s)
DEGREE Takes the value unity if the respondent has a degree, a higher degree or professional
equivalent, zero otherwise
MALE Takes the value unity if the respondent is male, zero otherwise
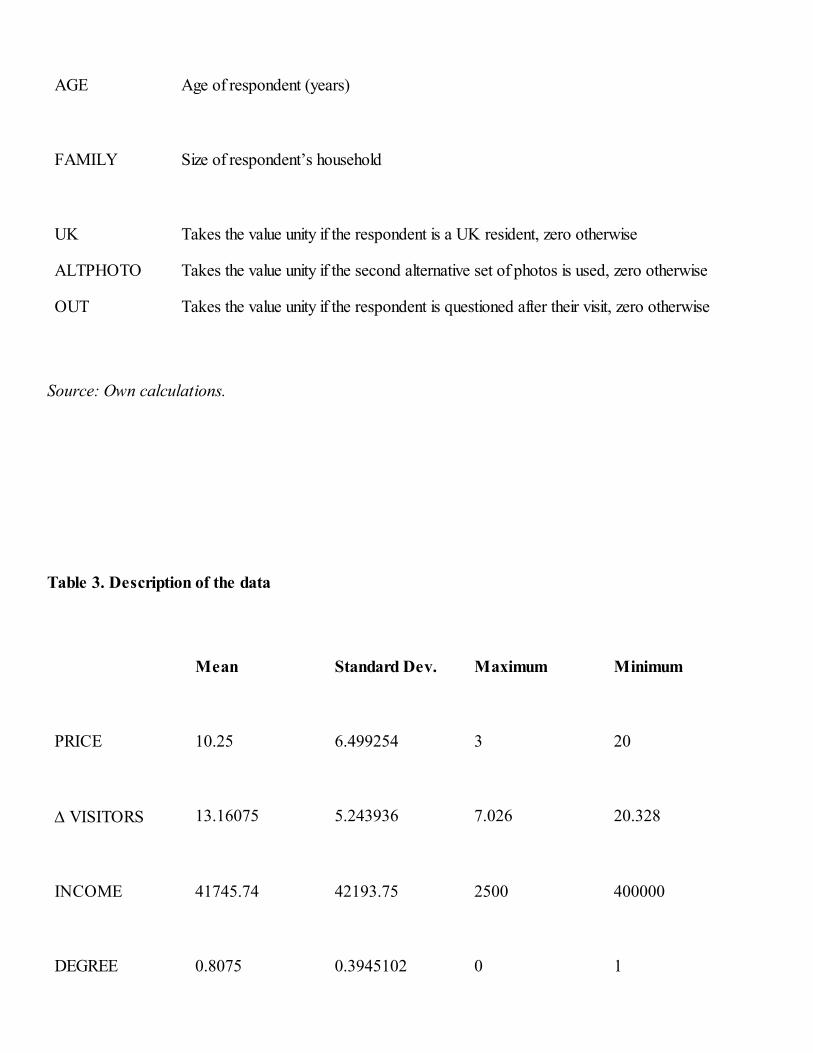
AGE
Age of respondent (years)
FAMILY
Size of respondent’s household
UK Takes the value unity if the respondent is a UK resident, zero otherwise
ALTPHOTO Takes the value unity if the second alternative set of photos is used, zero otherwise
OUT Takes the value unity if the respondent is questioned after their visit, zero otherwise
Source: Own calculations.
Table 3. Description of the data
Mean Standard Dev. Maximum Minimum
PRICE
10.25 6.499254 3 20
D VISITORS
13.16075 5.243936 7.026 20.328
INCOME
41745.74 42193.75 2500 400000
DEGREE
0.8075 0.3945102 0 1
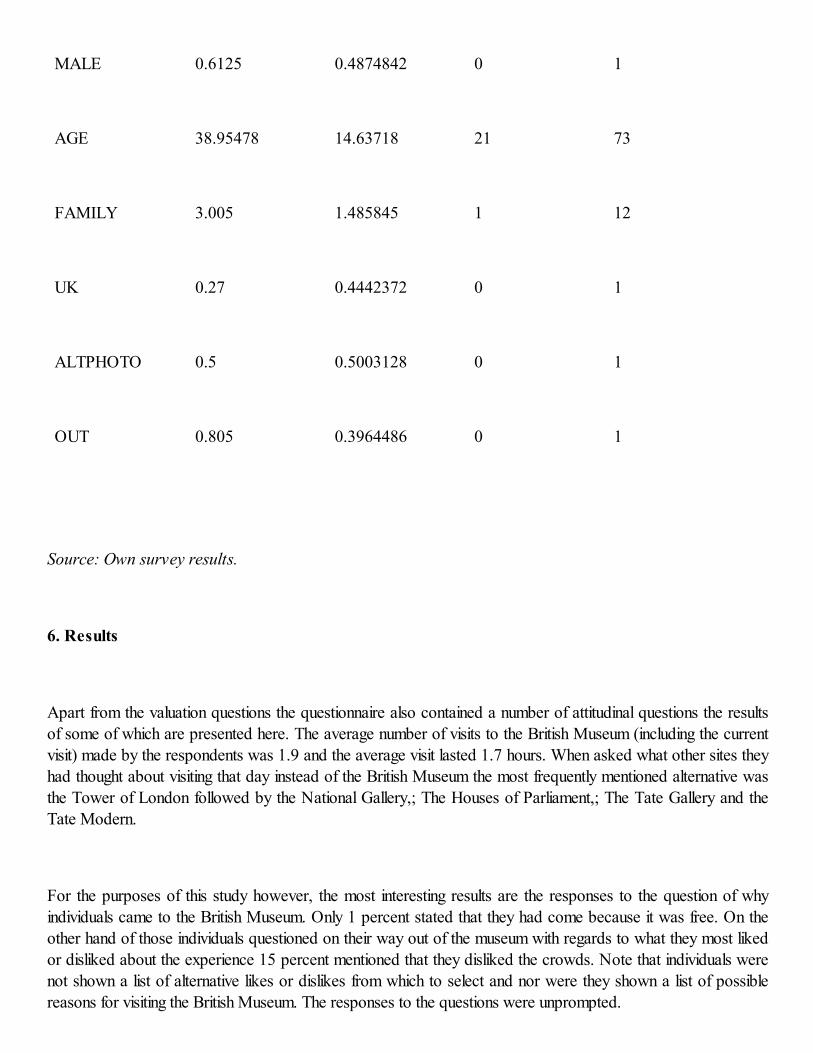
MALE
0.6125 0.4874842 0 1
AGE
38.95478 14.63718 21 73
FAMILY
3.005 1.485845 1 12
UK
0.27 0.4442372 0 1
ALTPHOTO
0.5 0.5003128 0 1
OUT
0.805 0.3964486 0 1
Source: Own survey results.
6. Results
Apart from the valuation questions the questionnaire also contained a number of attitudinal questions the results
of some of which are presented here. The average number of visits to the British Museum (including the currentvisit) made by the respondents was 1.9 and the average visit lasted 1.7 hours. When asked what other sites they
had thought about visiting that day instead of the British Museum the most frequently mentioned alternative wasthe Tower of London followed by the National Gallery,; The Houses of Parliament,; The Tate Gallery and the
Tate Modern.
For the purposes of this study however, the most interesting results are the responses to the question of why
individuals came to the British Museum. Only 1 percent stated that they had come because it was free. On theother hand of those individuals questioned on their way out of the museum with regards to what they most liked
or disliked about the experience 15 percent mentioned that they disliked the crowds. Note that individuals werenot shown a list of alternative likes or dislikes from which to select and nor were they shown a list of possible
reasons for visiting the British Museum. The responses to the questions were unprompted.
The data generated by the valuation experiments were, consistent with the theoretical model presented earlier,analysed using the linear and logarithmic utility models. In these models the differences in the admission price (ordifference in the log of income) were included along with the differences in the number of daily visitors. In order
to permit the marginal valuation of costs imposed by additional visitors to change, the difference in the number ofvisitors squared was also included as a regressor. Other variables relating to the socio-economic characteristics
of the respondent were also included in the analysis, but since these do not vary across choices they wereintroduced by interacting them with the number of visitors. Note that a variable was included the purpose of
which was to determine whether the use of an alternative set of photographs exerted any influence on willingnessto pay for reducing congestion. Another variable was included in order to determine whether the responses ofindividuals entering and exiting from the museum differed. Finally we include an alternative-specific constant term.
Table 34 details the results from both models (see the first and second columns). Note that because each
individual was asked to complete two pair-wise comparisons, the random errors between the two observationscontributed by the same individual might not be independent of each other. The standard errors of the model
have therefore been adjusted such that they are robust in the face of possible correlations of this kind. In eithercase both cases the hypothesis of zero slopes is easily rejected. We also ran separate regressions for eachalternative set of photographs (not shown) but these regressions did not result in a statistically significant
improvement in fit. Note that although only the coefficients relating to the utility of income are individuallystatistically significant the remaining variables are highly significant as a group.
The two models are compared across the same sample of observations by examining the log likelihood, the
Pseudo R2 and the percentage of correct predictions. The linear utility model appears to outperform thelogarithmic utility model on all countsand this model is model used for analysis in the next section. This model was
then simplified using stepwise regression to remove statistically insignificant parameters (see the third column oftable 4). The resulting equation, which cannot be rejected against the more general specification, includes the
constant term, the price variable and both the age and education variables interacted with the change in thenumber of visitors. Neither the variable that indicates whether the first or second set of photographs was usednor the variable indicating whether individuals were questioned on the way in or the way out appears in the
simplified equation.
Combined with the negative coefficients on the latter two variables the implication is that the better-educated andolder visitors to the museum care more about congestion than younger and the less well-educated. This is notimplausible and it is easy to build a story of better-educated individuals having a greater appreciation of the
exhibits and the elderly less tolerant of congestion than younger individuals.
The statistical significance of the alternative-specific constant also deserves some comment. The purpose ofincluding a constant is generally to capture those characteristics of the choices not included in the model. In this
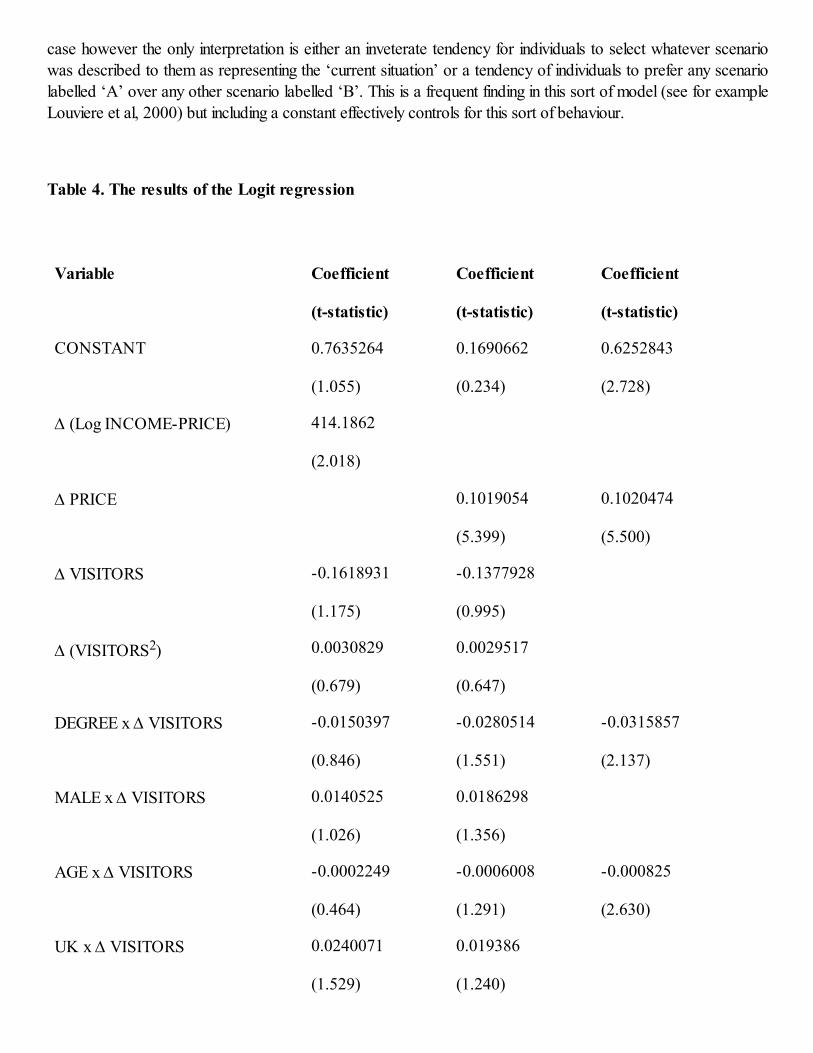
case however the only interpretation is either an inveterate tendency for individuals to select whatever scenariowas described to them as representing the ‘current situation’ or a tendency of individuals to prefer any scenario
labelled ‘A’ over any other scenario labelled ‘B’. This is a frequent finding in this sort of model (see for exampleLouviere et al, 2000) but including a constant effectively controls for this sort of behaviour.
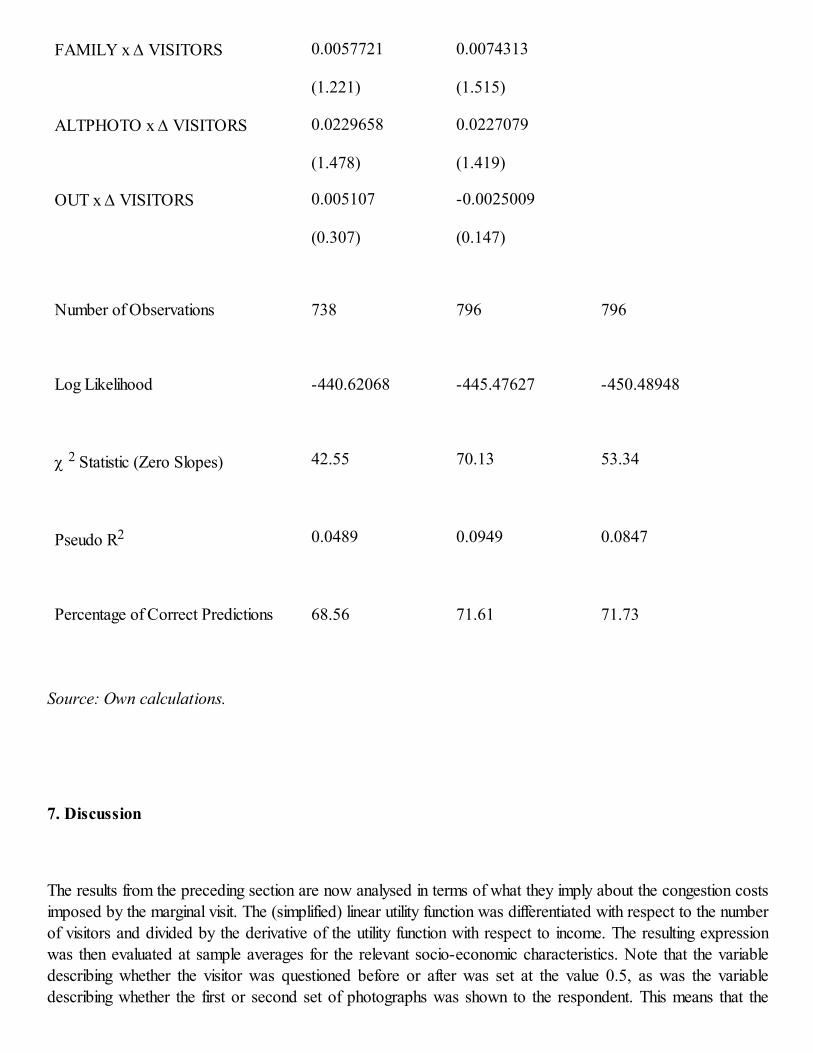
Table 4. The results of the Logit regression
Variable Coefficient
(t-statistic)
Coefficient
(t-statistic)
Coefficient
(t-statistic)
CONSTANT
0.7635264
(1.055)
0.1690662
(0.234)
0.6252843
(2.728)
D (Log INCOME-PRICE)
414.1862
(2.018)
D PRICE 0.1019054
(5.399)
0.1020474
(5.500)
D VISITORS -0.1618931
(1.175)
-0.1377928
(0.995)
D (VISITORS2) 0.0030829
(0.679)
0.0029517
(0.647)
DEGREE x D VISITORS -0.0150397
(0.846)
-0.0280514
(1.551)
-0.0315857
(2.137)
MALE x D VISITORS 0.0140525
(1.026)
0.0186298
(1.356)
AGE x D VISITORS -0.0002249
(0.464)
-0.0006008
(1.291)
-0.000825
(2.630)
UK x D VISITORS 0.0240071
(1.529)
0.019386
(1.240)
FAMILY x D VISITORS
0.0057721
(1.221)
0.0074313
(1.515)
ALTPHOTO x D VISITORS 0.0229658
(1.478)
0.0227079
(1.419)
OUT x D VISITORS 0.005107
(0.307)
-0.0025009
(0.147)
Number of Observations
738 796 796
Log Likelihood
-440.62068 -445.47627 -450.48948
c 2 Statistic (Zero Slopes)
42.55 70.13 53.34
Pseudo R2
0.0489 0.0949 0.0847
Percentage of Correct Predictions 68.56 71.61 71.73
Source: Own calculations.
7. Discussion
The results from the preceding section are now analysed in terms of what they imply about the congestion costs
imposed by the marginal visit. The (simplified) linear utility function was differentiated with respect to the numberof visitors and divided by the derivative of the utility function with respect to income. The resulting expression
was then evaluated at sample averages for the relevant socio-economic characteristics. Note that the variabledescribing whether the visitor was questioned before or after was set at the value 0.5, as was the variabledescribing whether the first or second set of photographs was shown to the respondent. This means that the
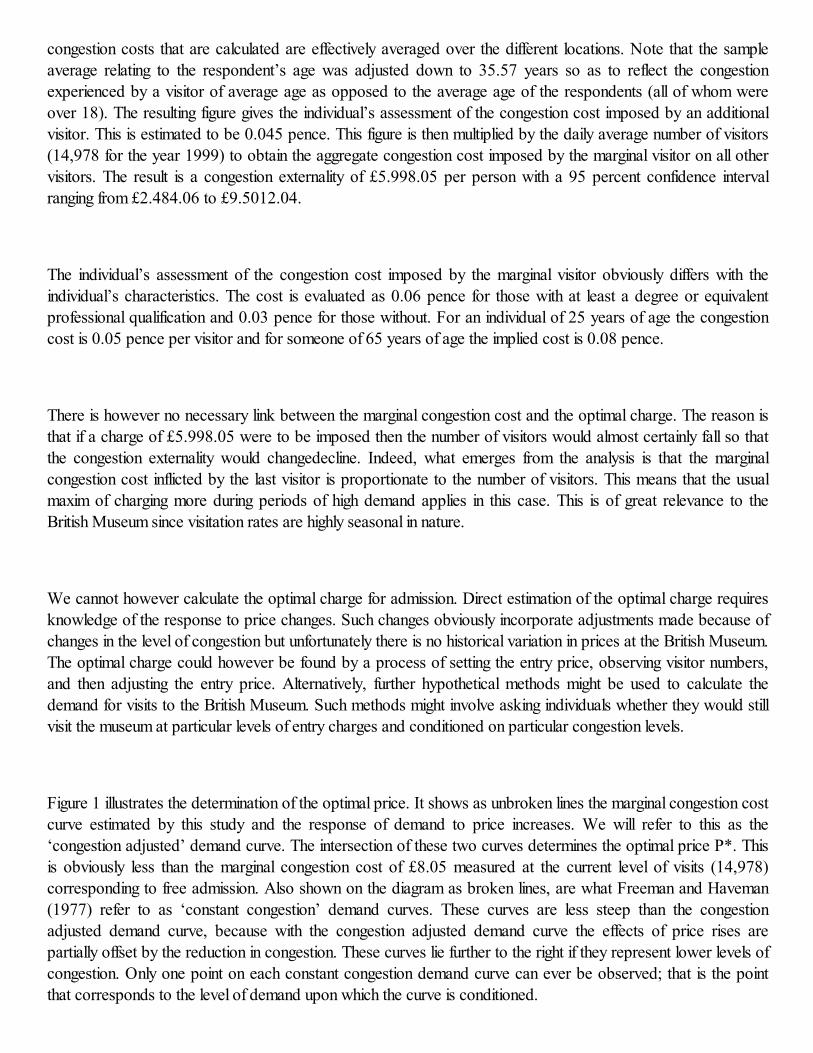
congestion costs that are calculated are effectively averaged over the different locations. Note that the sampleaverage relating to the respondent’s age was adjusted down to 35.57 years so as to reflect the congestion
experienced by a visitor of average age as opposed to the average age of the respondents (all of whom wereover 18). The resulting figure gives the individual’s assessment of the congestion cost imposed by an additionalvisitor. This is estimated to be 0.045 pence. This figure is then multiplied by the daily average number of visitors
(14,978 for the year 1999) to obtain the aggregate congestion cost imposed by the marginal visitor on all othervisitors. The result is a congestion externality of £5.998.05 per person with a 95 percent confidence interval
ranging from £2.484.06 to £9.5012.04.
The individual’s assessment of the congestion cost imposed by the marginal visitor obviously differs with the
individual’s characteristics. The cost is evaluated as 0.06 pence for those with at least a degree or equivalentprofessional qualification and 0.03 pence for those without. For an individual of 25 years of age the congestion
cost is 0.05 pence per visitor and for someone of 65 years of age the implied cost is 0.08 pence.
There is however no necessary link between the marginal congestion cost and the optimal charge. The reason is
that if a charge of £5.998.05 were to be imposed then the number of visitors would almost certainly fall so thatthe congestion externality would changedecline. Indeed, what emerges from the analysis is that the marginal
congestion cost inflicted by the last visitor is proportionate to the number of visitors. This means that the usualmaxim of charging more during periods of high demand applies in this case. This is of great relevance to the
British Museum since visitation rates are highly seasonal in nature.
We cannot however calculate the optimal charge for admission. Direct estimation of the optimal charge requires
knowledge of the response to price changes. Such changes obviously incorporate adjustments made because ofchanges in the level of congestion but unfortunately there is no historical variation in prices at the British Museum.
The optimal charge could however be found by a process of setting the entry price, observing visitor numbers,and then adjusting the entry price. Alternatively, further hypothetical methods might be used to calculate the
demand for visits to the British Museum. Such methods might involve asking individuals whether they would stillvisit the museum at particular levels of entry charges and conditioned on particular congestion levels.
Figure 1 illustrates the determination of the optimal price. It shows as unbroken lines the marginal congestion costcurve estimated by this study and the response of demand to price increases. We will refer to this as the
‘congestion adjusted’ demand curve. The intersection of these two curves determines the optimal price P*. Thisis obviously less than the marginal congestion cost of £8.05 measured at the current level of visits (14,978)corresponding to free admission. Also shown on the diagram as broken lines, are what Freeman and Haveman
(1977) refer to as ‘constant congestion’ demand curves. These curves are less steep than the congestionadjusted demand curve, because with the congestion adjusted demand curve the effects of price rises are
partially offset by the reduction in congestion. These curves lie further to the right if they represent lower levels ofcongestion. Only one point on each constant congestion demand curve can ever be observed; that is the point
that corresponds to the level of demand upon which the curve is conditioned.
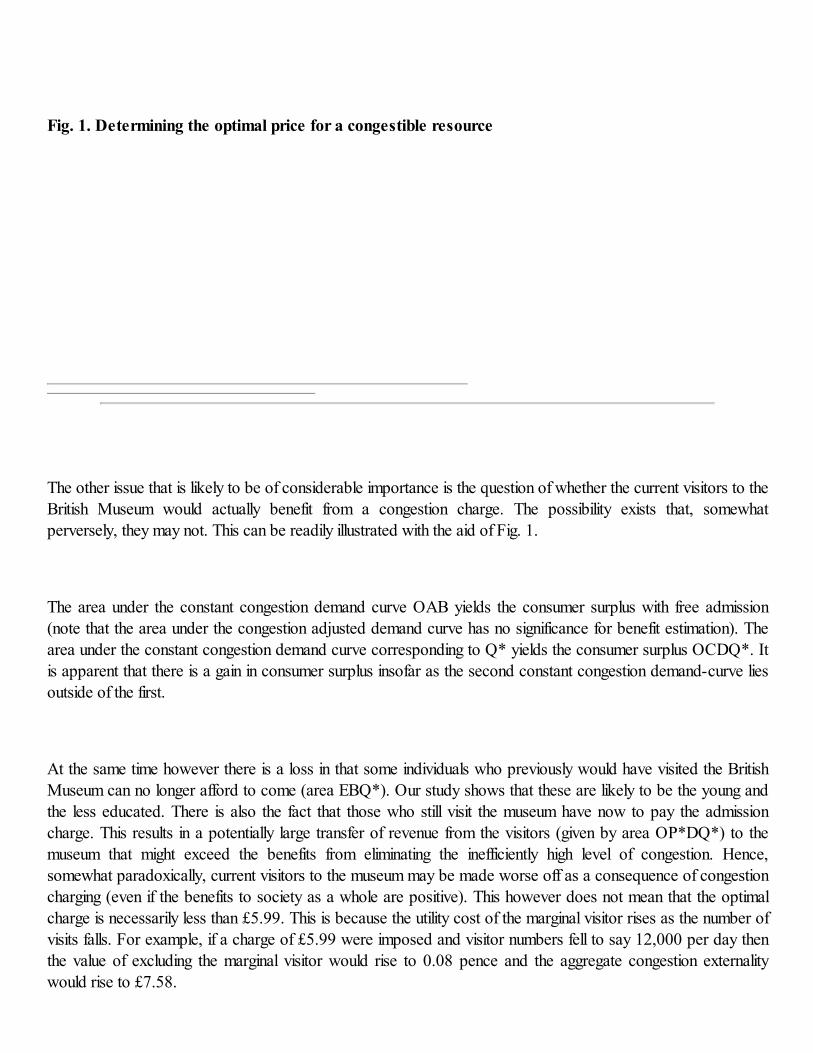
Fig. 1. Determining the optimal price for a congestible resource
The other issue that is likely to be of considerable importance is the question of whether the current visitors to the
British Museum would actually benefit from a congestion charge. The possibility exists that, somewhatperversely, they may not. This can be readily illustrated with the aid of Fig. 1.
The area under the constant congestion demand curve OAB yields the consumer surplus with free admission(note that the area under the congestion adjusted demand curve has no significance for benefit estimation). The
area under the constant congestion demand curve corresponding to Q* yields the consumer surplus OCDQ*. Itis apparent that there is a gain in consumer surplus insofar as the second constant congestion demand-curve lies
outside of the first.
At the same time however there is a loss in that some individuals who previously would have visited the British
Museum can no longer afford to come (area EBQ*). Our study shows that these are likely to be the young andthe less educated. There is also the fact that those who still visit the museum have now to pay the admission
charge. This results in a potentially large transfer of revenue from the visitors (given by area OP*DQ*) to themuseum that might exceed the benefits from eliminating the inefficiently high level of congestion. Hence,
somewhat paradoxically, current visitors to the museum may be made worse off as a consequence of congestioncharging (even if the benefits to society as a whole are positive). This however does not mean that the optimalcharge is necessarily less than £5.99. This is because the utility cost of the marginal visitor rises as the number of
visits falls. For example, if a charge of £5.99 were imposed and visitor numbers fell to say 12,000 per day thenthe value of excluding the marginal visitor would rise to 0.08 pence and the aggregate congestion externality
would rise to £7.58.
8. Conclusions
This paper has examined the relevance of a hitherto neglected argument in favour of charging for museums: thepresence of significant congestion costs. Whilst the argument was developed in the context of the British Museum
the same model could be applied to any museum or gallery or indeed other sites of cultural heritage.
The findings suggest that individuals do indeed consider the British Museum to be congested and would be
prepared to pay something in order to experience less congestion during their visit. Individual evaluations ofcongestion costs appear to be affected by the age and educational attainments of the respondent. There is some
(admittedly weaker) evidence that these congestion costs do not vary significantly with income levels. The otherinteresting finding is that the characteristics of individuals visiting the British Museum are such that there is quite a
strong argument for charging on distributional grounds. The visitors are mainly foreign, with high educationalattainment and very high household incomes.
The implication is that there may be a significant loss of economic benefits by continuing with a policy of freeadmission quite apart from all the other resource costs of admitting visitors. Such a view would however be
premature until the main argument in favour of free (or more precisely subsidised) admission is properly explored– namely the idea that visits to visiting museums confers some benefit on the rest of society.
Empirical studies of the external benefits of visits to museums might attempt to determine whether individualsview external benefits arising from the visits of British people and foreign people, as well as the visits of children
and adults, differently. Such studies might also attempt to determine visits to what sorts of museums generateexternal benefits. For the purposes of this study it would also be interesting to know whether individuals derive
benefits from others’ visits to museums irrespective of how congested these museums happen to be at the timeand other parameters affecting the quality of the experience.
Finally the paper also shows why visitors to museums might well oppose the introduction of congestion charging.Basically it is because the charges paid might exceed the benefits in terms of reduced congestion. We further
speculate that museums themselves might also be opposed to congestion charging if they perceive that therevenues they collect are likely to lead to corresponding reductions in Government subsidies and privatedonations.

Acknowledgements
The assistance of the British Museum is acknowledged but it is emphasised that the work was not commissionedby the British Museum and the views that it contains are those of the authors only. The authors are grateful toDavid Pearce, Brett Day, Peter Johnson and two anonymous referees for helpful comments on an earlier version
of this paper. This paper was presented to a meeting of the ESRC supported Economics of Sports, Arts andLeisure study group. Both authors would like to thank the participants of that meeting for their helpful comments.
References
Adamowicz, W., Swait, J., Boxall, P., Louviere, J. and Williams, M. (1997). ‘Perceptions VersusObjective Measures of Environmental Quality in Combined Revealed and Stated Preference
Models of Environmental Valuation’, Journal of Environmental Economics and Management,32, 65-84.
Anderson, R. (1998). ‘Is Charging Economic?’, Journal of Cultural Economics, 22, 179-87.
Bailey, S. and Falconer, P. (1998). ‘Charging for Admission to Museums and Galleries: AFramework for Analysing the Impact on Access’, Journal of Cultural Economics, 22, 167-77.
Beggs, S., Cardell, S. and Hausman, J. (1981). ‘Assessing the Potential Demand for ElectricCars’, Journal of Econometrics, 16, 1-19.
Cannon-Brookes, P. (2001). ‘The Place of Cultural Economic Analyses in the Management of
Art Museums’, Paper presented to a conference on Economics and Cultural Heritage in theUniversity of Roma Tre, Rome.
Creigh-Tyte, S. and Selwood, S. (1998). ‘Museums in the UK: some evidence on scale andactivities’, Journal of Cultural Economics, 22, 151-65.
Forrest, D., Grime, K. and Woods, R. (2000). ‘Is it Worth Subsidising Regional Repertory
Theatre?’ Oxford Economic Papers, 52, 381-97.
Freeman, M. and Haveman, R. (1977). ‘Congestion, Quality Deterioration and HeterogenousTastes’, Journal of Public Economics, 8, 225-32.
Frey, B. (1994). ‘Cultural Economics and Museum Behaviour’, Scottish Journal of PoliticalEconomy, 41, 325-35.
Hanemann, M. (1984). ‘Welfare Evaluations in Contingent Valuation Experiments with DiscreteResponses.’, American Journal of Agricultural Economics, 81(3):, 635-647.
Hanley, N., Wright, R. and Adamowicz, V. (1998). ‘Using Choice Experiments to Value theEnvironment’, Environmental and Resource Economics, 11, 413-28.
Johnson, P. and Thomas, B. (1998). ‘The Economics of Museums: A Research Perspective’,
Journal of Cultural Economics, 22, 75-85.
Louviere, J., Hensher, D., and Swait, J. (2000). Stated Choice Methods, Cambridge University
Press, Cambridge.
Martin, F. (1994). ‘Determining the Size of Museum Subsidies’, Journal of Cultural Economics,18, 255-70.
Newbery, D. (1992). ‘Pricing and Congestion: Economic Principles Relevant to Pricing Roads’,Oxford Review of Economic Policy, 6, 22-37.
O’Hagan, J. (1995). ‘National Museums: To Charge or not To Charge?’, Journal of CulturalEconomics, 19, 33-47.
Peacock, A. and Godfrey, C. (1974). ‘The Economics of Museums and Galleries’, The Lloyds
Bank Review, 111, 17-28.
Robbins, L. (1971). ‘Unsettled Questions in the Political Economy of the Arts’, The Three Banks
Review, 91, 3-19.
Sellar, C., Chavas, J. and Stoll, J. (1986) Specification of the Logit Model: The Case of Valuation
of Nonmarket Goods. Journal of Environmental Economics and Management 13(4): 382-390.