Embed Size (px)
Citation preview

Distribution and population genetics of the threatenedfreshwater crayfish genus Tenuibranchiurus (Decapoda :Parastacidae)
Author
Dawkins, Kat, Furse, James, Wild, Clyde, Hughes, Jane
Published
2010
Journal Title
Marine and Freshwater Research
DOI
https://doi.org/10.1071/MF09294
Copyright Statement
© 2010 CSIRO. This is the author-manuscript version of this paper. Reproduced in accordancewith the copyright policy of the publisher. Please refer to the journal's website for access to thedefinitive, published version.
Downloaded from
http://hdl.handle.net/10072/37618
Griffith Research Online
https://research-repository.griffith.edu.au

1
Distribution and population genetics of the threatened freshwater crayfish genus
Tenuibranchiurus (Decapoda: Parastacidae)
Kathryn L. DawkinsA*
, James M. FurseB, Clyde H. Wild
B, Jane M. Hughes
C
A Australian Rivers Institute, Griffith University, Gold Coast, Qld 4222, Australia. 5
B Environmental Futures Centre, Griffith University, Gold Coast, Qld 4222, Australia.
C Australian Rivers Institute, Griffith University, Nathan, Qld 4111, Australia.
* Corresponding author: Tel: +61 7 5552 8140
Email: [email protected]
10
Abstract. Very high rates of extinction are recorded in freshwater ecosystems, with
coastally distributed species threatened by urban development, pollution and climate
change. One example, the world’s second smallest freshwater crayfish (genus
Tenuibranchiurus), inhabits coastal swamps in central-eastern Australia. Although
only one species is described (Tenuibranchiurus glypticus), it was expected that 15
populations isolated through habitat fragmentation would be highly divergent. The
aims of this study were to determine if: populations of Tenuibranchiurus are
genetically distinct, and if ancient divergence, as indicated in other species in the
region, was evident. Tenuibranchiurus were collected at seven sites, extending the
known geographical distribution ~260 km south to Wooli, NSW. Analysis of two 20
mitochondrial DNA gene regions indicated two highly divergent clades, with
numerous additional sub-clades. Both clades and sub-clades were strongly congruent
with geographical location, and were estimated to have diverged from each other
during the Miocene/Pliocene era. Little sharing of haplotypes between sub-
populations was evident, indicating negligible gene flow, and genetic differentiation 25
between sub-clades possibly indicates distinct species. The coastal distribution of
Tenuibranchiurus, severe habitat fragmentation and clear differences between sub-
clades suggests they should be recognised as evolutionarily significant units, and be
treated as such if conservation and management initiatives are warranted.
30

2
Introduction
With extinctions occurring in freshwater ecosystems faster than any other habitat
(Ricciardi and Rasmussen 1999; Loh 2002; Jenkins 2003), it is critical to understand
current patterns of diversity in our rivers and streams. High levels of cryptic diversity
have been found in many freshwater species (Baker et al. 2003; Baker et al. 2004; 35
Cook et al. 2006) and in many cases, these cryptic species appear to have diverged
during the Miocene or Pliocene. Despite similar morphologies, they often have
different distributions from one another (Chenoweth and Hughes 2003; Cook et al.
2006; Page and Hughes 2007). It is vital to determine the levels of cryptic diversity
and the patterns of distribution for freshwater species to conserve and maintain 40
biodiversity. If these factors are ignored, it is likely that management plans will be
ineffective and possibly result in loss of species (Margules and Pressey 2000; Cook et
al. 2008a).
One practice for maintaining the evolutionary heritage of populations is through the 45
identification of evolutionarily significant units (ESUs). There are many definitions
as to what constitutes an ESU; however, Moritz (1994) attempted an operational
definition, specifying that ESUs should be “reciprocally monophyletic for mtDNA
and show significant divergence of allele frequencies at nuclear loci”. Based on this
definition, many ESUs have been identified within previously described crayfish 50
species, including Cherax tenuimanus (Smith) from Western Australia (Nguyen et al.
2002), and Austropotamobius pallipes (Lereboullet) from France (Gouin et al. 2006),
Italy (Fratini et al. 2005) and the Iberian Peninsula (Dieguez-Uribeondo et al. 2008).
In Australia, freshwater crayfish are of particular interest because a number of species 55
inhabit small coastal streams throughout Queensland (Qld) and New South Wales
(NSW). Much of their habitat is highly fragmented, often separated by extensive
areas of unsuitable or degraded habitat (mostly urban development). Many of these
species are habitat specialists and are often geographically isolated from one another,
a situation likely to lead to genetic divergence and possibly speciation over 60
evolutionary time. Studies on a number of freshwater species in the region have
shown evidence of high levels of genetic divergence among some populations as well
as phylogeographic breaks along the NSW and Qld border, including Macrobrachium
australiense Holthius (Carini and Hughes 2004; Sharma and Hughes 2009), Cherax

3
dispar Riek (Bentley et al. 2010), Rhadinocentrus ornatus Regan (Page et al. 2004) 65
and Nannoperca oxleyana Whitley (Hughes et al. 1999; Knight et al. 2009). Because
previous studies demonstrate that these organisms living in coastal habitats exhibit
high levels of genetic divergence, it is likely that Tenuibranchiurus, a genus of
freshwater crayfish confined to the same coastal habitat (i.e. a similar distribution),
also consists of a series of genetically divergent populations. 70
Tenuibranchiurus (Decapoda: Parastacidae) is a little known freshwater crayfish
genus found along the central eastern coast of Australia (Riek 1969). It is regarded as
the second smallest freshwater crayfish worldwide, reaching a maximum total length
of only 25 mm (Riek 1969; Crandall 2002). Studies on Tenuibranchiurus to date 75
have concentrated mainly on taxonomic and phylogenetic relationships with other
Australian crayfish genera, rendering the genus poorly understood at a basic level.
For example, there has been no concentrated efforts to determine the actual
distribution of the genus, and almost no information is available on its basic biology
and ecology, with only two studies on the general behaviour of Tenuibranchiurus 80
(Harding and Williamson 2003; Harding and Williamson 2004).
There is currently one species described in this genus, Tenuibranchiurus glypticus
Riek, but the presence of two additional species has been suggested on the basis of
morphological differences (Horwitz 1995). As a result of long-term historical 85
geographic isolation, sub-populations of Tenuibranchiurus may have undergone
genetic divergence, possibly resulting in genetically distinct species within this genus.
Currently, this genus has no conservation status assigned to it, and is only protected
where it occurs in National Parks and other conservation areas. Appreciable areas of
its habitat have been cleared for development such as housing, business and 90
infrastructure (Joyce 2006). Therefore, the genus may require protection due to
significant and continuing habitat loss restricting and reducing its distribution and
eliminating isolated sub-populations. However, Tenuibranchiurus may also warrant
conservation efforts on the basis of geographically isolated sub-populations qualifying
as ESUs (as defined by Moritz 1994). Therefore, the aims of this study were to 95
investigate (1) if sub-populations of Tenuibranchiurus are genetically isolated from
one another; and (2) if there is evidence of ancient divergence as has been
demonstrated for other aquatic species occupying similar coastal habitat in this region.

4
Materials and methods
Study species 100
Tenuibranchiurus is an unremarkable grey-brown crayfish that is cryptic in habit
(Riek 1951). The genus was first described from two locations, Mt Gravatt and
Caloundra, Qld, by Riek (1951). Since then, the genus has been reported from a total
of five locations within Qld; Bells Creek (Crandall et al. 1999; Schultz et al. 2007;
Schultz et al. 2009), Eumundi, Mooloolaba, Kinkuna National Park (Schultz et al. 105
2007) and Bribie Island (Harding and Williamson 2003; Schultz et al. 2009), and also
in ‘far north-eastern’ NSW (Horwitz 1995) (Fig. 1B).
Tenuibranchiurus inhabits coastal wallum/Melaleuca swamps where they are thought
to construct deep burrows in the soil (Riek 1951). Tenuibranchiurus can be readily 110
distinguished from most other crayfish in the region by the position of the chelae,
which are orientated vertically instead of horizontally (Riek 1969). They are quite
similar in morphology to the genus Engaeus (from Tasmania and Victoria), but differ
in branchial and abdominal structure (Riek 1951; Riek 1969). Although
Tenuibranchiurus resemble Engaeus in form, they are genetically more closely related 115
to the genus Geocharax (from Tasmania and Victoria), being placed “sister” to these
in a study undertaken by Schultz et al. (2007).
Sampling methods
Sampling was carried out during the day from January to May 2008. Sites of 120
potential habitat for Tenuibranchiurus were identified from digital vegetation maps
detailing coastal Melaleuca swamp distributions. Additional sites that appeared to be
suitable habitat were also identified opportunistically while in the field.
Tenuibranchiurus were collected from swamps by sweep netting, pumping out
burrows with a bait-pump and baited traps. Where the bait-pump could not be used 125
efficiently (e.g. tree roots obstructing pump), hand excavation of the burrows was
undertaken. Where possible, a minimum of five individuals were collected from each
site as this sample size has been considered in other studies to be sufficient to provide
a robust genetic analysis to identify deep levels of genetic divergence (e.g. Ponniah
and Hughes 2004). Live specimens were stored separately on ice in the field, frozen 130
at -20°C on return to the laboratory, and preserved separately in 70% ethanol. Fifty-

5
one Tenuibranchiurus were collected over seven field sites and retained for genetic
analysis.
DNA extraction, amplification and sequencing 135
The DNA from each specimen was extracted using a variation of the CTAB/phenol-
chloroform extraction protocol (Doyle and Doyle 1987). Two mitochondrial regions
were amplified; cytochrome oxidase subunit 1 (COІ) using the primers CRCOІ-F (5’-
CWACMAAYCATAAAGAYATTGG-3’) and CRCOІ-R (5’-
GCRGANGTRAARTARGCTCG-3’) (Cook et al. 2008b), and 16S using the primers 140
16S-ar (5’-CGCCTGTTTATCAAAAACAT-3’) and 16S-br (5’-
CCGGTCTGAACTCAGATCACGT-3’) (Palumbi et al. 1991).
The PCR reactions for both COІ and 16S used the following; 2.0 µL DNA extract, 0.4
µL forward primer, 0.4 µL reverse primer, 0.3 µL dNTP, 0.63 µL MgCl2 (50 mM), 145
2.50 µL buffer (5×), 0.08 µL Bioline Mango Taq (5×) and 6.19 µL ddH2O. For all
analyses, one positive and one negative control were included, with PCR reactions
performed on a GeneAmp PCR System 2700 (Applied Biosystems,
www.appliedbiosystems.com). The PCR program used for COІ samples consisted of
the following conditions: 94°C for 5 min; 40 cycles of: 30 sec at 94°C, 30 sec at 55°C, 150
1 min at 72°C; then 7 min at 72°C with the reaction stored at 4°C until further
analysis. The program used to amplify 16S samples was: 94°C for 10 min; 40 cycles
of: 45 sec at 94°C, 45 sec at 52°C, 1.5 min at 72°C; then 7 min at 72°C with the
reaction stored at 4°C until further analysis.
155
An enzymatic purification procedure was undertaken using EXO SAP (Fermentas,
www.fermentas.com) on successfully amplified samples. Purifications were
performed in 6.25-µL reaction volumes containing the following: 0.25 µL
Exonuclease I, 1.0 µL Shrimp Alkaline Phosphate and 5.0 µL amplified PCR product.
The resulting solution was incubated at 37°C for 35 min, heated at 80°C for 20 min, 160
held at 15°C, then stored at 4°C until further analysis. Sequencing reactions
contained 1.0 µL purified PCR product, 5.5 µL ddH2O, 5.0 µL Terminator Mix
(Applied Biosystems, www.appliedbiosystems.com), 2.0 µL 5×Terminator Mix
Buffer (Applied Biosystems, www.appliedbiosystems.com) and 1.0 µL of the forward
primer (CRCOІ-F/16S-ar). Reactions were performed under the following conditions: 165

6
initial hold of 96°C for 1 min; 30 cycles of: 96°C for 10 sec, 50°C for 5 sec, 60°C for
4 min; then a final hold at 4°C. Samples were then cleaned and subsequently
sequenced on an automated sequencing machine (Applied Biosystems 3130,
www.appliedbiosystems.com). Sequences were edited using Sequencher 4.1.2
(GeneCodes 2000) and aligned using MAFFT version 5.3 (Katoh et al. 2005). A 644-170
bp fragment was used in COІ analyses and a 449-bp fragment for 16S analyses.
COІ and 16S phylogenetic analyses
A total of 51 Tenuibranchiurus collected during this study were sequenced for the
COІ gene fragment, with a subset of 14 sequenced for the 16S fragment to examine 175
deeper phylogenetic relationships. Additional sequences obtained from GenBank (see
Accessory Publication) were also included in both COІ and 16S analyses. For all
analyses, Gramastacus sp. sequences were used as an outgroup as this genus (with
Engaewa and Geocharax) has been demonstrated as forming a monophyletic clade
with Tenuibranchiurus to the “exclusion of all other parastacid genera” (Schultz et al. 180
2009).
To examine the relationship between Tenuibranchiurus haplotypes, a best-fit model of
evolution was first selected for both the COІ and 16S data sets (COІ=HKY+I+G
model; 16S=HKY+G model) using the program jModeltest v. 0.0.1 (Posada 2008). 185
For each data set, three methods were used; neighbour-joining (NJ), maximum
likelihood (ML) and maximum parsimony (MP). Both the NJ and MP trees were
created using the program PAUP* (Swofford 2003) (1000 bootstrap replicates; full
heuristic search), while the ML tree was created using the program RAxML v. 7.0.0
(Stamatakis 2006) (1000 bootstrap replicates). Networks showing relationships 190
among haplotypes were also created for the COІ data set, using the program TCS v.
1.21 (Clements et al. 2000). Networks were not created for the 16S data as only 25
sequences were available for analysis (see Accessory Publication).
Time of divergence 195
The time of divergence between identified clades and sub-clades was estimated using
a molecular clock approach using MEGA (Tamura et al. 2007). Using a molecular
clock approach was considered appropriate as tests performed on both unconstrained
and constrained trees showed that they were not significantly different (p=0.828).

7
The net sequence divergence was calculated (including ± S.E. to correct for within-200
clade polymorphisms) and three estimated divergence rates were used for both COІ
and 16S; COІ=2.0% (Wares and Cunningham 2001), 1.7% (Schubart et al. 1998) and
1.4% (Morrison et al. 2004; Page and Hughes 2007); 16S=0.9% (Sturmbauer et al.
1996; Schultz et al. 2009), 0.65% (Schubart et al. 1998) and 0.53% (Stillman and
Reeb 2001; Schultz et al. 2009). 205
Analysis of population structure
All further statistical analyses were only performed on the COІ data as the 16S sample
sizes were too low for robust analyses. Two tests of neutrality were carried out
(Tajima’s D (Tajima 1989) and Fu’s Fs (Fu and Li 1993)) using Arlequin 3.1 210
(Excoffier et al. 2005). These tests were used to detect any recent demographic
changes (e.g. recent bottlenecks or population expansions) or non-neutral evolution of
the COІ fragment.
As there was no real logic for dividing the sample sites into regions or groups, 215
analysis of molecular variance (AMOVA) was not performed. Instead, pairwise ΦST
(genetic structure based on haplotype frequency and genetic divergence) were
calculated using Arlequin to determine the level of genetic differentiation between
pairs of sites. Where sites were represented by fewer than 5 individuals, they were
either pooled (i.e. MA with TCB, GC1 with GC2, BNP1 with BNP 2) to provide a 220
robust analysis, or were removed (i.e. BI). A Mantel test with 1000 permutations was
also run in Arlequin to identify any relationships between genetic and geographic
distance between Tenuibranchiurus sites, which would be expected if the dispersal
distance of individuals is less than the area of the study and the sub-populations have
been in their habitat for long enough to have reached equilibrium between migration, 225
mutation and genetic drift (Slatkin 1993).

8
Results
Field summary
In addition to historical locations where Tenuibranchiurus had previously been
recorded (see Accessory Publication), seven additional sub-populations were 230
identified (from 31 field sites sampled) with a number of these being outside the
previously reported range of Tenuibranchiurus, extending its known distribution.
Although all historical sites were visited for sampling, no Tenuibranchiurus were
found, either due to habitat loss or lack of water due to drought conditions. In
general, site characteristics where crayfish were collected were typical of those 235
previously described in the literature (i.e. coastal wallum/Melaleuca swamp);
however, two sites were notably different on the basis that the first (LakeH) was a
natural drainage channel in heathland with no Melaleuca present and the second
(BNP2) was a deep stream channel, with slow-flowing water, with Melaleuca on the
stream banks. 240
Phylogenetic analysis
Fifty-one Tenuibranchiurus collected during this study were sequenced for the COІ
gene fragment, with an additional six Tenuibranchiurus samples obtained from
Bentley (2007) and five specimens of Gramastacus sp. which were used as outgroups. 245
Within Tenuibranchiurus COІ sequences, 175 of 644 bases were variable with 20, 4
and 151 1st, 2
nd, and 3
rd codon position changes, respectively, and a total of 13 amino
acid changes. A total of 154 transitions and 51 transversions were observed across all
nucleotide sites, with 158 of these sites parsimony informative. No stop codons were
observed in any of the sequences. From the 57 individuals, a total of 28 haplotypes 250
were identified. All of the phylogenetic trees (NJ, ML and MP) inferred from the 28
Tenuibranchiurus haplotypes (with outgroups) suggest the presence of two highly
divergent clades (bootstrap values 100%) with two and three sub-clades, respectively,
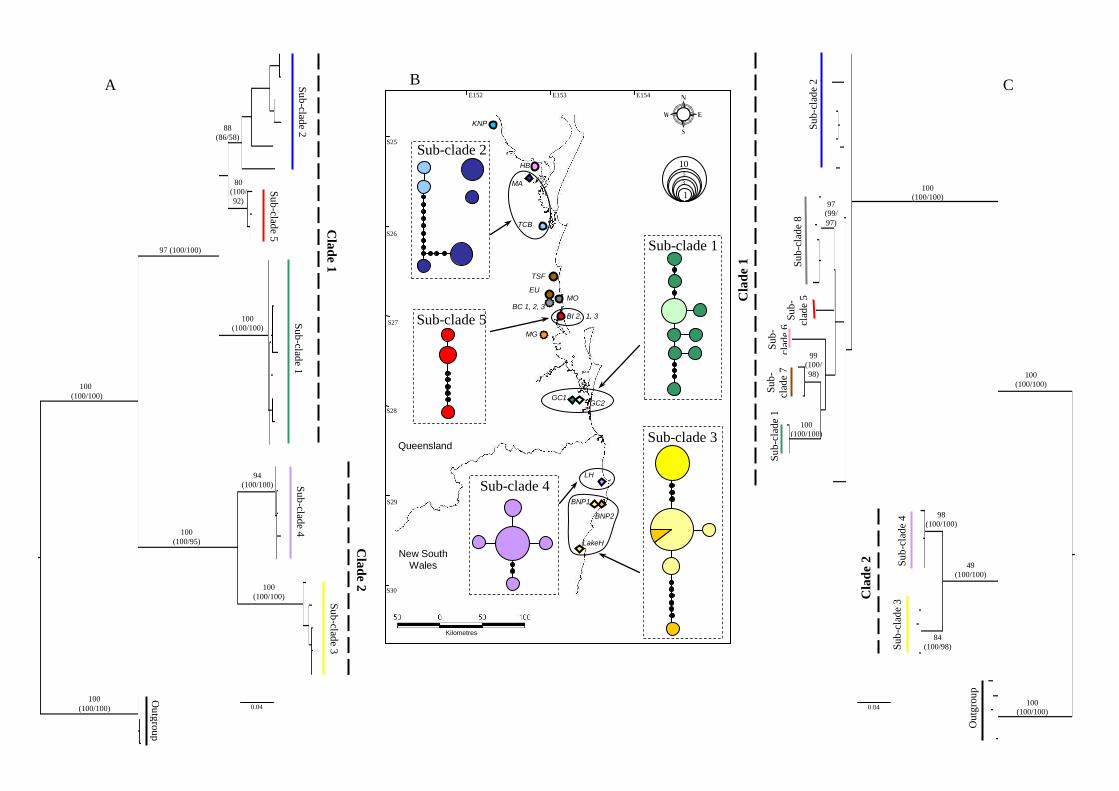
within each (bootstrap values ≥95%) (Fig. 1A). Clade 1 consisted of haplotypes from
the Qld region, while Clade 2 were those from NSW. 255
From Sub-clades 1 through 5, three to four representative haplotypes were sequenced
for the 16S gene fragment. Additional 16S sequences were obtained from GenBank
and Bentley (2007) (see Accessory Publication), and four Gramastacus sp. samples
were used as 16S outgroups. Within Tenuibranchiurus 16S sequences, 94 of 449 260

9
bases were variable. A total of 85 transitions and 29 transversions were observed
across all nucleotide sites. The phylogenetic trees inferred from the 22
Tenuibranchiurus 16S haplotypes showed the same two divergent clades, but the sub-
clades were not as clear. However, the same groupings were noted, with Clade 1
comprised of haplotypes found only in Qld and Clade 2 of those from NSW (Fig. 1C). 265
Haplotype network analysis
Five COІ networks were created (Fig. 1B) using the program TCS. However, these
were unable to be joined despite using a cut-off level of 90%. The haplotypes
displayed concordance with geographical location of sub-populations (Fig. 1B). Sub-270
clade 1 consisted of those individuals found at sites GC1 and GC2 (Gold Coast, Qld),
Sub-clade 2 from MA and TCB (Maryborough and Tin Can Bay, Qld), Sub-clade 3
from LakeH, BNP1 and BNP2 (Lake Hiawatha and Broadwater National Park, NSW),
Sub-clade 4 from LH (Lennox Heads, NSW), and Sub-clade 5 from BI2 (Bribie
Island, Qld). 275
Time of divergence
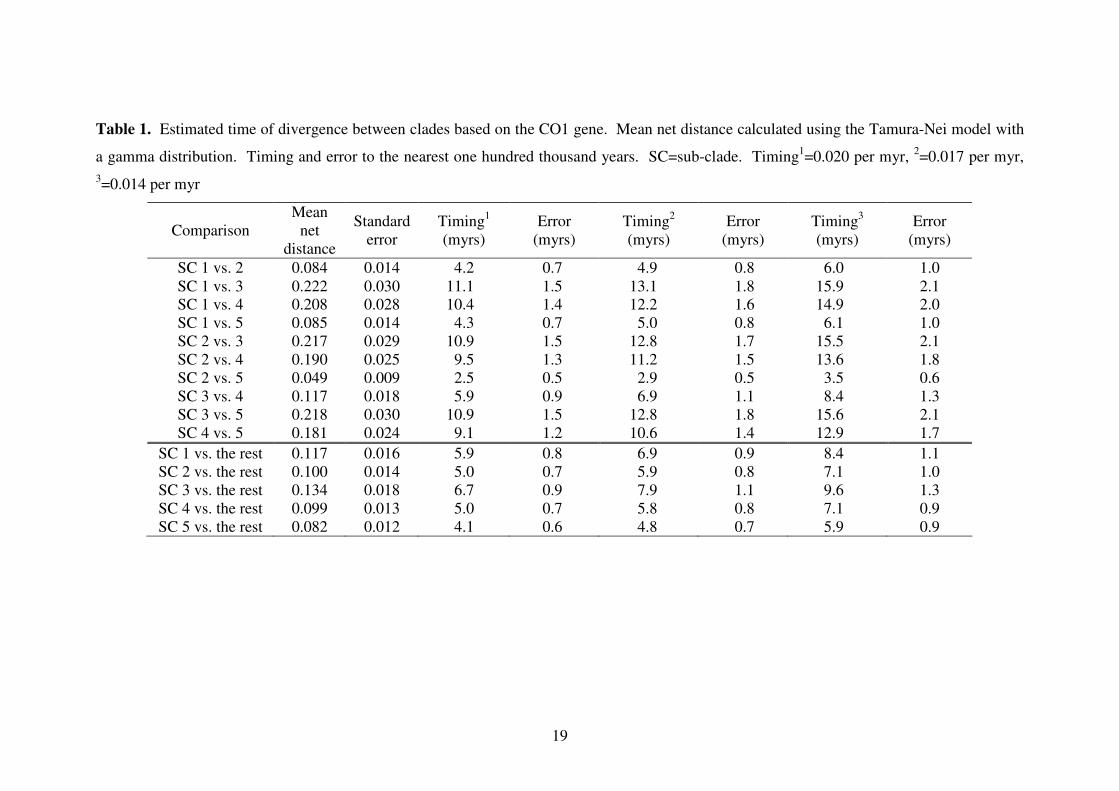
Based on the COІ gene, it is estimated that divergences between each of the five
Tenuibranchiurus sub-clades occurred during the Miocene (5 – 23mya) and Pliocene
era (1.8 – 5mya) (Table 1). The most recent split was between Sub-clades 2 and 5 280
(2.5 – 3.5mya), with the earliest between Sub-clades 1 and 3 (11.1 – 15.9mya). As
the 16S gene fragment was used to examine deeper phylogenetic relationships, the
time of divergence was only estimated between the two major clades (Clades 1 and 2).
The time of divergence was placed 16.1 – 27.4mya, which was slightly older than the
estimate based on COІ (8.0 – 11.4mya). 285
Analysis of population structure
Tajima’s D test of neutrality was non-significant for all sub-clades, while Fu’s Fs was
only significant for Sub-clade 1 (p<0.02) (Table 2). All pairwise ΦST comparisons
were significant (p<0.001), with values 0.77 or greater indicating very little or no 290
gene flow between sites (Table 3). The Mantel test showed a weak but significant
relationship between the ΦST and geographical distance (p=0.044).

10
Discussion
This study extends the distribution of Tenuibranchiurus appreciably (~260 km), with
this genus not previously recorded on the Gold Coast in Qld or as far south as Wooli, 295
NSW. The total known range now extends approximately 600 km north-south, and it
is possible that the distribution extends further north and south of these present limits.
Also, LakeH and BNP2 were markedly different from the other sites sampled,
indicating that habitat previously thought unsuitable for Tenuibranchiurus (i.e. Riek
1951) may in fact be suitable for this genus. 300
Genetic isolation of Tenuibranchiurus sub-populations
The results of the pairwise ΦST analysis suggest high levels of genetic diversity and
very little or no gene flow between Tenuibranchiurus sub-populations. Similar results
have also been reported for other organisms that have experienced some form of 305
population separation and are found in similar habitats to Tenuibranchiurus. For
example, very low levels of dispersal between sub-populations of the Oxleyan pygmy
perch (Nannoperca oxleyana) have been reported, with ΦST values between 0.25 and
0.91 (Hughes et al. 1999). Bentley et al. (2010) also examined levels of gene flow
within four clades of Cherax dispar and found very little gene flow between sub-310
populations (ΦST between 0.33 and 0.83).
All but one of the Tajima’s D and Fu’s Fs tests of neutrality were non-significant
(Fs=-4.10, p<0.02). Although this value is significant, it is small compared to values
found in other studies (up to -72.7) (Mills et al. 2008). Taken together, the results of 315
these tests suggest there is no evidence of recent bottlenecks or population expansions
within the five sub-clades tested. There is very little sharing of haplotypes between
sub-populations, indicating that at least female dispersal rates are very low, which is
not surprising due to the large geographic distances that separate sub-populations. As
mtDNA was analysed for this study, no conclusions can be made as to the movements 320
of the male individuals, as mtDNA is maternally inherited (Hartl and Clark 2007).
Nevertheless, there is no reason to suspect male-biased dispersal in these crayfish.
Time of divergence
Both the COІ and 16S trees show a clear separation between Clade 1 and Clade 2. 325
This is interesting, as Clade 1 is comprised of samples from Qld and Clade 2 of

11
samples from NSW. The separation is quite large, almost as large as the separation
between the Tenuibranchiurus samples and the outgroup (Gramastacus sp.). This
extensive divergence may be due to a long-term barrier. It is possible that the
mountain ranges that occur on the border of Qld and NSW have restricted the 330
movement of individuals between northern and southern regions. The analysis of
sequence variation in the COІ gene fragment also shows clear differences between the
sub-clades identified. Similar relationships between sub-clades were also evident for
the 16S gene. Also, the 16S phylogenetic tree shows that the samples obtained from
the T. glypticus type locality (Sub-clade 8; Bells Creek, Caloundra) are distinct from 335
other groupings evident within Clade 1.
Both the COІ and 16S data sets suggest that Tenuibranchiurus sub-clades diverged
during the Miocene/Pliocene era. There has been one other study that has suggested
that the geological age of Tenuibranchiurus is only as old as the Holocene era (i.e. 340
12000ya – present) based on morphological characteristics (Rode and Babcock 2003);
however, the estimates obtained from this study clearly indicate that
Tenuibranchiurus is far older, and the analyses show that the oldest divergence occurs
between Qld and NSW. Another genus of crayfish, Euastacus, which occupies high
altitude areas in eastern Australia, has been shown to have diverged more recently, 345
during the Pliocene era (Ponniah and Hughes 2004). This was surprising as there are
several clearly morphologically recognised species within the genus Euastacus, in
contrast to the one recognised Tenuibranchiurus species. It is possible that further
investigation of the morphology and taxonomy of Tenuibranchiurus may indicate at
least two distinct species within this genus (i.e. Clades 1 and 2) if not more. Other 350
freshwater crustaceans with a coastal distribution in this region (e.g. freshwater
shrimp; Caridina indistincta Calman) have been found to have similar divergence
times to those found for Tenuibranchiurus. Caridina indistincta inhabits coastal
streams within south-east Qld, Australia, and divergence times between cryptic
species fall within the Miocene era (estimates from 6.45 – 11.3mya) (Chenoweth and 355
Hughes 2003; Page and Hughes 2007). Similarly, identified lineages within the
shrimp species Paratya australiensis Kemp collected from south-east Qld and NSW
have also been found to have diverged during the late Miocene/Pliocene (3.86 –
11.32mya) (Cook et al. 2006).
360

12
Implications for management
The distinct separation between Tenuibranchiurus sub-clades is indicative of high
genetic divergence. Also, each of the sub-clades consisted of haplotypes collected
from only one or two nearby locations. The implication of this is that if sub-
populations within a sub-clade were to be lost, it is likely that the genetic information 365
contained within that sub-population would not be found in any other. The large
geographic distances between sub-populations and the high levels of genetic
divergence between them also indicate that it is very unlikely that these areas could be
naturally recolonised following any local extinction events.
370
The increasing occurrence of habitat destruction, degradation and fragmentation as a
result of anthropogenic influences highlights this as being a very real threat to these
isolated populations (e.g. Taylor et al. 2007). Although some crayfish are highly
mobile organisms that can, given time, disperse over quite large distances (Lindqvist
and Huner 1999; Hughes and Hillyer 2003), the small size of this crayfish and low 375
levels of habitat connectivity between sub-populations greatly reduce any possibility
of gene flow or movement between them.
In light of the genetic differentiation between the sub-clades, it is appropriate that they
be considered ESUs for management and conservation purposes. Also, according to 380
Moritz (1994), Lake Hiawatha from Sub-clade 3 should be considered a separate
management unit, and should be treated as such if conservation and management
plans are to be applied. It is likely that management plans and conservation efforts
will be needed in the future, if not immediately, as there have already been population
reductions. For example, one of the type localities for T. glypticus has been 385
developed for housing (sites in Mt Gravatt; Riek 1951) with the sub-populations
previously located there most likely having been eliminated.
Due to the genetic divergence detected, it is recommended that a thorough
examination of the nuclear genetic makeup and morphology of individuals within 390
each Tenuibranchiurus sub-clade be undertaken as it is possible that each of these
represents a distinct species. Many studies have used genetic analysis to identify new
species, and have gone on to use this information to recognise ESUs and make
recommendations for conservation and management plans (Austin and Ryan 2002; de

13
Bruyn et al. 2004; Santos 2006). In light of this, examination of the morphology and 395
possible description of new species within the genus should be a priority area for
future research.
Acknowledgements
This study was conducted as a major part of a B.Sc. (Hons) by Kathryn Dawkins 400
under the supervision of James Furse, Prof. Jane Hughes and Assoc. Prof. Clyde
Wild. Funding for this study was provided by both the Australian Rivers Institute and
the Griffith School of Environment, Griffith University. Additional funding for
genetic analysis was also provided by Rob McCormack and his company ‘AABio’
and was greatly appreciated. The authors would like to thank the two anonymous 405
reviewers and the associate editor for their helpful comments, Michael Arthur for
statistical guidance and Rob McCormack, Jason Coughran and many other volunteers
for field assistance. Crayfish were collected under NSW Scientific Collection Permit
P05/0077-3.1 and Qld General Fisheries Permit #91210.
410

14
References
Austin, C. M., and Ryan, S. G. (2002). Allozyme evidence for a new species of
freshwater crayfish of the genus Cherax Erichson (Decapoda : Parastacidae) from the
south-west of Western Australia. Invertebrate Systematics 16, 357-367. 415
Baker, A. M., Williams, S. A., and Hughes, J. M. (2003). Patterns of spatial genetic
structuring in a hydropsychid caddisfly (Cheumatopsyche sp. AV1) from southeastern
Australia. Molecular Ecology 12, 3313-3324.
420
Baker, A. M., Hughes, J. M., Dean, J. C., and Bunn, S. E. (2004). Mitochondrial DNA
reveals phylogenetic structuring and cryptic diversity in Australian freshwater
macroinvertebrate assemblages. Marine and Freshwater Research 55, 629-640.
Bentley, A. (2007). Phylogeographic structure of freshwater crayfish of the genus 425
Cherax (Decapoda: Parastacidae) on the mainland and islands of southeast
Queensland. BSc (Hons) Thesis, Griffith University, Nathan.
Bentley, A. I., Schmidt, D. J., and Hughes, J. M. (2010). Extensive intraspecific
genetic diversity of a freshwater crayfish within a biodiversity hotspot. Freshwater 430
Biology (In press).
Bentley, A. I., Schmidt, D. J., and Hughes, J. M. (in press). Extensive intraspecific
genetic diversity of a freshwater crayfish within a biodiversity hotspot. Freshwater
Biology (In press). 435
Carini, G., and Hughes, J. M. (2004). Population structure of Macrobrachium
australiense (Decapoda: Palaemonidae) in Western Queensland, Australia: the role of
contemporary and historical processes. Heredity 93, 350-363.
440
Chenoweth, S. F., and Hughes, J. M. (2003). Speciation and phylogeography in
Caridina indistincta, a complex of freshwater shrimps from Australian heathland
streams. Marine and Freshwater Research 54, 807-812.
Clements, M., Posada, D., and Crandall, K. A. (2000). TCS: a computer program to 445
estimate gene genealogies. Molecular Ecology 9, 1657-1660.
Cook, B. D., Baker, A. M., Page, T. J., Grant, C., Fawcett, J. H., et al. (2006).
Biogeographic history of an Australian freshwater shrimp, Paratya australiensis
(Atyidae): the role life history transition in phylogeographic diversification. 450
Molecular Ecology 15, 1083-1093.
Cook, B. D., Page, T. J., and Hughes, J. M. (2008a). Importance of cryptic species for
identifying ‘representative’ units of biodiversity for freshwater conservation.
Biological Conservation 141, 2821-2831. 455
Cook, B. D., Pringle, C. M., and Hughes, J. M. (2008b). Molecular evidence for
sequential colonization and taxon cycling in freshwater decapod shrimps on a
Caribbean island. Molecular Ecology 17, 1066-1075.
460
15
Crandall, K. A., Fetzner, J. W., Lawler, S. H., Kinnersley, M., and Austin, C. M.
(1999). Phylogenetic relationships among the Australian and New Zealand genera of
freshwater crayfishes (Decapoda: Parastacidae). Australian Journal of Zoology 47,
199-214.
465
Crandall, K. A. (2002). Crayfish as model organisms. Freshwater Crayfish 13, 3-10.
de Bruyn, M., Wilson, J. A., and Mather, P. B. (2004). Huxley's line demarcates
extensive genetic divergence between eastern and western forms of the giant
freshwater prawn, Macrobrachium rosenbergii. Molecular Phylogenetics and 470
Evolution 30, 251-257.
Dieguez-Uribeondo, J., Royo, F., Souty-Grosset, C., Ropiquet, A., and Grandjean, F.
(2008). Low genetic variability of the white-clawed crayfish in the Iberian Peninsula:
its origin and management implications. Aquatic Conservation: Marine and 475
Freshwater Ecosystems 18, 19-31.
Doyle, J. J., and Doyle, J. L. (1987). A rapid DNA isolation procedure for small
quantities of leaf tissue. Phytochemistry Bulletin 19, 11-15.
480
Excoffier, L., Laval, G., and Schneider, S. (2005). Arlequin ver. 3.0: An integrated
software package for population genetics data analysis. Evolutionary Bioinformatics
Online 1, 47-50.
Fratini, S., Zaccara, S., Barbaresi, S., Grandjean, F., Souty-Grosset, C., et al. (2005). 485
Phylogeography of the threatened crayfish (genus Austropotamobius) in Italy:
implications for its taxonomy and conservation. Heredity 94, 108-118.
Fu, Y.-X., and Li, W.-L. (1993). Statistical tests of neutrality of mutations. Genetics
133, 693-709. 490
GeneCodes (2000). 'Sequencher (Version 4.1.2).' (Gene Codes Corporation: Ann
Arbor, Michigan.)
Gouin, N., Grandjean, F., and Souty-Grosset, C. (2006). Population genetic structure 495
of the endangered crayfish Austropotamobius pallipes in France based on
microsatellite variation: biogeographical inferences and conservation implications.
Freshwater Biology 51, 1369-1387.
Harding, D., and Williamson, I. (2003). A note on the habitat requirements of the 500
swamp crayfish on Bribie Island, southeastern Queensland. Memoirs of the
Queensland Museum 49, 452.
Harding, D., and Williamson, I. (2004). The influence of light phase and predators on
the behaviour of swamp crayfish. Memoirs of the Queensland Museum 49, 704. 505
Hartl, D. L., and Clark, A. G. (2007). 'Principles of Population Genetics.' 4th Edn.
(Sinauer Associates Inc. Publishers: Massachusetts.)

16
Horwitz, P. (1995) A preliminary key to the species of Decapoda (Crustacea: 510
Malacostraca) found in Australian inland waters. Co-operative Research Centre for
Freshwater Ecology, Albury, Australia.
Hughes, J. M., Ponniah, M., Hurwood, D. A., Chenoweth, S. F., and Arthington, A.
(1999). Strong genetic structuring in a habitat specialist, the Oxleyan Pygmy Perch 515
Nannoperca oxleyana. Heredity 83, 5-14.
Hughes, J. M., and Hillyer, M. J. (2003). Patterns of connectivity among populations
of Cherax destructor (Decapoda: Parastacidae) in western Queensland, Australia.
Marine and Freshwater Research 54, 587-596. 520
Jenkins, M. (2003). Prospects for biodiversity. Science 302, 1175-1177.
Joyce, K. (2006) Wetland Management Profile; Coastal melaleuca swamp wetlands.
Ecosystem Conservation Branch, EPA, Queensland. 525
Katoh, K., Kuma, K.-I., Toh, H., and Miyata, T. (2005). MAFFT version 5:
improvement in accuracy of multiple sequence alignment. Nucleic Acids Research 33,
511-518.
530
Knight, J. T., Nock, C. J., Elphinstone, M. S., and Baverstock, P. R. (2009).
Conservation implications of distinct genetic structuring in the endangered freshwater
fish Nannoperca oxleyana (Percichthyidae). Marine and Freshwater Research 60, 34-
44.
535
Lindqvist, O. V., and Huner, J. V. (1999). Life history characteristics of crayfish:
What makes some of them good colonizers? In 'Biotic Interactions and Global
Change'. (Eds P. Kareiva, J. Kingsolver and R. Huey.) pp. 23-30. (Sinauer Associates,
Inc.: Sunderland Mass.)
540
Loh, J. (2002). 'Living Planet Report 2002.' (World Wide Fund for Nature (WWF)
International: Gland, Switzerland.)
Margules, C. R., and Pressey, R. L. (2000). Systematic conservation planning. Nature
405, 243-253. 545
Mills, C. E., Hadwen, W. L., and Hughes, J. M. (2008). Looking through glassfish:
marine genetic structure in an estuarine species. Marine and Freshwater Research 59,
627-637.
550
Moritz, C. (1994). Defining 'evolutionarily significant units' for conservation. Trends
in Ecology & Evolution 9, 373-375.
Morrison, C. L., Rios, R., and Duffy, J. E. (2004). Phylogenetic evidence for an
ancient rapid radiation of Caribbean sponge-dwelling snapping shrimps (Synalpheus). 555
Molecular Phylogenetics and Evolution 30, 563-581.

17
Nguyen, T. T. T., Meewan, M., Ryan, S., and Austin, C. M. (2002). Genetic diversity
and translocation in the marron, Cherax tenuimanus (Smith): implications for
management and conservation. Fisheries Management and Ecology 9, 163-173. 560
Page, T. J., Sharma, S., and Hughes, J. M. (2004). Deep phylogenetic structure has
conservation implications for ornate rainbow fish (Melanotaeniidae: Rhadinocentrus
ornatus) in Queensland, eastern Australia. Marine and Freshwater Research 55, 165-
172. 565
Page, T. J., and Hughes, J. M. (2007). Phylogeographic structure in an Australian
freshwater shrimp largely pre-dates the geological origins of its landscape. Heredity
98, 222-231.
570
Palumbi, S. R., Martin, A., Romano, S., McMillan, W. O., Stice, L., et al. (1991). 'The
Simple Fool's Guide to PCR.' (University of Hawaii Press: Honolulu.)
Ponniah, M., and Hughes, J. M. (2004). The evolution of Queensland spiny mountain
crayfish of the genus Euastacus. I. Testing vicariance and dispersal with interspecific 575
mitochondrial DNA. Evolution 58, 1073-1085.
Posada, D. (2008). jModelTest: Phylogenetic Model Averaging. Molecular Biology
and Evolution 25, 1253-1256.
580
Ricciardi, A., and Rasmussen, J. B. (1999). Extinction rates of North American
freshwater fauna. Conservation Biology 13, 1220-1222.
Riek, E. F. (1951). The freshwater crayfish (family Parastacidae) of Queensland, with
an appendix describing other Australian species. Records of the Australian Museum 585
22, 368-388.
Riek, E. F. (1969). The Australian freshwater crayfish (Crustacea: Decapoda:
Parastacidae), with descriptions of new species. Australian Journal of Zoology 17,
855-918. 590
Rode, A. L., and Babcock, L. E. (2003). Phylogeny of fossil and extant freshwater
crayfish and some closely related nephropid lobsters. Journal of Crustacean Biology
23, 418-435.
595
Santos, S. R. (2006). Patterns of genetic connectivity among anchialine habitats: a
case study of the endemic Hawaiian shrimp Halocaridina rubra on the island of
Hawaii. Molecular Ecology 15, 2699-2718.
Schubart, C. D., Diesel, R., and Hedges, S. B. (1998). Rapid evolution to terrestrial 600
life in Jamaican crabs. Nature 393, 363-365.
Schultz, M. B., Smith, S. A., Richardson, A. M. M., Horwitz, P., Crandall, K. A., et
al. (2007). Cryptic diversity in Engaeus Erichson, Geocharax Clark and Gramastacus
Riek (Decapoda: Parastacidae) revealed by mitochondrial 16S rDNA sequences. 605
Invertebrate Systematics 21, 569-587.

18
Schultz, M. B., Smith, S. A., Horwitz, P., Richardson, A. M. M., Crandall, K. A., et
al. (2009). Evolution underground: A molecular phylogenetic investigation of
Australian burrowing freshwater crayfish (Decapoda: Parastacidae) with particular 610
focus on Engaeus Erichson. Molecular Phylogenetics and Evolution 50, 580-598.
Sharma, S., and Hughes, J. M. (2009). Genetic structure and phylogeography of
freshwater shrimps (Macrobrachium australiense and Macrobrachium tolmerum): the
role of contemporary and historical events. Marine and Freshwater Research 60, 541-615
553.
Slatkin, M. (1993). Isolation by distance in equilibrium and non-equilibrium
populations. Evolution 47, 264-279.
620
Stamatakis, A. (2006). RAxML-VI-HPC: Maximum likelihood-based phylogenetic
analyses with thousands of taxa and mixed models. Bioinformatics 22, 2688-2690.
Stillman, J. H., and Reeb, C. A. (2001). Molecular phylogeny of eastern Pacific
porcelain crabs, genera Petrolisthes and Pachycheles, based on the mtDNA 16S 625
rDNA sequence: phylogeographic and systematic implications. Molecular
Phylogenetics and Evolution 19, 236-245.
Sturmbauer, C., Leninton, J. S., and Christy, J. (1996). Molecular phylogeny analysis
of fiddler crabs: Test of the hypothesis of increasing behavioral complexity in 630
evolution. Proceedings of the National Academy of Sciences USA 93, 10855-10857.
Swofford, D. L. (2003). 'PAUP*. Phylogenetic Analysis Using Parsimony (*and other
methods) (Version 4).' (Sinauer Associates: Sunderland, Massachusetts.)
635
Tajima, F. (1989). Statistical method for testing the neutral mutation hypothesis by
DNA polymorphism. Genetics 123, 585-595.
Tamura, K., Dudley, J., Nei, M., and Kumar, S. (2007). MEGA 4: Molecular
Evolutionary Genetics Analysis (MEGA) software version 4.0. Molecular Biology 640
and Evolution 24, 1596-1599.
Taylor, C. A., Schuster, G. A., Cooper, J. E., DiStefano, R. J., Eversole, A. G., et al.
(2007). A reassessment of the conservation status of crayfishes of the United States
and Canada after 10+ years of increased awareness. Fisheries 32, 372-389. 645
Wares, J. P., and Cunningham, C. W. (2001). Phylogeography and historical ecology
of the North Atlantic intertidal. Evolution 55, 2455-2469.
650
19
Table 1. Estimated time of divergence between clades based on the CO1 gene. Mean net distance calculated using the Tamura-Nei model with
a gamma distribution. Timing and error to the nearest one hundred thousand years. SC=sub-clade. Timing1=0.020 per myr,
2=0.017 per myr,
3=0.014 per myr
Comparison
Mean
net
distance
Standard
error
Timing1
(myrs)
Error
(myrs)
Timing2
(myrs)
Error
(myrs)
Timing3
(myrs)
Error
(myrs)
SC 1 vs. 2 0.084 0.014 4.2 0.7 4.9 0.8 6.0 1.0
SC 1 vs. 3 0.222 0.030 11.1 1.5 13.1 1.8 15.9 2.1
SC 1 vs. 4 0.208 0.028 10.4 1.4 12.2 1.6 14.9 2.0
SC 1 vs. 5 0.085 0.014 4.3 0.7 5.0 0.8 6.1 1.0
SC 2 vs. 3 0.217 0.029 10.9 1.5 12.8 1.7 15.5 2.1
SC 2 vs. 4 0.190 0.025 9.5 1.3 11.2 1.5 13.6 1.8
SC 2 vs. 5 0.049 0.009 2.5 0.5 2.9 0.5 3.5 0.6
SC 3 vs. 4 0.117 0.018 5.9 0.9 6.9 1.1 8.4 1.3
SC 3 vs. 5 0.218 0.030 10.9 1.5 12.8 1.8 15.6 2.1
SC 4 vs. 5 0.181 0.024 9.1 1.2 10.6 1.4 12.9 1.7
SC 1 vs. the rest 0.117 0.016 5.9 0.8 6.9 0.9 8.4 1.1
SC 2 vs. the rest 0.100 0.014 5.0 0.7 5.9 0.8 7.1 1.0
SC 3 vs. the rest 0.134 0.018 6.7 0.9 7.9 1.1 9.6 1.3
SC 4 vs. the rest 0.099 0.013 5.0 0.7 5.8 0.8 7.1 0.9
SC 5 vs. the rest 0.082 0.012 4.1 0.6 4.8 0.7 5.9 0.9

20
Table 2. Results of the neutrality tests for each sub-clade using CO1 data
Sub-clades Tajima’s D P-value Fu’s Fs P-value
1 -0.46217 0.326 -4.10171 0.004
2 0.95536 0.860 5.25412 0.981
3 -0.44615 0.372 1.58931 0.811
4 -1.56949 0.055 -1.53469 0.047
5 -0.81734 0.132 0.96133 0.609
Table 3. Pairwise ΦST using CO1 sequences. n=number of individuals used in
analysis. All comparisons significant (p<0.001). Refer Fig. 1 and Accessory
Publication for site localities.
Sites (n) MA&TCB GC1&2 LH BNP1&2
MA&TCB (10) -
GC1&2 (12) 0.77 -
LH (11) 0.87 0.98 -
BNP1&2 (14) 0.89 0.98 0.98 -
LakeH (6) 0.85 0.98 0.99 0.77
Fig. 1. (B) Locations of Tenuibranchiurus collection sites in Queensland and New
South Wales and their corresponding CO1 networks; diamonds = data from this study,
circles = data from past studies, broken circles = type localities. Size of haplotype
circles is proportional to haplotype frequency. Maximum likelihood bootstrap
phylograms showing the relationship between (A) CO1 haplotypes and (C) 16S
haplotypes, where colour shades correspond to sample location. Numbers on
branches indicate ML bootstrap values, with parentheses the NJ and MP bootstrap
values respectively. Refer to Accessory Publication for site localities (historical and
this study).
Sub-clade 3
Sub-clade 4 Sub-clade 2
Sub-clade 5
Sub-clade 1
Outgroup
Clade 2
Clade 1
0.04
100 (100/100)
100 (100/100)
97 (100/100)
100 (100/95)
100 (100/100)
80 (100/ 92)
88 (86/58)
94 (100/100)
100 (100/100)
A
Sub-
clad
e 4
Sub-
clad
e 3 C
lade
2
Sub-
clad
e 2
Sub-
clad
e 8
Sub-
cl
ade
5
Sub-
cl
ade
6 Su
b-
clad
e 7
Sub-
clad
e 1
Out
grou
p
Cla
de 1
0.04
100 (100/100)
100 (100/100)
100 (100/100)
49 (100/100)
98 (100/100)
84 (100/98)
100 (100/100)
99 (100/ 98)
97 (99/ 97)
C
B
GC1 GC2
LH BNP1
BNP2
MA
KNP
TSF MO
MG BC 1, 2, 3
BI 2, 1, 3
HB
EU
TCB
Queensland
New South Wales
LakeH
Kilometres
Sub-clade 2
Sub-clade 1
Sub-clade 5
Sub-clade 3
Sub-clade 4
10
1 3 5
S25
S26
S27
S28
S29
S30
E152 E153 E154