Embed Size (px)
Citation preview
Outline
• The Reporting Architecture• Selecting a Report to View• Report Interface• Viewing Report Results• Sorting Reports• Report Totals• Exporting/Analyzing Report Data

The URL

TERA: PAMS Reporting
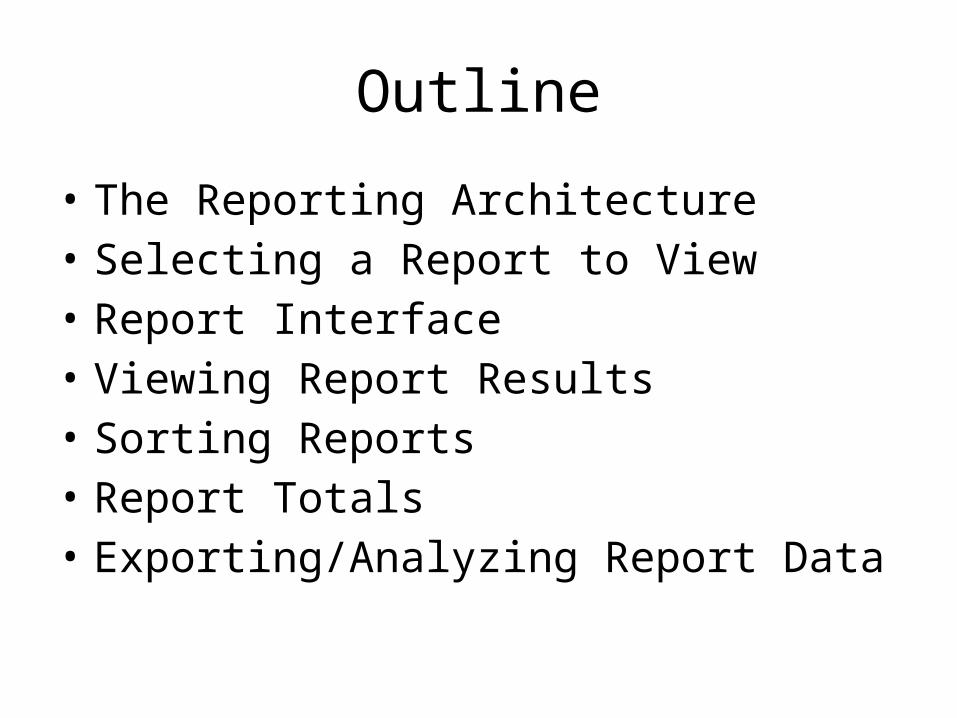
Selecting a report to view
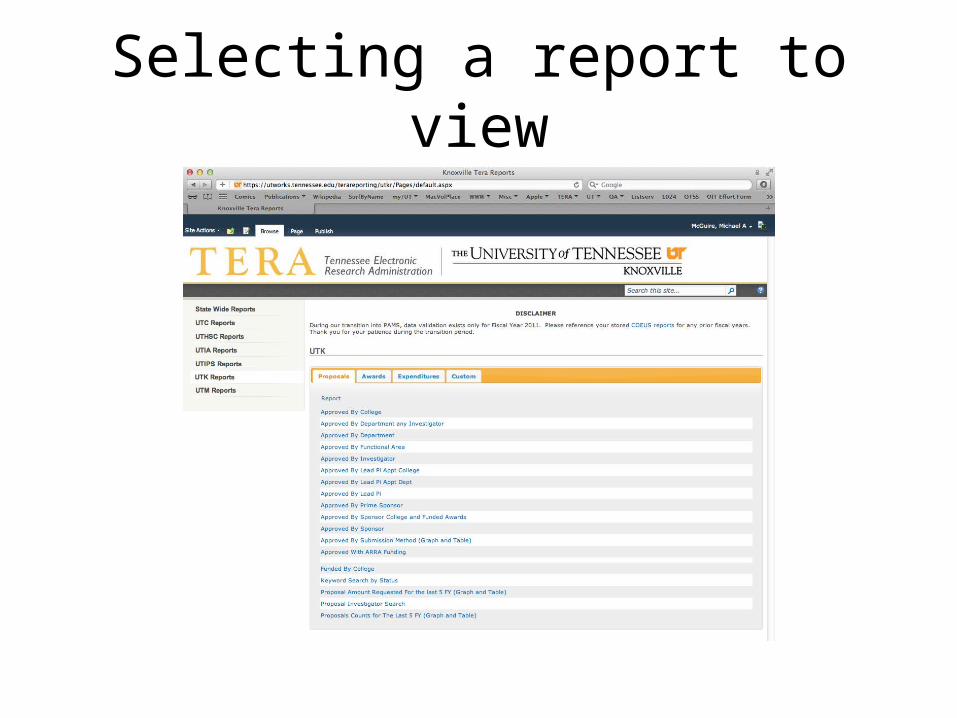
Selecting a report to view (2)

Security Pop-up

Be sure to save
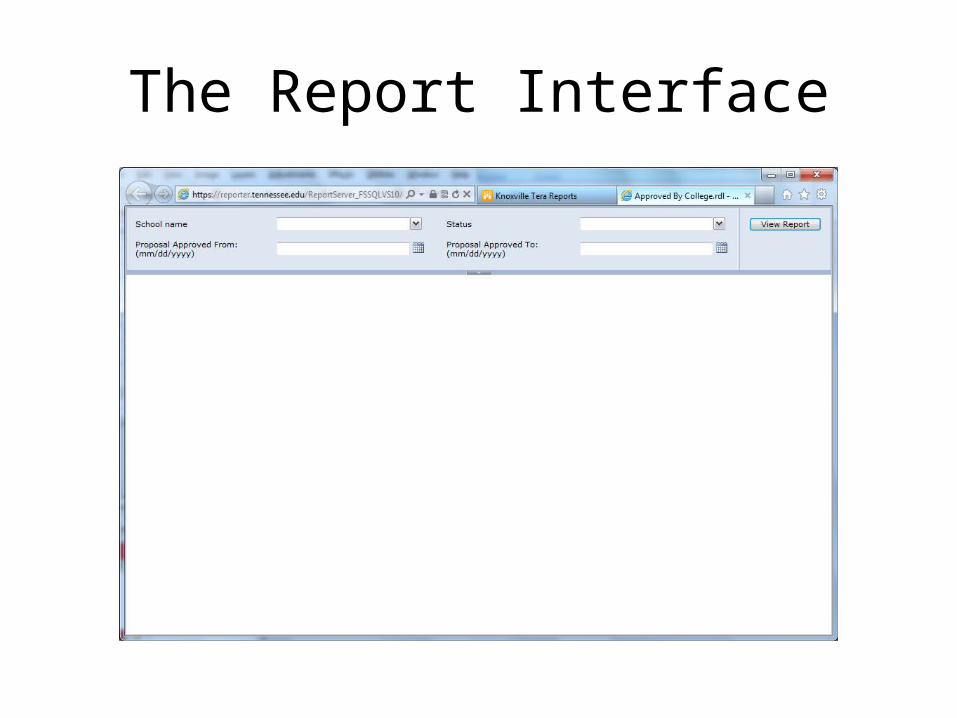
The Report Interface
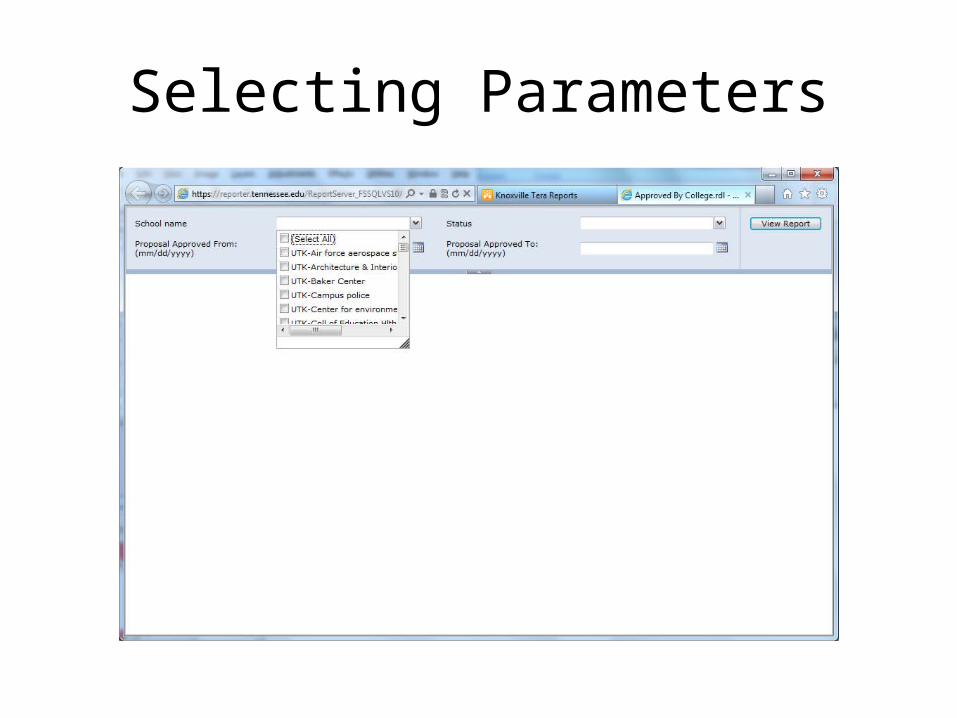
Selecting Parameters
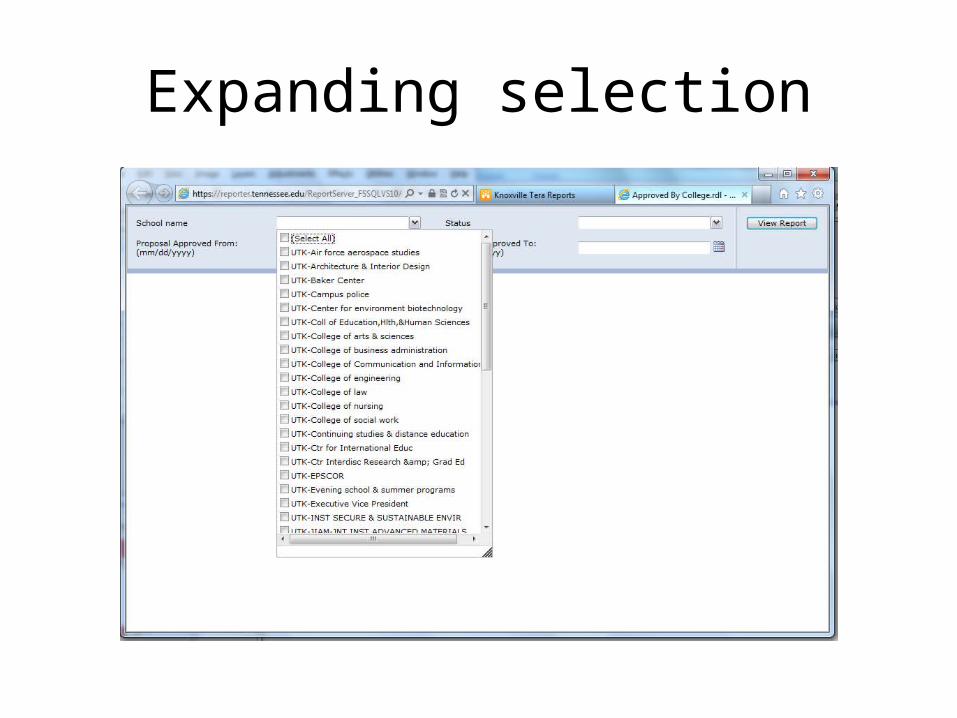
Expanding selection
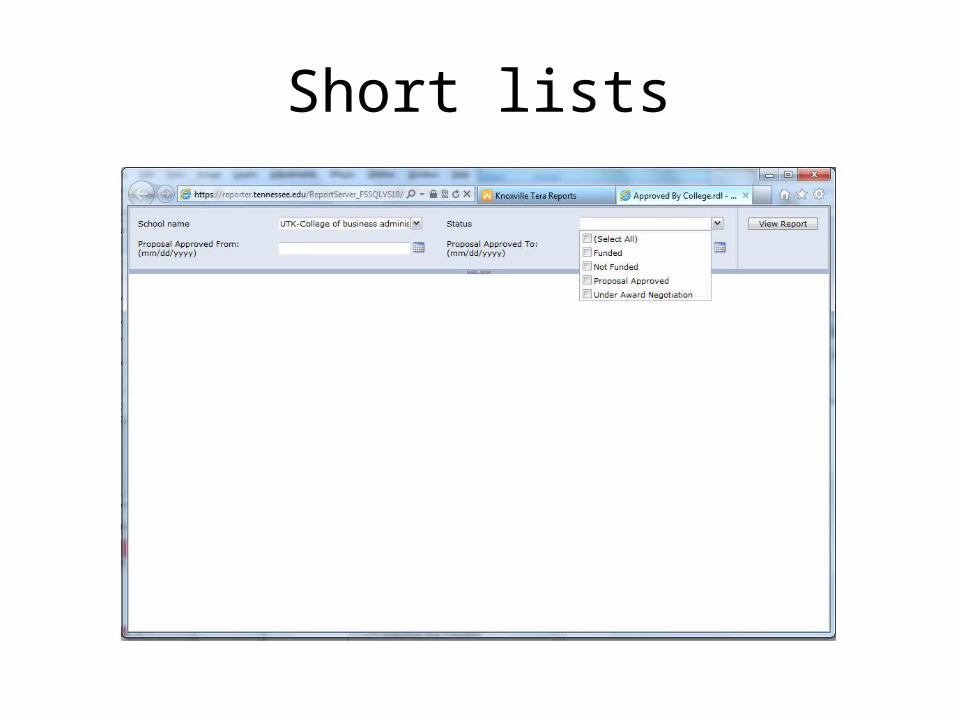
Short lists

Typing Date
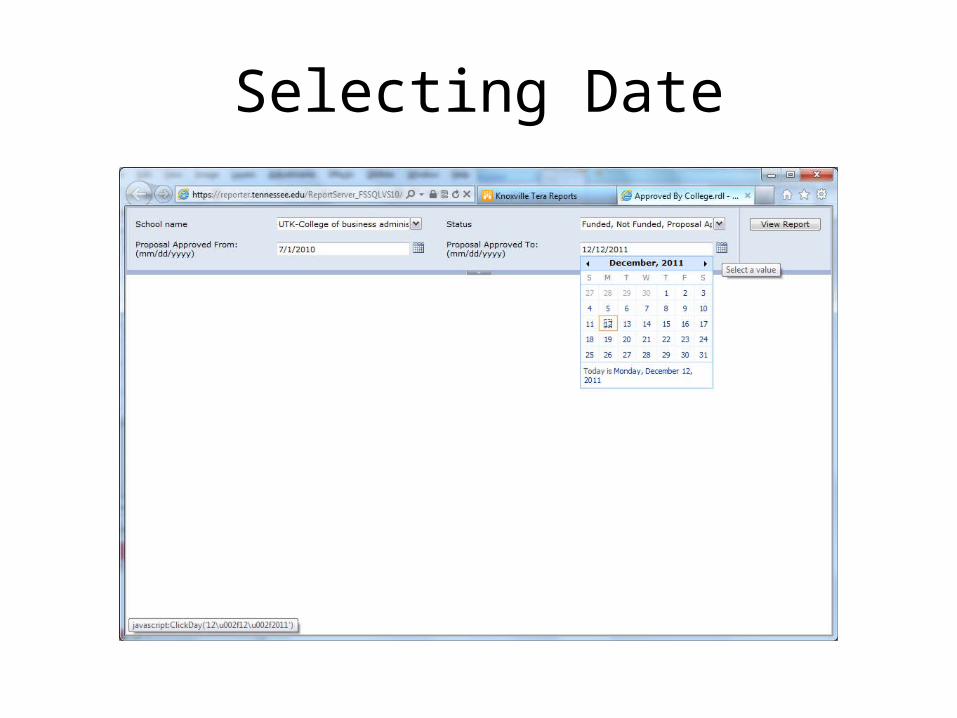
Selecting Date
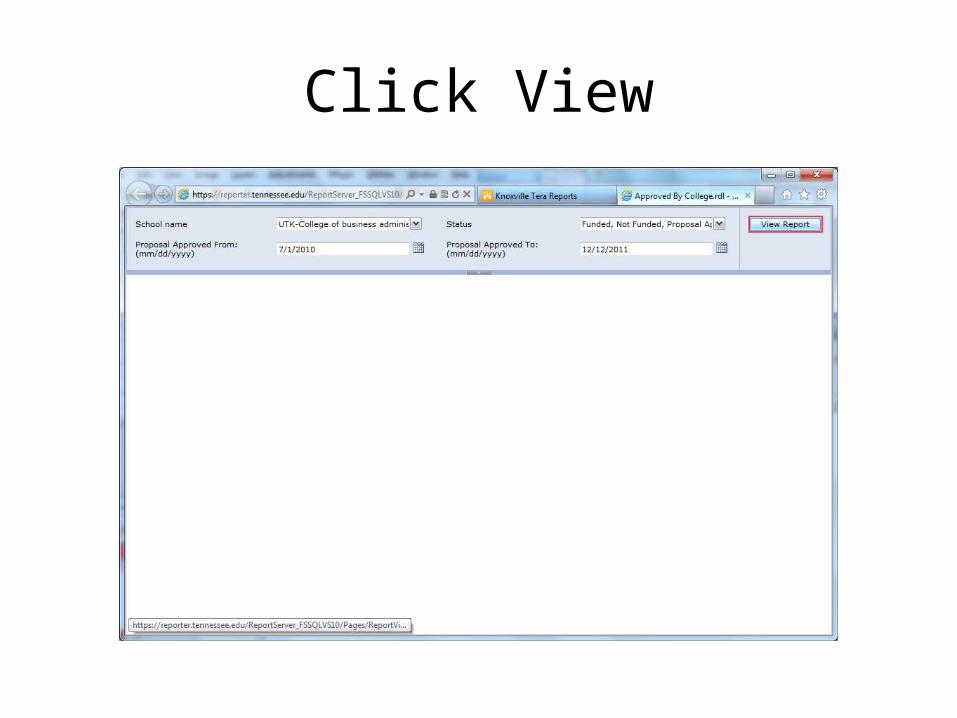
Click View

Report will build
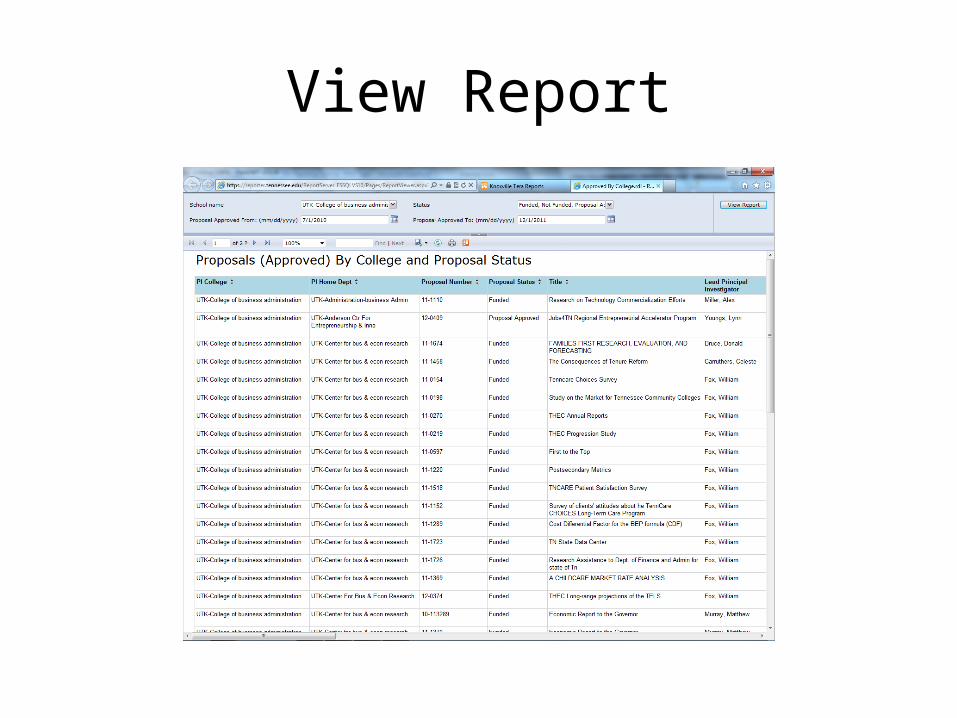
View Report
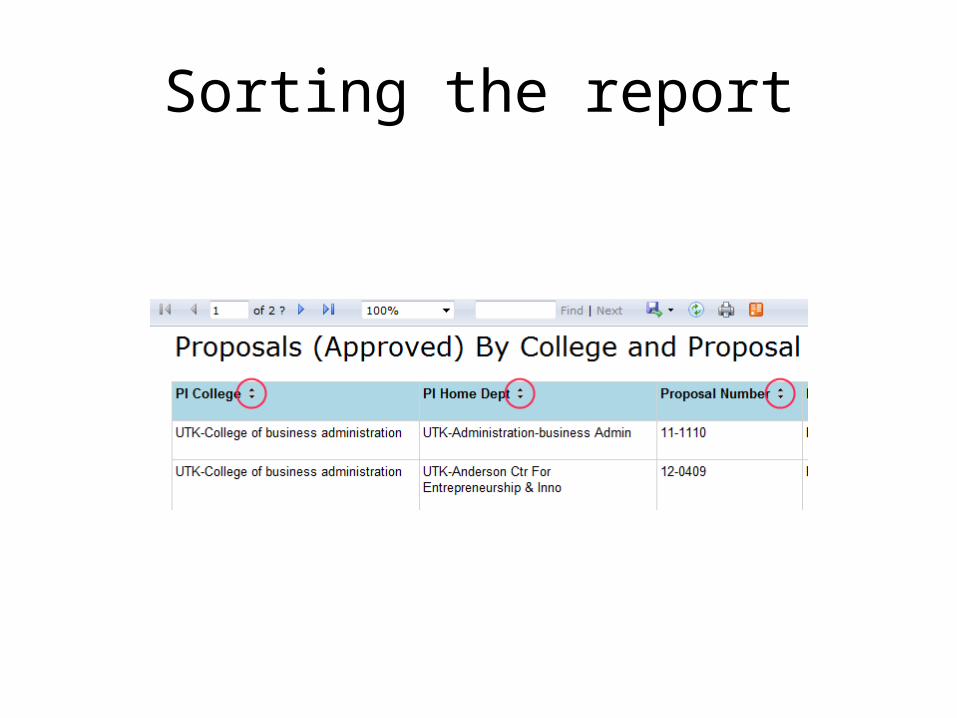
Sorting the report

Sorting ascending
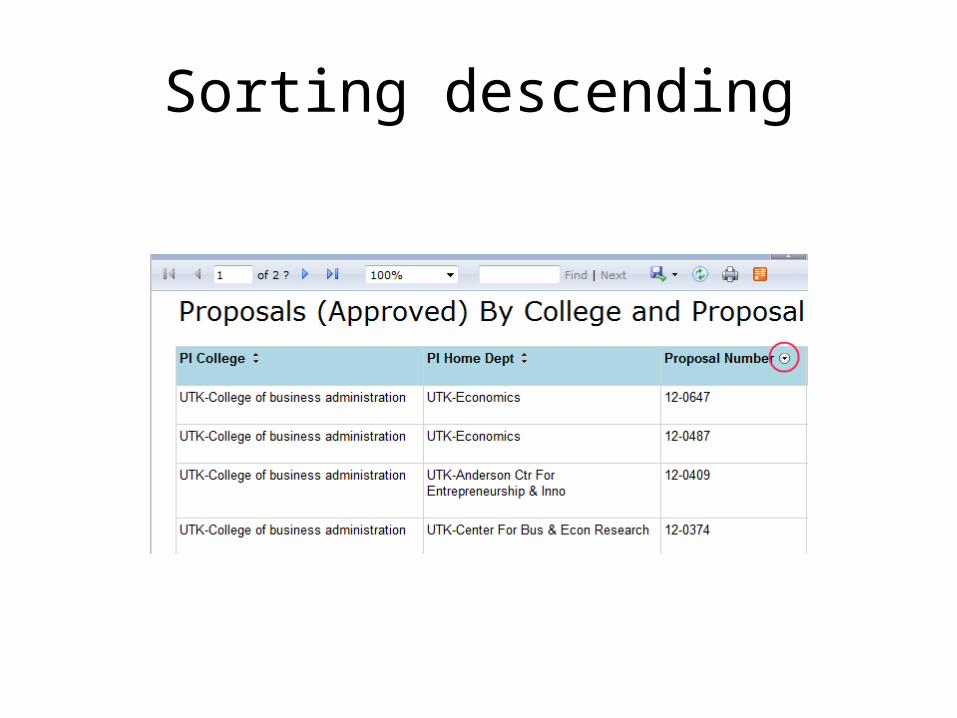
Sorting descending
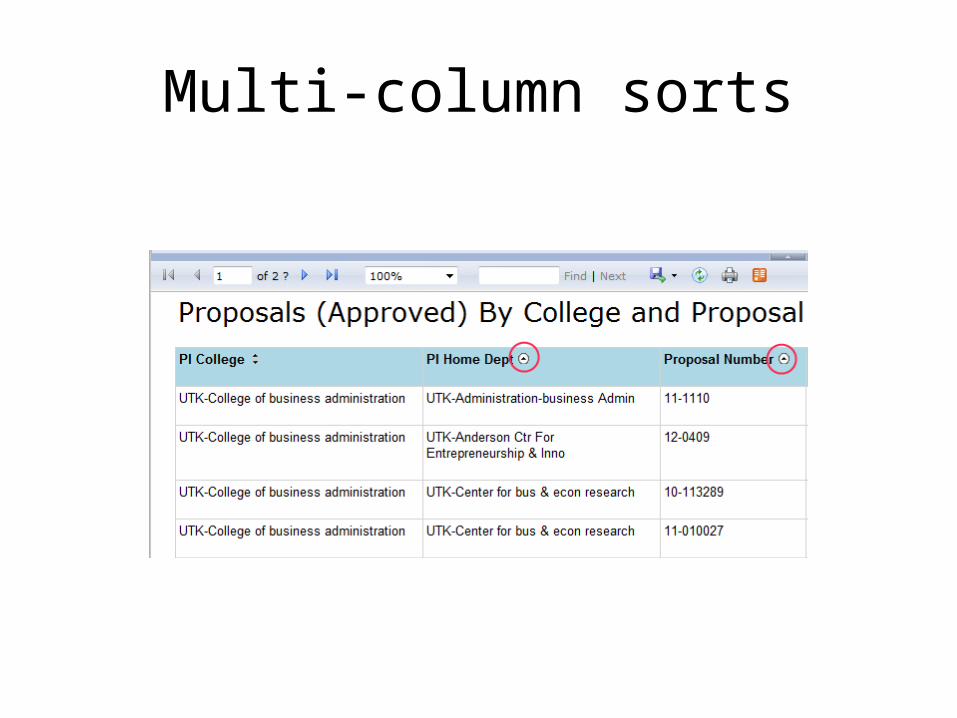
Multi-column sorts
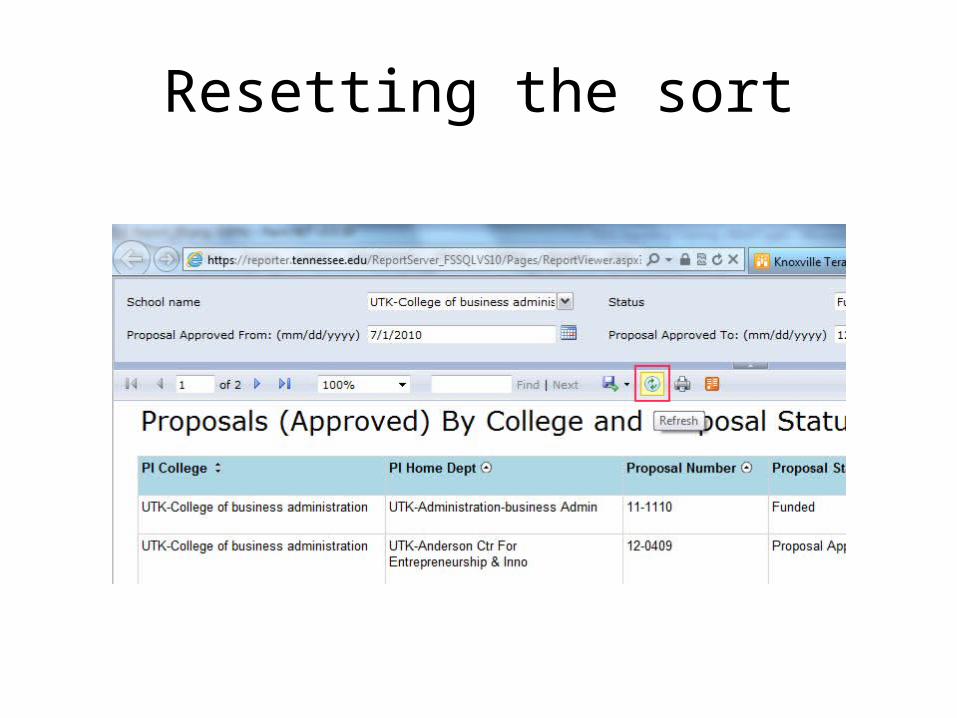
Resetting the sort
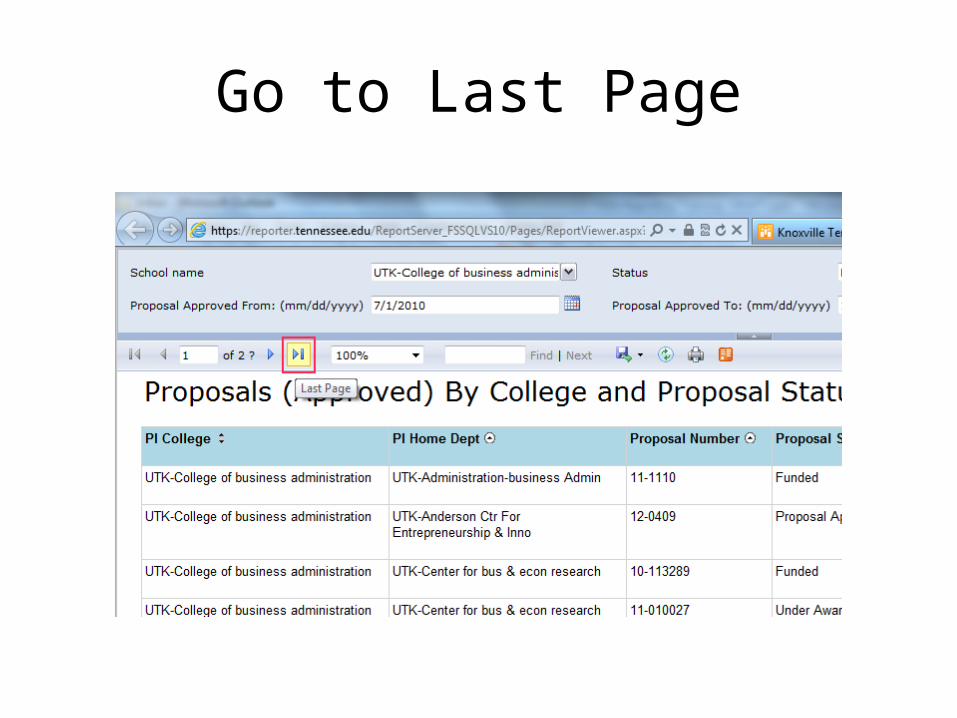
Go to Last Page
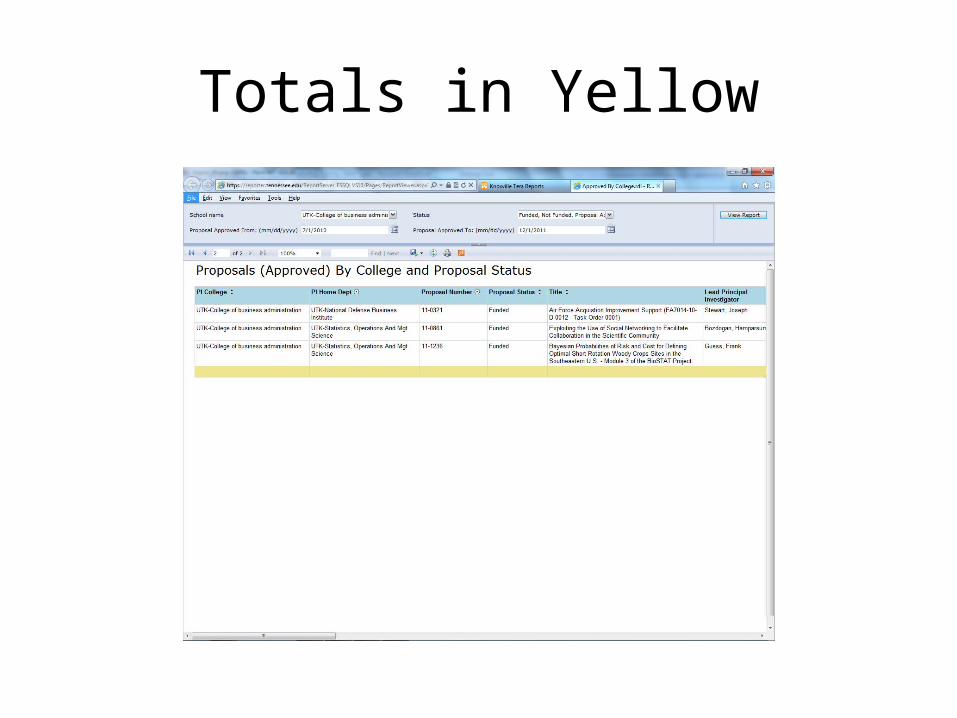
Totals in Yellow
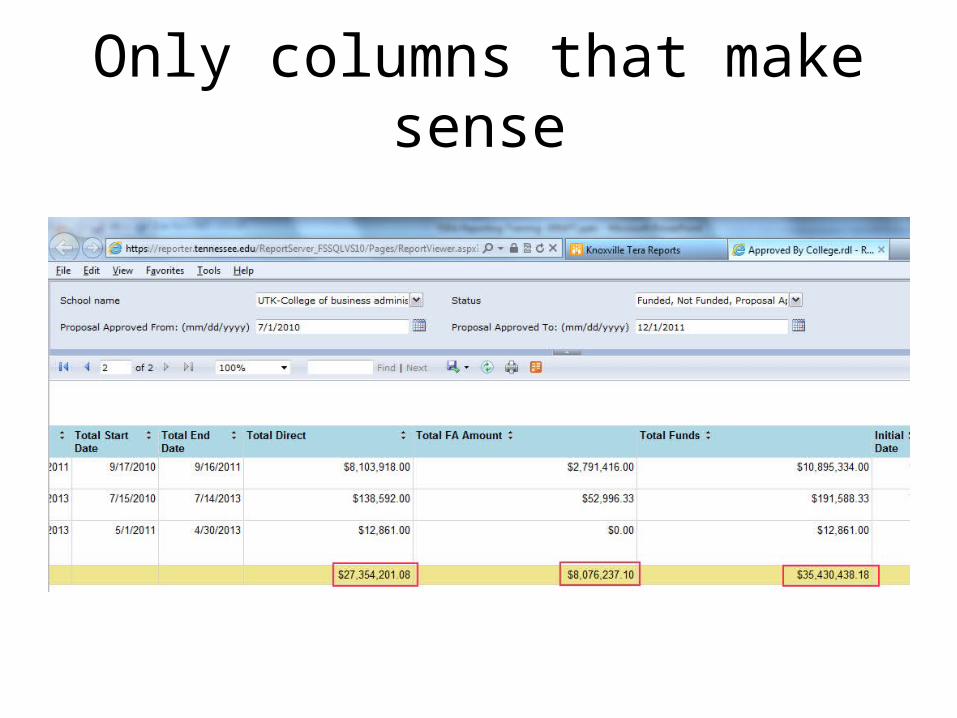
Only columns that make sense
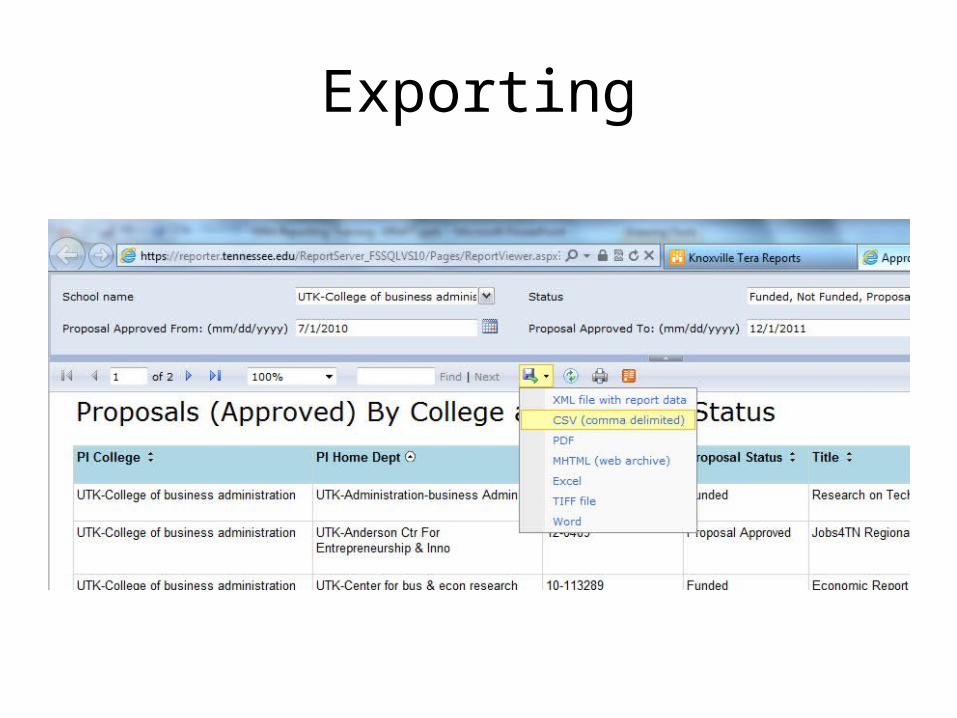
Exporting
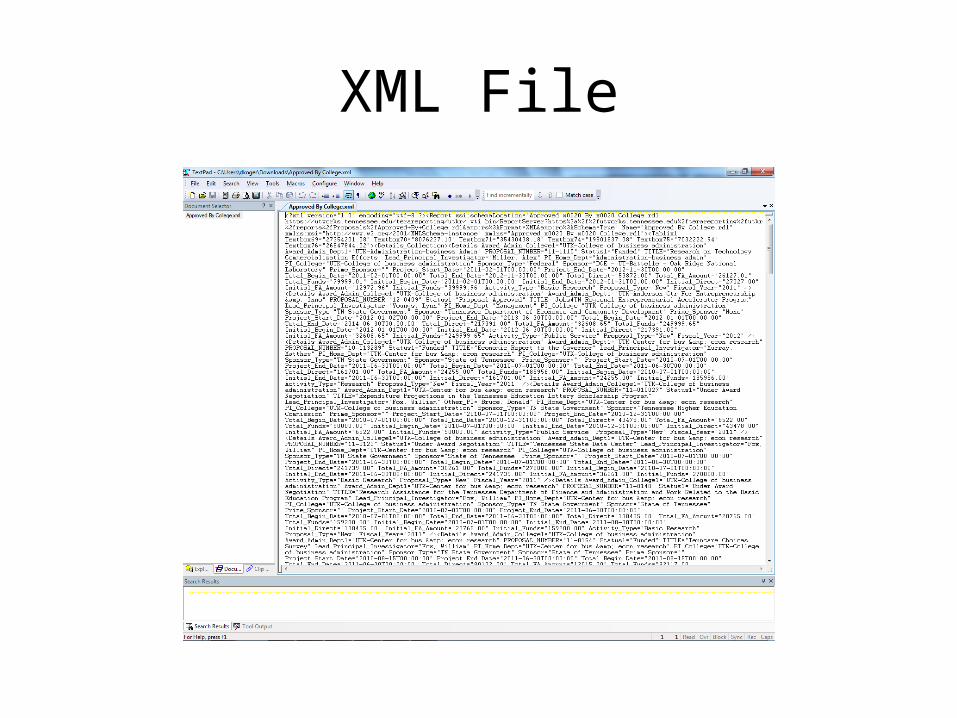
XML File
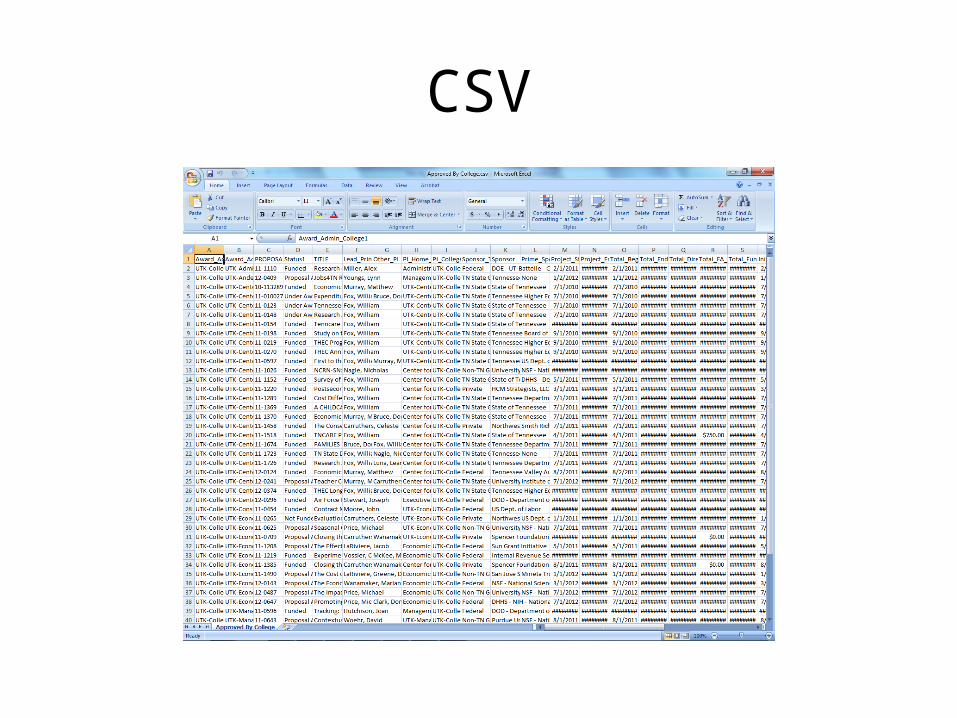
CSV
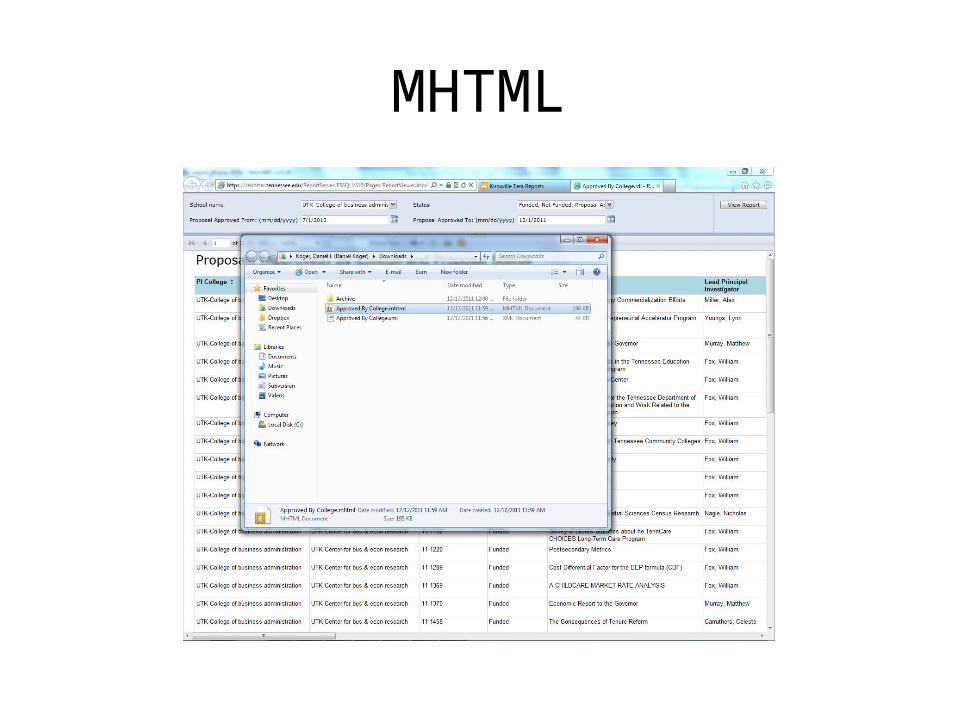
MHTML
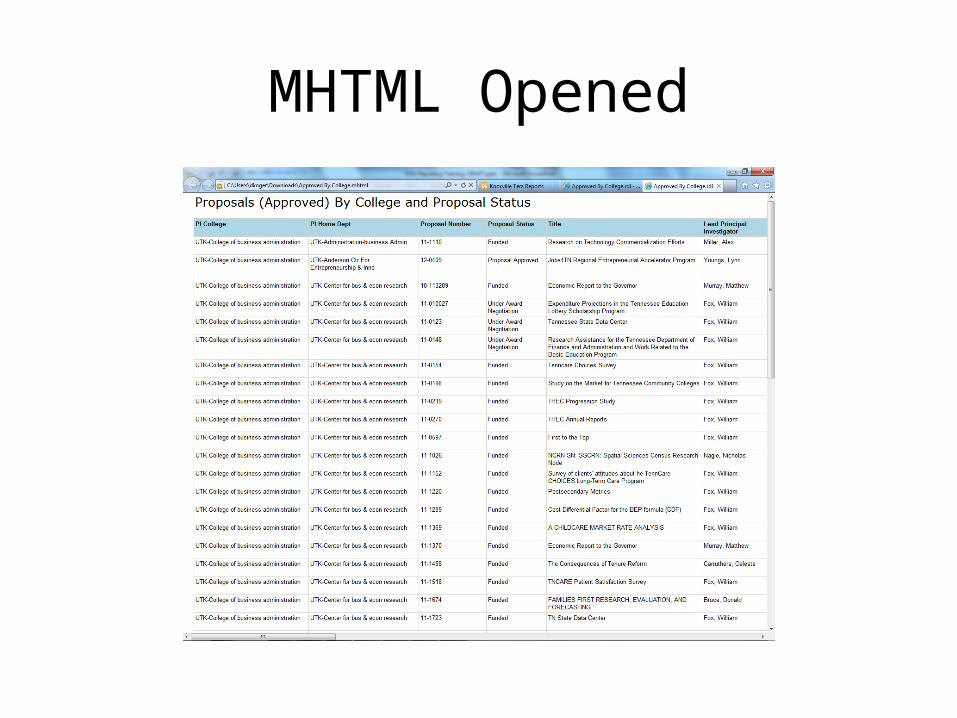
MHTML Opened
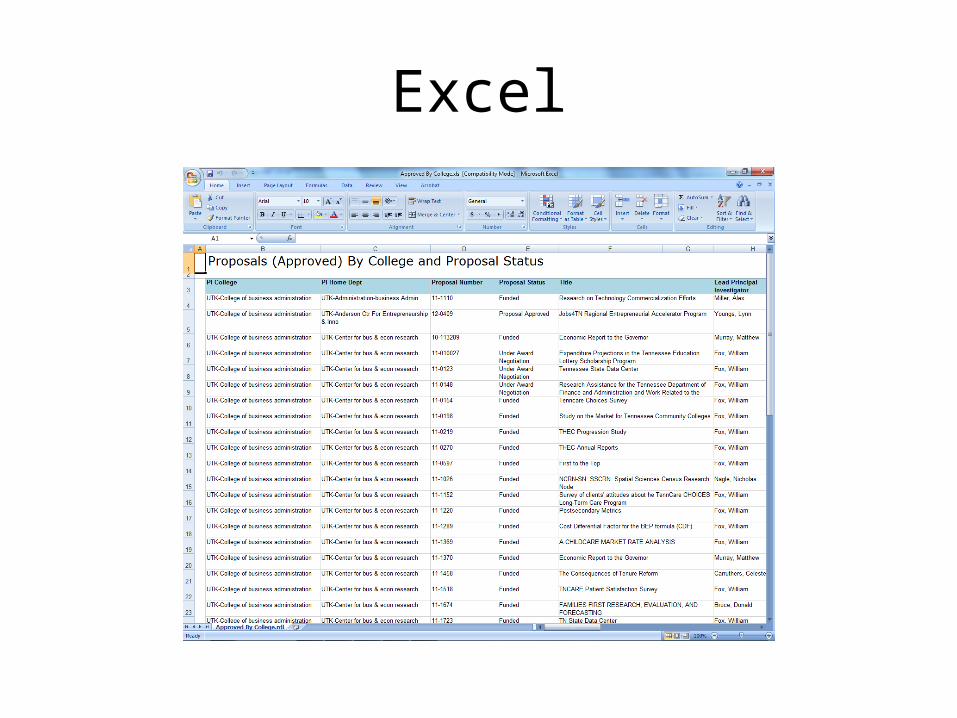
Excel

TIFF

Word
Analyzing Report Data with Microsoft Excel
• CSV is the best choice• Manipulating data in Excel

CSV
Pivot Tables
• A pivot table is a data summarization tool found in data visualization programs such as spreadsheets or business intelligence software. Among other functions, pivot-table tools can automatically sort, count, total or give the average of the data stored in one table or spreadsheet. It displays the results in a second table (called a "pivot table") showing the summarized data. Pivot tables are also useful for quickly creating unweighted cross tabulations. The user sets up and changes the summary's structure by dragging and dropping fields graphically.
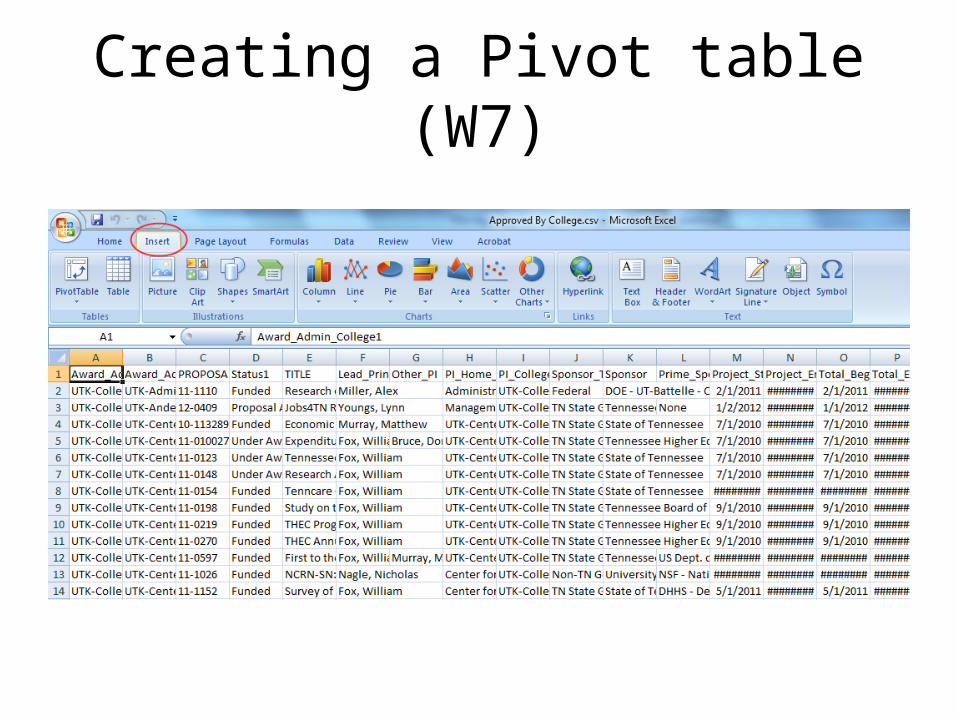
Creating a Pivot table (W7)

Inserting Pivots
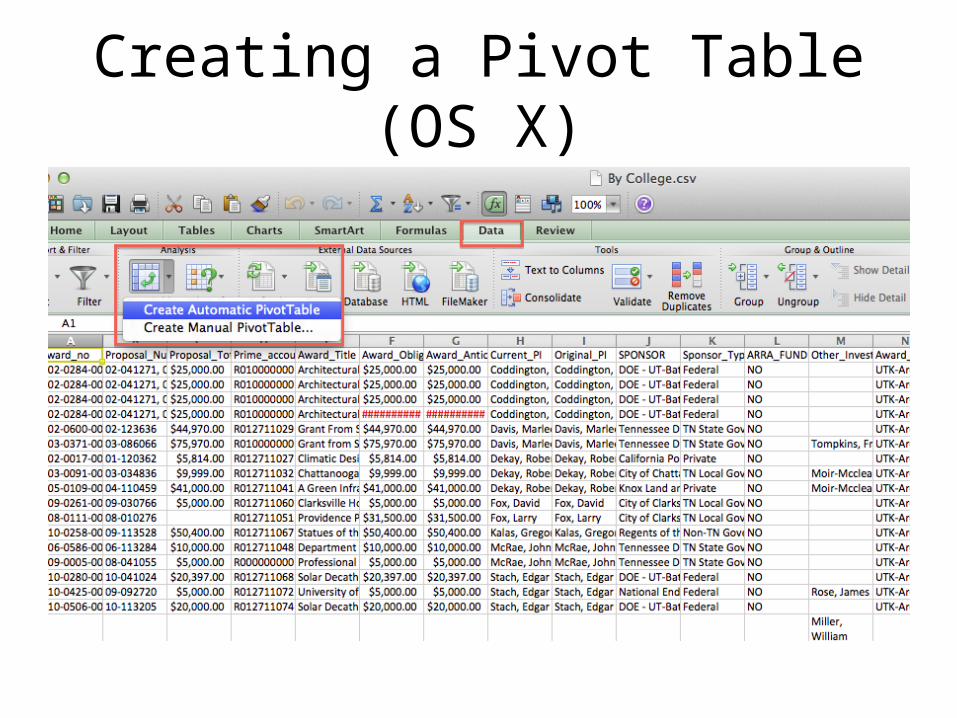
Creating a Pivot Table (OS X)
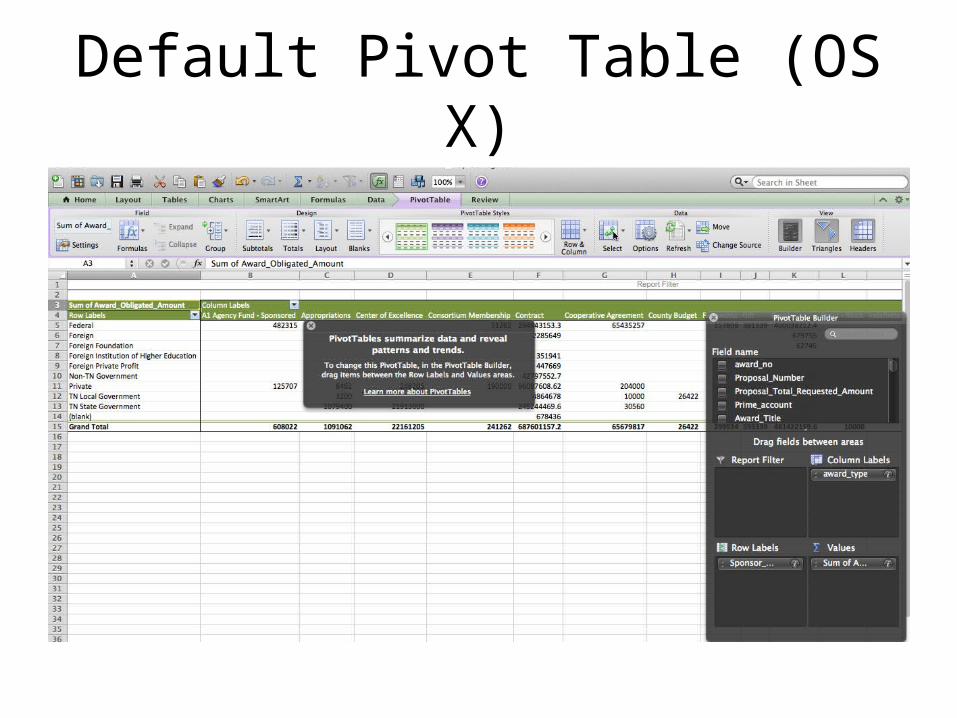
Default Pivot Table (OS X)
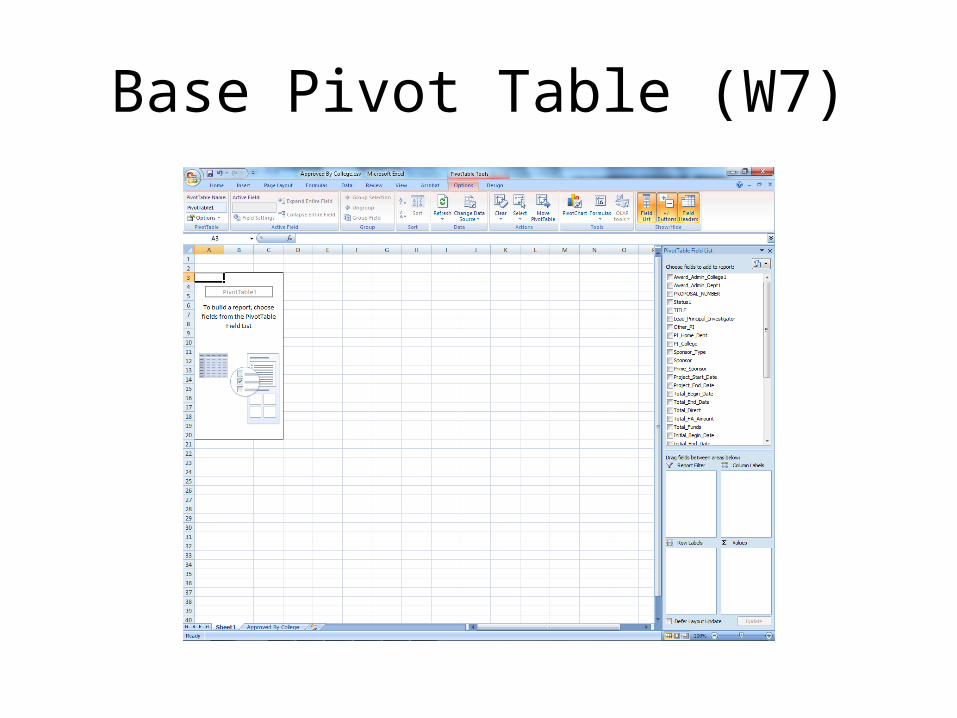
Base Pivot Table (W7)
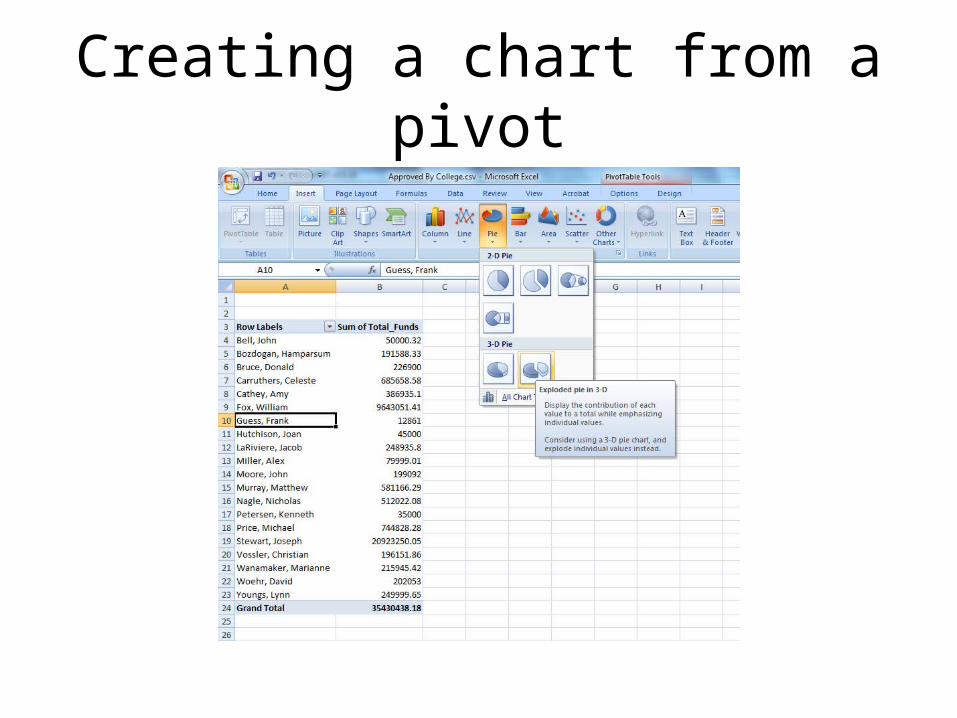
Creating a chart from a pivot
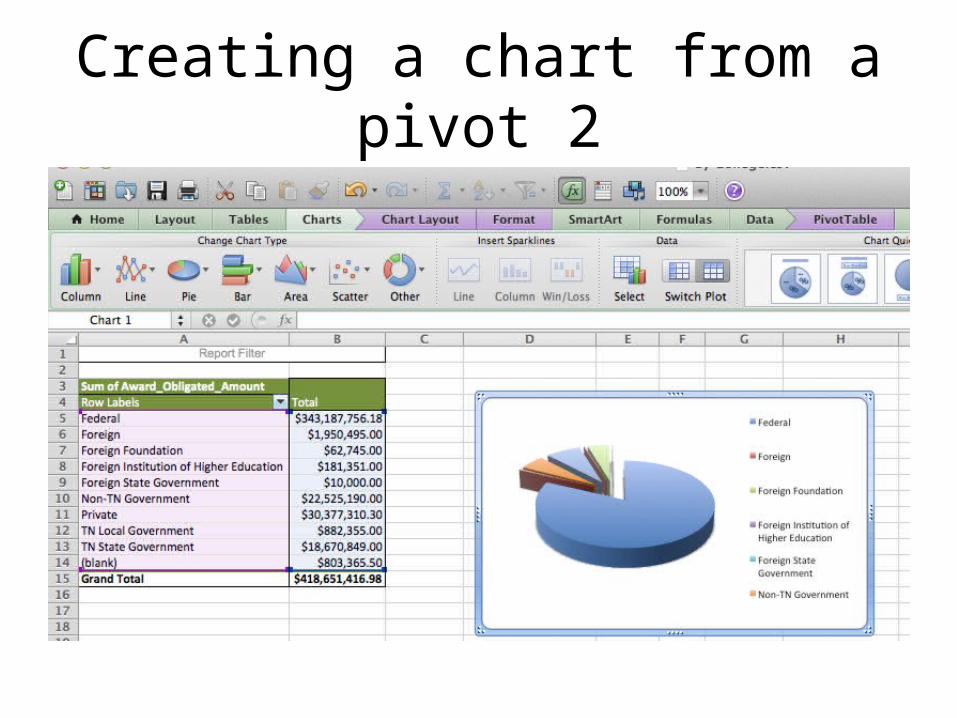
Creating a chart from a pivot 2