Embed Size (px)
Citation preview

Terminated Pregnancy Report
2015
Report Released
June 30, 2016

Terminated Pregnancy Report Indiana State Department of Health
Jerome M. Adams, MD, MPH State Health Commissioner Jennifer Walthall, MD, MPH Deputy State Health Commissioner Joan Duwve, MD, MPH Chief Medical Consultant Terry Whitson, JD Assistant Commissioner Health Care Quality and Regulation Brian J. Carnes, MPA State Registrar Director, Division of Vital Records Pam Pontones, MA State Epidemiologist Director, Epidemiology Resource Center
Report Prepared and Reviewed by:
Anne Reynolds, MPH Vital Records Epidemiologist Ann Kayser, MPH Acknowledgments: Epidemiology Resource Center
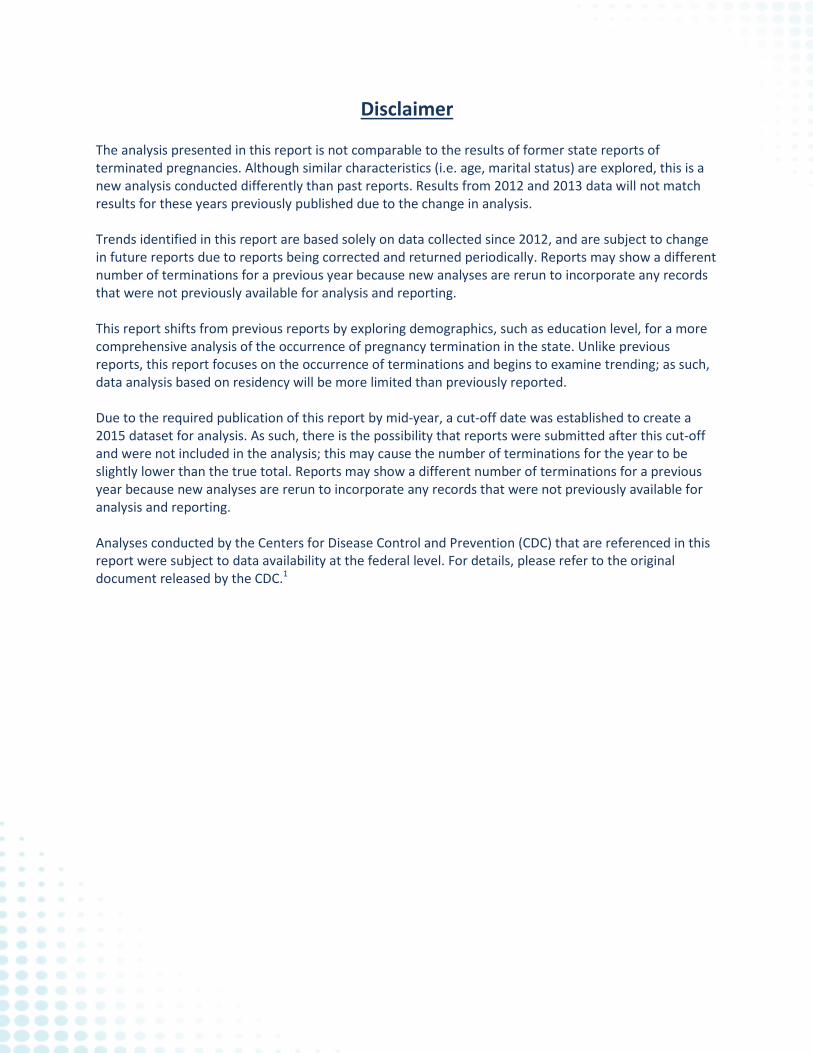
Disclaimer The analysis presented in this report is not comparable to the results of former state reports of terminated pregnancies. Although similar characteristics (i.e. age, marital status) are explored, this is a new analysis conducted differently than past reports. Results from 2012 and 2013 data will not match results for these years previously published due to the change in analysis. Trends identified in this report are based solely on data collected since 2012, and are subject to change in future reports due to reports being corrected and returned periodically. Reports may show a different number of terminations for a previous year because new analyses are rerun to incorporate any records that were not previously available for analysis and reporting. This report shifts from previous reports by exploring demographics, such as education level, for a more comprehensive analysis of the occurrence of pregnancy termination in the state. Unlike previous reports, this report focuses on the occurrence of terminations and begins to examine trending; as such, data analysis based on residency will be more limited than previously reported. Due to the required publication of this report by mid-year, a cut-off date was established to create a 2015 dataset for analysis. As such, there is the possibility that reports were submitted after this cut-off and were not included in the analysis; this may cause the number of terminations for the year to be slightly lower than the true total. Reports may show a different number of terminations for a previous year because new analyses are rerun to incorporate any records that were not previously available for analysis and reporting. Analyses conducted by the Centers for Disease Control and Prevention (CDC) that are referenced in this report were subject to data availability at the federal level. For details, please refer to the original document released by the CDC.1

Executive Summary The Terminated Pregnancy Report for Indiana is produced annually to provide a comprehensive overview of terminations performed in the state throughout the previous year. Data is reported to the Indiana State Department of Health Division of Vital Records in accordance with Indiana Code § 16-34-2. This year’s report is the second to provide analysis from an epidemiological perspective. Reports prior to 2014 consisted of the presentation of data tables for the information obtained from terminated pregnancy records. The 2015 reporting year is the last year for which reports are collected using a paper form. All future reports will be collected via an online reporting system. During calendar year 2015, 7,957 pregnancy terminations were reported by physicians to ISDH at the time of analysis. Of these terminations, 7,487 (95.87%) were Indiana residents. For 2014, 8,118 terminations were reported for 2014. In 2012 and 2013, 8,808 and 8,179 terminations were reported, respectively. The most recent U.S. Census data estimates that 1,295,431 women of childbearing age (15–44 years) lived in Indiana in 2014.4 Based on this estimation, the termination rate for Indiana residents in 2015 was 5.8 per 1,000 women aged 15–44. Of the women receiving terminations in 2015, 87.58% were unmarried and 12.39% were married. Terminations at abortion clinics accounted for 99.66% of procedures, and reported terminations were performed in six counties: Hamilton, Lake, Marion, Monroe, St. Joseph, and Tippecanoe. Of these, Marion County had the most, accounting for 63.10% of terminations; Hamilton County had the fewest, accounting for only 0.03% of terminations. Reports show that 41.54% of women reported a high school diploma or General Educational Development (GED) as the highest level of education they completed at the time of procedure. This is similar to 2012, 2013, and 2014, with 40.05%, 37.32%, and 39.00% reporting the same level of education in each year, respectively.
Total Abortions in Calendar Year 2015: 7,957 Total Abortions in Calendar Year 2014: 8,118
Terminations by Race
Race 2015 2014 White 57.12% 58.36% Black / African American 30.11% 28.66% Asian 3.24% 3.12% Pacific Islander / Native Hawaiian 0.09% 0.06% American Indian / Alaska Native 0.36% 0.26% Multiple Races 1.29% 0.79% Other 7.78% 7.48% Unknown 0.00% 1.27%

Weeks of Gestation at Time of Termination Gestation 2015 2014 ≤8 80.21% 78.82% 9-13 19.57% 20.90% 14-15 0.08% 0.07% 16-17 0.05% 0.09% 18-20 0.10% 0.11%
Procedure Used to Terminate Pregnancy in Indiana
Procedure 2015 2014 Dilation & Evacuation 0.24% 0.33% Menstrual Aspiration 0.04% 0.00% Mifepristone / Misoprostol 27.93% 26.64% Suction Curettage 71.80% 73.00%
* Percentages may not add to 100 due to rounding

Table of Contents Introduction 1–3
Indiana Reporting Requirements 1 Trends in Indiana 2
Methodology 4–6
Data Source 4 Measures 4 Analytic Procedures 5
Results 7–22
Demographic Information of Women Receiving Terminations 7 Age 7 Adolescents 8 Race and Ethnicity 9 Marital Status 10 Education Level 11 Pregnancy History of Women Receiving Terminations 13 Medical Information of Women Receiving Terminations 15 Procedure and Facility Type 15 Estimated Gestational Age 18 Geographic Information of Women Receiving Terminations 20 County of Termination 20 County of Residence 21
Discussion 23
Appendix A: State Form 36526 (R4 / 12-11) 24 Appendix B: State Form 36526 (R3 / 6-11) 25 Appendix C: Electronic Terminated Pregnancy Database 26 Appendix D: Glossary 27 References 28

List of Tables Table 1. Number, rate, and ratio of reported abortions – by selected reporting areas, United States, 2003–20121 Table 2. Number and rate of reported terminations among Indiana residents of childbearing age occurring in Indiana, 2012–2015 Table 3. Equivalence of race categories in this report Table 4. Terminations among resident and non-resident women in Indiana by Month, 2015 Table 5. Age distribution of women obtaining terminations in Indiana, 2015 Table 6. Age of women obtaining terminations in Indiana by Race, 2015 Table 7. Race of women obtaining terminations in Indiana, 2015 Table 8. Ethnicity of women obtaining terminations in Indiana, 2015 Table 9. Marital status of women obtaining terminations in Indiana, 2015 Table 10. Education level of women obtaining terminations in Indiana, 2015 Table 11. Equivalence of education years and education level Table 12. Pregnancy history of women obtaining terminations in Indiana, 2015 Table 13. Procedure used to terminate pregnancy in Indiana, 2013–2015 Table 14. Terminations reported in Indiana by Facility, 2015 Table 15. Procedure used to terminate pregnancy in Indiana by Facility type, 2015 Table 16. Estimated gestational age at time of termination in Indiana, 2015 Table 17. Estimated gestational age among women obtaining terminations in Indiana by Procedure, 2015 Table 18. County where termination performed in Indiana, 2015 Table 19. County of residence of Indiana residents receiving terminations in Indiana by Age, 2015 Table 20. Number of Indiana residents receiving terminations in Indiana by County, 2015
List of Figures Figure 1. Number of terminations reported in Indiana, 2012–2015 Figure 2. Age distribution of women obtaining terminations in Indiana, 2012–2015 Figure 3. Ethnicity of women obtaining terminations in Indiana, 2012–2015 Figure 4. Education level of women obtaining terminations in Indiana, 2015 Figure 5. Pregnancy history of women obtaining terminations in Indiana by Race, 2015 Figure 6. Pregnancy history of women obtaining terminations in Indiana by Age, 2015 Figure 7. Estimated gestational age at time of termination in Indiana, 2012–2015

Page | 1
Introduction The Centers for Disease Control and Prevention (CDC) has reported on abortion surveillance since 1969. Annually, CDC requests data from throughout the United States; however, participation by health agencies is voluntary.1 The Indiana State Department of Health (ISDH) has provided data to CDC since 1973.9 The most recently reported abortion numbers, rates (number of abortions per 1,000 women aged 15-44 years), and ratios (number of abortions per 1,000 live births) for the United States during the time frame 2003–2012 are shown in Table 1. Table 1. Number, rate, and ratio of reported abortions – by selected reporting areas, United States, 2003–20121
Year All reporting
areas§ Continuously reporting areas¶
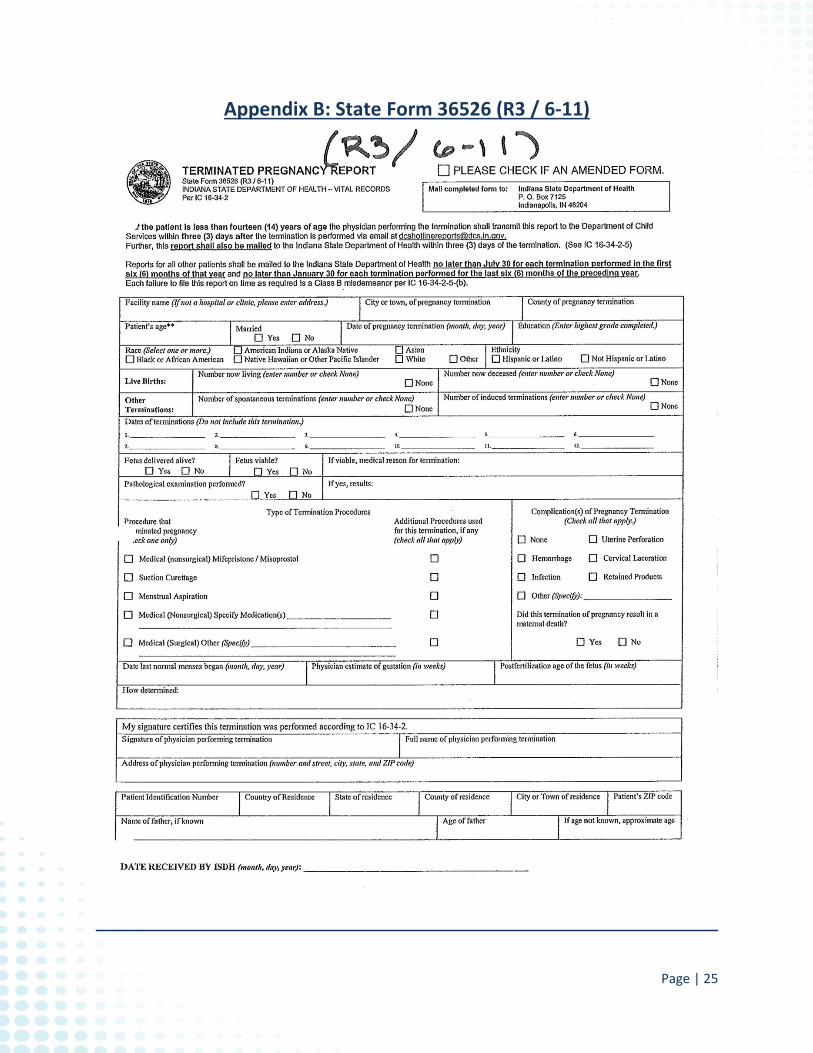
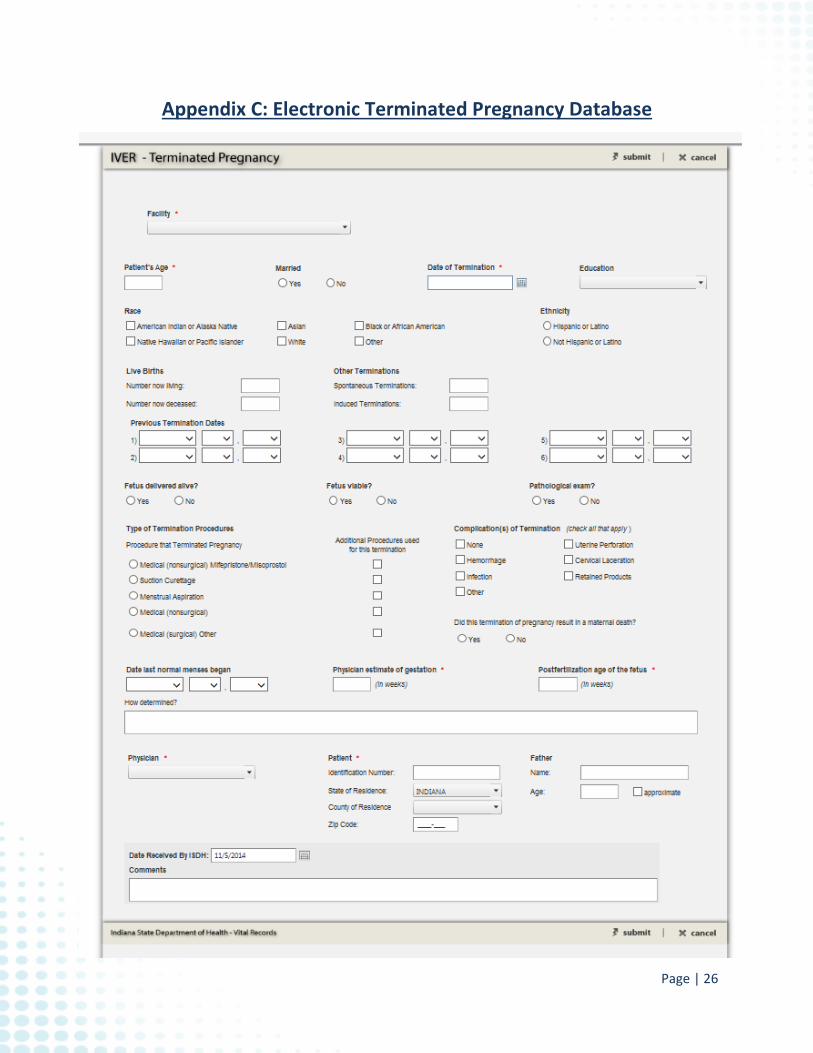
Count Count Percent** Rate Ratio 2003 848,163 826,036 97.4 16.1 245 2004 839,226 817,906 97.5 15.9 241 2005 820,151 807,680 98.5 15.7 236 2006 852,385†† 834,615 97.9 16.2 237 2007 827,609 818,923 99.0 15.8 229 2008 825,564 816,765 98.9 15.8 232 2009 789,217§§ 779,278 98.7 15.0 227 2010 765,651 754,780 98.6 14.6 227 2011 730,322 719,530 98.5 13.9 219 2012 699,202 688,149 98.4 13.2 210 § Excludes states that did not report abortion numbers to CDC: California (2003-2012), Louisiana (2005), Maryland (2007-2012), New Hampshire (2003-2012), and West Virginia (2003-2004). ¶ Only includes areas that reported abortion counts every year during the period of analysis (2003-2012). ** Abortions from areas that reported every year during 2003-2012 as a percentage of all reported abortions. †† This number is greater than reported in the 2006 report because of numbers subsequently provided by Louisiana. §§ This number is greater than reported in the 2009 report because of numbers subsequently provided by Delaware. Indiana Reporting Requirements Reports were submitted by mail to the ISDH Vital Records Division on State Form 36526 (R4 / 12-11) (Appendix A). A minimal number of reports were submitted on the older form, State Form 36526 (R3 / 6-11) (Appendix B). Upon receipt, all forms were reviewed for completeness; incomplete forms were returned to the physician for correction. Completed forms were entered into the electronic terminated pregnancy database (Appendix C). The performance of, and reporting requirements for, terminated pregnancy in Indiana are governed by Indiana Code Title 16, Article 34, Chapter 2 (§ 16-34-2).3 The pertinent Indiana Code can be found in its entirety at https://iga.in.gov/legislative/laws/2014/ic/titles/016/articles/034/chapters/002/.

Page | 2
Trends in Indiana During calendar year 2015, 7,957 pregnancy terminations were reported by physicians to ISDH, at the time of analysis. Of these terminations, 7,487 (95.87%) were Indiana residents. In 2012 and 2013, 8,808 and 8,179 terminations were reported, respectively. There were 8,118 terminations reported for 2014. The decrease in the total number of terminations performed in Indiana from 2012 to 2015 can be seen in Figure 1.
Table 2 shows the number of terminations among Indiana residents of childbearing age and the associated rates from 2012 to 2015. As rates are only based on Indiana residents, data is also provided to identify the percentage of all terminations reported that were Indiana residents. The count used to determine the rate is the number of Indiana residents receiving terminations from all reported terminations in Indiana.
8,808
8,179 8,118
7,957
7,800
8,000
8,200
8,400
8,600
8,800
9,000
2012 2013 2014 2015
Num
ber o
f Ter
min
atio
ns
Termination Year
Figure 1. Number of terminations reported in Indiana, 2012-2015

Page | 3
Table 2. Number and rate of reported terminations among Indiana residents of childbearing age occurring in Indiana, 2012–2015 Year Count Population Est.§ Rate† Percent¶ 2012 8,272 1,287,150 6.4 93.9 2013 7,596 1,292,138 5.9 92.9 2014 7,621 1,295,431 5.9 93.9 2015 7,487 1,295,431* 5.8 94.1 § Estimation of females aged 15–44 that were Indiana residents during the specified year.4
* Estimation based on the most recent year available at the time of publication, 2014. † Rate per 1,000. ¶ Percent of total terminations reported to the Indiana State Department of Health for the specified year. True trends have yet to be established at the state level in Indiana due to the change in reporting, which began with the 2014 report. This report will focus on the characteristics associated with terminations conducted in 2015, while beginning to identify trends since 2012.
Page | 4
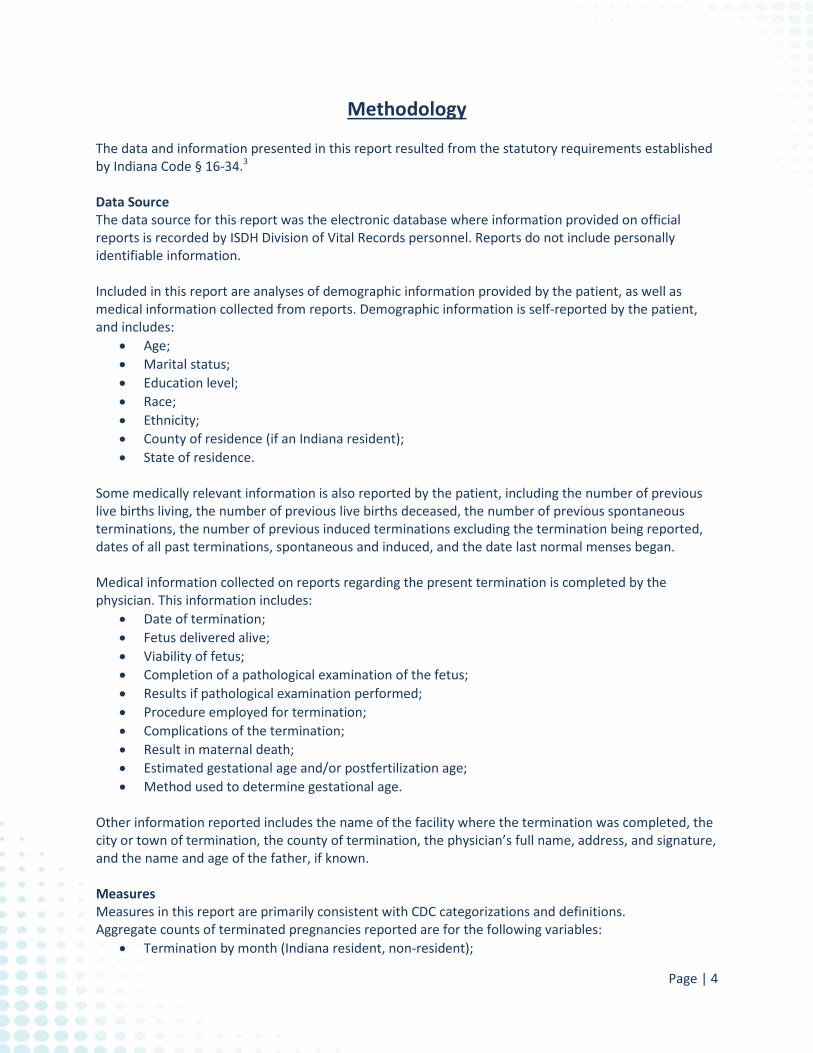
Methodology The data and information presented in this report resulted from the statutory requirements established by Indiana Code § 16-34.3 Data Source The data source for this report was the electronic database where information provided on official reports is recorded by ISDH Division of Vital Records personnel. Reports do not include personally identifiable information. Included in this report are analyses of demographic information provided by the patient, as well as medical information collected from reports. Demographic information is self-reported by the patient, and includes:
• Age; • Marital status; • Education level; • Race; • Ethnicity; • County of residence (if an Indiana resident); • State of residence.
Some medically relevant information is also reported by the patient, including the number of previous live births living, the number of previous live births deceased, the number of previous spontaneous terminations, the number of previous induced terminations excluding the termination being reported, dates of all past terminations, spontaneous and induced, and the date last normal menses began. Medical information collected on reports regarding the present termination is completed by the physician. This information includes:
• Date of termination; • Fetus delivered alive; • Viability of fetus; • Completion of a pathological examination of the fetus; • Results if pathological examination performed; • Procedure employed for termination; • Complications of the termination; • Result in maternal death; • Estimated gestational age and/or postfertilization age; • Method used to determine gestational age.
Other information reported includes the name of the facility where the termination was completed, the city or town of termination, the county of termination, the physician’s full name, address, and signature, and the name and age of the father, if known. Measures Measures in this report are primarily consistent with CDC categorizations and definitions. Aggregate counts of terminated pregnancies reported are for the following variables:
• Termination by month (Indiana resident, non-resident);
Page | 5
• Woman’s age in years (10-14, 15-17, 18-19, 20-24, 25-29, 30-34, 35-39, 40-44, ≥ 45); • Race (White, Black/African American, American Indian/Alaska Native, Pacific Islander/Native
Hawaiian, Multiple Races, Other Race); • Ethnicity (Hispanic or non-Hispanic); • Marital status (married or unmarried); • Education level (8th grade or less, 9th-12th grade but no diploma, high school diploma or GED,
some college credit but no degree, Associate’s Degree, Bachelor’s Degree, Master’s Degree, Doctoral or Professional Degree);
• Pregnancy history (0, 1, 2, ≥ 3, Unknown); • Procedure (Dilation & Evacuation, Mifepristone/Misoprostol, Suction Curettage, Medical (Non-
Surgical), Menstrual Aspiration, Unknown); • Facility (Facility where termination performed); • Estimated gestational age in weeks at the time of termination (≤ 8, 9-13, 14-15, 16-17, 18-20); • County of termination (Indiana county of termination); • County of residence (Indiana residents only, under specific criteria).
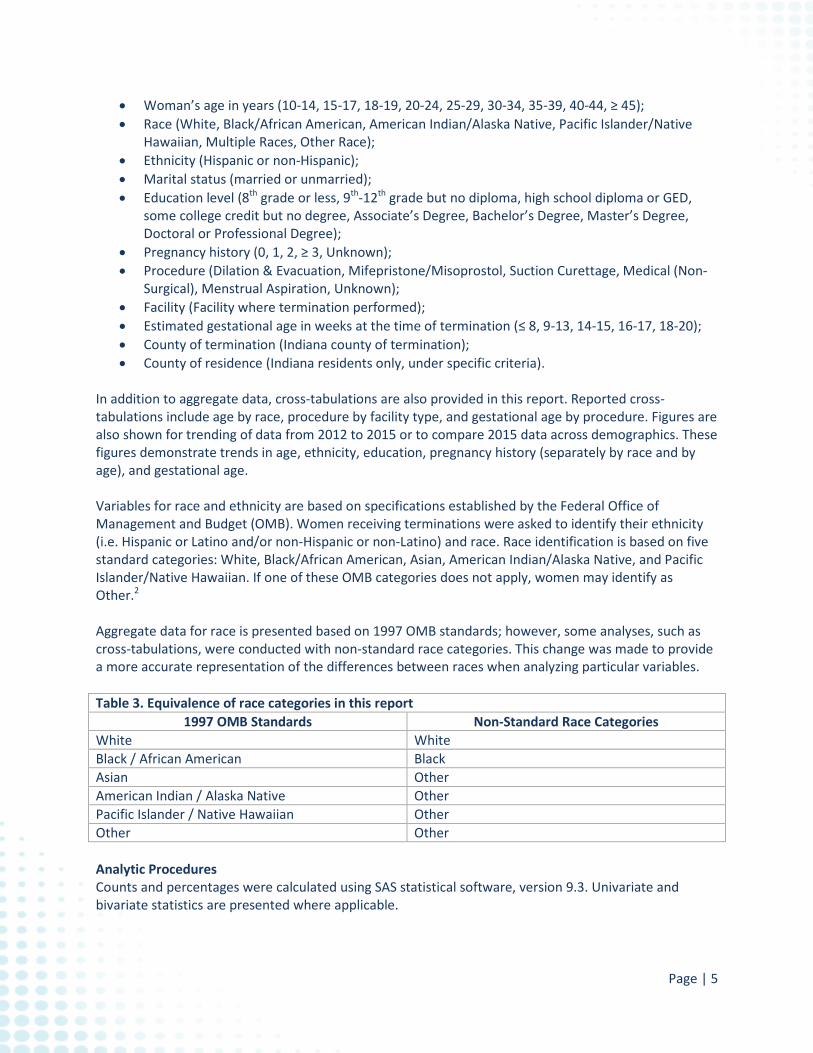
In addition to aggregate data, cross-tabulations are also provided in this report. Reported cross-tabulations include age by race, procedure by facility type, and gestational age by procedure. Figures are also shown for trending of data from 2012 to 2015 or to compare 2015 data across demographics. These figures demonstrate trends in age, ethnicity, education, pregnancy history (separately by race and by age), and gestational age. Variables for race and ethnicity are based on specifications established by the Federal Office of Management and Budget (OMB). Women receiving terminations were asked to identify their ethnicity (i.e. Hispanic or Latino and/or non-Hispanic or non-Latino) and race. Race identification is based on five standard categories: White, Black/African American, Asian, American Indian/Alaska Native, and Pacific Islander/Native Hawaiian. If one of these OMB categories does not apply, women may identify as Other.2 Aggregate data for race is presented based on 1997 OMB standards; however, some analyses, such as cross-tabulations, were conducted with non-standard race categories. This change was made to provide a more accurate representation of the differences between races when analyzing particular variables. Table 3. Equivalence of race categories in this report
1997 OMB Standards Non-Standard Race Categories White White Black / African American Black Asian Other American Indian / Alaska Native Other Pacific Islander / Native Hawaiian Other Other Other Analytic Procedures Counts and percentages were calculated using SAS statistical software, version 9.3. Univariate and bivariate statistics are presented where applicable.

Page | 6
Ratios are not provided in this analysis due to the fact that Indiana’s 2015 natality file will not be considered complete until early 2016. Some records were removed from the dataset for reasons such as duplication or incomplete procedures, prior to analysis.

Page | 7
Results During 2015, 7,957 terminations were reported to the ISDH. Of these terminations, 7,487 were residents of Indiana. The most recent U.S. Census data estimates that 1,295,431 women of childbearing age (15–44 years) lived in Indiana in 2014.4 Based on this estimation, the termination rate for Indiana residents in 2015 was 5.8 per 1,000 women aged 15–44. Table 4 provides a breakdown of the number of terminations among resident and non-resident women who received terminations in Indiana in 2015 by month. Table 4. Terminations among resident and non-resident women in Indiana by Month, 2015
Month Resident Terminations (n = 7,487)
Non-Resident Terminations (n = 470)
January 753 59 February 703 47 March 670 27 April 657 44 May 681 43 June 644 39 July 621 48 August 527 23 September 581 44 October 592 33 November 504 30 December 554 33 Demographic Information of Women Receiving Terminations Demographic information collected and analyzed for this report includes age, race, ethnicity, marital status, and education level of the women receiving terminations in Indiana in 2015. Age The age range for women receiving terminations in Indiana in 2015 was 12 to 48 years. The average age of a woman who obtained a termination was 26.5 years (SD = 6.2 years), with a median age of 25. Table 5. Age distribution of women obtaining terminations in Indiana, 2015
Age (years) Count Percent 10-14 25 0.31 15-17 219 2.75 18-19 602 7.57 20-24 2,686 33.76 25-29 2,111 26.53 30-34 1,279 16.07 35-39 780 9.80 40-44 243 3.05 ≥ 45 12 0.15 Total 7,957 100.0

Page | 8
Approximately 60.29% of terminations were performed for women in their twenties (20–29 years). Women aged forty and older had the smallest percentage of terminations, 3.20%.
For each age group, more than half of the women were white. Based on cross-tabulation of age group by race, white women in their twenties received the most terminations in Indiana in 2015. Table 6. Age of women obtaining terminations in Indiana by Race, 2015
Age Group Race Total
White Black Other Count Percent Count Percent Count Percent
Adolescent (≤ 19) 516 60.99 204 24.11 126 14.89 846 Twenties (20-29) 2,698 56.24 1,515 31.58 584 12.17 4,797 Thirties (30-39) 1,171 56.87 616 29.92 272 13.21 2,059 Forties & Over (≥ 40) 160 62.75 61 23.92 34 13.33 255 Total 4,545 2,396 1,016 7,957 Adolescents Adolescents, defined as females under twenty, accounted for 10.63% of terminations in Indiana in 2015. Females aged 18-19 were the most likely group of adolescents to receive terminations (71.16%) compared to those aged 15-17 (25.89%) and 10-14 (2.96%). This aligns with CDC’s 2012 analysis, which identified that 18-19 year olds accounted for 65.9% of adolescent terminations.1
0
100
200
300
400
500
600
700
12 14 16 18 20 22 24 26 28 30 32 34 36 38 40 42 44 46 48 50
Num
ber o
f Wom
en
Age (years)
Figure 2. Age distribution of women obtaining terminations in Indiana, 2012-2015
2012
2013
2014
2015

Page | 9
Race and Ethnicity The largest percentage of women reported their race as white, accounting for 57.12% of all records in 2015; 30.11% of women identified their race as black. In 2012, 60.30% and 28.2% of women identified as white and black, respectively; while in 2013, 58.45% and 28.79% identified as white and black, respectively. In 2014, 58.36% and 28.66% of women identified as white and black, respectively. Table 7. Race of women obtaining terminations in Indiana, 2015
Race Count Percent White 4,545 57.12 Black / African American 2,396 30.11 Asian 258 3.24 Pacific Islander / Native Hawaiian 7 0.09 American Indian / Alaska Native 29 0.36 Multiple Races 103 1.29 Other 619 7.78 Total 7,957 100.0 Women who marked more than one race checkbox on the report were classified under the multiple race category for this analysis. Some women who were classified as multiple race identified as combinations such as black and white, Asian and American Indian/Alaska Native (AI/AN), black and Asian, black and AI/AN, or white and Pacific Islander/Native Hawaiian (PI/NH). In 2015, 0.36% of women identified as AI/AN and 0.09% identified as PI/NH. In 2014, only 0.26% of women identified as AI/AN and 0.06% identified as PI/NH. In 2012 and 2013, about 0.7% of women identified as AI/AN while 0.12% identified as PI/NH. However, it is of note that women categorized as multiple race may have identified as AI/AN or PI/NH but were not classified as such because they also identified with at least one other race. Regarding ethnicity, 8.09% of women receiving a termination in Indiana self-identified as being either Hispanic or Latino in 2015 compared to 7.4% in 2014. In 2013, 7.37% of women reported as either Hispanic or Latino and 7.28% reported as such in 2012. The 2015 data illustrates an increase in the percentage of women receiving terminations that identify as Hispanic or Latino. However, 2015 is the only analyzed data year where there were no cases of unknown ethnicity reported; as such, it is possible that the lack of unknown responses has contributed to the increase in ethnicity identification. Table 8. Ethnicity of women obtaining terminations in Indiana, 2015
Ethnicity Count Percent Hispanic / Latino 644 8.09 Non-Hispanic / Non-Latino 7,313 91.91 Total 7,957 100.0 The number of women reported as Hispanic or Latino has increased, while the number reporting as neither Hispanic nor Latino has remained almost the same, and the number reporting as unknown has decreased. In 2015, no records were reported with unknown ethnicity. In 2012, 2013, and 2014, 682 (7.74%), 492 (6.02%), and 111 (1.37%) of women had an unknown ethnicity, respectively. The number of

Page | 10
women reporting as non-Hispanic/non-Latino has increased each year; however, this increase slowed in 2015. These changes can be seen in Figure 3.
Marital Status Of the women receiving terminations in 2015, 87.58% were unmarried and 12.39% were married. Similar to ethnicity reporting, the number of women whose marital status is unknown has continued to decrease since 2012. In both 2012 and 2013, 1.45% of women had an unknown marital status; however, that number decreased in 2014, with unknown marital status for only 0.39% of women. By 2015, the number of women with unknown marital status is a single digit, accounting for 0.03% of women. Table 9. Marital status of women obtaining terminations in Indiana, 2015
Marital Status Count Percent Married 986 12.39 Unmarried 6,969 87.58 Unknown 2 0.03 Total 7,957 100.0
7.28
84.98
7.74 7.37
86.61
6.02 7.4
91.23
1.37
8.09
91.91
0 0
10
20
30
40
50
60
70
80
90
100
Hispanic/Latino Not Hispanic/Latino Unknown
Perc
ent (
%) o
f Wom
en
Figure 3. Ethnicity of women obtaining terminations in Indiana, 2012-2015
2012
2013
2014
2015
Page | 11
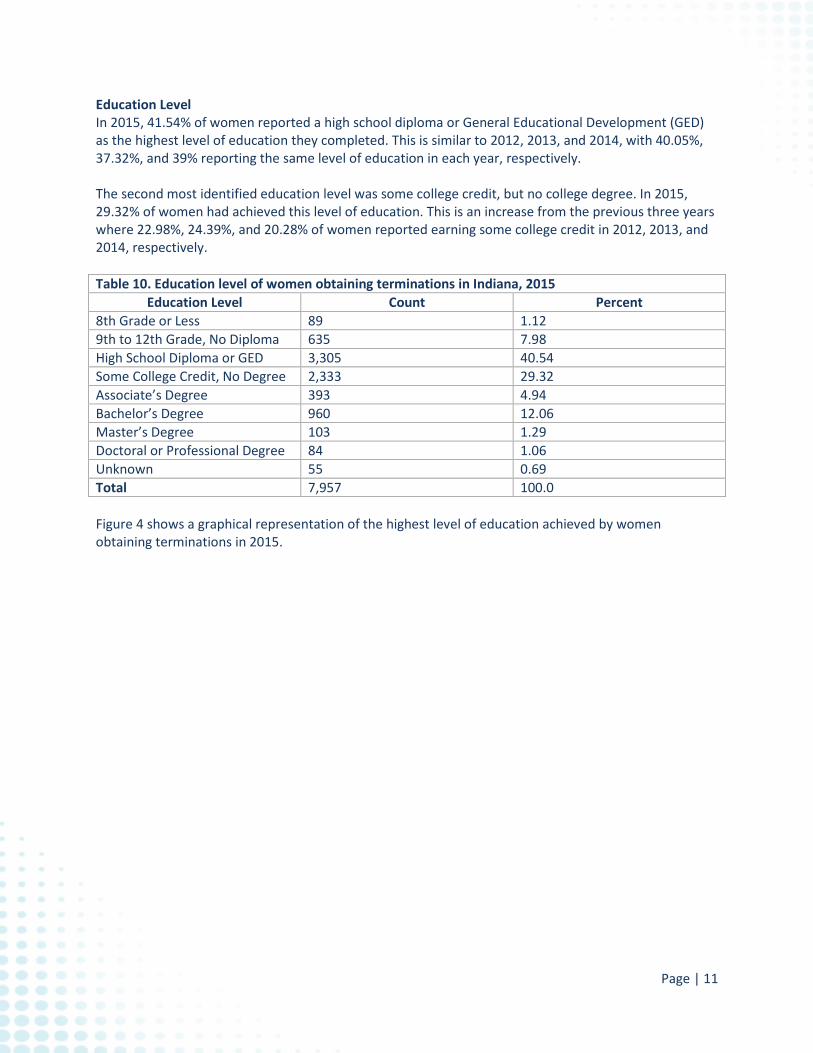
Education Level In 2015, 41.54% of women reported a high school diploma or General Educational Development (GED) as the highest level of education they completed. This is similar to 2012, 2013, and 2014, with 40.05%, 37.32%, and 39% reporting the same level of education in each year, respectively. The second most identified education level was some college credit, but no college degree. In 2015, 29.32% of women had achieved this level of education. This is an increase from the previous three years where 22.98%, 24.39%, and 20.28% of women reported earning some college credit in 2012, 2013, and 2014, respectively. Table 10. Education level of women obtaining terminations in Indiana, 2015
Education Level Count Percent 8th Grade or Less 89 1.12 9th to 12th Grade, No Diploma 635 7.98 High School Diploma or GED 3,305 40.54 Some College Credit, No Degree 2,333 29.32 Associate’s Degree 393 4.94 Bachelor’s Degree 960 12.06 Master’s Degree 103 1.29 Doctoral or Professional Degree 84 1.06 Unknown 55 0.69 Total 7,957 100.0 Figure 4 shows a graphical representation of the highest level of education achieved by women obtaining terminations in 2015.

Page | 12
When the education field was completed by writing the number of years of education, inference was made by ISDH personnel to identify what education category was most applicable. Table 11 shows the equivalence for years of education in education levels. Table 11. Equivalence of education years and education level
Years of Education Education Level ≤ 8 8th Grade or Less 9 – 11 9th to 12th Grade, No Diploma 12 High School Diploma or GED 13, 15 Some College Credit, No Degree 14 Associate’s Degree 16 – 17 Bachelor’s Degree 18 – 19 Master’s Degree ≥ 20 Doctoral or Professional Degree
1.12
7.98
41.54
29.32
4.94
12.06
1.29 1.06 0.69 0
5
10
15
20
25
30
35
40
45Pe
rcen
t (%
) of W
omen
Figure 4. Education level of women obtaining terminations in Indiana, 2015

Page | 13
Pregnancy History of Women Receiving Terminations The number of previous pregnancies was calculated by adding the values reported for previous live births living, previous live births deceased, previous spontaneous terminations, and previous induced terminations, when the values were reported. The number of previous live births was calculated by combining the reported values for previous live births living and previous live births deceased, when available. Table 12. Pregnancy history of women obtaining terminations in Indiana, 2015
Pregnancy History Count Percent Previous pregnancies 0 2,167 27.23 1 1,637 20.57 2 1,479 18.59 ≥ 3 2,674 33.61 Previous live births 0 2,943 36.99 1 2,067 25.98 2 1,693 21.28 ≥ 3 1,254 15.76 Previous spontaneous terminations
0 6,577 82.66 1 1,059 13.31 2 223 2.80 ≥ 3 98 1.23 Previous induced terminations 0 5,087 63.93 1 1,943 24.42 2 635 7.98 ≥ 3 292 3.67 As seen in Figure 5, white women have the greatest number of reported previous pregnancies, live births, spontaneous terminations, and induced terminations; however, spontaneous terminations were more common than live births or induced terminations. Among black women, induced terminations were more frequent than live births or spontaneous terminations; while all other race categories showed similar percentages between previous pregnancies and live births, and spontaneous and induced terminations, respectively.

Page | 14
Figure 6 further shows that women in their thirties (30–39) had the highest percentages for all parts of pregnancy history: previous pregnancies, previous live births, previous spontaneous terminations, and previous induced terminations. All age groups, except women aged forty or older, had greater numbers of pregnancies, live births, and induced terminations than spontaneous terminations. Women forty and over had a higher occurrence of spontaneous terminations than pregnancies, live births, or induced terminations, although the increased occurrence was minimal.
0
10
20
30
40
50
60
White Black Other
Perc
ent (
%) o
f Wom
en
Figure 5. Pregnancy history of women obtaining terminations in Indiana by Race, 2015
Previous Pregnancy Previous Live Birth
Previous Spontaneous Termination Previous Induced Termination

Page | 15
Medical Information of Women Receiving Terminations Medical information analyzed and presented in this report includes the procedure used to terminate a pregnancy, the facility type where the termination occurred, and the gestational age of the fetus at the time of termination. Procedure and Facility Type Four procedures were reported as having been used to terminate a pregnancy in 2015 in Indiana: Dilation and Evacuation (D&E), menstrual aspiration, Mifepristone/Misoprostol, and suction curettage. Although D&E is not a specific field to be selected on the reporting form, all procedures reported as medical (surgical) specified D&E as the procedure used for termination. Two reports in 2014 identified the procedure as medical (non-surgical); however, the report specified D&E. Based on the definition of D&E, these two reports were considered medical (surgical) procedures for reporting purposes and included in the data as D&E. Some reports from 2012 and 2013 listed the procedure used as medical (non-surgical) with Mifeprex and/or Misoprostol listed as the pharmaceuticals used. The reporting form includes a specific ‘Mifepristone/Misoprostol’ checkbox; as such, these reports were regarded as procedures completed with Mifepristone/Misoprostol due to the fact that Mifeprex® is a brand name for Mifepristone.
0
10
20
30
40
50
60
70
≤ 19 20-29 30-39 ≥ 40
Perc
ent (
%) o
f Wom
en
Patient's Age
Figure 6. Pregnancy history of women receiving terminations in Indiana by Age, 2015
Previous Pregnancy Previous Live Birth
Previous Spontaneous Termination Previous Induced Termination

Page | 16
All other occasions when medical (non-surgical) was identified as the primary procedure, specific details were not provided on the report, thus leading to the reporting of unspecified medical non-surgical procedures. The administration of the pharmaceuticals Mifepristone and/or Misoprostol was the second most commonly used technique to terminate a pregnancy in 2015, accounting for 27.93% of terminations. This is an increase in the use of the drug combination from the last three years, where its use has increased from 1.82% in 2012 to 26.67% in 2014. Suction curettage was the most commonly employed technique for pregnancy termination in 2015, accounting for 71.8% of terminations. The use of this procedure has declined since 2012, when it was reported for 79.6% of terminations. The majority of suction curettage procedures were performed at abortion clinics (99.89%). Table 13. Procedure used to terminate pregnancy in Indiana, 2013–2015
Procedure 2015 2014 2013 Count Percent Count Percent Count Percent
Dilation & Evacuation 19 0.24 27 0.33 23 0.28 Mifepristone / Misoprostol 2,222 27.93 2,165 26.67 1,631 19.94 Suction Curettage 5,713 71.80 5,926 73.00 6,519 79.70 Medical (Non-Surgical) 0 0.00 0 0.00 1 0.01 Menstrual Aspiration 3 0.04 0 0.00 3 0.04 Unknown 0 0.00 0 0.00 2 0.02 Total 7,957 8,118 8,179 Rarely, a secondary procedure was identified on a record as necessary for the completion of termination. However, due to the rarity, these values are not reported and the report is associated with the primary procedure that was identified on the record. If only a secondary procedure was reported, that procedure was considered the primary procedure. There were also a handful of records that were submitted as terminations; however, receipt of a new record informed ISDH that the original procedure had been unsuccessful and a new procedure was conducted to complete the termination. In these cases, the initial record has been removed from the dataset as a termination was not completed in association with the record, and the new record was maintained to account for a completed termination. As of January 1, 2015, nine abortion clinics were licensed in Indiana and 124 licensed acute care hospitals. Of the 7,957 procedures performed in the state, 99.66% were performed at abortion clinics and 0.34% at acute care hospitals. Table 14 provides a breakdown of the number of terminations performed by each reporting facility in 2015. Although licensed at the beginning of the year, two facilities did not report terminations in 2015, and Women’s Pavilion closed November 6, 2015.

Page | 17
Table 14. Terminations reported in Indiana by Facility, 2015
Facility Type Facility Name Facility Address Count Percent
Abortion Clinic
Clinic for Women 3607 W. 16th St. Indianapolis
784 9.85
Indianapolis Women’s Center 1201 N. Arlington Ave. Indianapolis
1,334 16.77
Planned Parenthood of Indiana and Kentucky– Indianapolis
8590 Georgetown Rd. Indianapolis
2,879 36.18
Planned Parenthood of Indiana and Kentucky – Bloomington
421 S. College Ave. Bloomington
822 10.33
Planned Parenthood of Indiana and Kentucky – Lafayette
964 Mezzanine Dr. Lafayette
259 3.25
Planned Parenthood of Indiana and Kentucky – Merrillville
8645 Connecticut St. Merrillville
1,274 16.01
Women’s Pavilion 2010 Ironwood Cir. South Bend
578 7.26
Acute Care Hospital
Indiana University Health University Hospital
550 University Blvd. Indianapolis
5 0.06
Sidney & Lois Eskenazi Hospital 720 Eskenazi Ave. Indianapolis
20 0.25
Indiana University Health North Hospital
11700 N. Meridian St. Carmel
2 0.03
Total 7,957 100.0 Terminations at abortion clinics accounted for 99.66% of procedures, as well as 100% of terminations using Mifepristone and/or Misoprostol, and 99.89% of terminations employing suction curettage. All surgical terminations (D&E) were performed at acute care hospitals. Menstrual aspiration was performed at both abortion clinics (33.33%) and acute care hospitals (66.67%) in 2015. Table 15. Procedure used to terminate pregnancy in Indiana by Facility type, 2015
Procedure Facility Type
Total Abortion Clinic Acute Care Hospital Count Percent Count Percent
Dilation & Evacuation 0 0.00 19 100.0 19 Menstrual Aspiration 1 33.33 2 66.67 3 Mifepristone/Misoprostol 2,222 100.0 0 0.00 2,222 Suction Curettage 5,707 99.89 6 0.11 5,713 Total 7,930 27 7,957 Suction curettage and menstrual aspiration procedures were performed at both facility types. All D&E procedures were performed at acute care hospitals, while all administration of Mifepristone and/or Misoprostol was done by abortion clinics. No terminations were reported from ambulatory surgical centers, other clinics, or physician offices.

Page | 18
Estimated Gestational Age The gestational age range was 1 to 19 weeks, with an average gestational age of 6.5 weeks (SD= 2.15 weeks) and a median gestational age of 6 weeks. In Indiana, 80.21% of terminations occurred prior to the ninth week of pregnancy, 19.57% occurred during the 9-13 week timeframe, and those more than 13 weeks accounted for less than one percent of terminations in 2015. Data from 2012 through 2014 show a similar trend, with 77.99% (2012), 75.41% (2013), and 78.82% (2014) of terminations occurring prior to week nine. Table 16. Estimated gestational age at time of termination in Indiana, 2015
Weeks of Gestation Count Percent ≤ 8 6,382 80.21 9-13 1,557 19.57 14-15 6 0.08 16-17 4 0.05 18-20 8 0.10 Total 7,957 100.0 During 2015, gestational age of five weeks was reported most frequently by physicians at 22.07%, while six weeks was reported for 20.89% of terminations; this reflects a shift in gestational age at termination. In 2014, there was a secondary peak at gestational age of five weeks, with the most frequently reported age at six weeks, which followed the trend from 2012 and 2013.

Page | 19
* Indicates percentage of terminations where the gestation age in weeks was not provided on the report. Indiana Code dictates that the gestation of the fetus is determined by the physician’s determination of postfertilization age; as such, estimated gestational age, in weeks, is based on this value. When postfertilization age is not reported, estimated gestational age was used to approximate the gestational age. Where neither was reported, the gestational age was unknown. There were no occurrences where the gestational age was unknown in 2013, 2014, or 2015; however, 0.03% of terminations in 2012 were of unknown gestational age. Of the terminations that were completed at more than thirteen weeks gestation, 94.44% were D&E. Suction curettage accounted for 71.95% of terminations thirteen weeks or less; 27.99% of procedures at thirteen weeks or less were completed with the pharmaceuticals Mifepristone and/or Misoprostol. All menstrual aspirations were performed at less than eight weeks.
0
5
10
15
20
25
0 1 2 3 4 5 6 7 8 9 10 11 12 13 14 15 16 17 18 19 20 99*
Perc
ent (
%) o
f Ter
min
atin
os
Gestational Age (weeks)
Figure 7. Estimated gestational age at time of termination in Indiana, 2012-2015
2012
2013
2014
2015

Page | 20
Table 17. Estimated gestational age among women obtaining terminations in Indiana by Procedure, 2015
Weeks of Gestation
Procedure
Total Dilation & Evacuation
Menstrual Aspiration
Mifepristone / Misoprostol
Suction Curettage
Count Percent Count Percent Count Percent Count Percent ≤ 8 0 0.00 3 0.05 2,210 34.63 4,169 65.32 6,382 9-13 2 0.13 0 0.00 12 0.77 1,543 99.10 1,557 14-15 6 100.0 0 0.00 0 0.00 0 0.00 6 16-17 4 100.0 0 0.00 0 0.00 0 0.00 4 18-20 7 87.50 0 0.00 0 0.00 1 12.50 8 Total 19 3 2,222 5,713 7,957 Geographic Information of Women Receiving Terminations Geographic information provided on terminated pregnancy reports consists of the county where the termination was performed and the state and county of the woman’s residence. While county of termination must be indicated on all reports, county of residence is not always provided. County of Termination In 2015, reported terminations were performed in six counties: Hamilton, Lake, Marion, Monroe, St. Joseph, and Tippecanoe. Of these, Marion County had the most, accounting for 63.10% of terminations; Hamilton County had the fewest, accounting for only 0.03% of terminations. Table 18. County where termination performed in Indiana, 2015
County of Termination Count Percent Hamilton 2 0.03 Lake 1,275 16.02 Marion 5,021 63.10 Monroe 822 10.33 St. Joseph 578 7.26 Tippecanoe 259 3.25 Total 7,957 100.0 Marion County continues to see the most terminations, with 61.51% in 2012, 63.08% in 2013, and 64.24% in 2014. In 2012 and 2013, terminations were also reported in Allen County, 2.99% and 4.32%, respectively.
Page | 21
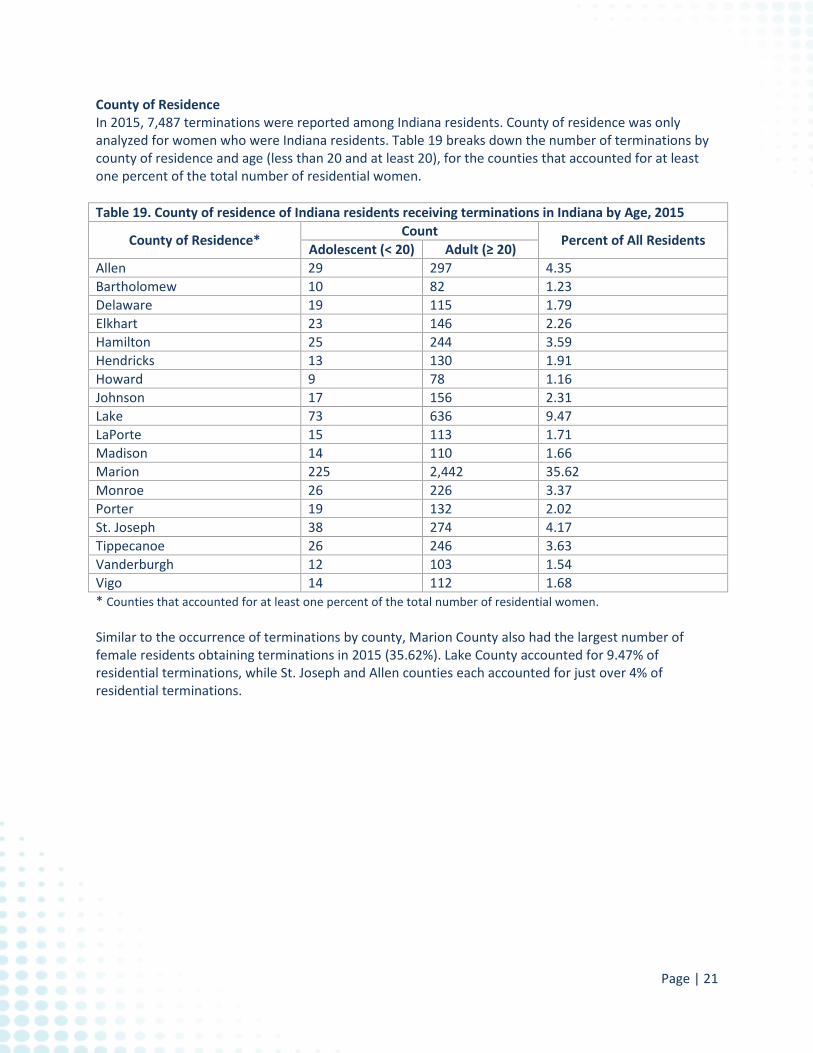
County of Residence In 2015, 7,487 terminations were reported among Indiana residents. County of residence was only analyzed for women who were Indiana residents. Table 19 breaks down the number of terminations by county of residence and age (less than 20 and at least 20), for the counties that accounted for at least one percent of the total number of residential women. Table 19. County of residence of Indiana residents receiving terminations in Indiana by Age, 2015
County of Residence* Count Percent of All Residents Adolescent (< 20) Adult (≥ 20) Allen 29 297 4.35 Bartholomew 10 82 1.23 Delaware 19 115 1.79 Elkhart 23 146 2.26 Hamilton 25 244 3.59 Hendricks 13 130 1.91 Howard 9 78 1.16 Johnson 17 156 2.31 Lake 73 636 9.47 LaPorte 15 113 1.71 Madison 14 110 1.66 Marion 225 2,442 35.62 Monroe 26 226 3.37 Porter 19 132 2.02 St. Joseph 38 274 4.17 Tippecanoe 26 246 3.63 Vanderburgh 12 103 1.54 Vigo 14 112 1.68 * Counties that accounted for at least one percent of the total number of residential women. Similar to the occurrence of terminations by county, Marion County also had the largest number of female residents obtaining terminations in 2015 (35.62%). Lake County accounted for 9.47% of residential terminations, while St. Joseph and Allen counties each accounted for just over 4% of residential terminations.

Page | 22
Table 20 provides a breakdown of the number of residents from each Indiana county that received terminations in 2015. Table 20. Number of Indiana residents receiving terminations in Indiana by County, 2015
County of Residence Count County of Residence Count County of Residence Count Adams 15 Hendricks 143 Pike 6 Allen 326 Henry 33 Porter 151 Bartholomew 92 Howard 87 Posey 5 Benton 7 Huntington 18 Pulaski 6 Blackford 4 Jackson 16 Putnam 23 Boone 49 Jasper 27 Randolph 23 Brown 10 Jay 11 Ripley 4 Carroll 4 Jefferson 25 Rush 3 Cass 28 Jennings 11 St. Joseph 312 Clark 28 Johnson 173 Scott 16 Clay 21 Knox 23 Shelby 36 Clinton 22 Kosciusko 41 Spencer 8 Crawford 3 LaGrange 7 Starke 15 Daviess 9 Lake 709 Steuben 8 Dearborn 7 LaPorte 128 Sullivan 9 Decatur 14 Lawrence 49 Tippecanoe 272 DeKalb 18 Madison 124 Tipton 9 Delaware 134 Marion 2,667 Union 2 Dubois 17 Marshall 35 Vanderburgh 115 Elkhart 169 Martin 8 Vermillion 8 Fayette 9 Miami 24 Vigo 126 Floyd 15 Monroe 252 Wabash 20 Fountain 7 Montgomery 25 Warren 4 Franklin 10 Morgan 64 Warrick 20 Fulton 3 Newton 14 Washington 14 Gibson 10 Noble 18 Wayne 38 Grant 50 Ohio 1 Wells 10 Greene 12 Orange 14 White 18 Hamilton 269 Owen 14 Whitley 17 Hancock 43 Parke 8 Unknown 3 Harrison 7 Perry 4 Total 7,487

Page | 23
Discussion This report has started to identify consistencies among women receiving pregnancy terminations in Indiana by exploring new data from 2015 in conjunction with retrospective data from 2012 to 2014; however, retrospective data is not comparable to previously published reports. All demographic and pregnancy history information was self-reported by the woman obtaining a termination, while medical information was provided by the performing physician. The largest portion of pregnancy terminations are reported among women in their twenties (60.29%). Women were also more likely to identify as white (57.12%), not Hispanic or Latino (91.91%), and unmarried (87.58%). The most frequently reported education levels were completion of a high school diploma or GED (40.54%) or some college credit, but no degree (29.32%). Women in their thirties (30–39) were identified as having the highest numbers of previous pregnancies, previous live births, previous spontaneous terminations, and previous induced terminations, when compared to all other age groups. Regardless of age group, 82.66% of women reported no previous spontaneous terminations and 63.93% of women reported no previous induced terminations. In 2015, there were also no records without an identified procedure. The use of Mifepristone and/or Misoprostol continues to increase each year, while the use of suction curettage has decreased over the same time period. The majority of terminations in 2015 were performed in licensed abortion clinics (99.66%); and terminations with reported gestational age less than nine weeks accounted for 80.21% of reports. Marion County was reported as the most common county of termination (63.10%) as well as the most common county of residence (35.62%), for Indiana residents. Lake County was identified as second most common county for terminations and residency, accounting for 16.02% of all terminations and 9.47% of Indiana residents. This report has some key limitations. Due to the fact that demographic and pregnancy history are reported by the women receiving terminations, the information is subject to bias. There is also the possibility that women who required a second procedure to complete the termination were reported as a new record, or they attended a different facility to complete the procedure; each of these scenarios would lead to an increase in the number of terminations reported to ISDH. A third scenario may increase the number of reported terminations if the woman had an incomplete procedure but chose not to return for follow-up, instead choosing to have the child, because the reported termination would have been incomplete. As this is only the second report for Indiana in this format, there is a limitation to what can be analyzed, particularly in terms of trending data. Finally, all data is obtained from reported terminated pregnancies; as such, there is the possibility for terminations to occur of which ISDH is not informed and cannot be included in this report.

Page | 24
Appendix A: State Form 36526 (R4 / 12-11)
Page | 25
Appendix B: State Form 36526 (R3 / 6-11)
Page | 26
Appendix C: Electronic Terminated Pregnancy Database

Page | 27
Appendix D: Glossary Childbearing years: The reproductive age span of women, assumed for statistical purposes to be 15–44 or 15–49 years of age.10 Dilation & Evacuation (D&E): Dilation & evacuation is a surgical abortion that is typically performed midway during the second trimester of pregnancy and in which the uterine cervix is dilated and fetal tissue is removed using surgical instruments (as a forceps and curette) and suction. It is also referred to as D&E.5 Induced abortion: An intentional termination of pregnancy before the fetus has developed enough to live if born. From 20% to 50% of pregnancies are terminated deliberately at the request of the mother or for medical indications, during the first trimester by vacuum aspiration and/or curettage or during the second trimester by dilation and evacuation, induction of labor, or hysterotomy.11 This report references induced terminations regarding pregnancy history. Terminated pregnancy or abortion: “Abortion” means the termination of human pregnancy with an intention other than to produce a live birth or to remove a dead fetus. The term includes abortions by surgical procedures and by abortion inducing drugs (IC § 16-18-2-1).3 Mifepristone (RU-486): RU-486, also known as Mifepristone, is a drug taken orally to induce abortion, especially early in pregnancy, by blocking the body’s use of progesterone. The chemical formula for Mifepristone is C29H35NO2.6 Mifepristone may also be identified by the proprietary names Korlym® and Mifeprex®.8 Misoprostol: Misoprostol is a synthetic prostaglandin analog used to induce abortion in conjunction with RU-486 and to prevent stomach ulcers associated with nonsteroidal anti-inflammatory drug (NSAID) use. The chemical formula for Misoprostol is C22H38O5.7 Pregnancy history: Pregnancy history is a calculated variable that is the sum of the number of previous live births, the number of previous spontaneous terminations, and the number of previous induced terminations. Previous live births: The number of previous live births is a calculated variable that is the sum of the number of previous live births living and previous live births deceased. Rate: The number of terminations per 1000 women aged 15–44 years estimated as living in Indiana. Terminations where age was unknown were excluded from the numerator. Spontaneous abortion or miscarriage: A termination of pregnancy before the twentieth week of gestation as a result of abnormalities of the conceptus or maternal environment. Up to 30% of pregnancies may end as spontaneous abortions, many caused by blighted ova that have congenital defects incompatible with life.11 This report references spontaneous terminations regarding pregnancy history.

Page | 28
References 1. Extracted from Centers for Disease Control and Prevention. Abortion Surveillance – United States, 2012. MMWR 2015; 64(SS10):1-40. Digital version available at http://www.cdc.gov/mmwr/preview/mmwrhtml/ss6410a1.htm?s_cid=ss6410a1_e#tab1 2. Revisions to the Standards for the Classification of Federal Data on Race and Ethnicity: Federal Register Notice. Retrieved from http://www.whitehouse.gov/omb/fedreg_1997standards/ 3. Indiana Code. Retrieved from http://iga.in.gov/legislative/laws/2015/ic/ 4. Annual Estimates of the Resident Population for Selected Age Groups by Sex for the United States, States, Counties, and Puerto Rico Commonwealth and Municipios: April 1, 2010 to July 1, 2014: 2014 Indiana Population Estimates. U.S. Census American FactFinder. Retrieved from http://factfinder.census.gov/faces/tableservices/jsf/pages/productview.xhtml?src=bkmk 5. Merriam-Webster Medline Plus Medical Dictionary. Dilation and Evacuation. Retrieved from http://www.merriam-webster.com/medlineplus/dilation%20and%20evacuation 6. Merriam-Webster Medline Plus Medical Dictionary. RU-486. Retrieved from http://www.merriam-webster.com/medlineplus/ru-486 7. Merriam-Webster Medline Plus Medical Dictionary. Misoprostol. Retrieved from http://www.merriam-webster.com/medlineplus/misoprostol 8. U.S. Food and Drug Administration Orange Book: Approved Drug Products and Therapeutic Equivalence Evaluations. Active ingredient: mifepristone. Retrieved from http://www.accessdata.fda.gov/scripts/cder/ob/docs/tempai.cfm 9. CDC Division of Reproductive Health Inquiry. Inquiry submitted 15 Apr 2015. Response received 29 Apr 2015. 10. Glossary of Demographic Terms. Population Reference Bureau. Retrieved from http://www.prb.org/Publications/Lesson-Plans/Glossary.aspx 11. Mosby’s Medical Dictionary: 9th Edition. 2013. Induced abortion, Spontaneous abortion.