Embed Size (px)
Citation preview

This article was originally published in a journal published byElsevier, and the attached copy is provided by Elsevier for the
author’s benefit and for the benefit of the author’s institution, fornon-commercial research and educational use including without
limitation use in instruction at your institution, sending it to specificcolleagues that you know, and providing a copy to your institution’s
administrator.
All other uses, reproduction and distribution, including withoutlimitation commercial reprints, selling or licensing copies or access,
or posting on open internet sites, your personal or institution’swebsite or repository, are prohibited. For exceptions, permission
may be sought for such use through Elsevier’s permissions site at:
http://www.elsevier.com/locate/permissionusematerial

Autho
r's
pers
onal
co
py
Terrestrial vertebrate fauna surveys for the preparation ofenvironmental impact assessments; how can we do it
better? A Western Australian example
Graham G. Thompson
Centre for Ecosystem Management, Edith Cowan University, Joondalup Dr., Joondalup,Western Australia 6010, Australia
Received 1 June 2006; received in revised form 14 August 2006; accepted 14 August 2006Available online 26 September 2006
Abstract
The Western Australian Environmental Protection Authority (EPA) in 2002 released Position Statement,No. 3, Terrestrial Biological Surveys as an Element of Biodiversity Protection outlining how terrestrialfauna survey data are to be used and interpreted in the preparation of environmental impact assessments(EIA). In 2004, the EPA released its Guidance for the Assessment of Environmental Factors, TerrestrialFauna Surveys for Environmental Impact Assessment in Western Australia, No. 56. This paper brieflyassesses the adequacy of recent terrestrial fauna surveys undertaken to support publicly released EIAs andindicates that the EPA is not always adhering to its own position and guidance statements. This paperargues that the current fauna survey guidelines are in need of improvement. The approach and requirementsof some other Australian states are briefly assessed to identify similarities and where improvements can bemade to the Western Australian (WA) guidelines. This paper concludes with suggestions on how theprocess and the guidelines in WA can be revised to more adequately assess the impact of developments onterrestrial vertebrate biodiversity and ecosystem function. These suggestions may have relevance for otherareas where fauna surveys are undertaken to support EIAs.© 2006 Elsevier Inc. All rights reserved.
Keywords: Terrestrial vertebrate fauna; Surveys; Environmental impact assessment; EIA; Environmental protectionauthority; Western Australia
Environmental Impact Assessment Review 27 (2007) 41–61www.elsevier.com/locate/eiar
E-mail address: [email protected].
0195-9255/$ - see front matter © 2006 Elsevier Inc. All rights reserved.doi:10.1016/j.eiar.2006.08.001
Autho
r's
pers
onal
co
py
1. Introduction
In 2000, the EPA (Environmental Protection Authority, 2000) released Preliminary PositionStatement No. 3, General Requirements for Terrestrial Biological Surveys for EnvironmentalImpact Assessment in Western Australia seeking public comment on the statement beforereleasing its formal position on terrestrial fauna surveys. In this document the EPA indicated thedifficulty it had in assessing impacts on biodiversity values because of poor quality terrestrialvertebrate fauna surveys. The EPA suggested that the lack of appropriate baseline data did notallow for a proper assessment, data were not being interpreted for biodiversity value and there wasa lack of survey standards. The EPAwent on to indicate that it had accepted substandard work andhad received inconsistent and changing advice from the Department of Environment andConservation (DEC) and other government agencies (pp. 6–7).
Having considered the public comments on the Preliminary Position Statement, the EPAissued Position Statement No. 3, Terrestrial Biological Surveys as an Element of BiodiversityProtection (EPA, 2002). In its overarching principles, the EPA indicated that it expectedproponents to ensure that terrestrial biological surveys provided sufficient information to addressboth biodiversity conservation and ecological function values (pp. 5). Terrestrial fauna surveyswere expected to meet standards and requirements as published by the EPA. The EPA explainedthat it used a two level assessment system (Levels 1 and 2) based on Western Australia's (WA) 26bioregions as defined in the Interim Biogeographic Regionalisation of Australia (IBRA), and thepotential scale and nature of the impact to determine the extent of investigation and fauna surveywork to be undertaken. A Level 1 assessment includes a desktop study (i.e. literature review) anda reconnaissance visit to the site to verify the desktop study. A Level 2 survey includes a desktopstudy and a comprehensive fauna survey. The EPA indicated that it would subsequently publishguidelines on how terrestrial fauna surveys should be undertaken. The Position Statementindicated that the EPA required that fauna survey data should be used to assess the impact of adevelopment on biodiversity at the genetic, species and ecosystem level, and the functional valueat the ecosystem level.
Fraser et al. (2003) reported on the extent and quality of 15 terrestrial fauna surveys that werecontained in Consultative Environmental Review level assessments that had been approved for adisturbance in areas not previously mined or where mining had been minimal in the CoolgardieIBRA. As part of this project, an expert panel was established to determine ‘best practice’ againstwhich the adequacy of the terrestrial fauna surveys could be assessed, as there were no publishedstandards for terrestrial fauna surveys at that time. It was evident from the examination by Fraseret al. (2003) that many of these reports were deficient and that the terrestrial fauna trapping effortundertaken by many of the consultants fell short of the minimum standards of best practice asdescribed by the expert panel. This information confirmed the EPA view that it had beenaccepting substandard terrestrial fauna surveys and the reporting of this information.
In February 2003, the EPA (Environmental Protection Authority, 2003) released TerrestrialFauna Surveys for Environmental Impact Assessment in Western Australia, No. 56 Draft forpublic comment. After reviewing submissions, in June 2004 the EPA released Guidance for theAssessment of Environmental Factors, Terrestrial Fauna Surveys for Environmental ImpactAssessment in Western Australia, No. 56. The EPA claimed this document provided guidance,among other things, on approaches and standards, when surveys should be undertaken, the extentand level of survey effort, survey sampling design and intensity, and reporting requirements.Guidance Statement No. 56 added to the Level 2 assessment the need for either a ‘detailed’ or‘comprehensive’ survey (pp. 32) but did not explain the difference. Detailed information was
42 G.G. Thompson / Environmental Impact Assessment Review 27 (2007) 41–61
Autho
r's
pers
onal
co
py
provided on whether a Level 1 or 2 assessment was required based on factors such as the size andscale of the impacted area, whether the area or surrounds were likely to support native fauna,rarity of vegetation or fauna, whether the area served as an ecological refuge for fauna species(e.g. remnant populations, disjunct populations, restricted distributions), whether the areacontained protected fauna, whether the area had ecological significance and whether the area wasa complex habitat with a diverse faunal assemblage.
To support an argument for improvements, the adequacy of some recently published terrestrialfauna surveys (but not stygofauna) used to support recently released EIA reports approved by theEPA are assessed. This is followed by a comment on the adequacy of Guidance Statement No. 56.A brief assessment of the fauna survey guidelines issued by various other governmentconservation agencies is then provided as a context for suggested improvements to the WAapproach. This is followed by a discussion of the general issues and recommendations on howWA can improve terrestrial fauna surveys and their reporting. These recommendations may berelevant for other areas where fauna surveys are undertaken.
2. Adequacy of level 2 terrestrial fauna surveys
Only projects approved by the EPA for release in 2004 and 2005 for public comment and thatrequired a Level 2 assessment according to the criteria contained in Table 3 of GuidanceStatement No. 56 are evaluated. The adequacy of these fauna surveys and reporting of these dataare based on criteria contained in Position Statement No. 3 and Guidance Statement No. 56. Foreach of the criterion, each report has been assessed using a five point rating system. Appendix Adescribes each criterion, indicates its rationale and the basis for the subjective judgements thatallocated a rating of 1 to 5 for each report for each of these criterion.
Table 1 provides a summary of the assessment of seven reports. It is appreciated that becausethe rating system is subjective, different reviewers might score the reports slightly higher orlower; however, an effort has been made to consistently apply the criteria to all reports. The areasin which most reports failed to meet the required standard include the survey effort,characterisation of the faunal assemblages and ecosystems for each habitat type and a discussionof ecosystem functional values. Other areas not well addressed included not accounting forseasonal and temporal variations and not utilising a range of trap‐types. Overall, all surveys fellshort of the requirements outlined in the EPA Position Statement No. 3 and Guidance StatementNo. 56, and there was considerable scope for improvement.
3. Guidance Statement No. 56
Guidance Statement No. 56 was prepared to provide the necessary guidance to proponents of adevelopment and their environmental consultants undertaking fauna surveys and preparing EIAsso that they complied with the intent of Position Statement No. 3. Although the introduction to theGuidance Statement claimed that it provided direction and information on general standards andprotocols for terrestrial fauna surveys to environmental consultants and proponents engaged inEIA activities (p. 1), ‘it does not provide prescriptive guidelines for survey methodology’ (p. 6)which is a deficiency. Readers could reasonably expect to find in a guidance statement, advice onhow to undertake terrestrial fauna surveys, and specific information on the standards andprotocols recommended (or required) by the EPA.
Guidance Statement No. 56 lists a number of factors (p. 12–13) that might influence surveysampling design and intensity, but fails to explain how the design and intensity of surveys should
43G.G. Thompson / Environmental Impact Assessment Review 27 (2007) 41–61

Autho
r's
pers
onal
co
py
be adjusted to account for these factors. Guidance Statement No. 56 cites a number of referencesthat readers might consult when designing and planning a fauna survey. Two of these referencesare for publications in 1984, and a considerable amount has been written on this topic since then.The two more recent references are to Burbidge et al. (2000a,b), who reported on the researchprotocols employed for the Carnarvon Basin fauna survey. The fauna survey protocol used in theCarnarvon Basin terrestrial fauna survey is not appropriate for site surveys (i.e. inadequatetrapping effort in each habitat and failure to employ a wide range of traps) and should not be usedas a model when undertaking terrestrial fauna surveys for the purposes of preparing an EIA for adisturbed site. Furthermore, no adequate explanation of trapping effort or intensity is provided noris there an indication of when surveys should be repeated to account for temporal variations.
Trap type is an important component of any terrestrial fauna survey; however, GuidanceStatement No. 56 provides little advice on this issue. Funnel traps, PVC 20 L buckets, PVC stormwater piping as pit‐traps, Elliott traps, wire cage traps, cover boards, hand‐foraging, nightspotlighting, hair traps and scat analysis all sample the small vertebrate assemblage differently(Bauer and Sadler, 1992; Bury and Corn, 1987; Catling et al., 1997; Enge, 1997a; Fitch, 1992a,b;Greenberg et al., 1994; Jacob et al., 2002; Lobert et al., 2001; Thompson et al., 2005a,b). Detailedinformation should have been provided on the bias associated with each trap type and searchstrategy; and guidance provided on the appropriate mix of traps and search strategies to beemployed in terrestrial fauna surveys.
Guidance Statement No. 56 points out that ‘in many cases the timing of the fauna and faunalassemblage survey will be critical …..’ (p. 11) and goes on to indicate ‘a survey in the season thatfollows the season of maximum rainfall is generally the most productive and important surveytime’ (p. 12). I know of only three Australian published datasets that have been systematicallycollected and allow comparison of fauna collected in the various seasons. How (1998) reported ona reptile and frog fauna survey in a remnant urban bushland (Bold Park) in the Perth metropolitanarea on the coastal dunes. Pit‐trapping was undertaken between December 1986 and June 1993 onmultiple occasions each year between September and the following June (398 days and 2388 pit‐trap days). Trapping rates were highest in November (4.35 individuals/10 pit‐days) and December(5.03 individuals/10 pit‐days). Peak periods of rainfall for Perth most often come in June and July(www.bom.gov.au/climate/averages/tables/text/cw_009034.csv), which would indicate thatspring was the best survey period at Bold Park based on the EPA Guidelines. However, catchrates in September (1.36 individuals/10 pit‐days) and October (1.32 individuals/10 pit‐days) wereonly better than May and June which is mid‐winter and were appreciably lower than Novemberand December. Thompson and Thompson (2005) surveyed 10 habitat types in the easternGoldfields of WA on 10 occasions over a two year period (twice in June, Sept. Dec. Jan. andApril) using an identical survey protocol. Peak rainfall periods for the eastern Goldfields areFebruary, and May–July (http://www.bom.gov.au/climate/averages/tables/text/cw_012038.csv).Summer rain comes from two sources; a) decaying cyclones that penetrate inland occasionallybring heavy late summer rain, and b) local thunderstorms which are more consistent. Summer rainis unpredictable but can occasionally be heavy (greater than 100 mm per event) which elevates themonthly average. Fig. 1 demonstrates this variability in heavy daily rainfall for Paddington minesite at Ora Banda. Almost all of the daily rainfall that is in excess of 30 mm occurred in summer.Winter rains are more predictable. Very heavy rainfall was experienced in February 2000 prior tothe first 12 months of surveys but rainfall was more normal proceeding the second 12 months ofsurveys (Fig. 1). Thompson and Thompson's (2005) data indicated that January followed byDecember were the best periods to trap both the highest number of individual and species ofreptiles for all sites in both years. For small mammals, catch rates were highly variable but
44 G.G. Thompson / Environmental Impact Assessment Review 27 (2007) 41–61

Autho
r's
pers
onal
co
py
generally lower in the cooler months. Based on this rainfall pattern, autumn or possibly springwould be when the EPA suggest is the best time to undertake terrestrial fauna surveys in theGoldfields, which is clearly not the case.
Rainfall is highest in the Pilbara region of WA in summer (e.g. the heaviest rainfall for MarbleBar and Newman is in January, February and March; http://www.bom.gov.au/climate/averages/tables/ca_wa_names.shtml) and adherence to the EPA guidelines in this circumstance wouldrequire terrestrial fauna surveys be carried out in autumn. How and Cooper (2002) and How andDell (2004) report on a small vertebrate fauna survey in the Pilbara conducted over nine samplingperiods (March 1988 to November 1990) in eight different habitat types. Mammal capture rateswere variable and showed no obvious seasonal pattern (How and Cooper, 2002). The highestnumber of reptiles were trapped in summer (How and Dell, 2004), indicating the guidelines forthis region of WA are inappropriate. Rainfall data provided by How and Dell (2004) indicated thatheavy rain fell in March of 1988 and again in February of 1989. The authors commented on thisabove average rainfall during the first two summers of survey and that this had followed a longdrought. They suggested that many of the reptile species in the Pilbara reproduceopportunistically following improved environmental conditions after episodic rainfall events.These potential increases in reptile abundance are likely to manifest themselves many monthslater given the time it takes for the environment to respond and the reproductive processes to taketheir course. In contrast, fauna assemblages in the Pilbara respond negatively to fires, at least inthe short term, although, in the longer term fires are probably a major contributor to habitatdiversity and high species richness.
Rainfall in the wet–dry tropics (e.g. Kununurra) is heaviest in January and February (http://www.bom.gov.au/climate/averages/tables/cw_002038.shtml) and the EPA guidelines wouldsuggest that the best time to survey is at the end of the wet season. Many reptiles, frogs andsmall mammals are most active at the beginning of the wet season, particularly those species thathave been inactive during the ‘dry’ season, and are therefore best trapped during this period.These data suggest that the EPA guidelines for when terrestrial fauna surveys should be carriedout in most areas of WA are inappropriate.
Activity patterns for some reptile species are influenced by rainfall events (e.g. pythons),however, the general pattern is that reptiles are most active and mostly easily trapped in the hotterparts of the year, whereas mammals are more variable and activity extends over a much widerrange of daily temperatures for mesic, arid and semi‐arid areas of Australia. The pattern isdifferent in the wet–dry tropics with many species becoming less active and more difficult to trapduring the dry season. Commencement of the wet season seems to stimulate both small mammaland reptile activity, and is therefore a more productive trapping period. Other less systematicsurvey methods such as spotlighting, hand searches, sand plots to detect tracks, hair‐traps and
Fig. 1. Rainfall measured on a daily cycle at Paddington gold mine, near Ora Banda.
45G.G. Thompson / Environmental Impact Assessment Review 27 (2007) 41–61

Autho
r's
pers
onal
co
py
collecting scats are sometimes used by environmental consultants to increase species richnessrecords, but generally provide a poor understanding of relative abundance. No systematicevaluations of the most suitable period for employing these alternative fauna assessmentstrategies are available in the literature. However, many reptile species become inactive during thecooler months in mesic and arid zones and during the dry in the wet–dry tropics and are unlikelyto be detected by most of these less‐systematic search strategies. The relative abundance ofreptiles and mammals may be significantly influenced by environmental variables such as firesand episodic rainfall events, and these variables should be taken into account when planningfauna surveys. The optimum survey period will therefore vary from region‐to‐region and may beinfluenced by seasonal rainfall and daily weather conditions.
The EPA Position Statement No. 3 (2002) makes it clear that terrestrial fauna survey datashould be used to assess biodiversity value at the genetic, species and ecosystem levels, andecological functional value at the ecosystem level. However, Guidance Statement No. 56 makesno reference to how terrestrial fauna survey data should be analysed or interpreted to assess theimpact of the proposed disturbance on these aspects of biodiversity. A key phrase in all the EPA'spublications is ‘functional value at the ecosystem level’, but no where does it define what is meantby this phrase, and what issues should be considered in determining whether a development islikely to impact on the functional value of an ecosystem. Given the emphasis that PositionStatement No. 3 places on this issue, this is a serious shortcoming of Guidance Statement No. 56.
4. Role of proponents, consultants and the EPA in determining the level of assessment
Proponents for a development are mostly government departments acting as land developers orwishing to change the zoning of land, or are private companies that are seeking to mine or utilisethe land for a particular purpose. When provided with a range of alternatives or vague guidelinesit is reasonable to expect that many developers will adopt the least cost option. Environmentalconsultants undertake the vast majority of the terrestrial fauna assessments for land developersand mining companies in WA. Often these companies are in a competitive situation when seekingbusiness. If the requirements for terrestrial fauna assessments in tenders are vague and ill defined,then it makes it difficult for consultants to respond. In the absence of clear guidelines, proposedworks programs suggested by consultants are often based on what the EPA has approved in thepast. Most environmental consultants in WA that undertake terrestrial fauna surveys are wellqualified, equipped and capable of undertaking more intensive and comprehensive terrestrialfauna surveys and reporting on these data in an appropriate manner. However, in a pricecompetitive environment, it is understandable when a consultant adopts a minimalist position tocontain costs and win contracts even though the survey effort and reporting falls short of EPAguidelines.
The EPA in its Preliminary Position Statement No. 3 (2000) made it clear why there was a needto improve and upgrade standards for terrestrial fauna surveys in WA. What is missing is clarity inwhat is expected for terrestrial fauna surveys, how the data should be analysed and reported, andfor the EPA to more stringently adhere to its published position and guidance statements.
5. Fauna assessment guidelines elsewhere in Australia
There is no standard requirement or guidelines for terrestrial fauna surveys for the purposes ofpreparing EIAs that apply in all Australian states and territories. Environmental impactassessments in each state and territory are undertaken under the auspice of the Commonwealth
46 G.G. Thompson / Environmental Impact Assessment Review 27 (2007) 41–61

Autho
r's
pers
onal
co
py
Government legislation (i.e. Environment Protection and Biodiversity Conservation Act 1999)and the relevant state government legislation (e.g. in WA the Environmental Protection Act1986). Some local government authorities also require an EIA before providing planningapproval (e.g. Brisbane City Council). A search of the appropriate web‐sites indicated thatdetailed fauna survey guidelines are not provided by all other Australian state or nationalenvironmental protection authorities. However, in South Australia, the government environ-mental regulators often use the guidelines published by South Australian Parks and Wildlife(Owens, 2000). In New South Wales (NSW) the Department of Environment and Conservationreleased a draft guideline in 2004 on surveying for threatened species, and the Lower HunterCentral Coast Region of NSW has published fauna survey guidelines for developments in thatregion. Below is a brief description of the major expectations of the Lower Hunter Central CoastRegion, the Department of Environment and Conservation and the South Australian Parks andWildlife for fauna surveys. This section concludes with a brief summary of the Ecological Societyof Australia's position statement on ecological factors to be considered in EIA relevant to faunasurveys. Key features from these guidelines have been incorporated in to the recommendationsthat conclude this paper.
5.1. Lower Hunter Central Coast Region (NSW)
The Lower Hunter Central Coast Region published a two volume guideline on fauna surveysand assessments; Volume 1: Flora and fauna survey guidelines, Lower Hunter Central CoastRegion 2002, and Volume 2 Survey Guidelines to the threatened species of the Lower HunterCentral Coast Region 2002 (Murray et al., 2002). These are comprehensive documents thatindicate why fauna surveys should be undertaken, who should undertake the surveys, and thelicensing requirements. The focus is on identifying the presence of threatened species and there isa limited commentary on identifying ecological communities or assemblages that are of state orregional significance. The guidelines identify the number of surveys required based on the size ofthe area and the general trapping effort per survey. Trap‐types recommended include smallmammal traps, hair traps, Elliott and wire cage traps. Spotlighting, mist‐nests, echolocation andhand‐foraging are all recommended fauna detection strategies and a survey period isrecommended for each fauna group. Detailed information is provided on threatened speciesknown for the area and how their presence should be identified.
5.2. Department of Environment and Conservation (NSW)
The Department of Environment and Conservation (2004) released for public commentThreatened Biodiversity Survey and Assessment: Guidelines for Development and Assessment.These guidelines were prepared to assist impact assessment and management of threatenedbiodiversity in NSW, and are complemented by profiles for threatened species populations andcommunities, and build on numerous earlier reports prepared by the NSW Parks and WildlifeService. This is a detailed and comprehensive guide that explains the processes, responsibilities ofvarious parties, selection of consultants, licences and permits, ethical considerations and use ofthe precautionary principle. It recommends a preliminary assessment and some field work, similarto a Level 1 assessment in the EPA Position Statement No. 3. This preliminary information is thenused to design and conduct a field investigation. Detailed guidelines are provided on the structureand the content of the report that is required. Field survey guidelines focus on identifyingthreatened species populations, ecological communities and their habitats. These guidelines
47G.G. Thompson / Environmental Impact Assessment Review 27 (2007) 41–61

Autho
r's
pers
onal
co
py
provide information on the stratification, sampling and replication of field surveys. These faunasurvey guidelines provide information and specific details on surveying for amphibians, reptiles,diurnal and nocturnal birds, mammals including bats and invertebrates. A diverse range of traptypes are recommended, including Elliott traps, wire cage traps, hair‐tube traps and pit‐fall traps.Tracks, scats and scratchings, spotlighting, sand plots, call playback, mist nets and echolocationcall identification for bats are also discussed. An indication of the trapping effort required isprovided for most trapping strategies.
5.3. South Australian Parks and Wildlife
The South Australian Parks and Wildlife Department has published comprehensive guidelinesintended to provide consultants, local government, conservation groups and governmentemployees with information on how to undertake vertebrate fauna surveys. This document(Owens, 2000) provides a standard protocol for South Australia that matches the field surveywork conducted under the auspice of the Biological Survey Coordination Committee. Theseguidelines are in three sections; pre, during and post‐survey methodology, with specificinformation on licensing and permits, animal ethics, vouchering, validation of data, data entry andediting. Considerable detail is provided on the various trapping protocols, types of traps to beused (e.g. pit‐fall traps, Elliott traps, cage traps, micro‐pitfall traps for invertebrates), hand‐foraging, spotlighting and opportunistic observations, observational recording of birds, use ofmammal tracks and scats and bat detection strategies. Information is provided on what datashould be collected for the various taxa and the suggested formats for recording information.These guidelines do not provide an EIA context for undertaking fauna surveys, nor do theyprovide advice on how the data collected should be analysed or used.
5.4. Ecological Society of Australia
The Ecological Society of Australia (2006) exists to promote scientific research in ecology andto facilitate the communication and application of this knowledge. It has published a PositionStatement on Ecological Factors in Environmental Impact Assessment. The ESA recommendsthat EIA reports be peer reviewed to assess the competence and scope of the work. It alsorecommends that adequate time and resources should be allocated to undertake comprehensiveecological studies when these are justified, and that experienced scientists in the assessingagencies should provide clear ecological survey guidelines for each specific developmentproposal. The ESA also recommends the use of monitoring programs to rigorously assess theimpacts of developments, particularly those of a large scale.
5.5. Summary
The focus is mostly on threatened species, sometimes extending to threatened species habitatsand assemblages. The WA EPA is one of the very few government agencies that requires anassessment of biodiversity value for an area at the genetic, species and ecosystem level and theecological functional value at the ecosystem level in the EIA report. The level of detail indescribing the protocols and effort that is required in fauna surveys varies in the detail and level ofprescription. The fauna survey guidelines provided by the WA EPA are less detailed than thoseprovided by the South Australian Parks and Wildlife, the NSW Department of Environment andConservation and the Lower Hunter Central Coast Region of New South Wales and there is scope
48 G.G. Thompson / Environmental Impact Assessment Review 27 (2007) 41–61
Autho
r's
pers
onal
co
py
for improvement. The ESA present a strong argument for clear guidelines by governmentagencies and a peer review process.
6. Improved guidelines for terrestrial fauna surveys
Guidance Statement No. 56 should provide more detailed and specific information on trap‐types to be employed, areas to be sampled, and the trapping effort required for Level 2 detailed orcomprehensive surveys. What follows is a brief overview of how terrestrial vertebrate faunasurveys should be conducted for the purposes of preparing an EIA. This is clearly not the place toprovide an alternative guidance statement, so I will only address some of the key issues that arenot adequately addressed in Guidance Statement No. 56 and suggest an alternative assessmentprocess. I will not address the sampling of birds, bats, large mammals and invertebrates as spacedoes not permit.
7. Trapping effort
Time of year, prevailing weather conditions and habitat are three of the primary variables thatinfluence catch rates at any particular site. There is generally little point undertaking a sitesurvey and catching only 30–40% of the reptile and half the small mammal species in the area,as these data can generally be inferred from a search of museum databases (e.g. FaunaBase;http://www.museum.wa.gov.au/faunabase/prod/index.htm).
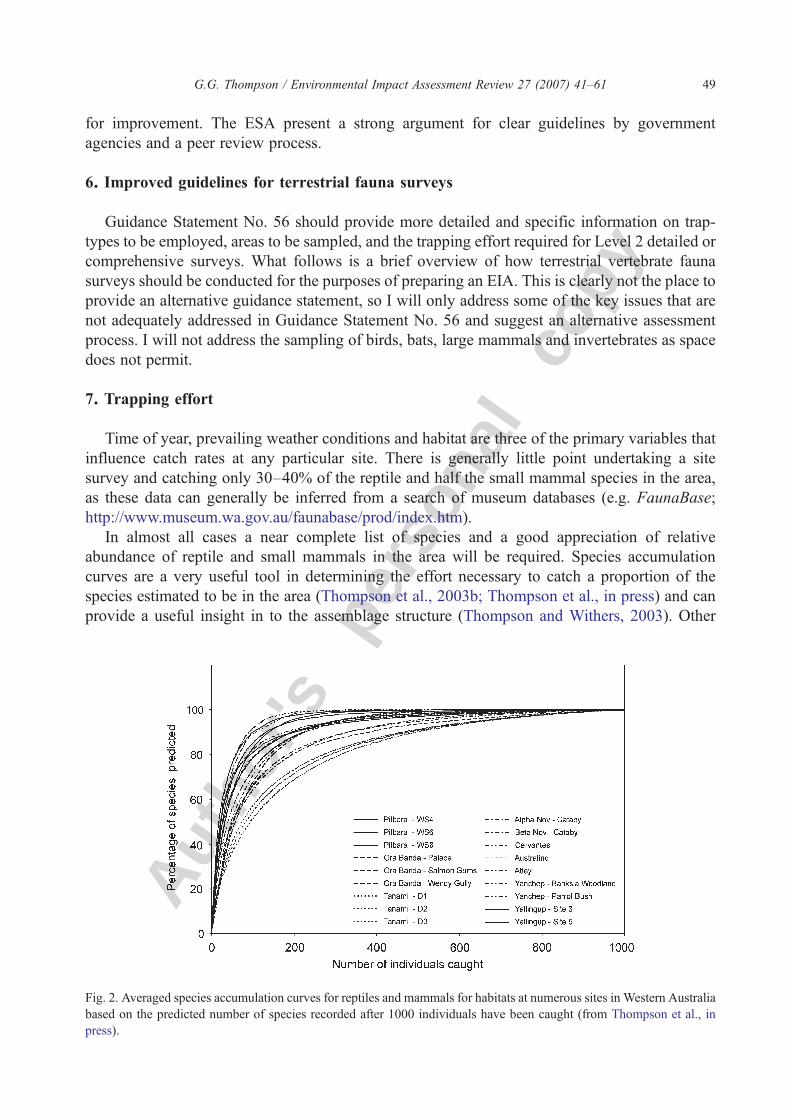
In almost all cases a near complete list of species and a good appreciation of relativeabundance of reptile and small mammals in the area will be required. Species accumulationcurves are a very useful tool in determining the effort necessary to catch a proportion of thespecies estimated to be in the area (Thompson et al., 2003b; Thompson et al., in press) and canprovide a useful insight in to the assemblage structure (Thompson and Withers, 2003). Other
Fig. 2. Averaged species accumulation curves for reptiles and mammals for habitats at numerous sites in Western Australiabased on the predicted number of species recorded after 1000 individuals have been caught (from Thompson et al., inpress).
49G.G. Thompson / Environmental Impact Assessment Review 27 (2007) 41–61
Autho
r's
pers
onal
co
py
techniques to assess species richness such as first and second order jackknife estimates (Palmer,1990, 1991) are also useful. Fig. 2 contains averaged species accumulation curves from 18 mesic,semi‐arid and arid sites in Australia that can be used to estimate the trapping effort required tocatch a nominated percentage of the species in a habitat. It is anticipated that when similar data areavailable for the wet–dry tropics they will not differ appreciably from this information. Thesecurves vary in accordance with the assemblage structure (Thompson and Withers, 2003;Thompson et al., in press), trapping period and local environmental conditions during the trappingperiod. Therefore, they should only be used for planning purposes and be substituted with theaveraged species accumulation curve for the particular site as the data become available. Thesecurves and information provided by Thompson et al. (in press) indicated that between 70–100small vertebrates will need to be trapped to record about 80% of the species in a habitat, andbetween 90 and 200 small vertebrates need to be trapped to record 90% of the species in a habitat.High species richness and a high number of rare species in the sample increase the number ofindividuals that need to be trapped to record a nominated proportion of the species in that habitat.Given that this information is generally not known before a survey is undertaken, fauna surveysshould plan to catch a minimum of 150 individuals if they intend to detect 80–90% of the speciesin the area. Although it is desirable to record all species that are in or use a particular habitat, this israrely done, as some species are difficult to detect, some are in very low abundance, and otheronly utilise the area occasionally. In addition, the cost of intensive surveys conducted at multipletimes can be difficult to justify unless there is evidence to suggest the habitat may contain speciesof conservation significance that are in very low abundance.
8. Areas to sample
Position Statement No. 3 clearly indicates that it requires the fauna survey data to report onthe potential impacts of the development on ecosystems and ecological functional values. This isbest done for each major habitat type. Habitats are defined in Guidance Statement No. 56.Thompson et al. (2003a) demonstrated that the reptile assemblage as represented by pit‐trapcaptures varied appreciably among adjacent habitat types at Bungalbin and Ora Banda. In theBungalbin example, all 12 habitats were on a gently undulating sand plain along a track andwithin 10 km of each other. Habitat varied from areas sparsely vegetated with spinifex andAcacia shrubs, to areas that were densely vegetated with trees and shrubs that were higher than2 m. Similar differences in fauna assemblages were recorded at 10 sites within 25 km of eachother around Ora Banda and for four adjacent habitat types (flat, base, slope and crest of sandridges) in the Great Victoria Desert (Pianka, 1996). Survey sites at Ora Banda were in habitatsranging from Eucalypt–Casuarina–Mulga woodlands interspersed with Acacia, to sparselydistributed spinifex (Triodia spp.) and shrubs (Acacia spp.) to dense shrubs (Acacia spp.,Atriplex spp., Allocasuarina spp.). Therefore, to adequately describe the small vertebrateassemblage in an area that contains a number of habitat types, each of the major habitats shouldbe sampled.
9. Target species searches
Terrestrial vertebrates that are difficult to catch using Elliott traps, pit‐traps, funnels andcage traps, and that are likely to be in an area and are of conservation significance, requirespecies‐specific searches and trapping strategies (e.g. Macrotis lagotis). This will often meanreturning to an area when environmental conditions are appropriate to maximise the chance
50 G.G. Thompson / Environmental Impact Assessment Review 27 (2007) 41–61
Autho
r's
pers
onal
co
py
of individuals being observed or caught (e.g. arid‐adapted frogs only emerge after significantrains, many pythons become active immediately before and after rains). Analysis of hairs inpredatory mammal scats (e.g. Notoryctes caurinus; see Paltridge, 1998) or systematicsearches of an area for scats (e.g. Dasyurus hallucatus), burrows and tracks (e.g. Macrotislagotis, Dasycercus cristicauda) might be useful techniques for other difficult‐to‐locatemammals of conservation significance. Hair traps might be useful in detecting the presence ofsmall mammals in some areas (Lindenmayer et al., 1994, 1999; Wilson and Delahay, 2001).Baited arboreal pit‐traps are also useful in catching some arboreal species of mammals andreptiles.
10. Level of fauna assessment
In most cases until a desktop study and reconnaissance site visit have been undertaken neitherthe proponent nor the EPA are in a position to decide whether a Level 2 terrestrial fauna survey isrequired, and if it is, the extent of the survey effort that is required. At present a judgement is oftenmade on whether a Level 1 or 2 survey is necessary without the EPA having knowledge of thearea or habitat to be disturbed.
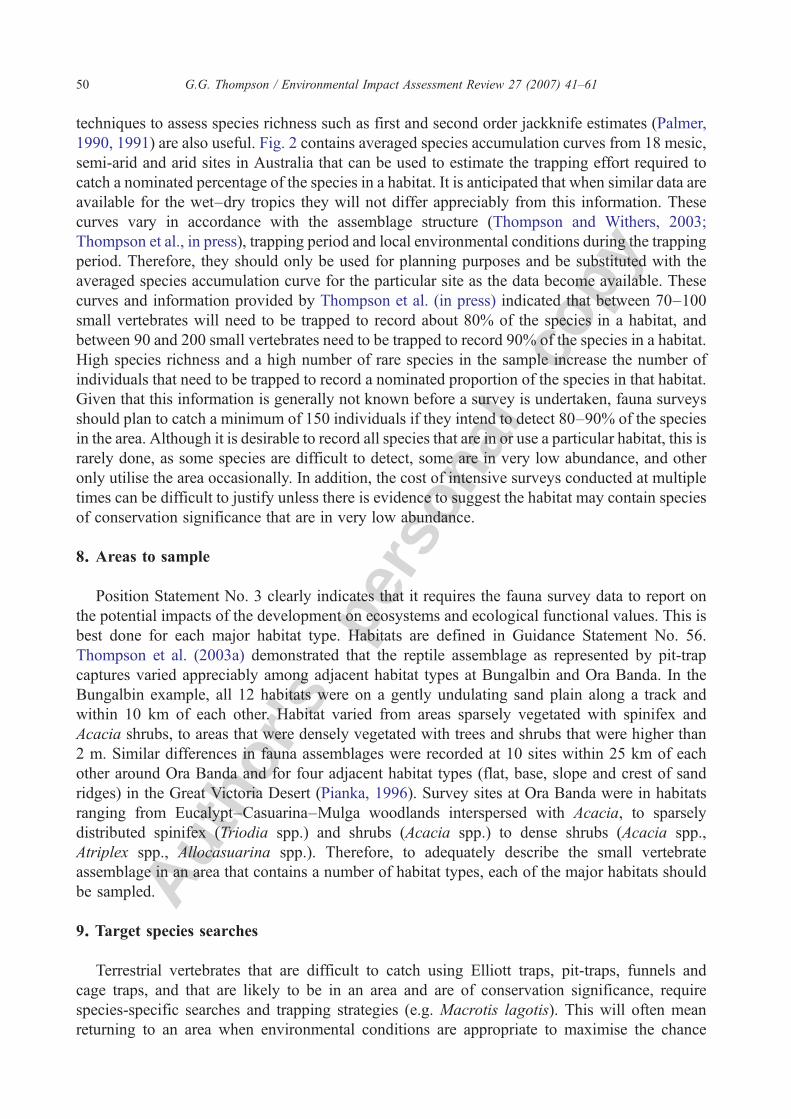
In the context of the EPAs Level 1 and 2 assessments, Fig. 3 outlines a better sequence forplanning the assessment of the impact of a development on the terrestrial vertebrate fauna and
Fig. 3. The sequential process for assessing the potential impact of a disturbance on the faunal assemblage at a particularsite.
51G.G. Thompson / Environmental Impact Assessment Review 27 (2007) 41–61

Autho
r's
pers
onal
co
py
deciding on the extent and intensity of terrestrial fauna surveys. The first stage in the process is toundertake a desktop study and reconnaissance visit to the site (Level 1). Data from these twoinvestigations should then be used to:
• provide specific information on the potential flora, fauna and habitats of the site and region;• assess the level of potential disturbance;• assess the potential for protected, rare or species of conservation interest in the area;• assess the potential for the occurrence of significant faunal assemblages; and• assess the complexity of habitat or faunal assemblage.
Based on this analysis, the proponent can argue that:
• sufficient is known about the area (e.g. adequate prior survey data);• the area is of little biological value (e.g. site is highly degraded);• the scale of the potential impact is small in absolute terms; or• the scale of the potential impact is relatively insignificant in the context of the available habitatand faunal assemblages, and no on‐site survey should be required.
Or, if additional terrestrial fauna surveys are to be undertaken, a detailed survey protocol canbe developed that describes the objectives, extent and timing of the survey(s), and what species‐specific targeted searches are required taking in to account whether the primary purpose of thesurvey is to:
• document species richness;• describe the fauna assemblage (e.g. species richness and relative abundance);• search for species of conservation significance; or• produce baseline monitoring data (see Fig. 4).
Fauna surveys can have four foci (Fig. 4) for the purposes of preparing an EIA:
1. Targeted species searches — where the primary purpose is to search for species that areconsidered to be threatened, vulnerable or approaching extinction (e.g. D. cristicauda,Egernia stokesii badia; M. lagotis). Most often species‐specific search strategies will beemployed to maximise the detection of individuals and identifying their habitats. Thesestrategies will be based on the known ecology of the species, for example, searches for M.lagotis will require grid searches of the area looking for burrows and scratchings, and searchesfor E. s. badia will focus on finding scat piles around old buildings, hollow trees and rubbishpiles.
2. Species richness — where the primary purpose is to understand what species are in the areaand will be impacted on.
3. Faunal assemblages — where an understanding of both species richness and relativeabundance are required to assess the impact of the disturbance. This type of survey would benecessary when assessing the impact of a disturbance on the biodiversity and ecosystemfunctional value.
4. Baseline monitoring— when the data are to be used to monitor the impacts of a developmenton the adjacent faunal assemblages or to measure the success of rehabilitation programs (e.g.Thompson, 2004).
52 G.G. Thompson / Environmental Impact Assessment Review 27 (2007) 41–61
Autho
r's
pers
onal
co
py
EPA Guidance Statement No. 56 indicates that the EPA does not have the resources tosystematically review all fauna surveys and reports, and to ensure standards are adequate aproportion of projects will be randomly selected for audit. The Guidance Statement goes on toindicate where peer reviews might be used and the elements of the peer review process. Not allstaff that are assessing fauna survey reports and preparing recommendations for the EPA have therequired knowledge and experience to determine the adequacy of surveys and the associatedreports. It is therefore recommended that all Level 2 fauna survey protocols be sent to independentpeer review before the scoping report is made public and before surveys are commenced. It wouldnot be very time consuming nor an expensive process for an appropriately experiencedprofessional to comment of the adequacy of the proposed survey; particularly if an adequate Level1 assessment had already been completed as is being suggested. Such a process will avoid theexpensive situation where the EPA/DEC have approved of a fauna survey as part of the scopingreport, the work is undertaken but subsequently been shown to be inadequate and the proponent isrequired to undertake further survey work to complete the task. This recommended process willalso avoid undertaking expensive terrestrial fauna surveys in areas that have little biological/ecological value, where there is a comprehensive understanding of the fauna of the area fromprevious surveys, or where the area of impact is small and any loss of habitat is unlikely to have asignificant impact on the fauna in the area. The opportunity to redesign the survey based on thepeer review report should be available along with the capacity to negotiate an agreed surveyprotocol. Peer reviews can be organised by the authoring environmental consultant or thegovernment agency, as is the current situation. These peer reviews should be appended to the finalreport.
Fig. 4 provides a succinct summary of the key elements of three of these four types ofterrestrial fauna survey protocols described above for a Level 2 assessment. Obviously, these canonly be general guidelines given the limited space, and these guidelines should be adjusted to thelocal circumstances and environment.
11. Trap types
Various trap types sample the small vertebrate fauna differently (Bauer and Sadler, 1992;Bury and Corn, 1987; Catling et al., 1997; Enge, 1997a; Fitch, 1992a,b; Greenberg et al., 1994;Jacob et al., 2002; Lobert et al., 2001; Thompson et al., 2005a,b), and each has its own bias.Therefore a mixture of trap types is advisable. As a general guideline, buckets as pit‐traps catchmore reptiles, particularly the smaller ones, than pipes as pit‐traps, whereas, pipes catch moremammals than buckets (Thompson and Thompson, 2005). Funnel traps rarely catch smallmammals but catch more of the medium and large terrestrial, diurnal snakes, more of thewidely‐foraging, medium‐sized skinks, more of the medium‐sized dragon lizards and arborealgeckos that climb out of PVC pit‐traps. Elliott traps catch the same suite of small mammals aspipes when used as pit‐traps, but they also catch some of the large trappable mammals (e.g.Rattus sp.) that readily jump out of pit‐traps. Cage traps are useful for trapping some of thelarger skinks (e.g. Tiliqua sp.) and small‐to‐medium sized mammals such as possums andbandicoots that are unlikely to be caught in pit and funnel traps. It is therefore suggested thatpit‐traps and funnel traps should be used in most surveys. Where a prior investigation hasindicated that small‐to‐medium sized mammals (100–3000 g) should be targeted in the survey,then cage traps should also be used. Many fauna surveyors use 30 m of fly‐wire as a drift fencealong which they place a number of pit‐traps. If this is used as a standard unit, then for each30 m of fly‐wire drift fence, it is suggested that three 150 mm PVC pipes (500 mm deep), three
53G.G. Thompson / Environmental Impact Assessment Review 27 (2007) 41–61

Autho
r's
pers
onal
co
py
20 L PVC buckets and three pairs of funnel traps be evenly spaced (a trapping line; Fig. 5) foran effective configuration. In addition, two Elliott traps, and where appropriate, one wire cagetrap should be set with each trapping line. A similar arrangement can be made along three 10 mfly‐wire drift fences. Most often Elliott traps and cage traps are baited with a mixture of peanutbutter, fish oil or sardines, rolled oats and occasionally honey. Buckets should contain shadecovers in the bottom (egg cartons or styrene sheets); and Elliott traps, wire cage and funnel trapsrequire a suitable shade cover. All traps need to be cleared daily, and if the maximum dailytemperature is likely to get above the high 20s oC then every effort should be made to clear alltraps before the midday sun penetrates to the bottom of the pit‐traps. Where ambienttemperatures are likely to reach the mid‐30s oC and above then even shade covers over Elliotttraps, cage traps and funnels traps are inadequate and traps need to be cleared earlier in themorning. Small vertebrates can die in exposed traps when they cannot find the protection ofshade during the hottest part of the day in many areas of WA.
12. Reporting results of terrestrial fauna surveys
The EPA Position Statement No. 3 provides clear guidelines on the issues it wants proponentsto address in an EIA report based on the terrestrial fauna survey data, but it does not make it clearhow it wants proponents to go about this task. Recent public environmental reports (see Table 1)reviewed and released by the EPA for public comment do not address some of the key issuesrequired by Position Statement No. 3. One possible reason for this is that the authors of thesereports were unsure what information the EPA required in the terrestrial fauna survey reports dueto inadequate guidelines.
The methods section of the report should include information on who undertook the faunasurvey, when it was undertaken, details of the trapping protocols and the perceived limitations ofthe survey effort. The results section should include a list of species caught and an indication ofassemblage structure for each of the major habitat types. Averaged species accumulation curves
Fig. 4. Suggested trapping guidelines for terrestrial fauna surveys for EIA.
54 G.G. Thompson / Environmental Impact Assessment Review 27 (2007) 41–61

Autho
r's
pers
onal
co
py
should be provided for each faunal group (e.g. birds, mammals and reptiles) caught in thetrapping/search program to indicate the adequacy of the survey effort, or alternatively, estimatesof species richness calculated using one of the other accepted methods (e.g. Diaz‐Frances andSoberon, 2005; Palmer, 1990, 1991).
The discussion section should include an analysis of the similarities and differences amongthe surveyed assemblages, and these assemblages placed in a regional context (e.g. how similaror different are the assemblages to others in the region). Rare, protected, short‐range endemicsand disjunct assemblages should be identified and an assessment made of the proposeddevelopment impacts on these taxa and their ecological and conservation significance. Thefunctional value of the fauna component of each of the ecosystems should be assessed in the
Table 1Checklist and assessment of recently released fauna surveys and reports for the purpose of preparing EIAs
Reports A B C D E F G
Sampling effort reflects the likely faunal diversity based on complexity ofvegetation and habitat types
2 3 2 2 1 1 1
Appropriate timing of surveys 2 2 3 2 1 2 1Adequacy and efficacy of sampling methods per major habitat type using:
Pit‐traps 2 2 2 2 2 2 2Cage traps ND 4 2 3 1 ND 1Funnel traps ND 2 1 ND 2 ND 1Elliott traps 4 4 4 3 4 ND 1Bat echolocation/mist nets 3 ND 2 3 4 3 2Opportunistic searches 3 4 3 3 3 3 3
Adequacy of survey effort to assess:Rare and protected species 2 2 2 2 2 1 1Species richness per major habitat type 1 3 3 2 1 1 1Assemblage structure per major habitat type (e.g. abundance) 1 2 2 1 1 1 1Ecosystem functional values 1 2 2 1 1 1 1Seasonal and temporal variations ND 2 3 ND ND ND ND
Faunal data presented and discussed based on major habitat types 1 3 2 1 1 1 1Assessment of biodiversity value considered at:
Species level 2 3 2 3 3 3 3Ecosystem level 1 2 2 1 1 1 1Ecological function value 1 1 1 1 1 1 1In a regional context 2 3 2 2 1 1 1
Rating system ND = not done or not used, 1 = barely addressed or done very poorly, 2 = less than adequate or done poorly,3 = adequate, 4 = well done, 5 = very well done or adequately meets the required standards.A = Beagle Bay Big Tree Country Tropical Timber Plantation Project Fauna Assessment Survey March 2004 (Ecologia,2004).B = Coburn Mineral Sand Project Public Environmental Review July 2005, Appendix K Vertebrate Fauna Survey Report(Ninox Wildlife Consulting, 2005b).C = Kimberley Diamond Company Ellendale Project, June 2005 (Ninox Wildlife Consulting, 2003; Ninox WildlifeConsulting, 2005a).D = Fauna Habitat and Fauna Assemblage Survey of the Western Tanami Project Area (Coyote and Larranganni Deposits)(Biota Environmental Sciences, 2005b).E = Goldsworthy Extension Project, Environmental Protection Statement, Appendix D Biological Assessment (EcologiaEnvironmental Consultants, 2005).F = Fauna Habitats and Fauna Assemblage of the Proposed FMG Stage A Rail Corridor (Biota Environmental Sciences,2004).G = Fauna Habitats and Fauna Assemblage of the Proposed FMG Stage B Rail Corridor and Mindy Mindy, ChristmasCreek, Mt Lewin and Mt Nicholas Mine Areas (Biota Environmental Sciences, 2005a).
55G.G. Thompson / Environmental Impact Assessment Review 27 (2007) 41–61

Autho
r's
pers
onal
co
py
context of how unique it is, how representative of the area it is, how widespread each of thefaunal assemblages are distributed based on habitat characteristics, the consequences resultingfrom this loss of biodiversity if the development is to proceed and the potential for it to be re‐established during the rehabilitation process. The impact of the disturbance on the fauna shouldbe assessed, and management options and strategies should be provided to minimise this impact.A detailed protocol needs to be provided to monitor the impact of the disturbance on theadjacent ecosystems if this was considered an issue. If the terrestrial fauna survey data are to beused as baseline information to monitor impacts or rehabilitation success, then seasonal andyear‐to‐year natural variation in populations should be adequately documented, along with thetrapping protocols.
All Level 2 terrestrial fauna survey reports should be subject to independent peer review. Thiswill also enable the EPA to demonstrate to the public that its assessment processes are striving forindustry best practice. It will also provide a level of comfort to the public that appropriate faunaassessments and reporting practices have been adopted in the preparation of the EIA.
Appendix A. Criteria for assessing the adequacy of terrestrial fauna surveys for thepurpose of EIA
The EPA (2004) indicated that Guidance Statement No. 56 details the minimum requirementsfor when a survey is required, the type and extent of survey required and the minimum standardsof interpretation of survey data. I have therefore adopted Guidance Statement No. 56 as theminimum acceptable standards to develop the assessment criteria described below. Theassessment criteria are the key issues contained in Position Statement No. 3 and GuidanceStatement No. 56. For each criterion, a five point rating scale was used to assess each survey andreport or alternatively it was rated as ‘not done or not used’; ND. At the conclusion of thedescriptions for each of these criteria, a brief description is provided of the author's approach torating each of the reports against each criterion.
Criterion 1 – Sampling effort reflects the likely faunal diversity based on complexity ofvegetation and habitat types –Guidance Statement No. 56 indicates that the intensity of samplingshould reflect the likely faunal diversity based on the complexity of the vegetation and habitats tobe disturbed (pp. 12–13, Table 3). When read in conjunction with Table 3 in the GuidanceStatement No. 56, this was taken to mean that each of the distinctly different habitat types(biotopes) should be surveyed with sufficient intensity to record 80–90% of the small vertebratespecies in the area and their relative abundance. Based on information in Thompson et al. (2003a,2005a,b, in press; Fig. 2) approximately 150 small terrestrial vertebrates need to be caught in eachhabitat type to be confident that you have caught about 80–90% of the species in the areapresuming you have used a range of trap types. The alternative was for the report to presentspecies accumulation curves for each faunal group or another metric to demonstrate the adequacyof the assessment.
Criterion 2 – Appropriate timing of surveys – Guidance Statement No. 56 indicates that‘survey(s) over multiple years may be required where a single year's data is not adequate todetermine the faunal assemblages or to address environmental factors’ (pp. 10, see pp. 11, 13) and‘in general fauna and faunal assemblage surveys conducted for baseline information should bemultiple surveys conducted in each season appropriate to the bioregion and the faunal group’ (pp.12). Reports by How (1998), Cowan and How (2004), How and Dell (2004), Thompson et al.(2003a) and Thompson and Thompson (2005) indicated that multiple season surveys are requiredfor baseline monitoring data and that at least one of these survey should be carried out in the hotter
56 G.G. Thompson / Environmental Impact Assessment Review 27 (2007) 41–61

Autho
r's
pers
onal
co
py
months (late spring or summer) in southern and central WA and at the beginning of the wet seasonfor the wet–dry tropics when using pit‐traps to ensure most of the species are captured. Surveys inautumn and winter caught fewer individuals and few species. Maron et al. (2005) clearlydemonstrated the shortcomings of a single short‐term survey of the avian fauna to assess speciesrichness and relative abundance. These data are collectively interpreted to mean that at least twoseason surveys are required to assess species richness and relative abundance and where baselinemonitoring data are required then surveys in multiple years are necessary.
Criterion 3 – Adequacy and efficacy of sampling methods per major habitat type using avariety of trap types – Guidance Statement No. 56 indicates that the relative efficacy of samplemethods for terrestrial vertebrate has been analysed for different parts of WA and the EPAexpects that the analysis of faunal assemblage data will take cognisance of sampling bias (pp.13–14). Numerous reports (Catling et al., 1997; Enge, 1997a,b, 2001; Fitch, 1951, 1992a;Greenberg et al., 1994; Ryan et al., 2002; Sutherland, 1996; Thompson et al., 2005a,b) indicatedthat multiple trap types are necessary to adequately survey the small terrestrial fauna of an area,including pit‐fall traps, Elliott traps, cage traps and funnel traps. These trap‐based protocols canbe supplemented by opportunistic sightings, hand‐foraging, sand traps, hair tube traps andsystematic searches of the area. Where bats are to be assessed, then mist nets, harp traps, triplines or echolocation detection protocols are required. Wet and dry pit‐traps are useful forsampling invertebrates. Cage traps are used to catch mostly small‐to‐medium mammals (100–3000 g) that have relatively large activity areas; Elliott traps focus mostly on smaller mammals(5–100 g) that also forage widely; pit‐traps are effective for catching small mammals (5–50 g),reptiles, frogs and invertebrates that have varying size activity areas; and funnel traps are usefulfor trapping reptiles, in particular snakes, pygopods, widely‐foraging skinks and medium‐sizedvaranids. Drift fences increase trapping success when used with pit‐traps and funnel traps.Trapping lines need to be placed throughout the habitats that are being surveyed. It is suggestedthat the ratio of trap types employed should approximate: cage trap:Elliott‐trap:pit‐trap:funnel‐trap 1:2:6:6 (see Fig. 5). Cage traps should only be employed when the Level 1 assessmentindicated a targeted search was required for small‐to‐medium size mammals (100–3000 g) ofconservation significance.
Criterion 4 – Adequacy of survey effort to assess rare and protected species, species richness,assemblage structure, ecosystem functional values and temporal variations – Position StatementNo. 3 indicates that the EPA expects proponents to ensure that terrestrial biological surveysprovide sufficient information to address both biodiversity conservation and ecological functionvalues (pp. 12, 17). Neither of these phrases are defined by the EPA, but for the purposes of this
Fig. 5. Suggested trapping line.
57G.G. Thompson / Environmental Impact Assessment Review 27 (2007) 41–61

Autho
r's
pers
onal
co
py
assessment this criterion has been interpreted to mean the survey effort should be adequate todetect the presence and location of rare and protected species (which may require species‐specifictargeted searches), 80–90% of the small vertebrate species likely to be in each habitat type, anappreciation of relative abundance for each species, whether the assemblage structure is similar toor differs from other habitats in the bioregion, and the extent to which seasonal and year‐to‐yearnatural variations can be described.
Criterion 5 – Faunal data presented and discussed based on major habitat types – PositionStatement No. 3 (pp. 12) indicates that the survey effort needs to be sufficient to provideinformation on biodiversity conservation value at the genetic, species and ecosystem levels, andecological function values at the ecosystem level. Given that ecosystems and ecologicalfunction value are likely to differ appreciably among different habitat types this criterion hasbeen interpreted to indicate that the faunal data must be assessed based on each major habitattype.
Criterion 6 – Assessment of biodiversity value considered at the species level, ecosystemlevel, ecological function value, and in a regional context – Position Statement No. 3 (pp. 12)requires an assessment of the terrestrial fauna data for its biodiversity value at the genetic,species and ecosystem levels, and its ecological function value at the ecosystem level. Both EPAreports indicate the difficulty of assessing the value at a genetic level due to a lack of adequatedata; as a consequence this aspect of the criterion has been excluded. Appreciating thebiodiversity conservation value of species and ecosystems requires that the data be assessed in abioregional context. Given that Guidance Statement No. 56 (pp. 10) indicates that the EPAexpects a high degree of rigour in reporting not only to describe the fauna assemblages but tofacilitate EPA assessment, this has been interpreted to indicate that the fauna survey reportshould adequately address each of these values. A subjective assessment of what is adequate hasbeen applied.
A.1. Rating system
If the issues associated with a criterion were not addressed or discussed in any meaningfulmanner, then a rating of ‘not done or not used’ (ND) was applied. If the issue was addressed then afive point rating system was applied to each criterion. This was a subjective assessment of theextent to which the survey addressed or covered the criterion, as it was not possible to quantifycompliance or adherence with these types of criteria in a measured manner. Given that the ratingsystem was a subjective assessment, it is therefore based on the author's experience with faunasurveys, knowledge of the literature and a detailed assessment of the adequacy of small vertebratefauna trapping programs (see end of text references and references therein to judge the authorsexperience). A rating of 1 indicated the criterion had been either barely addressed, poorly done orwas inadequate. Whereas, a rating of 5 indicated that the survey and report was very well done,adequately met the required standard or comprehensively addressed the criterion. No judgementwas applied to whether the author agreed with the views or assessment contained in the report.This can best be illustrated with an example of the adequacy and efficacy of the sampling methodscriterion (criterion 3). It is important that a diverse range of trap types are used (e.g. pipes andbuckets as pit‐traps, funnel traps, Elliott traps and cage traps) to comprehensively survey smallvertebrate fauna in a variety of habitats in WA. The non‐use or under‐utilisation of funnels traps,for example, will result in the under sampling of snakes, large varanids, widely‐foraging skinksand large pygopods. Thompson et al. (in press) and Thompson and Thompson (in press)demonstrated the need to catch 70–100 individuals in a habitat to record 80% of the species, and
58 G.G. Thompson / Environmental Impact Assessment Review 27 (2007) 41–61
Autho
r's
pers
onal
co
py
90–200 individuals to record 90% of the species in a habitat. The higher the species richness andthe higher the proportion of rare species in the sample, the higher the number of individuals thatneeded to be caught. The author's unpublished data indicate that catch rates for pit‐traps andfunnel traps vary from 5–15% in any 24 h period during the optimal sampling season, and varydepending on habitat type, fauna density and the daily weather conditions. To trap 90% of thespecies in a habitat with 10% of traps catching an individual requires 900–2000 trap‐nights. If asurvey approached this level of trapping effort or 90–200 individuals were caught, then it wasrated a 5. A progressively lower rating was applied for a lower trapping effort or number ofindividuals caught.
References
Bauer A, Sadler R. The use of mouse glue traps to capture lizards. Herpetol Rev 1992;23:112–3.Biota Environmental Sciences. Fauna habitats and fauna assemblage of the proposed FMG stage A rail corridor. Perth:
unpublished report for Fortescue Metals Group; 2004.Biota Environmental Sciences. Fauna habitats and fauna assemblage of the proposed FMG stage B rail corridor and Mindy
Mindy, Christmas Creek, Mt Lewin and Mt Nicholas mine areas. Perth: unpublished report for Fortescue MetalsGroup; 2005a.
Biota Environmental Sciences. Fauna habitats and fauna assemblage survey of the western Tanami project area. Perth:Biota Environmental Sciences, unpublished report; 2005b.
Burbidge AH, Harvey MS, McKenzie NL. Biodiversity of the southern Carnarvon Basin. Rec West Aust Mus, Suppl2000a;61.
Burbidge AH, McKenzie NL, Harvey MS. A biogeographic survey of the southern Carnarvon basin, Western Australia:background and methods. Rec West Aust Mus, Suppl 2000b;61:1–12.
Bury RB, Corn PS. Evaluation of pitfall trapping in north‐western forests: trap arrays with drift fences. J Wildl Manage1987;51:112–9.
Catling PC, Burt RJ, Kooyman RA. Comparison of techniques used in a survey of the ground dwelling and arborealmammals in forests in north‐eastern New South Wales. Wildl Res 1997;24:417–32.
Cowan MA, How RA. Comparisons of ground vertebrate assemblages in arid Western Australia in different seasons anddecades. Rec West Aust Mus 2004;22:91–100.
Department of Environment and Conservation. Threatened species survey and assessment: guidelines for developmentsand activities (working draft), New South Wales department of environment and conservation; 2004.
Diaz‐Frances E, Soberon J. Statistical estimation and model selection of species‐accumulation functions. Conserv Biol2005;19:567–73.
Ecologia. Beagle Bay Big Tree Country tropical timber plantation project; Fauna assessment survey. Perth: unpublishedreport for Tropical Timber Plantations; 2004.
Ecologia Environmental Consultants. Goldsworthy extension project, Environmental protection statement, Appendix DBiological assessment. Perth: unpublished report for BHP Billiton; 2005.
Ecological Society of Australia. Ecological factors in environmental impact assessment. http://www.ecolsoc.org.au/Position_papers/EIA.htm; available 10 May 2006. n.d.
Enge KM. A standardized protocol for drift‐fence surveys. Tallahassee, Florida: Florida Game and Fresh Water FishCommission; 1997.
Enge KM. Use of silt fencing and funnel traps for drift fences. Herpetol Rev 1997;28:30–1.Enge KM. The pitfalls of pitfall traps. J Herpetol 2001;35:467–78.Environmental Protection Authority. General requirements for terrestrial biological surveys for environmental impact
assessment in Western Australia. Preliminary position statement No. 3. Perth: Environmental Protection Authority;2000.
Environmental Protection Authority. Terrestrial biological surveys as an element of biodiversity protection: positionstatement No. 3. Perth: Environment Protection Authority; 2002.
Environmental Protection Authority. Terrestrial fauna surveys for environmental impact assessment in Western Australia,No. 56, Draft. Perth: Environmental Protection Authority; 2003.
Environmental Protection Authority. Guidance for the assessment of environmental factors. Terrestrial fauna surveysfor environmental impact assessment in Western Australia, vol. 56. Perth: Environmental Protection Authority;2004.
59G.G. Thompson / Environmental Impact Assessment Review 27 (2007) 41–61

Autho
r's
pers
onal
co
py
Fitch HS. A simplified type of funnel trap for reptiles. Herpetologica 1951;7:77–80.Fitch HS. Methods of sampling snake populations and their relative success. Herpetol Rev 1992a;23:17–9.Fitch HS. The use of mouse glue traps to capture lizards. Herpetol Rev 1992b;23:112–3.Fraser JL, Thompson GG, Moro D. Adequacy of terrestrial fauna surveys for the preparation of environmental impact
assessments in the mining industry of Western Australia. Ecol Manag Restor 2003;4:189–92.Greenberg CH, Neary DG, Harris LD. A comparison of herpetofaunal sampling effectiveness of pitfall, single‐ended, and
double‐ended funnel traps used with drift fences. J Herpetol 1994;28:319–24.How RA. Long‐term sampling of a herpetofaunal assemblage on an isolated urban bushland remnant, Bold Park, Perth. J R
Soc West Aust 1998;81:143–8.How RA, Cooper NK. Terrestrial small mammals of the Abydos Plain in the north‐eastern Pilbara, Western Australia. J R
Soc West Aust 2002;85:71–82.How RA, Dell J. Reptile assemblage of the Abydos Plain, north‐eastern Pilbara, Western Australia. J R Soc West Aust
2004;87:85–95.Jacob J, Ylonen H, Hodkinson CG. Trapping efficiency of Ugglan traps and Longworth traps for house mice in south‐
eastern Australia. Wildl Res 2002;29:101–3.Lindenmayer DB, Wong AD, Triggs BE. A comparison of the detection of small mammals by hairtubing and by scat
analysis. Aust Mammal 1994;18:91–2.Lindenmayer DB, Incoll RD, Cunningham RB, Pope ML, Donnelly CF, MacGregor CI, et al. Comparison of hairtube
types for the detection of mammals. Wildl Res 1999;26:745–53.Lobert B, Lumsden L, Brunner H, Triggs B. An assessment of the accuracy and reliability of hair identification of south‐
east Australian mammals. Wildl Res 2001;28:637–41.Maron M, Lill A, Watson DM, Mac Nally R. Temporal variation in bird assemblages: How representative is a one‐year
snapshot? Austral Ecology 2005;30:383–94.Murray M, Bell S, Hoye G. Flora and fauna survey guidelines: Lower Hunter Central Region 2002. Vol. 1 and 2. Lower
Hunter and Central Coast Regional Environmental Management Strategy, NSW; 2002.Ninox Wildlife Consulting. A seasonal vertebrate fauna survey of Ellendale Project area. Perth; 2003.Ninox Wildlife Consulting. A vertebrate fauna survey of the Ellendale 4 project area, May 2005; Perth; 2005a.Ninox Wildlife Consulting. Vertebrate fauna survey: Coburn mineral sand project. Perth; 2005b.Owens H, editor. Guidelines for vertebrate surveys in South Australia; using the biological survey of South Australia.
South Australia: National Parks and Wildlife; 2000.Palmer MW. The estimation of species richness by extrapolation. Ecology 1990;71:1195–8.Palmer MW. Estimating species richness: the second‐order jacknife reconsidered. Ecology 1991;72:1512–3.Paltridge R. Occurrence of the marsupial mole (Notoryctes typhlops) remains in the faecal pellets of cats, foxes and
dingoes in the Tanami Desert, N.T. Aust Mammal 1998;20:427–9.Pianka ER. Long‐term changes in lizard assemblages in the Great Victoria Desert; Dynamic habitat mosaics in response to
wildfires. In: Cody MJ, Smallwood JA, editors. Long‐term studies of vertebrate communities. San Diego: AcademicPress; 1996. p. 191–215.
Ryan TJ, Philippi T, Leiden YA, Dorcas ME, Wigley TB, Gibbons JW. Monitoring herpetofauna in a managed forestlandscape: effects of habitat types and census techniques. For Ecol Manag 2002;167:83–90.
Sutherland WJ. The twenty commonest censussing sins. In: Sutherland WJ, editor. Ecological census techniques: ahandbook. Cambridge, UK: Cambridge University Press; 1996. p. 317–8.
Thompson SA. Mine site rehabilitation index using reptile assemblage as a bio‐indicator, unpublished PhD thesis, EdithCowan University, Perth; 2004.
Thompson SA, Thompson GG. Temporal variation in reptile assemblages in the Goldfields of Western Australia. J R SocWest Aust 2005;88:25–36.
Thompson GG, Thompson SA. Using species accumulation curves to estimate trapping effort in fauna surveys and speciesrichness. Austral Ecol in press.
Thompson GG, Withers PC. Effect of species richness and relative abundance on the shape of the species accumulationcurve. Austral Ecol 2003;28:355–60.
Thompson GG, Thompson SA, Withers PC, Pianka ER. Diversity and abundance of pit‐trapped reptiles of arid and mesichabitats in Australia: biodiversity for environmental impact assessments. Pac Conserv Biol 2003;9:120–35.
Thompson GG, Withers PC, Pianka ER, Thompson SA. Assessing biodiversity with species accumulation curves;inventories of small reptiles by pit‐trapping in Western Australia. Austral Ecol 2003;28:361–83.
Thompson SA, Thompson GG, Withers PC. Influence of pit‐trap type on the interpretation of fauna diversity. Wildl Res2005a;32:131–73.
60 G.G. Thompson / Environmental Impact Assessment Review 27 (2007) 41–61

Autho
r's
pers
onal
co
py
Thompson SA, Thompson GG, Withers PC. Catch rates of small vertebrates decrease as the pit‐trapping effort increases atOra Banda. J R Soc West Aust 2005b;88:37–9.
Thompson GG, Thompson SA, Withers PC, Fraser J. Determining adequate trapping effort and species richness usingspecies accumulation curves for environmental impact assessments. Austral Ecol in press.
Wilson GJ, Delahay RJ. A review of methods to estimate the abundance of terrestrial carnivores using field signs andobservation. Wildl Res 2001;28:151–64.
Dr. Graham G. Thompson has a long standing interest in terrestrial fauna, reptile assemblages, Australian varanids andhow body size and shape influences performance traits of reptiles. He has more recently become interested in assessingthe success of mine site rehabilitation programs and developing better terrestrial fauna survey protocols for the purpose ofpreparing EIA.
61G.G. Thompson / Environmental Impact Assessment Review 27 (2007) 41–61