Embed Size (px)
Citation preview
JANUARY 2009—DECEMBER 2009 TEST DATA
Test and Score Data Summary for
TOEFL® Internet-basedand Paper-based Tests
The TOEFL® Test — Quality Beyond Measure
Test and Score DataThis edition of the TOEFL Test and Score Data Summary contains data
on the performance of examinees who took the TOEFL Internet-based
test (TOEFL iBT™) or the TOEFL paper-based test (TOEFL PBT) between
January and December 2009.
www.ets.org/toefl
Test of English as a Foreign LanguageTM
2 ▶▶▶▶▶▶▶▶▶▶▶▶▶▶▶▶▶▶▶▶▶▶▶▶▶▶▶▶▶▶▶▶▶▶▶▶▶▶▶▶▶▶▶▶▶▶▶▶▶▶▶▶▶▶
History of the TOEFL®
Program. . . . . . . . . . . . . . . . . . . . . . . . . . . . . . . . . . . . . . . . . . . . 3
The TOEFL Internet-Based Test (TOEFL iBT™). . . . . . . . . . . . . . . . . . . . . . . . . . . . . . . . . . 4
Internet-Based Test Data for 2009 . . . . . . . . . . . . . . . . . . . . . . . . . . . . . . . . . . . . . . . . . 5Table 1. Observed Minimum and Maximum Scores. . . . . . . . . . . . . . . . . . . . . . . . . . . . . . . . . . . . . 5Table 2. Percentile Ranks – Total Group. . . . . . . . . . . . . . . . . . . . . . . . . . . . . . . . . . . . . . . . . . . . . . 5Table 3. Percentile Ranks – Graduate-Level Students . . . . . . . . . . . . . . . . . . . . . . . . . . . . . . . . . . . 5Table 4. Percentile Ranks – Undergraduate-Level Students . . . . . . . . . . . . . . . . . . . . . . . . . . . . . . 6Table 5. Percentile Ranks – Other Students. . . . . . . . . . . . . . . . . . . . . . . . . . . . . . . . . . . . . . . . . . . 6Table 6. Percentile Ranks – Applicants for Professional License. . . . . . . . . . . . . . . . . . . . . . . . . . . 7Table 7. Means and Standard Deviations – Males. . . . . . . . . . . . . . . . . . . . . . . . . . . . . . . . . . . . . . . 8Table 8. Means and Standard Deviations – Females . . . . . . . . . . . . . . . . . . . . . . . . . . . . . . . . . . . . 8Table 9. Total and Section Score Means – All Examinees by Native Language . . . . . . . . . . . . . . . 9Table 10. Total and Section Score Means – Nonnative English-Speaking Examinees by Geographic Region and Native Country . . . . . . . . . . . . . . . . . . . . . . . . . . . . . . . . . . . . . . . . . . . 10
The TOEFL Paper-Based Test (TOEFL PBT) . . . . . . . . . . . . . . . . . . . . . . . . . . . . . . . . . . 12
Paper-Based Test Data for 2009 . . . . . . . . . . . . . . . . . . . . . . . . . . . . . . . . . . . . . . . . . . 13Table 11. Observed Minimum and Maximum Scores. . . . . . . . . . . . . . . . . . . . . . . . . . . . . . . . . . . . 13Table 12. Percentile Ranks – Total Group. . . . . . . . . . . . . . . . . . . . . . . . . . . . . . . . . . . . . . . . . . . . . 13Table 13. Percentile Ranks – Graduate-Level Students . . . . . . . . . . . . . . . . . . . . . . . . . . . . . . . . . . 13Table 14. Percentile Ranks – Undergraduate-Level Students . . . . . . . . . . . . . . . . . . . . . . . . . . . . . 14Table 15. Percentile Ranks – Other Students. . . . . . . . . . . . . . . . . . . . . . . . . . . . . . . . . . . . . . . . . . 14Table 16. Percentile Ranks – Applicants for Professional License. . . . . . . . . . . . . . . . . . . . . . . . . . 14Table 17. Means and Standard Deviations – Males. . . . . . . . . . . . . . . . . . . . . . . . . . . . . . . . . . . . . . 15Table 18. Means and Standard Deviations – Females . . . . . . . . . . . . . . . . . . . . . . . . . . . . . . . . . . . 15Table 19. Total and Section Score Means – All Examinees by Native Language . . . . . . . . . . . . . . 16Table 20. Total and Section Score Means – All Examinees by Geographic Region and Native Country . . . . . . . . . . . . . . . . . . . . . . . . . . . . . . . . . . . . . . . . . . . . . . . . . . . . . . . 17Table 21. Percentile Ranks for TWE Scores . . . . . . . . . . . . . . . . . . . . . . . . . . . . . . . . . . . . . . . . . . . 18
Table of Contents
Copyright © 2010 by Educational Testing Service. All rights reserved.
ETS, the ETS logos, GRADUATE RECORD EXAMINATIONS, TOEFL, the TOEFL logo, LISTENING. LEARNING. LEADING., and TWE are registered trademarks of Educational Testing Service (ETS) in the United States and other countries. TEST OF ENGLISH AS A FOREIGN LANGUAGE, TEST OF WRITTEN ENGLISH, and TOEFL IBT
are trademarks of ETS. COLLEGE BOARD is a registered trademark of the College Entrance Examination Board.
A single copy of this publication may be downloaded for individual use. No part of this publication may be reproduced or transmitted in any form or by any means without permission in writing from Educational Testing Service, Princeton, NJ, USA. Violators will be prosecuted
in accordance with all applicable copyright and trademark laws.
Permission requests may be made online at www.ets.org or sent to Educational Testing Service, Offi ce of the General Counsel, Attn: Permissions Administrator, Rosedale Road, MS 04C, Princeton, NJ 08541, USA.
For additional information about the Test of English as a Foreign Language™, visit the TOEFL website at www.ets.org/toefl .
3 ▶▶▶▶▶▶▶▶▶▶▶▶▶▶▶▶▶▶▶▶▶▶▶▶▶▶▶▶▶▶▶▶▶▶▶▶▶▶▶▶▶▶▶▶▶▶▶▶▶▶▶▶▶▶
History of the TOEFL® Program
The Test of English as a Foreign Language™, better known as TOEFL®, is designed to measure the English-language profi ciency of people whose native language is not English. TOEFL scores are accepted by more than 7,500 colleges, universities, and licensing agencies in over 130 countries. The test is also used by governments, and scholarship and exchange programs worldwide. A list of institutions and agencies that accept TOEFL scores is available on the TOEFL website atwww.ets.org/toefl .
The TOEFL Program — A national council on the testing of English as a foreign language was formed in 1962; its members were representatives of more than 30 private organizations and government agencies concerned with the English-language profi ciency of nonnative speakers of English who wished to study at colleges and universities in the United States. The council supported the development of the TOEFL test for use starting in 1963-64. Financed by grants fromthe Ford and Danforth Foundations, the TOEFL program was fi rst administered by the Modern Language Association. In 1965, the College Board® and Educational Testing Service® (ETS®) assumed joint responsibility for the program. Because many who take the TOEFL test are potential graduate students, a cooperative arrangement for the operation of the program was entered into by ETS, the College Board, and the Graduate Record Examinations® Board in 1973. Under this arrangement, ETS is responsible for administering the TOEFL program with guidance from the TOEFL Board. The TOEFL Board is comprised of 16 members. Some are affi liated with such institutions and agencies as undergraduate and graduate schools, community col-leges, nonprofi t educational exchange organizations, and other public and private agencies with an interest in international education. Other members are specialists in the fi eld of English as a foreign or second language.
Development of the Test — The test originally contained fi ve sections. As a result of extensive research, a three-section test was developed and introduced in 1976. In July 1995, the test item format was modifi ed somewhat within the same three-section structure. In recent years, various constituencies called for a new TOEFL test that would (1) be more refl ective of communicative compe-tence models; (2) include more constructed-response tasks and direct measures of writing and speaking; (3) include tasks that integrate the language modalities tested; and (4) provide more information than the paper-based TOEFL test (TOEFL PBT) about the ability of international students to use English in an academic environment. Accordingly, the TOEFL Board initiated a broad effort under which language testing will evolve in the twenty-fi rst century. The introduction of the computer-based TOEFL test (TOEFL CBT) in 1998 was the fi rst incremental step in this broad test-improvement effort. The next step was the introduction of an Internet-based version of the TOEFL test (TOEFL iBT) in Sep-tember 2005. TOEFL iBT assesses all four language skills (reading, listening, speaking, and writing) that are important for effective communication. TOEFL iBT emphasizes integrated skills and provides better infor-mation to institutions about students’ ability to com-municate in an academic setting and their readiness for academic coursework. The test was fi rst launched in the United States, and was gradually rolled out worldwide during 2005 and 2006. As TOEFL iBT was introduced in an area, TOEFL CBT was discontinued after a period of overlap to ensure a smooth transition to TOEFL iBT. The fi nal administration of TOEFL CBT was held in September 2006. TOEFL PBT will continue to be offered on a limited basis to support the TOEFL testing network in areas where TOEFL iBT is not available. The TOEFL Test and Score Data Summary contains information about TOEFL iBT and TOEFL PBT test takers.
4 ▶▶▶▶▶▶▶▶▶▶▶▶▶▶▶▶▶▶▶▶▶▶▶▶▶▶▶▶▶▶▶▶▶▶▶▶▶▶▶▶▶▶▶▶▶▶▶▶▶▶▶▶▶▶
The TOEFL Internet-Based Test (TOEFL iBT™)
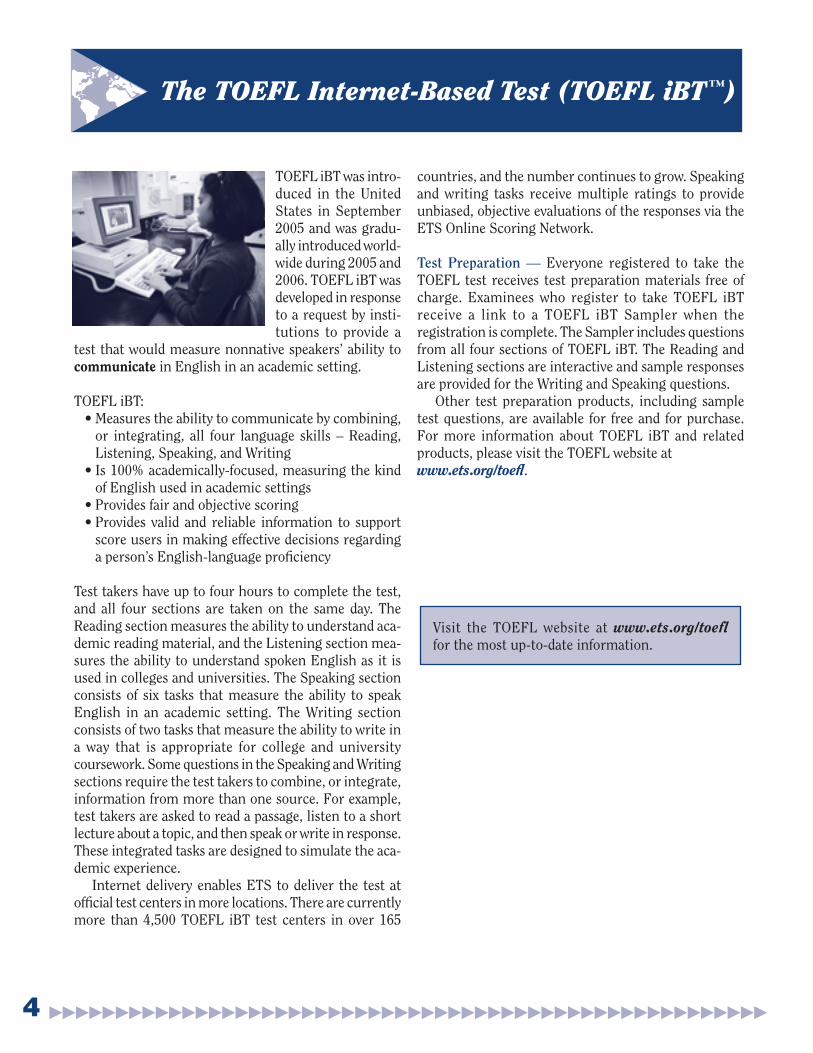
TOEFL iBT was intro-duced in the United States in September 2005 and was gradu-ally introduced world-wide during 2005 and 2006. TOEFL iBT was developed in response to a request by insti-tutions to provide a
test that would measure nonnative speakers’ ability to communicate in English in an academic setting.
TOEFL iBT:• Measures the ability to communicate by combining,
or integrating, all four language skills – Reading, Listening, Speaking, and Writing
• Is 100% academically-focused, measuring the kind of English used in academic settings
• Provides fair and objective scoring• Provides valid and reliable information to support
score users in making effective decisions regarding a person’s English-language profi ciency
Test takers have up to four hours to complete the test, and all four sections are taken on the same day. The Reading section measures the ability to understand aca-demic reading material, and the Listening section mea-sures the ability to understand spoken English as it is used in colleges and universities. The Speaking section consists of six tasks that measure the ability to speak English in an academic setting. The Writing section consists of two tasks that measure the ability to write in a way that is appropriate for college and university coursework. Some questions in the Speaking and Writing sections require the test takers to combine, or integrate, information from more than one source. For example, test takers are asked to read a passage, listen to a short lecture about a topic, and then speak or write in response. These integrated tasks are designed to simulate the aca-demic experience.
Internet delivery enables ETS to deliver the test at offi cial test centers in more locations. There are currently more than 4,500 TOEFL iBT test centers in over 165
countries, and the number continues to grow. Speaking and writing tasks receive multiple ratings to provide unbiased, objective evaluations of the responses via the ETS Online Scoring Network.
Test Preparation — Everyone registered to take the TOEFL test receives test preparation materials free of charge. Examinees who register to take TOEFL iBT receive a link to a TOEFL iBT Sampler when the registration is complete. The Sampler includes questions from all four sections of TOEFL iBT. The Reading and Listening sections are interactive and sample responses are provided for the Writing and Speaking questions.
Other test preparation products, including sample test questions, are available for free and for purchase. For more information about TOEFL iBT and related products, please visit the TOEFL website at www.ets.org/toefl .
Visit the TOEFL website at www.ets.org/toefl for the most up-to-date information.

5 ▶▶▶▶▶▶▶▶▶▶▶▶▶▶▶▶▶▶▶▶▶▶▶▶▶▶▶▶▶▶▶▶▶▶▶▶▶▶▶▶▶▶▶▶▶▶▶▶▶▶▶▶▶▶
Internet-Based Test Data for 2009
The data presented in the tables below are based on examinees who took the TOEFL iBT between January 2009 and December 2009. Table 1 gives actual ranges of observed scores for the period from January 2009 and December 2009.
The percentile ranks for section and total scale scores are shown in Table 2 for the total group. In Tables 3–6, examinees have been classifi ed by their reason for taking the test.
Table 1. Observed Minimum and MaximumTOEFL iBT Section and Total Scores
Section Min. Max.
1. Reading
2. Listening
3. Speaking
4. Writing
0
0
0
0
30
30
30
30
Total 0 120
Table 2. Percentile Ranks for TOEFL iBT Scores—
Total Group
Sca
le S
core
Readin
g
Lis
tenin
g
Speaki
ng
Wri
ting
Tota
l S
cale
Sco
re
Perc
enti
le R
ank
3029282726252423222120191817161514131211109876543210
9689837772666156514642383430262321181613121087643221
979085797469645954504541373329262320171513119765321
9998969288**817160**50392920**1275
**3221
**11
99969286**7768**564533**2518**138
**532
**11
12011611210810410096928884807672686460565248444036322824201612840
10099969287817467595245393328231915129754211
MeanS.D.
19.97.5
19.47.6
19.74.7
20.55.0
MeanS.D.
7922
**Indicates a non-existent scale score for Speaking and Writing.
Table 3. Percentile Ranks for TOEFL iBT Scores—
Graduate-Level Students*S
cale
Sco
re
Readin
g
Lis
tenin
g
Speaki
ng
Wri
ting
Tota
l S
cale
Sco
re
Perc
enti
le R
ank
3029282726252423222120191817161514131211109876543210
948679736761555045403531282421181513119865443211
958780746862575247423733292622191714121097644321
9997949084**766554**44342516**953
**2111
98959083**7363**514028**2014**96
**321
12011611210810410096928884807672686460565248444036322824201612840
100989489827568605346393226211713108643211
MeanS.D.
21.17.0
20.87.1
20.44.5
21.34.8
MeanS.D.
8420
*Based on examinees who indicated that they were applying for admission to colleges or universities as graduate students.
**Indicates a non-existent scale score for Speaking and Writing.
6 ▶▶▶▶▶▶▶▶▶▶▶▶▶▶▶▶▶▶▶▶▶▶▶▶▶▶▶▶▶▶▶▶▶▶▶▶▶▶▶▶▶▶▶▶▶▶▶▶▶▶▶▶▶▶
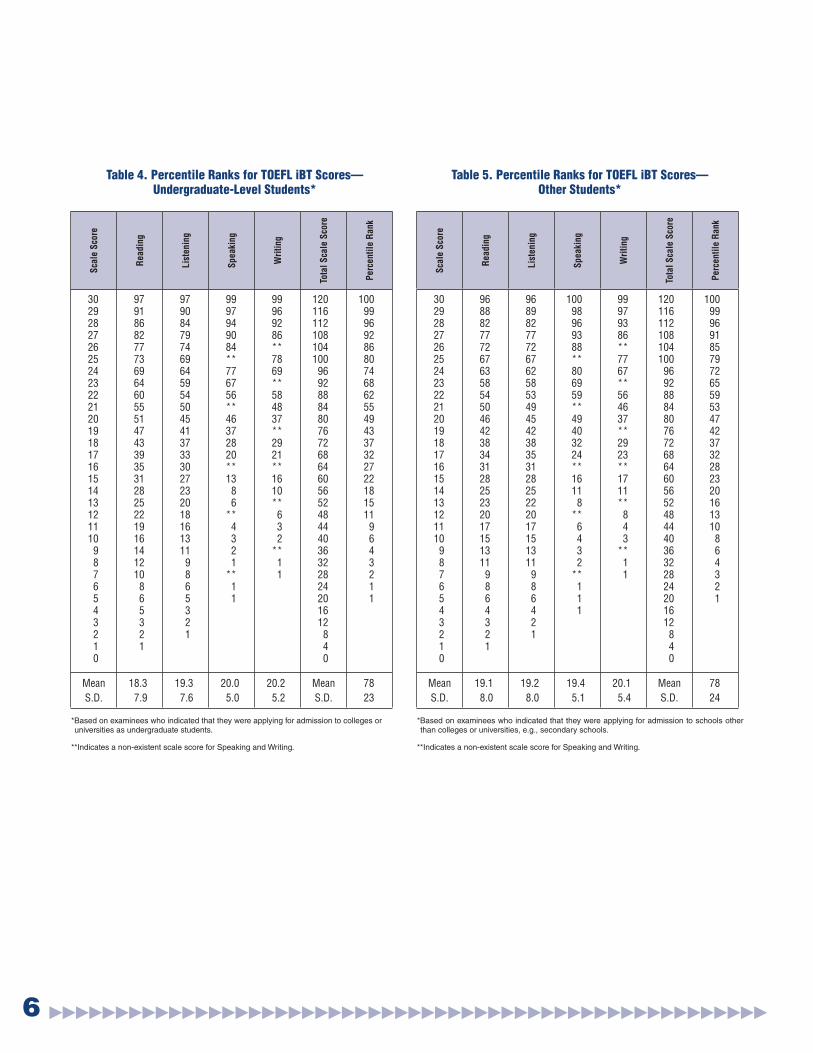
Table 4. Percentile Ranks for TOEFL iBT Scores—Undergraduate-Level Students*
Sca
le S
core
Readin
g
Lis
tenin
g
Speaki
ng
Wri
ting
Tota
l S
cale
Sco
re
Perc
enti
le R
ank
3029282726252423222120191817161514131211109876543210
979186827773696460555147433935312825221916141210865321
979084797469645954504541373330272320181613119865321
9997949084**776756**46372820**1386
**4321
**11
99969286**7869**584837**2921**1610**632
**11
12011611210810410096928884807672686460565248444036322824201612840
1009996928680746862554943373227221815119643211
Mean
S.D.
18.3
7.9
19.3
7.6
20.0
5.0
20.2
5.2
Mean
S.D.
78
23
*Based on examinees who indicated that they were applying for admission to colleges or universities as undergraduate students.
**Indicates a non-existent scale score for Speaking and Writing.
Table 5. Percentile Ranks for TOEFL iBT Scores—Other Students*
Sca
le S
core
Readin
g
Lis
tenin
g
Speaki
ng
Wri
ting
Tota
l S
cale
Sco
re
Perc
enti
le R
ank
3029282726252423222120191817161514131211109876543210
96888277726763585450464238343128252320171513119864321
9689827772676258534945423835312825222017151311986421
10098969388**806959**49403224**16118
**6432
**111
99979386**7767**564637**2923**1711**843
**11
12011611210810410096928884807672686460565248444036322824201612840
10099969185797265595347423732282320161310864321
Mean
S.D.
19.1
8.0
19.2
8.0
19.4
5.1
20.1
5.4
Mean
S.D.
78
24
*Based on examinees who indicated that they were applying for admission to schools other than colleges or universities, e.g., secondary schools.
**Indicates a non-existent scale score for Speaking and Writing.
7 ▶▶▶▶▶▶▶▶▶▶▶▶▶▶▶▶▶▶▶▶▶▶▶▶▶▶▶▶▶▶▶▶▶▶▶▶▶▶▶▶▶▶▶▶▶▶▶▶▶▶▶▶▶▶
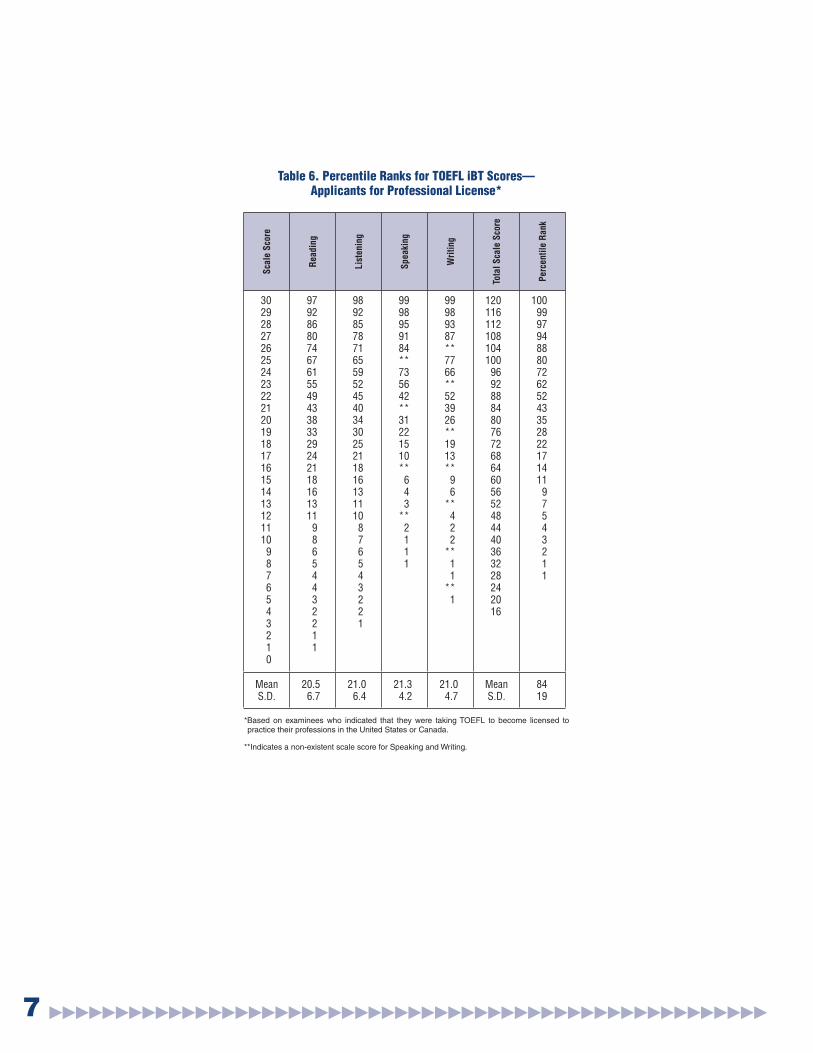
Table 6. Percentile Ranks for TOEFL iBT Scores—Applicants for Professional License*
Sca
le S
core
Readin
g
Lis
tenin
g
Speaki
ng
Wri
ting
Tota
l S
cale
Sco
re
Perc
enti
le R
ank
3029282726252423222120191817161514131211109876543210
9792868074676155494338332924211816131198654432211
98928578716559524540343025211816131110876543221
9998959184**735642**31221510**643
**2111
99989387**7766**523926**1913**96
**422
**11
**1
120116112108104100969288848076726864605652484440363228242016
10099979488807262524335282217141197543211
MeanS.D.
20.56.7
21.06.4
21.34.2
21.04.7
MeanS.D.
8419
*Based on examinees who indicated that they were taking TOEFL to become licensed to practice their professions in the United States or Canada.
**Indicates a non-existent scale score for Speaking and Writing.
8 ▶▶▶▶▶▶▶▶▶▶▶▶▶▶▶▶▶▶▶▶▶▶▶▶▶▶▶▶▶▶▶▶▶▶▶▶▶▶▶▶▶▶▶▶▶▶▶▶▶▶▶▶▶▶
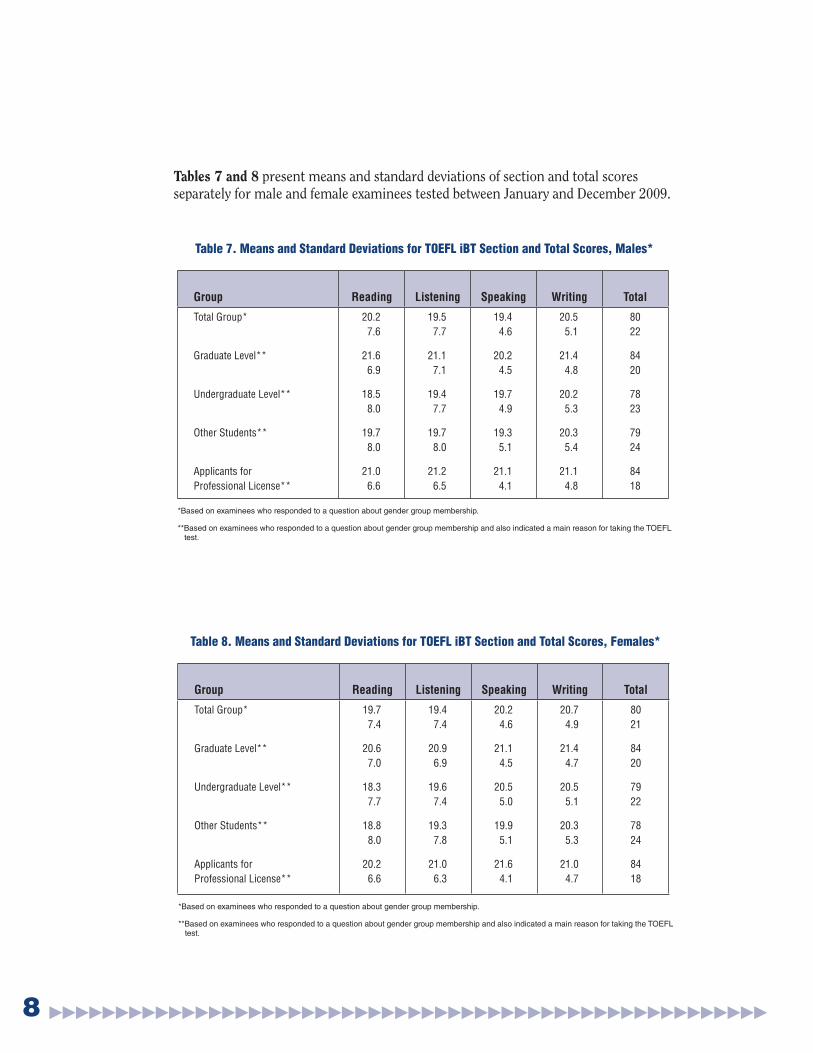
Tables 7 and 8 present means and standard deviations of section and total scores separately for male and female examinees tested between January and December 2009.
Table 7. Means and Standard Deviations for TOEFL iBT Section and Total Scores, Males*
Group Reading Listening Speaking Writing Total
Total Group*
Graduate Level**
Undergraduate Level**
Other Students**
Applicants for
Professional License**
20.2
7.6
21.6
6.9
18.5
8.0
19.7
8.0
21.0
6.6
19.5
7.7
21.1
7.1
19.4
7.7
19.7
8.0
21.2
6.5
19.4
4.6
20.2
4.5
19.7
4.9
19.3
5.1
21.1
4.1
20.5
5.1
21.4
4.8
20.2
5.3
20.3
5.4
21.1
4.8
80
22
84
20
78
23
79
24
84
18
*Based on examinees who responded to a question about gender group membership.
**Based on examinees who responded to a question about gender group membership and also indicated a main reason for taking the TOEFL test.
Table 8. Means and Standard Deviations for TOEFL iBT Section and Total Scores, Females*
Group Reading Listening Speaking Writing Total
Total Group*
Graduate Level**
Undergraduate Level**
Other Students**
Applicants for
Professional License**
19.7
7.4
20.6
7.0
18.3
7.7
18.8
8.0
20.2
6.6
19.4
7.4
20.9
6.9
19.6
7.4
19.3
7.8
21.0
6.3
20.2
4.6
21.1
4.5
20.5
5.0
19.9
5.1
21.6
4.1
20.7
4.9
21.4
4.7
20.5
5.1
20.3
5.3
21.0
4.7
80
21
84
20
79
22
78
24
84
18
*Based on examinees who responded to a question about gender group membership.
**Based on examinees who responded to a question about gender group membership and also indicated a main reason for taking the TOEFL test.
9 ▶▶▶▶▶▶▶▶▶▶▶▶▶▶▶▶▶▶▶▶▶▶▶▶▶▶▶▶▶▶▶▶▶▶▶▶▶▶▶▶▶▶▶▶▶▶▶▶▶▶▶▶▶▶
Native LanguageNative Language Readin
g
Lis
tenin
g
Speaki
ng
Wri
ting
Tota
l
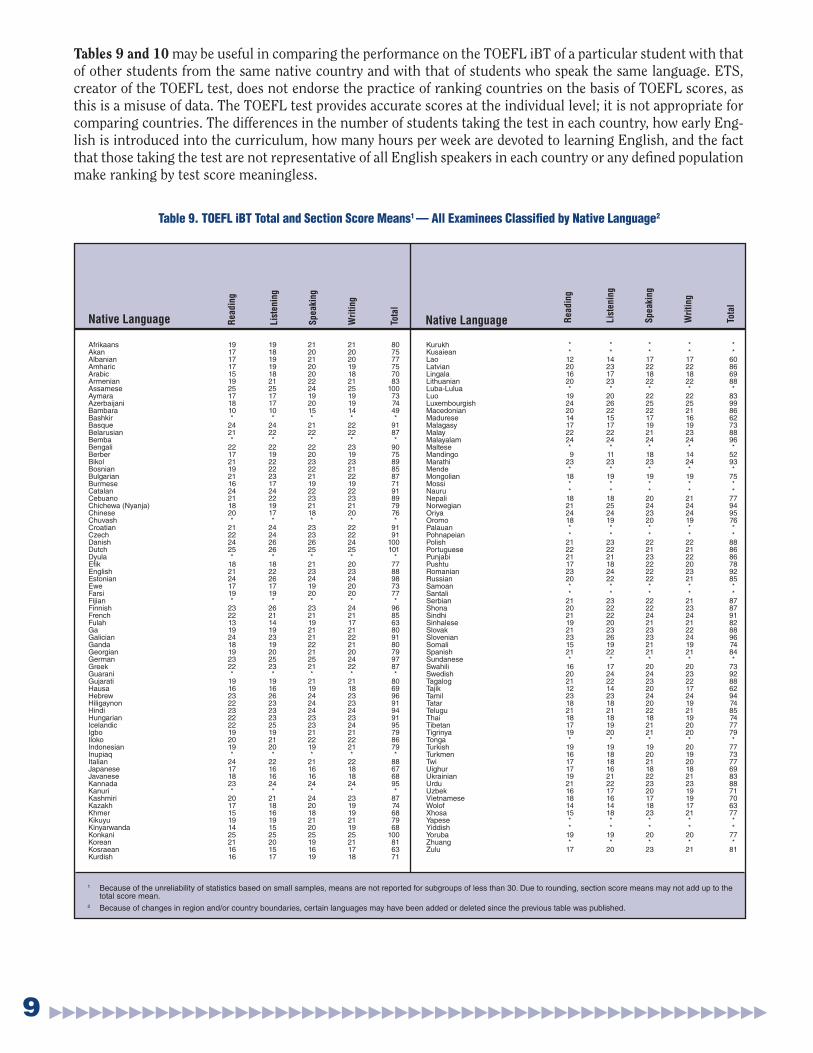
Table 9. TOEFL iBT Total and Section Score Means1 — All Examinees Classifi ed by Native Language2
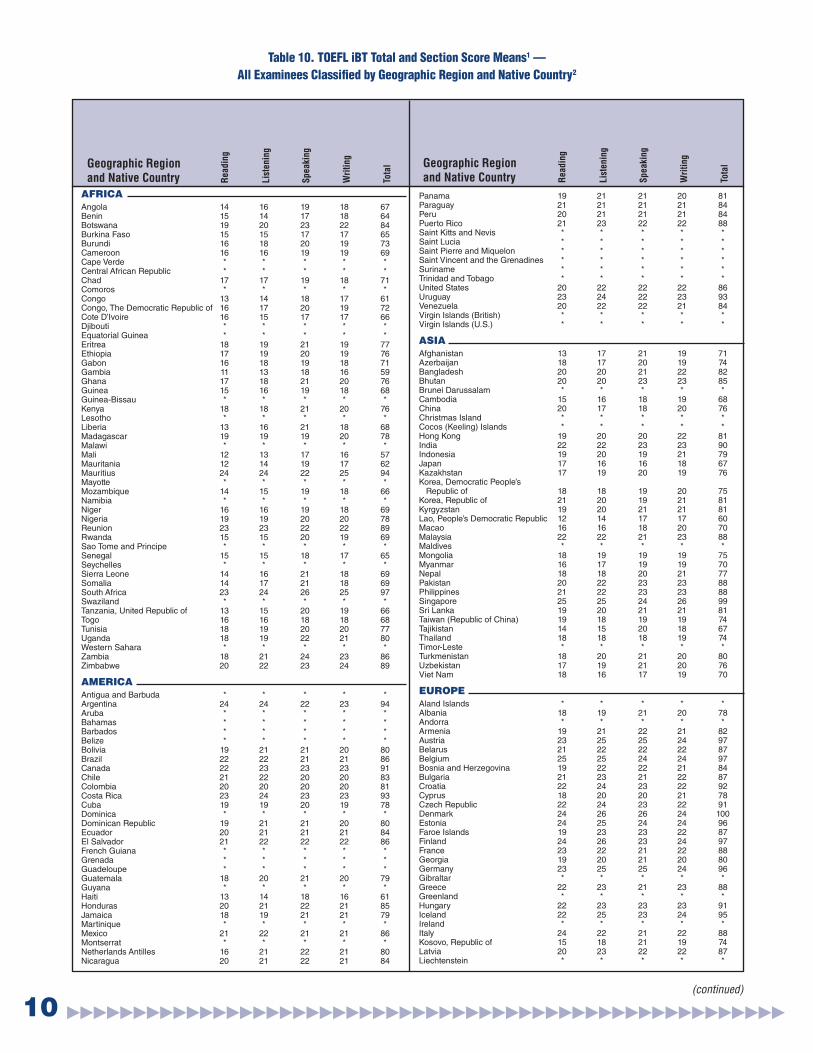
Tables 9 and 10 may be useful in comparing the performance on the TOEFL iBT of a particular student with that of other students from the same native country and with that of students who speak the same language. ETS, creator of the TOEFL test, does not endorse the practice of ranking countries on the basis of TOEFL scores, as this is a misuse of data. The TOEFL test provides accurate scores at the individual level; it is not appropriate for comparing countries. The differences in the number of students taking the test in each country, how early Eng-lish is introduced into the curriculum, how many hours per week are devoted to learning English, and the fact that those taking the test are not representative of all English speakers in each country or any defi ned population make ranking by test score meaningless.
Readin
g
Lis
tenin
g
Speaki
ng
Wri
ting
Tota
l
1 Because of the unreliability of statistics based on small samples, means are not reported for subgroups of less than 30. Due to rounding, section score means may not add up to the total score mean.
2 Because of changes in region and/or country boundaries, certain languages may have been added or deleted since the previous table was published.
Afrikaans 19 19 21 21 80Akan 17 18 20 20 75Albanian 17 19 21 20 77Amharic 17 19 20 19 75Arabic 15 18 20 18 70Armenian 19 21 22 21 83Assamese 25 25 24 25 100Aymara 17 17 19 19 73Azerbaijani 18 17 20 19 74Bambara 10 10 15 14 49Bashkir * * * * *Basque 24 24 21 22 91Belarusian 21 22 22 22 87Bemba * * * * *Bengali 22 22 22 23 90Berber 17 19 20 19 75Bikol 21 22 23 23 89Bosnian 19 22 22 21 85Bulgarian 21 23 21 22 87Burmese 16 17 19 19 71Catalan 24 24 22 22 91Cebuano 21 22 23 23 89Chichewa (Nyanja) 18 19 21 21 79Chinese 20 17 18 20 76Chuvash * * * * *Croatian 21 24 23 22 91Czech 22 24 23 22 91Danish 24 26 26 24 100Dutch 25 26 25 25 101Dyula * * * * *Efi k 18 18 21 20 77English 21 22 23 23 88Estonian 24 26 24 24 98Ewe 17 17 19 20 73Farsi 19 19 20 20 77Fijian * * * * *Finnish 23 26 23 24 96French 22 21 21 21 85Fulah 13 14 19 17 63Ga 19 19 21 21 80Galician 24 23 21 22 91Ganda 18 19 22 21 80Georgian 19 20 21 20 79German 23 25 25 24 97Greek 22 23 21 22 87Guarani * * * * *Gujarati 19 19 21 21 80Hausa 16 16 19 18 69Hebrew 23 26 24 23 96Hiligaynon 22 23 24 23 91Hindi 23 23 24 24 94Hungarian 22 23 23 23 91Icelandic 22 25 23 24 95Igbo 19 19 21 21 79Iloko 20 21 22 22 86Indonesian 19 20 19 21 79Inupiaq * * * * *Italian 24 22 21 22 88Japanese 17 16 16 18 67Javanese 18 16 16 18 68Kannada 23 24 24 24 95Kanuri * * * * *Kashmiri 20 21 24 23 87Kazakh 17 18 20 19 74Khmer 15 16 18 19 68Kikuyu 19 19 21 21 79Kinyarwanda 14 15 20 19 68Konkani 25 25 25 25 100Korean 21 20 19 21 81Kosraean 16 15 16 17 63Kurdish 16 17 19 18 71
Kurukh * * * * *Kusaiean * * * * *Lao 12 14 17 17 60Latvian 20 23 22 22 86Lingala 16 17 18 18 69Lithuanian 20 23 22 22 88Luba-Lulua * * * * *Luo 19 20 22 22 83Luxembourgish 24 26 25 25 99Macedonian 20 22 22 21 86Madurese 14 15 17 16 62Malagasy 17 17 19 19 73Malay 22 22 21 23 88Malayalam 24 24 24 24 96Maltese * * * * *Mandingo 9 11 18 14 52Marathi 23 23 23 24 93Mende * * * * *Mongolian 18 19 19 19 75Mossi * * * * *Nauru * * * * *Nepali 18 18 20 21 77Norwegian 21 25 24 24 94Oriya 24 24 23 24 95Oromo 18 19 20 19 76Palauan * * * * *Pohnapeian * * * * *Polish 21 23 22 22 88Portuguese 22 22 21 21 86Punjabi 21 21 23 22 86Pushtu 17 18 22 20 78Romanian 23 24 22 23 92Russian 20 22 22 21 85Samoan * * * * *Santali * * * * *Serbian 21 23 22 21 87Shona 20 22 22 23 87Sindhi 21 22 24 24 91Sinhalese 19 20 21 21 82Slovak 21 23 23 22 88Slovenian 23 26 23 24 96Somali 15 19 21 19 74Spanish 21 22 21 21 84Sundanese * * * * *Swahili 16 17 20 20 73Swedish 20 24 24 23 92Tagalog 21 22 23 22 88Tajik 12 14 20 17 62Tamil 23 23 24 24 94Tatar 18 18 20 19 74Telugu 21 21 22 21 85Thai 18 18 18 19 74Tibetan 17 19 21 20 77Tigrinya 19 20 21 20 79Tonga * * * * *Turkish 19 19 19 20 77Turkmen 16 18 20 19 73Twi 17 18 21 20 77Uighur 17 16 18 18 69Ukrainian 19 21 22 21 83Urdu 21 22 23 23 88Uzbek 16 17 20 19 71Vietnamese 18 16 17 19 70Wolof 14 14 18 17 63Xhosa 15 18 23 21 77Yapese * * * * *Yiddish * * * * *Yoruba 19 19 20 20 77Zhuang * * * * *Zulu 17 20 23 21 81
10 ▶▶▶▶▶▶▶▶▶▶▶▶▶▶▶▶▶▶▶▶▶▶▶▶▶▶▶▶▶▶▶▶▶▶▶▶▶▶▶▶▶▶▶▶▶▶▶▶▶▶▶▶▶▶
(continued)
Geographic Region
and Native CountryGeographic Region
and Native Country
Table 10. TOEFL iBT Total and Section Score Means1 —
All Examinees Classifi ed by Geographic Region and Native Country2
AFRICAAngola 14 16 19 18 67Benin 15 14 17 18 64Botswana 19 20 23 22 84Burkina Faso 15 15 17 17 65Burundi 16 18 20 19 73Cameroon 16 16 19 19 69Cape Verde * * * * *Central African Republic * * * * *Chad 17 17 19 18 71Comoros * * * * *Congo 13 14 18 17 61Congo, The Democratic Republic of 16 17 20 19 72Cote D’Ivoire 16 15 17 17 66Djibouti * * * * *Equatorial Guinea * * * * *Eritrea 18 19 21 19 77Ethiopia 17 19 20 19 76Gabon 16 18 19 18 71Gambia 11 13 18 16 59Ghana 17 18 21 20 76Guinea 15 16 19 18 68Guinea-Bissau * * * * *Kenya 18 18 21 20 76Lesotho * * * * *Liberia 13 16 21 18 68Madagascar 19 19 19 20 78Malawi * * * * *Mali 12 13 17 16 57Mauritania 12 14 19 17 62Mauritius 24 24 22 25 94Mayotte * * * * *Mozambique 14 15 19 18 66Namibia * * * * *Niger 16 16 19 18 69Nigeria 19 19 20 20 78Reunion 23 23 22 22 89Rwanda 15 15 20 19 69Sao Tome and Principe * * * * *Senegal 15 15 18 17 65Seychelles * * * * *Sierra Leone 14 16 21 18 69Somalia 14 17 21 18 69South Africa 23 24 26 25 97Swaziland * * * * *Tanzania, United Republic of 13 15 20 19 66Togo 16 16 18 18 68Tunisia 18 19 20 20 77Uganda 18 19 22 21 80Western Sahara * * * * *Zambia 18 21 24 23 86Zimbabwe 20 22 23 24 89
AMERICAAntigua and Barbuda * * * * *Argentina 24 24 22 23 94Aruba * * * * *Bahamas * * * * *Barbados * * * * *Belize * * * * *Bolivia 19 21 21 20 80Brazil 22 22 21 21 86Canada 22 23 23 23 91Chile 21 22 20 20 83Colombia 20 20 20 20 81Costa Rica 23 24 23 23 93Cuba 19 19 20 19 78Dominica * * * * *Dominican Republic 19 21 21 20 80Ecuador 20 21 21 21 84El Salvador 21 22 22 22 86French Guiana * * * * *Grenada * * * * *Guadeloupe * * * * *Guatemala 18 20 21 20 79Guyana * * * * *Haiti 13 14 18 16 61Honduras 20 21 22 21 85Jamaica 18 19 21 21 79Martinique * * * * *Mexico 21 22 21 21 86Montserrat * * * * *Netherlands Antilles 16 21 22 21 80Nicaragua 20 21 22 21 84
Panama 19 21 21 20 81Paraguay 21 21 21 21 84Peru 20 21 21 21 84Puerto Rico 21 23 22 22 88Saint Kitts and Nevis * * * * *Saint Lucia * * * * *Saint Pierre and Miquelon * * * * *Saint Vincent and the Grenadines * * * * *Suriname * * * * *Trinidad and Tobago * * * * *United States 20 22 22 22 86Uruguay 23 24 22 23 93Venezuela 20 22 22 21 84Virgin Islands (British) * * * * *Virgin Islands (U.S.) * * * * *
ASIAAfghanistan 13 17 21 19 71Azerbaijan 18 17 20 19 74Bangladesh 20 20 21 22 82Bhutan 20 20 23 23 85Brunei Darussalam * * * * *Cambodia 15 16 18 19 68China 20 17 18 20 76Christmas Island * * * * *Cocos (Keeling) Islands * * * * *Hong Kong 19 20 20 22 81India 22 22 23 23 90Indonesia 19 20 19 21 79Japan 17 16 16 18 67Kazakhstan 17 19 20 19 76Korea, Democratic People’s Republic of 18 18 19 20 75Korea, Republic of 21 20 19 21 81Kyrgyzstan 19 20 21 21 81Lao, People’s Democratic Republic 12 14 17 17 60Macao 16 16 18 20 70Malaysia 22 22 21 23 88Maldives * * * * *Mongolia 18 19 19 19 75Myanmar 16 17 19 19 70Nepal 18 18 20 21 77Pakistan 20 22 23 23 88Philippines 21 22 23 23 88Singapore 25 25 24 26 99Sri Lanka 19 20 21 21 81Taiwan (Republic of China) 19 18 19 19 74Tajikistan 14 15 20 18 67Thailand 18 18 18 19 74Timor-Leste * * * * *Turkmenistan 18 20 21 20 80Uzbekistan 17 19 21 20 76Viet Nam 18 16 17 19 70
EUROPEAland Islands * * * * *Albania 18 19 21 20 78Andorra * * * * *Armenia 19 21 22 21 82Austria 23 25 25 24 97Belarus 21 22 22 22 87Belgium 25 25 24 24 97Bosnia and Herzegovina 19 22 22 21 84Bulgaria 21 23 21 22 87Croatia 22 24 23 22 92Cyprus 18 20 20 21 78Czech Republic 22 24 23 22 91Denmark 24 26 26 24 100Estonia 24 25 24 24 96Faroe Islands 19 23 23 22 87Finland 24 26 23 24 97France 23 22 21 22 88Georgia 19 20 21 20 80Germany 23 25 25 24 96Gibraltar * * * * *Greece 22 23 21 23 88Greenland * * * * *Hungary 22 23 23 23 91Iceland 22 25 23 24 95Ireland * * * * *Italy 24 22 21 22 88Kosovo, Republic of 15 18 21 19 74Latvia 20 23 22 22 87Liechtenstein * * * * *
Readin
g
Lis
tenin
g
Speaki
ng
Wri
ting
Tota
l
Readin
g
Lis
tenin
g
Speaki
ng
Wri
ting
Tota
l
11 ▶▶▶▶▶▶▶▶▶▶▶▶▶▶▶▶▶▶▶▶▶▶▶▶▶▶▶▶▶▶▶▶▶▶▶▶▶▶▶▶▶▶▶▶▶▶▶▶▶▶▶▶▶▶
Geographic Region
and Native CountryGeographic Region
and Native Country Readin
g
Lis
tenin
g
Speaki
ng
Wri
ting
Tota
l
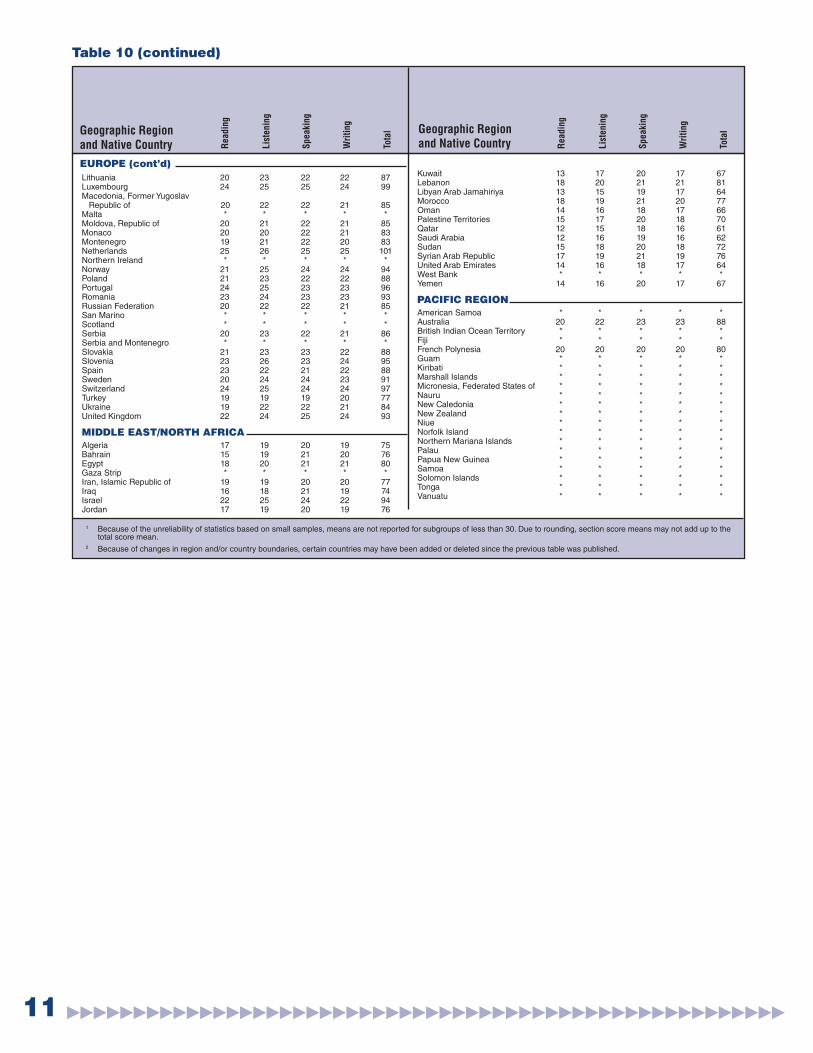
Table 10 (continued)
EUROPE (cont’d)
1 Because of the unreliability of statistics based on small samples, means are not reported for subgroups of less than 30. Due to rounding, section score means may not add up to the total score mean.
2 Because of changes in region and/or country boundaries, certain countries may have been added or deleted since the previous table was published.
Lithuania 20 23 22 22 87Luxembourg 24 25 25 24 99Macedonia, Former Yugoslav Republic of 20 22 22 21 85Malta * * * * *Moldova, Republic of 20 21 22 21 85Monaco 20 20 22 21 83Montenegro 19 21 22 20 83Netherlands 25 26 25 25 101Northern Ireland * * * * *Norway 21 25 24 24 94Poland 21 23 22 22 88Portugal 24 25 23 23 96Romania 23 24 23 23 93Russian Federation 20 22 22 21 85San Marino * * * * *Scotland * * * * *Serbia 20 23 22 21 86Serbia and Montenegro * * * * *Slovakia 21 23 23 22 88Slovenia 23 26 23 24 95Spain 23 22 21 22 88Sweden 20 24 24 23 91Switzerland 24 25 24 24 97Turkey 19 19 19 20 77Ukraine 19 22 22 21 84United Kingdom 22 24 25 24 93
MIDDLE EAST/NORTH AFRICA Algeria 17 19 20 19 75Bahrain 15 19 21 20 76Egypt 18 20 21 21 80Gaza Strip * * * * *Iran, Islamic Republic of 19 19 20 20 77Iraq 16 18 21 19 74Israel 22 25 24 22 94Jordan 17 19 20 19 76
Kuwait 13 17 20 17 67Lebanon 18 20 21 21 81Libyan Arab Jamahiriya 13 15 19 17 64Morocco 18 19 21 20 77Oman 14 16 18 17 66Palestine Territories 15 17 20 18 70Qatar 12 15 18 16 61Saudi Arabia 12 16 19 16 62Sudan 15 18 20 18 72Syrian Arab Republic 17 19 21 19 76United Arab Emirates 14 16 18 17 64West Bank * * * * *Yemen 14 16 20 17 67
PACIFIC REGIONAmerican Samoa * * * * *Australia 20 22 23 23 88British Indian Ocean Territory * * * * *Fiji * * * * *French Polynesia 20 20 20 20 80Guam * * * * *Kiribati * * * * *Marshall Islands * * * * *Micronesia, Federated States of * * * * *Nauru * * * * *New Caledonia * * * * *New Zealand * * * * *Niue * * * * *Norfolk Island * * * * *Northern Mariana Islands * * * * *Palau * * * * *Papua New Guinea * * * * *Samoa * * * * *Solomon Islands * * * * *Tonga * * * * *Vanuatu * * * * *
Readin
g
Lis
tenin
g
Speaki
ng
Wri
ting
Tota
l
12 ▶▶▶▶▶▶▶▶▶▶▶▶▶▶▶▶▶▶▶▶▶▶▶▶▶▶▶▶▶▶▶▶▶▶▶▶▶▶▶▶▶▶▶▶▶▶▶▶▶▶▶▶▶▶
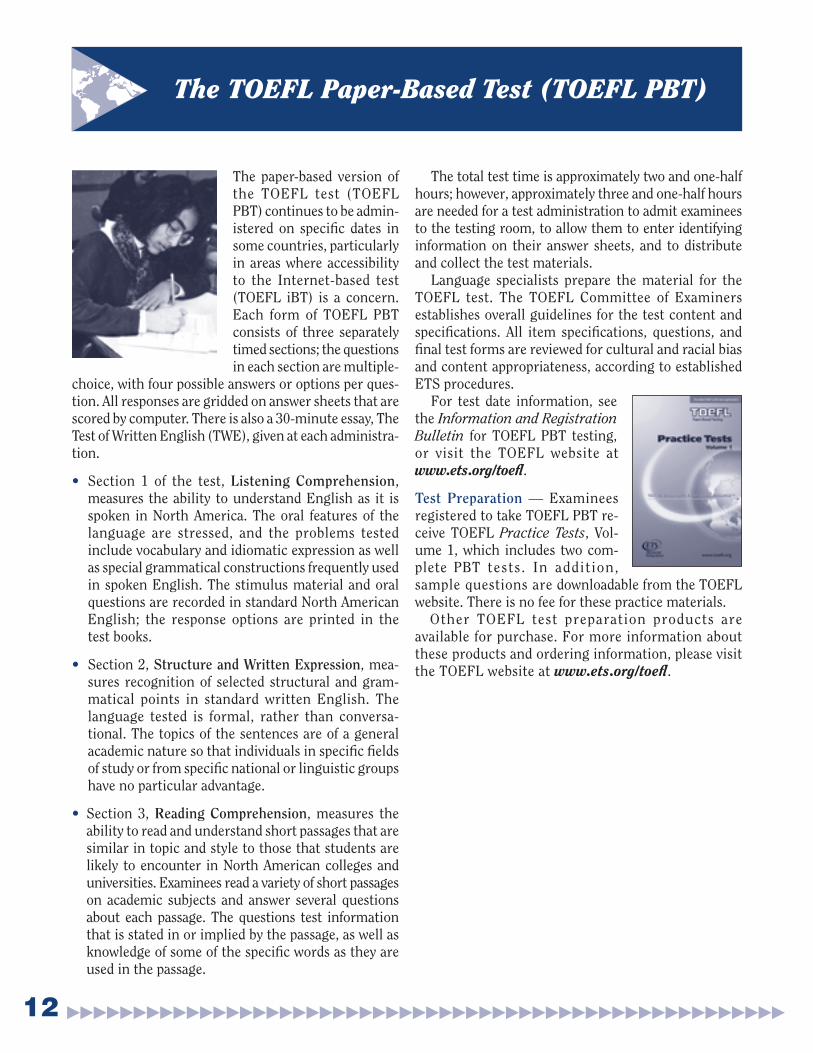
The TOEFL Paper-Based Test (TOEFL PBT)
The paper-based version of the TOEFL test (TOEFL PBT) continues to be admin-istered on specifi c dates in some countries, particularly in areas where accessibility to the Internet-based test (TOEFL iBT) is a concern. Each form of TOEFL PBT consists of three separately timed sections; the questions in each section are multiple-
choice, with four possible answers or options per ques-tion. All responses are gridded on answer sheets that are scored by computer. There is also a 30-minute essay, The Test of Written English (TWE), given at each administra-tion.
• Section 1 of the test, Listening Comprehension,measures the ability to understand English as it is spoken in North America. The oral features of the language are stressed, and the problems tested include vocabulary and idiomatic expression as well as special grammatical constructions frequently used in spoken English. The stimulus material and oral questions are recorded in standard North American English; the response options are printed in the test books.
• Section 2, Structure and Written Expression, mea-sures recognition of selected structural and gram-matical points in standard written English. The language tested is formal, rather than conversa-tional. The topics of the sentences are of a general academic nature so that individuals in specifi c fi elds of study or from specifi c national or linguistic groups have no particular advantage.
• Section 3, Reading Comprehension, measures the ability to read and understand short passages that are similar in topic and style to those that students are likely to encounter in North American colleges and universities. Examinees read a variety of short passages on academic subjects and answer several questions about each passage. The questions test information that is stated in or implied by the passage, as well as knowledge of some of the specifi c words as they are used in the passage.
The total test time is approximately two and one-half hours; however, approximately three and one-half hours are needed for a test administration to admit examinees to the testing room, to allow them to enter identifying information on their answer sheets, and to distribute and collect the test materials. Language specialists prepare the material for the TOEFL test. The TOEFL Committee of Examiners establishes overall guidelines for the test content and specifi cations. All item specifi cations, questions, and fi nal test forms are reviewed for cultural and racial bias and content appropriateness, according to established ETS procedures. For test date information, see the Information and Registration Bulletin for TOEFL PBT testing, or visit the TOEFL website at www.ets.org/toefl .
Test Preparation — Examinees registered to take TOEFL PBT re-ceive TOEFL Practice Tests, Vol-ume 1, which includes two com-plete PBT tests. In addition, sample questions are downloadable from the TOEFL website. There is no fee for these practice materials. Other TOEFL test preparation products are available for purchase. For more information about these products and ordering information, please visit the TOEFL website at www.ets.org/toefl .
13 ▶▶▶▶▶▶▶▶▶▶▶▶▶▶▶▶▶▶▶▶▶▶▶▶▶▶▶▶▶▶▶▶▶▶▶▶▶▶▶▶▶▶▶▶▶▶▶▶▶▶▶▶▶▶
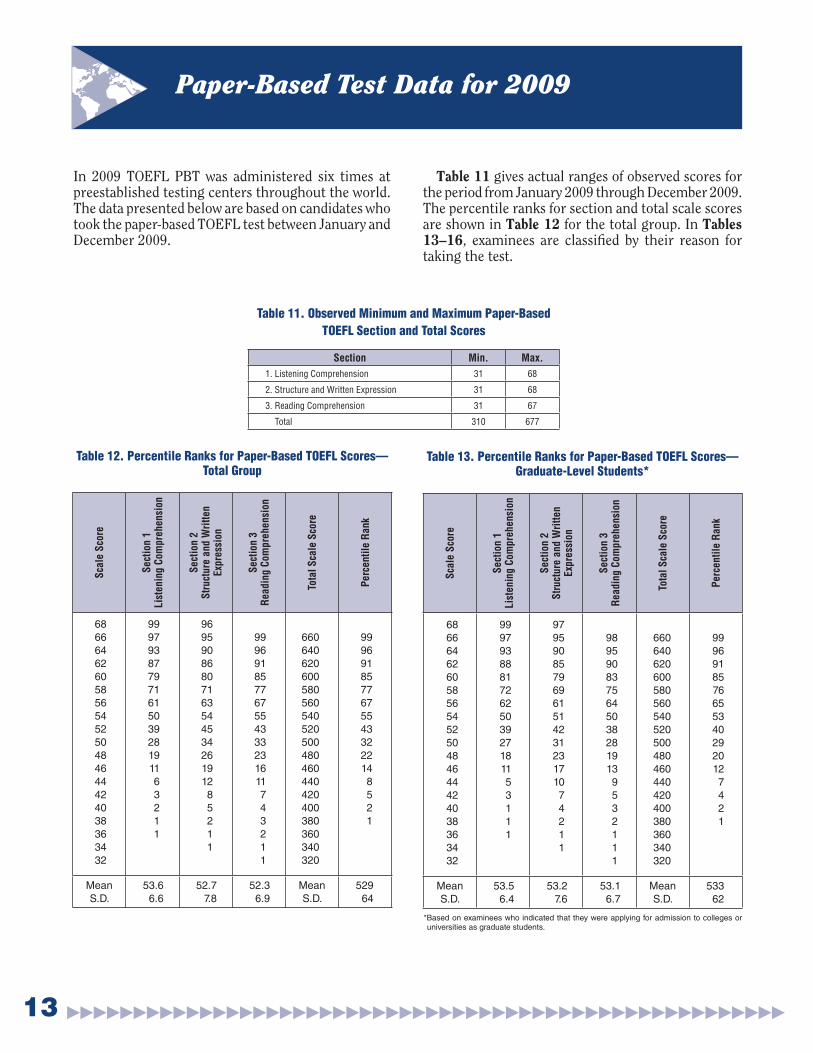
Paper-Based Test Data for 2009
In 2009 TOEFL PBT was administered six times at preestablished testing centers throughout the world. The data presented below are based on candidates who took the paper-based TOEFL test between January and December 2009.
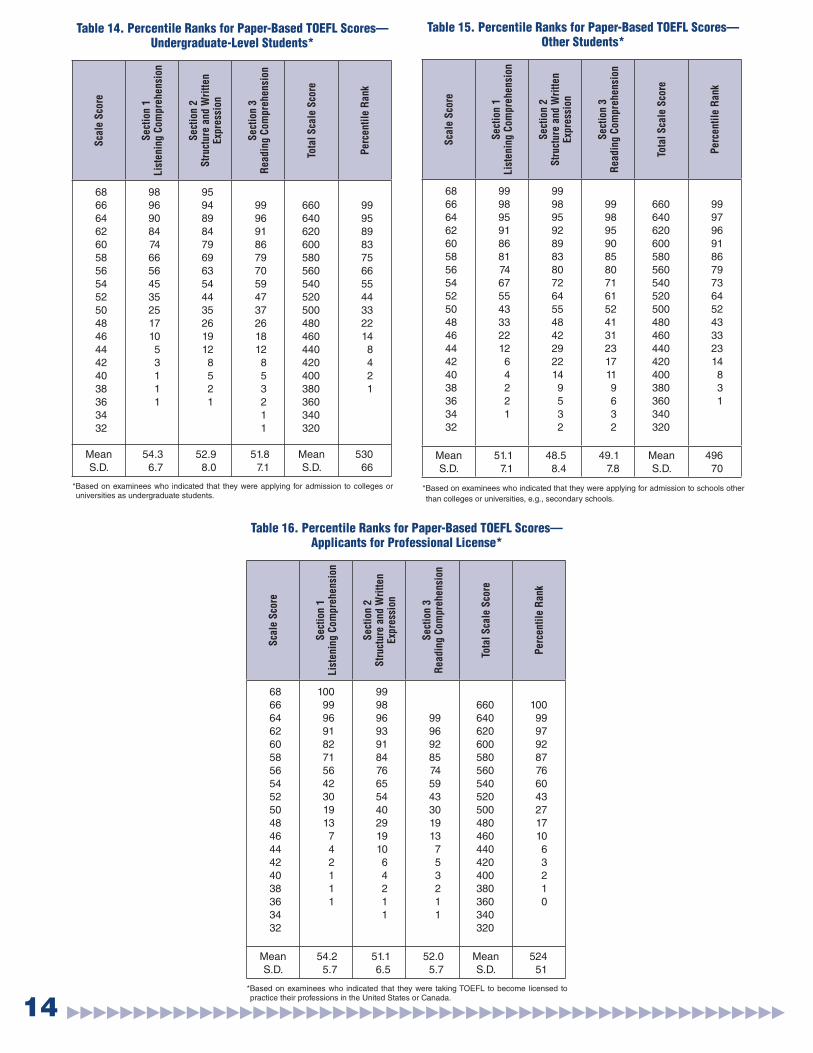
Table 11 gives actual ranges of observed scores for the period from January 2009 through December 2009. The percentile ranks for section and total scale scores are shown in Table 12 for the total group. In Tables 13–16, examinees are classifi ed by their reason for taking the test.
Table 12. Percentile Ranks for Paper-Based TOEFL Scores—Total Group
Sca
le S
core
Sect
ion 1
Lis
tenin
g C
om
pre
hensi
on
Sect
ion 2
Str
uct
ure
and W
ritt
en
Exp
ress
ion
Sect
ion 3
Readin
g C
om
pre
hensi
on
Tota
l S
cale
Sco
re
Perc
enti
le R
ank
68
66
64
62
60
58
56
54
52
50
48
46
44
42
40
38
36
34
32
99
97
93
87
79
71
61
50
39
28
19
11
6
3
2
1
1
96
95
90
86
80
71
63
54
45
34
26
19
12
8
5
2
1
1
99
96
91
85
77
67
55
43
33
23
16
11
7
4
3
2
1
1
660
640
620
600
580
560
540
520
500
480
460
440
420
400
380
360
340
320
99
96
91
85
77
67
55
43
32
22
14
8
5
2
1
Mean
S.D.
53.6
6.6
52.7
7.8
52.3
6.9
Mean
S.D.
529
64
Table 11. Observed Minimum and Maximum Paper-Based
TOEFL Section and Total Scores
Section Min. Max.
1. Listening Comprehension 31 68
2. Structure and Written Expression 31 68
3. Reading Comprehension 31 67
Total 310 677
Table 13. Percentile Ranks for Paper-Based TOEFL Scores—Graduate-Level Students*
Sca
le S
core
Sect
ion 1
Lis
tenin
g C
om
pre
hensi
on
Sect
ion 2
Str
uct
ure
and W
ritt
en
Exp
ress
ion
Sect
ion 3
Readin
g C
om
pre
hensi
on
Tota
l S
cale
Sco
re
Perc
enti
le R
ank
68
66
64
62
60
58
56
54
52
50
48
46
44
42
40
38
36
34
32
99
97
93
88
81
72
62
50
39
27
18
11
5
3
1
1
1
97
95
90
85
79
69
61
51
42
31
23
17
10
7
4
2
1
1
98
95
90
83
75
64
50
38
28
19
13
9
5
3
2
1
1
1
660
640
620
600
580
560
540
520
500
480
460
440
420
400
380
360
340
320
99
96
91
85
76
65
53
40
29
20
12
7
4
2
1
Mean
S.D.
53.5
6.4
53.2
7.6
53.1
6.7
Mean
S.D.
533
62
*Based on examinees who indicated that they were applying for admission to colleges or universities as graduate students.
14 ▶▶▶▶▶▶▶▶▶▶▶▶▶▶▶▶▶▶▶▶▶▶▶▶▶▶▶▶▶▶▶▶▶▶▶▶▶▶▶▶▶▶▶▶▶▶▶▶▶▶▶▶▶▶
Table 14. Percentile Ranks for Paper-Based TOEFL Scores—Undergraduate-Level Students*
Sca
le S
core
Sect
ion 1
Lis
tenin
g C
om
pre
hensi
on
Sect
ion 2
Str
uct
ure
and W
ritt
en
Exp
ress
ion
Sect
ion 3
Readin
g C
om
pre
hensi
on
Tota
l S
cale
Sco
re
Perc
enti
le R
ank
68
66
64
62
60
58
56
54
52
50
48
46
44
42
40
38
36
34
32
98
96
90
84
74
66
56
45
35
25
17
10
5
3
1
1
1
95
94
89
84
79
69
63
54
44
35
26
19
12
8
5
2
1
99
96
91
86
79
70
59
47
37
26
18
12
8
5
3
2
1
1
660
640
620
600
580
560
540
520
500
480
460
440
420
400
380
360
340
320
99
95
89
83
75
66
55
44
33
22
14
8
4
2
1
Mean
S.D.
54.3
6.7
52.9
8.0
51.8
7.1
Mean
S.D.
530
66
*Based on examinees who indicated that they were applying for admission to colleges or universities as undergraduate students.
Table 15. Percentile Ranks for Paper-Based TOEFL Scores—Other Students*
Sca
le S
core
Sect
ion 1
Lis
tenin
g C
om
pre
hensi
on
Sect
ion 2
Str
uct
ure
and W
ritt
en
Exp
ress
ion
Sect
ion 3
Readin
g C
om
pre
hensi
on
Tota
l S
cale
Sco
re
Perc
enti
le R
ank
68
66
64
62
60
58
56
54
52
50
48
46
44
42
40
38
36
34
32
99
98
95
91
86
81
74
67
55
43
33
22
12
6
4
2
2
1
99
98
95
92
89
83
80
72
64
55
48
42
29
22
14
9
5
3
2
99
98
95
90
85
80
71
61
52
41
31
23
17
11
9
6
3
2
660
640
620
600
580
560
540
520
500
480
460
440
420
400
380
360
340
320
99
97
96
91
86
79
73
64
52
43
33
23
14
8
3
1
Mean
S.D.
51.1
7.1
48.5
8.4
49.1
7.8
Mean
S.D.
496
70
*Based on examinees who indicated that they were applying for admission to schools other
than colleges or universities, e.g., secondary schools.
Table 16. Percentile Ranks for Paper-Based TOEFL Scores—Applicants for Professional License*
Sca
le S
core
Sect
ion 1
Lis
tenin
g C
om
pre
hensi
on
Sect
ion 2
Str
uct
ure
and W
ritt
en
Exp
ress
ion
Sect
ion 3
Readin
g C
om
pre
hensi
on
Tota
l S
cale
Sco
re
Perc
enti
le R
ank
68
66
64
62
60
58
56
54
52
50
48
46
44
42
40
38
36
34
32
100
99
96
91
82
71
56
42
30
19
13
7
4
2
1
1
1
99
98
96
93
91
84
76
65
54
40
29
19
10
6
4
2
1
1
99
96
92
85
74
59
43
30
19
13
7
5
3
2
1
1
660
640
620
600
580
560
540
520
500
480
460
440
420
400
380
360
340
320
100
99
97
92
87
76
60
43
27
17
10
6
3
2
1
0
Mean
S.D.
54.2
5.7
51.1
6.5
52.0
5.7
Mean
S.D.
524
51
*Based on examinees who indicated that they were taking TOEFL to become licensed to practice their professions in the United States or Canada.
15 ▶▶▶▶▶▶▶▶▶▶▶▶▶▶▶▶▶▶▶▶▶▶▶▶▶▶▶▶▶▶▶▶▶▶▶▶▶▶▶▶▶▶▶▶▶▶▶▶▶▶▶▶▶▶
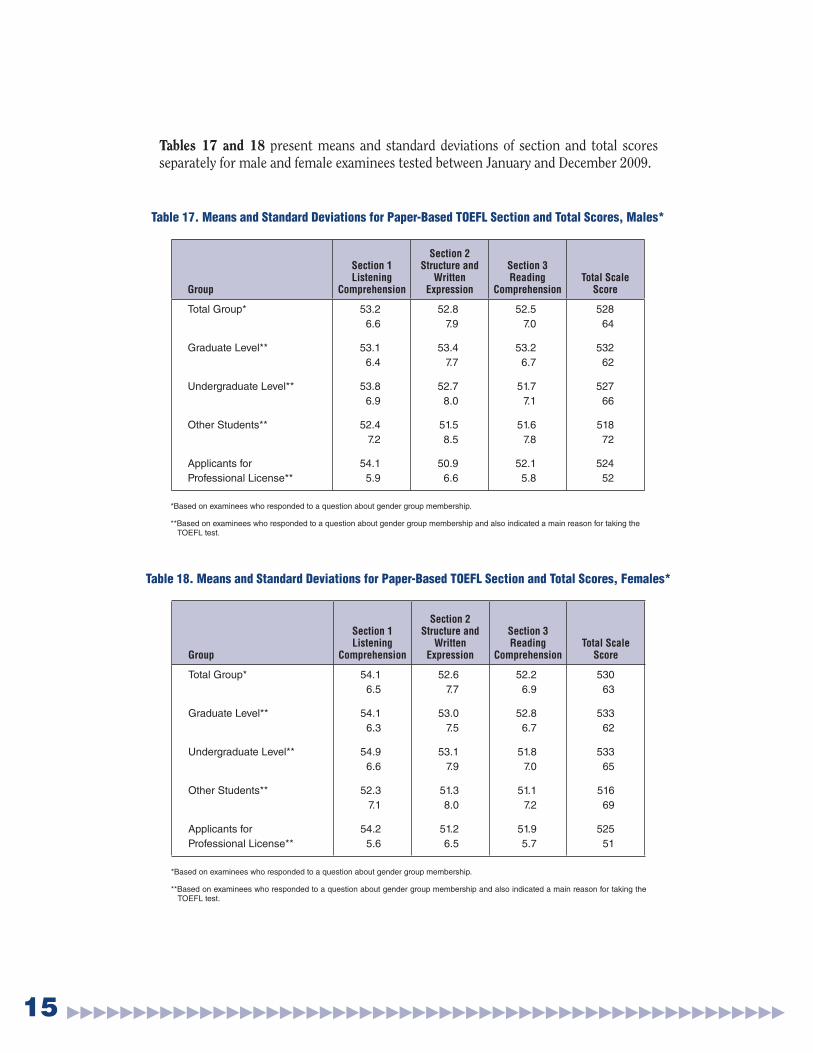
Tables 17 and 18 present means and standard deviations of section and total scores separately for male and female examinees tested between January and December 2009.
Table 17. Means and Standard Deviations for Paper-Based TOEFL Section and Total Scores, Males*
Group
Section 1 Listening
Comprehension
Section 2 Structure and
Written Expression
Section 3 Reading
ComprehensionTotal Scale
Score
Total Group*
Graduate Level**
Undergraduate Level**
Other Students**
Applicants for
Professional License**
53.2
6.6
53.1
6.4
53.8
6.9
52.4
7.2
54.1
5.9
52.8
7.9
53.4
7.7
52.7
8.0
51.5
8.5
50.9
6.6
52.5
7.0
53.2
6.7
51.7
7.1
51.6
7.8
52.1
5.8
528
64
532
62
527
66
518
72
524
52
*Based on examinees who responded to a question about gender group membership.
**Based on examinees who responded to a question about gender group membership and also indicated a main reason for taking the TOEFL test.
Table 18. Means and Standard Deviations for Paper-Based TOEFL Section and Total Scores, Females*
Group
Section 1 Listening
Comprehension
Section 2 Structure and
Written Expression
Section 3 Reading
ComprehensionTotal Scale
Score
Total Group*
Graduate Level**
Undergraduate Level**
Other Students**
Applicants for
Professional License**
54.1
6.5
54.1
6.3
54.9
6.6
52.3
7.1
54.2
5.6
52.6
7.7
53.0
7.5
53.1
7.9
51.3
8.0
51.2
6.5
52.2
6.9
52.8
6.7
51.8
7.0
51.1
7.2
51.9
5.7
530
63
533
62
533
65
516
69
525
51
*Based on examinees who responded to a question about gender group membership.
**Based on examinees who responded to a question about gender group membership and also indicated a main reason for taking the TOEFL test.
16 ▶▶▶▶▶▶▶▶▶▶▶▶▶▶▶▶▶▶▶▶▶▶▶▶▶▶▶▶▶▶▶▶▶▶▶▶▶▶▶▶▶▶▶▶▶▶▶▶▶▶▶▶▶▶
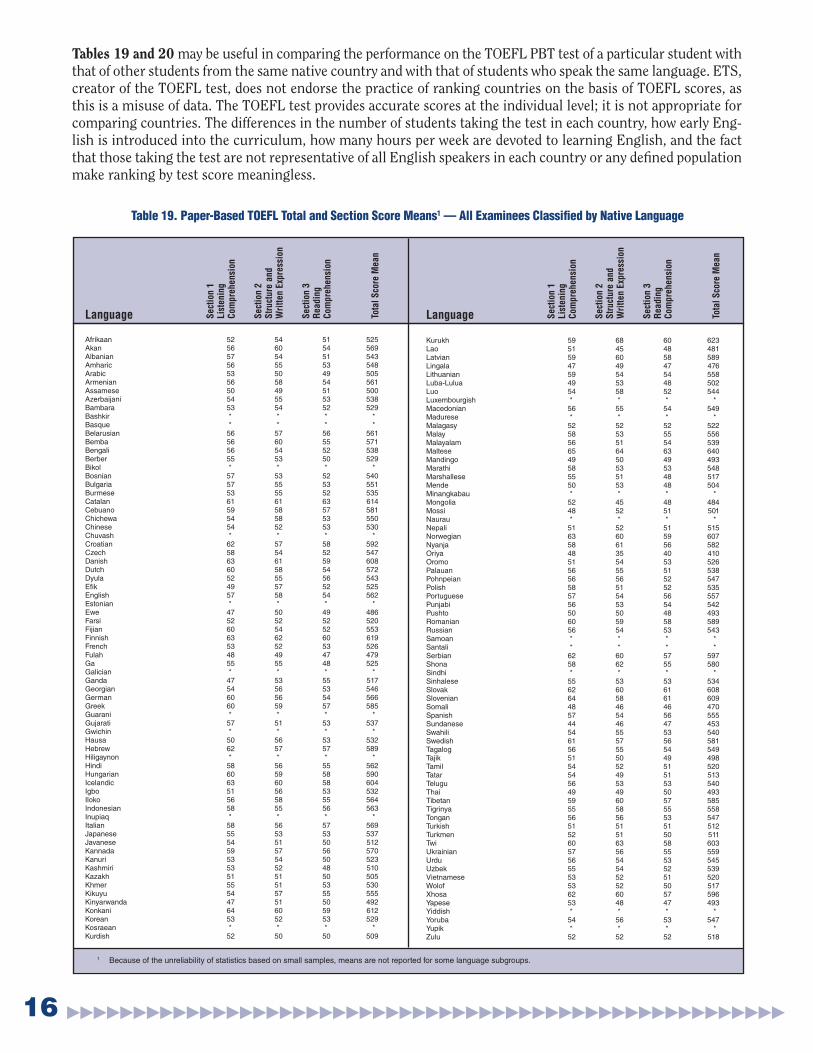
Tables 19 and 20 may be useful in comparing the performance on the TOEFL PBT test of a particular student with that of other students from the same native country and with that of students who speak the same language. ETS, creator of the TOEFL test, does not endorse the practice of ranking countries on the basis of TOEFL scores, as this is a misuse of data. The TOEFL test provides accurate scores at the individual level; it is not appropriate for comparing countries. The differences in the number of students taking the test in each country, how early Eng-lish is introduced into the curriculum, how many hours per week are devoted to learning English, and the fact that those taking the test are not representative of all English speakers in each country or any defi ned population make ranking by test score meaningless.
Table 19. Paper-Based TOEFL Total and Section Score Means1 — All Examinees Classifi ed by Native Language
1 Because of the unreliability of statistics based on small samples, means are not reported for some language subgroups.
Language Sect
ion 1
Lis
tenin
g
Com
pre
hensi
on
Sect
ion 2
Str
uct
ure
and
Wri
tten E
xpre
ssio
n
Sect
ion 3
Readin
g
Com
pre
hensi
on
Tota
l S
core
Mean
Afrikaan 52 54 51 525Akan 56 60 54 569Albanian 57 54 51 543Amharic 56 55 53 548Arabic 53 50 49 505Armenian 56 58 54 561Assamese 50 49 51 500Azerbaijani 54 55 53 538Bambara 53 54 52 529Bashkir * * * * Basque * * * * Belarusian 56 57 56 561Bemba 56 60 55 571Bengali 56 54 52 538Berber 55 53 50 529Bikol * * * * Bosnian 57 53 52 540Bulgaria 57 55 53 551Burmese 53 55 52 535Catalan 61 61 63 614Cebuano 59 58 57 581Chichewa 54 58 53 550Chinese 54 52 53 530Chuvash * * * * Croatian 62 57 58 592Czech 58 54 52 547Danish 63 61 59 608Dutch 60 58 54 572Dyula 52 55 56 543Efi k 49 57 52 525English 57 58 54 562Estonian * * * * Ewe 47 50 49 486Farsi 52 52 52 520Fijian 60 54 52 553Finnish 63 62 60 619French 53 52 53 526Fulah 48 49 47 479Ga 55 55 48 525Galician * * * * Ganda 47 53 55 517Georgian 54 56 53 546German 60 56 54 566Greek 60 59 57 585Guarani * * * * Gujarati 57 51 53 537Gwichin * * * * Hausa 50 56 53 532Hebrew 62 57 57 589Hiligaynon * * * * Hindi 58 56 55 562Hungarian 60 59 58 590Icelandic 63 60 58 604Igbo 51 56 53 532Iloko 56 58 55 564Indonesian 58 55 56 563Inupiaq * * * * Italian 58 56 57 569Japanese 55 53 53 537Javanese 54 51 50 512Kannada 59 57 56 570Kanuri 53 54 50 523Kashmiri 53 52 48 510Kazakh 51 51 50 505Khmer 55 51 53 530Kikuyu 54 57 55 555Kinyarwanda 47 51 50 492Konkani 64 60 59 612Korean 53 52 53 529Kosraean * * * *Kurdish 52 50 50 509
Language Sect
ion 1
Lis
tenin
g
Com
pre
hensi
on
Sect
ion 2
Str
uct
ure
and
Wri
tten E
xpre
ssio
n
Sect
ion 3
Readin
g
Com
pre
hensi
on
Tota
l S
core
Mean
Kurukh 59 68 60 623Lao 51 45 48 481Latvian 59 60 58 589Lingala 47 49 47 476Lithuanian 59 54 54 558Luba-Lulua 49 53 48 502Luo 54 58 52 544Luxembourgish * * * *Macedonian 56 55 54 549Madurese * * * * Malagasy 52 52 52 522Malay 58 53 55 556Malayalam 56 51 54 539Maltese 65 64 63 640Mandingo 49 50 49 493Marathi 58 53 53 548Marshallese 55 51 48 517Mende 50 53 48 504Minangkabau * * * * Mongolia 52 45 48 484Mossi 48 52 51 501Naurau * * * * Nepali 51 52 51 515Norwegian 63 60 59 607Nyanja 58 61 56 582Oriya 48 35 40 410Oromo 51 54 53 526Palauan 56 55 51 538Pohnpeian 56 56 52 547Polish 58 51 52 535Portuguese 57 54 56 557Punjabi 56 53 54 542Pushto 50 50 48 493Romanian 60 59 58 589Russian 56 54 53 543Samoan * * * * Santali * * * * Serbian 62 60 57 597Shona 58 62 55 580Sindhi * * * * Sinhalese 55 53 53 534Slovak 62 60 61 608Slovenian 64 58 61 609Somali 48 46 46 470Spanish 57 54 56 555Sundanese 44 46 47 453Swahili 54 55 53 540Swedish 61 57 56 581Tagalog 56 55 54 549Tajik 51 50 49 498Tamil 54 52 51 520Tatar 54 49 51 513Telugu 56 53 53 540Thai 49 49 50 493Tibetan 59 60 57 585Tigrinya 55 58 55 558Tongan 56 56 53 547Turkish 51 51 51 512Turkmen 52 51 50 511Twi 60 63 58 603Ukrainian 57 56 55 559Urdu 56 54 53 545Uzbek 55 54 52 539Vietnamese 53 52 51 520Wolof 53 52 50 517Xhosa 62 60 57 596Yapese 53 48 47 493Yiddish * * * * Yoruba 54 56 53 547Yupik * * * * Zulu 52 52 52 518
17 ▶▶▶▶▶▶▶▶▶▶▶▶▶▶▶▶▶▶▶▶▶▶▶▶▶▶▶▶▶▶▶▶▶▶▶▶▶▶▶▶▶▶▶▶▶▶▶▶▶▶▶▶▶▶
(continued)
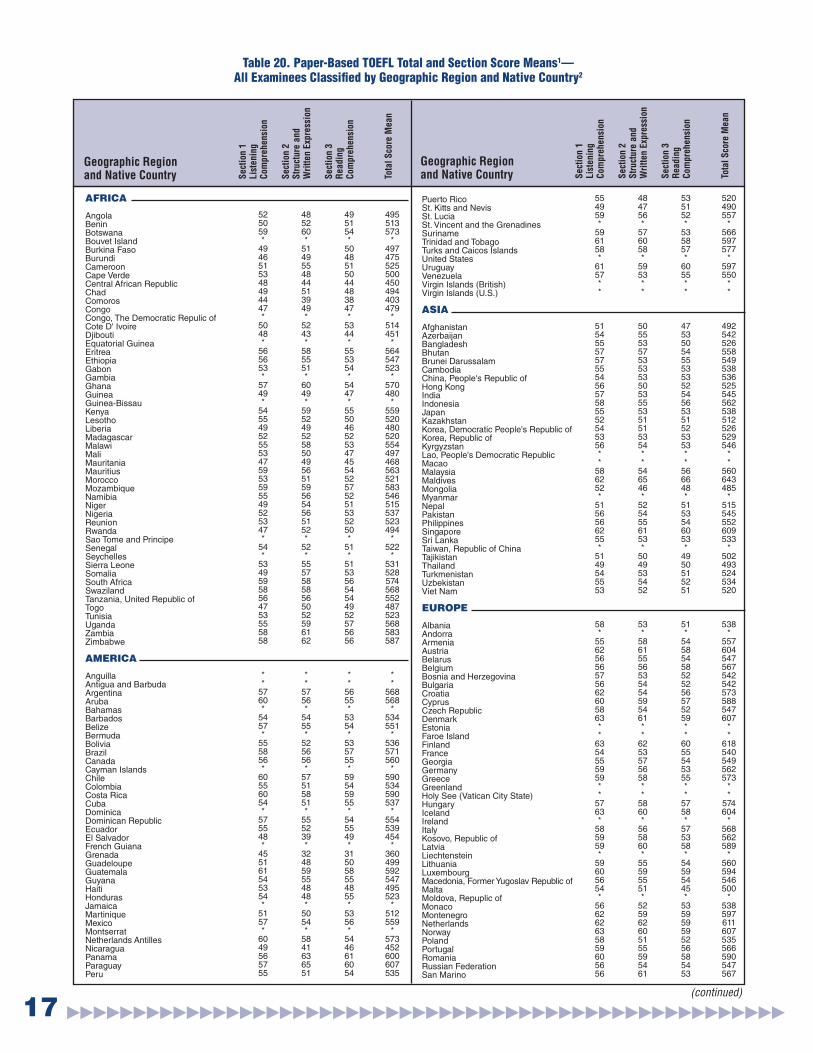
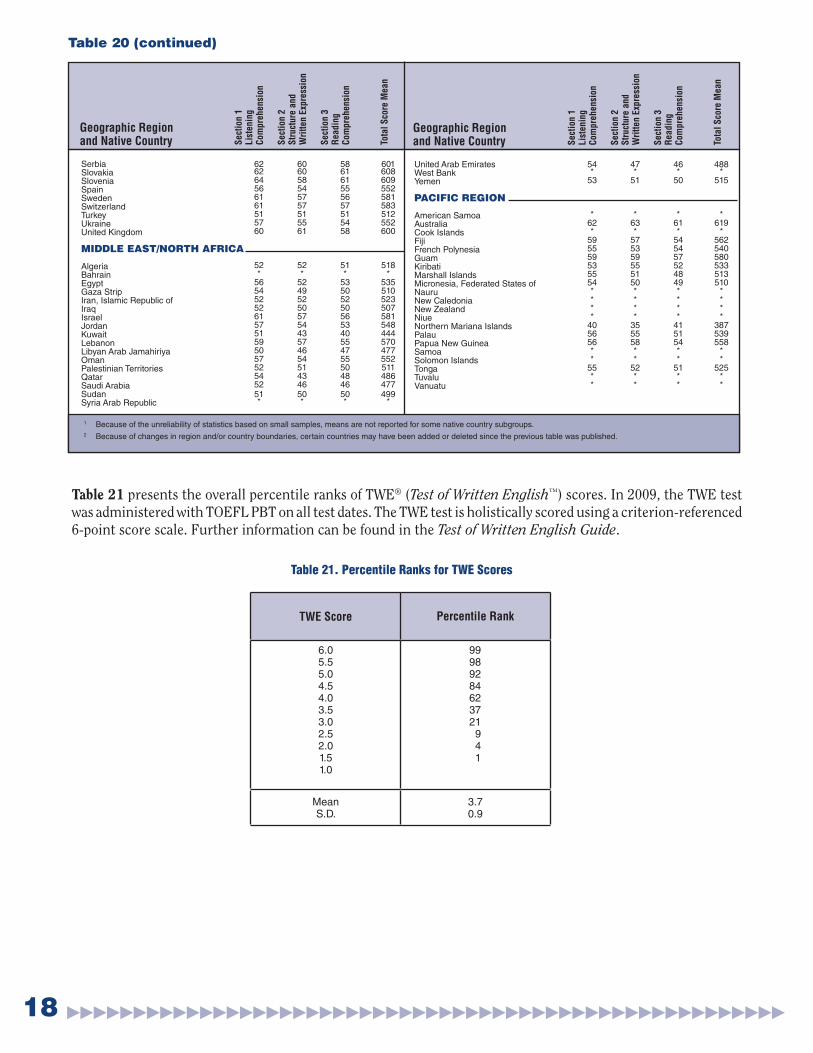
Table 20. Paper-Based TOEFL Total and Section Score Means1—All Examinees Classifi ed by Geographic Region and Native Country2
Geographic Region and Native Country S
ect
ion 1
Lis
tenin
gC
om
pre
hensi
on
Sect
ion 2
S
truct
ure
and
Wri
tten E
xpre
ssio
n
Sect
ion 3
R
eadin
g
Com
pre
hensi
on
Tota
l S
core
Mean
AFRICA
Angola 52 48 49 495Benin 50 52 51 513Botswana 59 60 54 573Bouvet Island * * * *Burkina Faso 49 51 50 497Burundi 46 49 48 475Cameroon 51 55 51 525Cape Verde 53 48 50 500Central African Republic 48 44 44 450Chad 49 51 48 494Comoros 44 39 38 403Congo 47 49 47 479Congo, The Democratic Repulic of * * * *Cote D' Ivoire 50 52 53 514Djibouti 48 43 44 451Equatorial Guinea * * * *Eritrea 56 58 55 564Ethiopia 56 55 53 547Gabon 53 51 54 523Gambia * * * *Ghana 57 60 54 570Guinea 49 49 47 480Guinea-Bissau * * * *Kenya 54 59 55 559Lesotho 55 52 50 520Liberia 49 49 46 480Madagascar 52 52 52 520Malawi 55 58 53 554Mali 53 50 47 497Mauritania 47 49 45 468Mauritius 59 56 54 563Morocco 53 51 52 521Mozambique 59 59 57 583Namibia 55 56 52 546Niger 49 54 51 515Nigeria 52 56 53 537Reunion 53 51 52 523Rwanda 47 52 50 494Sao Tome and Principe * * * *Senegal 54 52 51 522Seychelles * * * *Sierra Leone 53 55 51 531Somalia 49 57 53 528South Africa 59 58 56 574Swaziland 58 58 54 568Tanzania, United Republic of 56 56 54 552Togo 47 50 49 487Tunisia 53 52 52 523Uganda 55 59 57 568Zambia 58 61 56 583Zimbabwe 58 62 56 587
AMERICA
Anguilla * * * *Antigua and Barbuda * * * *Argentina 57 57 56 568Aruba 60 56 55 568Bahamas * * * *Barbados 54 54 53 534Belize 57 55 54 551Bermuda * * * *Bolivia 55 52 53 536Brazil 58 56 57 571Canada 56 56 55 560Cayman Islands * * * *Chile 60 57 59 590Colombia 55 51 54 534Costa Rica 60 58 59 590Cuba 54 51 55 537Dominica * * * *Dominican Republic 57 55 54 554Ecuador 55 52 55 539El Salvador 48 39 49 454French Guiana * * * *Grenada 45 32 31 360Guadeloupe 51 48 50 499Guatemala 61 59 58 592Guyana 54 55 55 547Haiti 53 48 48 495Honduras 54 48 55 523Jamaica * * * *Martinique 51 50 53 512Mexico 57 54 56 559Montserrat * * * *Netherlands Antilles 60 58 54 573Nicaragua 49 41 46 452Panama 56 63 61 600Paraguay 57 65 60 607Peru 55 51 54 535
Geographic Region and Native Country S
ect
ion 1
Lis
tenin
gC
om
pre
hensi
on
Sect
ion 2
S
truct
ure
and
Wri
tten E
xpre
ssio
n
Sect
ion 3
R
eadin
g
Com
pre
hensi
on
Tota
l S
core
Mean
Puerto Rico 55 48 53 520St. Kitts and Nevis 49 47 51 490St. Lucia 59 56 52 557St. Vincent and the Grenadines * * * *Suriname 59 57 53 566Trinidad and Tobago 61 60 58 597Turks and Caicos Islands 58 58 57 577United States * * * *Uruguay 61 59 60 597Venezuela 57 53 55 550Virgin Islands (British) * * * *Virgin Islands (U.S.) * * * *
ASIA
Afghanistan 51 50 47 492Azerbaijan 54 55 53 542Bangladesh 55 53 50 526Bhutan 57 57 54 558Brunei Darussalam 57 53 55 549Cambodia 55 53 53 538China, People's Republic of 54 53 53 536Hong Kong 56 50 52 525India 57 53 54 545Indonesia 58 55 56 562Japan 55 53 53 538Kazakhstan 52 51 51 512Korea, Democratic People's Republic of 54 51 52 526Korea, Republic of 53 53 53 529Kyrgyzstan 56 54 53 546Lao, People's Democratic Republic * * * *Macao * * * *Malaysia 58 54 56 560Maldives 62 65 66 643Mongolia 52 46 48 485Myanmar * * * *Nepal 51 52 51 515Pakistan 56 54 53 545Philippines 56 55 54 552Singapore 62 61 60 609Sri Lanka 55 53 53 533Taiwan, Republic of China * * * *Tajikistan 51 50 49 502Thailand 49 49 50 493Turkmenistan 54 53 51 524Uzbekistan 55 54 52 534Viet Nam 53 52 51 520
EUROPE
Albania 58 53 51 538Andorra * * * *Armenia 55 58 54 557Austria 62 61 58 604Belarus 56 55 54 547Belgium 56 56 58 567Bosnia and Herzegovina 57 53 52 542Bulgaria 56 54 52 542Croatia 62 54 56 573Cyprus 60 59 57 588Czech Republic 58 54 52 547Denmark 63 61 59 607Estonia * * * *Faroe Island * * * *Finland 63 62 60 618France 54 53 55 540Georgia 55 57 54 549Germany 59 56 53 562Greece 59 58 55 573Greenland * * * *Holy See (Vatican City State) * * * *Hungary 57 58 57 574Iceland 63 60 58 604Ireland * * * *Italy 58 56 57 568Kosovo, Republic of 59 58 53 562Latvia 59 60 58 589Liechtenstein * * * *Lithuania 59 55 54 560Luxembourg 60 59 59 594Macedonia, Former Yugoslav Republic of 56 55 54 546Malta 54 51 45 500Moldova, Repuplic of * * * *Monaco 56 52 53 538Montenegro 62 59 59 597Netherlands 62 62 59 611Norway 63 60 59 607Poland 58 51 52 535Portugal 59 55 56 566Romania 60 59 58 590Russian Federation 56 54 54 547San Marino 56 61 53 567
18 ▶▶▶▶▶▶▶▶▶▶▶▶▶▶▶▶▶▶▶▶▶▶▶▶▶▶▶▶▶▶▶▶▶▶▶▶▶▶▶▶▶▶▶▶▶▶▶▶▶▶▶▶▶▶
Table 20 (continued)
Table 21 presents the overall percentile ranks of TWE® (Test of Written English™) scores. In 2009, the TWE test was administered with TOEFL PBT on all test dates. The TWE test is holistically scored using a criterion-referenced 6-point score scale. Further information can be found in the Test of Written English Guide.
1 Because of the unreliability of statistics based on small samples, means are not reported for some native country subgroups.2 Because of changes in region and/or country boundaries, certain countries may have been added or deleted since the previous table was published.
Geographic Region and Native Country S
ect
ion 1
Lis
tenin
gC
om
pre
hensi
on
Sect
ion 2
S
truct
ure
and
Wri
tten E
xpre
ssio
n
Sect
ion 3
R
eadin
g
Com
pre
hensi
on
Tota
l S
core
Mean
Serbia 62 60 58 601Slovakia 62 60 61 608Slovenia 64 58 61 609Spain 56 54 55 552Sweden 61 57 56 581Switzerland 61 57 57 583Turkey 51 51 51 512Ukraine 57 55 54 552United Kingdom 60 61 58 600
MIDDLE EAST/NORTH AFRICA
Algeria 52 52 51 518Bahrain * * * *Egypt 56 52 53 535Gaza Strip 54 49 50 510Iran, Islamic Republic of 52 52 52 523Iraq 52 50 50 507Israel 61 57 56 581Jordan 57 54 53 548Kuwait 51 43 40 444Lebanon 59 57 55 570Libyan Arab Jamahiriya 50 46 47 477Oman 57 54 55 552Palestinian Territories 52 51 50 511Qatar 54 43 48 486Saudi Arabia 52 46 46 477Sudan 51 50 50 499Syria Arab Republic * * * *
Geographic Region and Native Country S
ect
ion 1
Lis
tenin
gC
om
pre
hensi
on
Sect
ion 2
S
truct
ure
and
Wri
tten E
xpre
ssio
n
Sect
ion 3
R
eadin
g
Com
pre
hensi
on
Tota
l S
core
Mean
United Arab Emirates 54 47 46 488West Bank * * * *Yemen 53 51 50 515
PACIFIC REGION
American Samoa * * * *Australia 62 63 61 619Cook Islands * * * *Fiji 59 57 54 562French Polynesia 55 53 54 540Guam 59 59 57 580Kiribati 53 55 52 533Marshall Islands 55 51 48 513Micronesia, Federated States of 54 50 49 510Nauru * * * *New Caledonia * * * *New Zealand * * * *Niue * * * *Northern Mariana Islands 40 35 41 387Palau 56 55 51 539Papua New Guinea 56 58 54 558Samoa * * * *Solomon Islands * * * *Tonga 55 52 51 525Tuvalu * * * *Vanuatu * * * *
Table 21. Percentile Ranks for TWE Scores
TWE Score Percentile Rank
6.05.55.04.54.03.53.02.52.01.51.0
99989284623721941
MeanS.D.
3.70.9
The TOEFL® test is the BEST measure of academic English profi ciency.
Using a high-quality test means more accurate decisions. ETS’s in-depth, rigorous test
design process ensures that the TOEFL® test is the highest-quality English-language
profi ciency assessment available.
The test is supported by 135+ TOEFL research reports and monographs, multiple pilot
tests and our commitment to ongoing research.
For more information visit www.ets.org/toefl /research.
82479-10496 • PDF310