Embed Size (px)
Citation preview

2
June primary featured new reforms
Top two vote getter (“Top two”)
Districts drawn by independent redistricting commission
Goals
– More choices
– Competitive elections
– Shake-up status quo

3
June primary featured new reforms
Top two vote getter (“Top two”)
Districts drawn by independent redistricting commission
Goals
– More choices
– Competitive elections
– Shake-up status quo
Change is visible, but limited so far

4
Outline
Brief background on reform
Competition
Money
Crossover voting
Conclusions

5
Top Two removes party boundaries for candidates and voters
Old: “Semi-closed” (2002-2010)
– Primaries open only to voters registered with that party
– Independents often allowed to participate
New: “Top Two Vote Getter”
– All candidates of all parties on one ballot
– Voters choose any candidate
– Two candidates with most votes advance
– Always a fall run-off
– Akin to “pre-general” election

6
New commission radically changed redistricting process
Old: Legislature
– Drew their own districts, plus BoE and Congress
– No transparency
New: Citizens Redistricting Commission (CRC)
– Independent commission of citizens
– Complex process to ensure independence
– Detailed goals
– Highly transparent

7
Reforms raise key questions
Competition
– Were races closer?
– Did establishment candidates struggle?
– How did third parties do?
Money
– Was there more money in politics?
Crossover voting
– How different were outcomes this time?

8
Outline
Brief background on reform
Competition
Money
Crossover voting
Conclusions

Redistricting created a few more competitive seats…
0%
5%
10%
15%
20%
25%
30%
35%
State Senate State Assembly U.S. House
Competitive seats by registration, as share of total
2010
2012
9
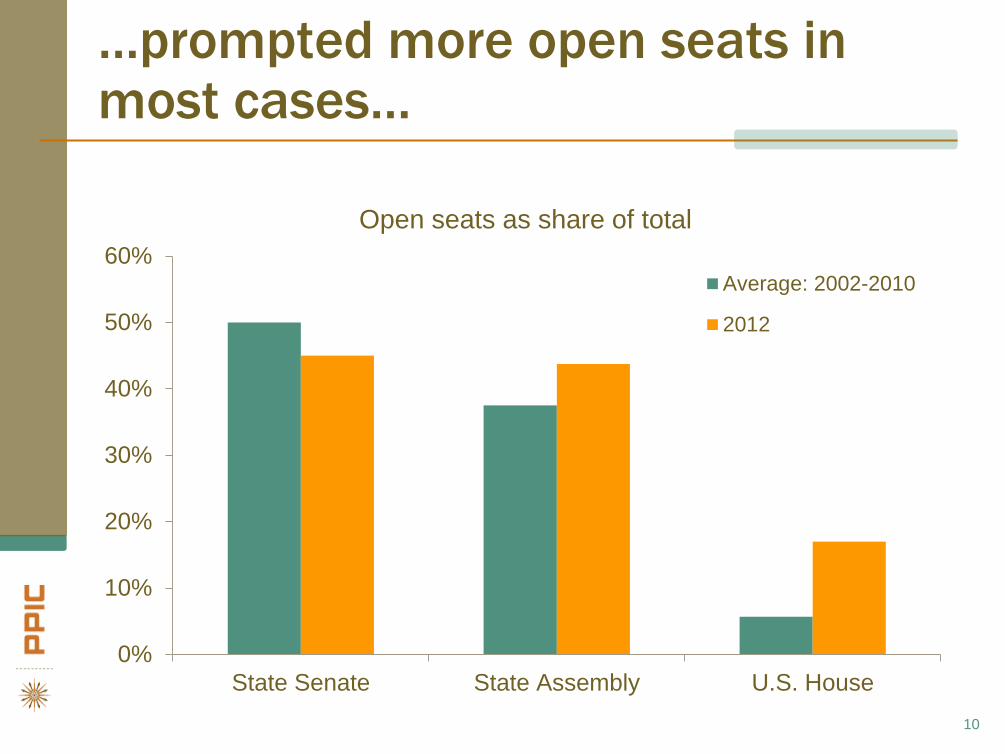
…prompted more open seats in most cases…
0%
10%
20%
30%
40%
50%
60%
State Senate State Assembly U.S. House
Open seats as share of total
Average: 2002-2010
2012
10

Average incumbent: 45% of constituents are new
41% of incumbents running to represent more new constituents
11
…and forced the remaining incumbents to run in new territory

Top Two altered the strategic logic…
12
D
D
R
Primary General
Semi-
Closed
D
R
#1
#2
#3
D
D
R
Top Two
D
D
#1
#2
#3

…and candidates responded
Assembly
(80 seats)
Senate
(20 seats per
election, 40 total)
U.S. House
(53 Seats)
2012
Average
2002-
2010
2012
Average
2002-
2010
2012
Average
2002-
2010
Same-party
competition 63% 46% 45% 39% 79% 51%
13

…and candidates responded
Assembly
(80 seats)
Senate
(20 seats per
election, 40 total)
U.S. House
(53 Seats)
2012
Average
2002-
2010
2012
Average
2002-
2010
2012
Average
2002-
2010
Same-party
competition 63% 46% 45% 39% 79% 51%
Same-party
incumbent
challenge 33 8 27 2 52 31
14

…and candidates responded
Assembly
(80 seats)
Senate
(20 seats per
election, 40 total)
U.S. House
(53 Seats)
2012
Average
2002-
2010
2012
Average
2002-
2010
2012
Average
2002-
2010
Same-party
competition 63% 46% 45% 39% 79% 51%
Same-party
incumbent
challenge 33 8 27 2 52 31
One major party
absent 14 6 25 12 17 7
15

Outcomes were closer, though not always close
Assembly
(80 seats)
Senate
(20 seats per
election, 40 total)
U.S. House
(53 Seats)
2012
Average
2002-
2010
2012
Average
2002-
2010
2012
Average
2002-
2010
Winner > 50% 50% 70% 80% 77% 66% 88%
16

Outcomes were closer, though not always close
Assembly
(80 seats)
Senate
(20 seats per
election, 40 total)
U.S. House
(53 Seats)
2012
Average
2002-
2010
2012
Average
2002-
2010
2012
Average
2002-
2010
Winner > 50% 50% 70% 80% 77% 66% 88%
Avg gap: 1 vs. 2 19 28 20 30 28 39
17

Outcomes were closer, though not always close
Assembly
(80 seats)
Senate
(20 seats per
election, 40 total)
U.S. House
(53 Seats)
2012
Average
2002-
2010
2012
Average
2002-
2010
2012
Average
2002-
2010
Winner > 50% 50% 70% 80% 77% 66% 88%
Avg gap: 1 vs. 2 19 28 20 30 28 39
Avg gap: 2 vs. 3 8 16 19 19 14 17
18

Establishment candidates did well…
0%
20%
40%
60%
80%
100%
Incumbents Endorsed Non-Incumbents
Percent of candidates advancing to the general
19

…and outsider candidates did not
0%
20%
40%
60%
80%
100%
Incumbents Endorsed Non-Incumbents
Third Party No PartyPreference
Percent of candidates advancing to the general
20

21
Outline
Brief background on reform
Competition
Money
Crossover voting
Conclusions

Money has increased mostly in House races
0
100
200
300
400
500
600
2002 2004 2006 2008 2010 2012
Do
lla
rs (
tho
usa
nd
s)
Money per candidate (direct and independent)
State Senate
Assembly
U.S. House
22

More money in the fall? Maybe
0
20
40
60
80
100
120
140
Total Cross-PartyRaces
Num
ber
of R
aces
Competitive Cross-Party (D vs. R) Races in the Fall
23
125

More money in the fall? Maybe
0
20
40
60
80
100
120
140
Total Cross-PartyRaces
Candidates < 50%
Num
ber
of R
aces
Competitive Cross-Party (D vs. R) Races in the Fall
24
125
42

More money in the fall? Maybe
0
20
40
60
80
100
120
140
Total Cross-PartyRaces
Candidates < 50% Candidates < 50% +Balanced Money
Num
ber
of R
aces
Competitive Cross-Party (D vs. R) Races in the Fall
25
125
42
10

More money in the fall? Maybe
0
20
40
60
80
100
120
140
Total Same-PartyRaces
Num
ber
of R
aces
Competitive Same-Party Races in the Fall
26
28

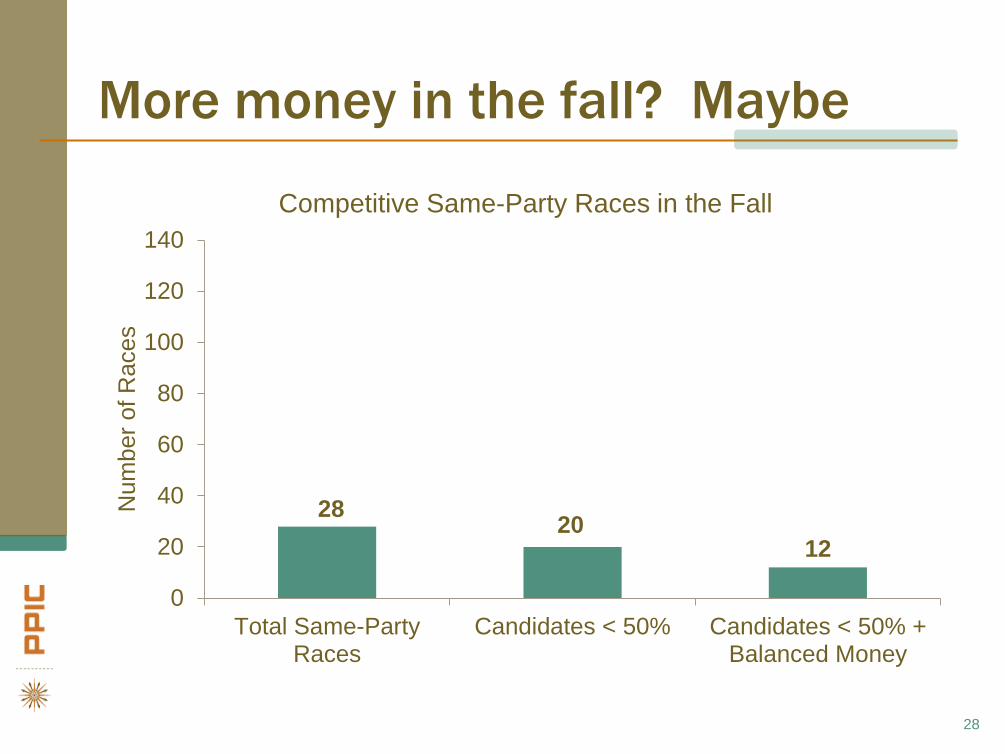
More money in the fall? Maybe
0
20
40
60
80
100
120
140
Total Same-PartyRaces
Candidates < 50%
Num
ber
of R
aces
Competitive Same-Party Races in the Fall
27
28 20
More money in the fall? Maybe
0
20
40
60
80
100
120
140
Total Same-PartyRaces
Candidates < 50% Candidates < 50% +Balanced Money
Num
ber
of R
aces
Competitive Same-Party Races in the Fall
28
28 20
12

29
Outline
Brief background on reform
Competition
Money
Crossover voting
Conclusions

30
How unexpected were the results?
Semi-closed system allowed limited crossover voting
– District party registration should accurately predict party vote
Top Two allows voters to crossover race by race
– If high crossover, registration should badly predict party vote

Easy to predict party vote under old system
0%
20%
40%
60%
80%
100%
20% 40% 60% 80% 100%
Actu
al V
ote
for
Dem
ocra
tic
Candid
ate
s
Predicted Vote for Democratic Candidates
31
Districts in 2010

Most Top Two outcomes can be predicted with old assumptions
AD13
AD32
CD33
AD69 CD30
CD2
0%
20%
40%
60%
80%
100%
20% 40% 60% 80% 100%
Actu
al V
ote
for
Dem
ocra
tic
Candid
ate
s
Predicted Vote for Democratic Candidates
32
Districts in 2012

33
Outline
Brief background on reform
Competition
Money
Crossover voting
Conclusions

34
No dramatic change…yet
Competition higher, but not necessarily high
Establishment candidates did well so far
Money in politics up, but only notable for Congress
Crossover voting made a difference, but not a huge one

35
Moving forward
Limitations to work out
– Third-party status
– Write-ins
Will moderates and/or non-establishment candidates be successful in the fall?
Political reforms do not always have instant results
– More change may be coming

37
Notes on the use of these slides
These slides were created to accompany a presentation. They do not include full documentation of sources, data samples, methods, and interpretations. To avoid misinterpretations, please contact:
Eric McGhee: 415-291-4439, [email protected]
Thank you for your interest in this work.