Embed Size (px)
Citation preview
Method 422
Determination of Volatile OrganicCompounds in Emissions from Stationary
Sources
Adopted: January 22, 1987Amended: September 12, 1990Amended: December 13, 1991
422 - i
TABLE OF CONTENTSMETHOD 422
General Information Page
422 Determination of Volatile Organic CompoundsIn Emissions from Stationary Sources.............................................3
Sampling Methods
422.1. Standard Operating Procedure for the Samplingof Volatile Organic Compounds in Emissionsfrom Stationary Sources into Tedlar Bags .......................................9
Analysis Methods
422.101. Standard Operating Procedure for the GasChromatographic Analysis of Volatile HalogenatedOrganic Compounds from Stationary Source SamplesCollected in Tedlar Bags ...............................................................26
422.102. Standard Operating Procedure for the GasChromatographic Analysis of 1,3-Butadiene inEmissions from Stationary Sources...............................................29
422.199. Calibration and Quality Control Proceduresfor Analysis Methods .....................................................................39
422 - 1
TABLE OF CONTENTS
METHOD 422
GENERAL INFORMATION
1 INTRODUCTION........................................................................................3
2 APPLICABILITY .........................................................................................3
3 PRINCIPLE.................................................................................................4
4 DEFINITIONS AND ABBREVIATIONS ......................................................4
4.1 Response Factor .............................................................................4
4.2 Performance Evaluation Sample .....................................................4
4.3 Calibration Check ............................................................................4
4.4 Analytical Limit of Detection (LOD) ..................................................4
4.5 Analytical Limit of Quantitation (LOQ)..............................................5
4.6 Reporting Limit (RL).........................................................................5
4.7 Field Blank .......................................................................................5
4.8 Field Spike .......................................................................................5
4.9 Laboratory Replicate Samples.........................................................5
5 RANGE AND SENSITIVITY .......................................................................5
5.1 Range ..............................................................................................5
5.2 Sensitivity.........................................................................................6
6 PRECISION AND ACCURACY ..................................................................6
7 PRESURVEY .............................................................................................7
7.1 Pretest .............................................................................................8
7.1.1 Test Protocol .........................................................................8
422 - 2
7.1.2 Pretest Sampling...................................................................8
7.1.3 Pretest Analysis ....................................................................8
7.1.4 Protocol Review ....................................................................8
LIST OF TABLES
Table 1 Average Audit Bias ..........................................................................6
422 - 3
METHOD 422
Determination of Volatile Organic Compounds In Emissions from Stationary Sources
GENERAL INFORMATION
1. INTRODUCTION
Method 422 is designed to provide sampling and analysis techniques formeasurement of volatile organic compounds (VOC) in emissions from stationarysources.
The following format is intended to aid the user by dividing the method into thefollowing sections; general information, source sampling, and analysis. The firstsection is aimed at the source test planner. The second section is geared to theneeds of the field sampling team, who prepare for the test, collect the samplesand deliver the samples to a laboratory. The third section contains the analyticalprotocols to be followed by a chemist in analyzing the source test samples andreporting the results.
This method should not be attempted by persons unfamiliar with the performancecharacteristics of chromatography, nor by those persons who are unfamiliar withsource sampling. This method does not apply where equipment is operated inpotentially explosive atmospheres.
2. APPLICABILITY
This method applies to the sampling and analysis of volatile organic species.Listed below are the compounds specified for use with method 422.
Synonym
dichloromethanechloroform1,1,1-trichloroethanetrichlorofluoromethanecarbon tetrachloride1,2-dichloroethanetrichloroethene1,2-dibromoethanetetrachloroethene1,3-butadiene
methylene chloridetrichloromethanemethyl chloroformfluorotrichloromethanetetrachloromethaneethylene dichloridetrichloroethyleneethylene dibromideperchloroethylenebutadiene

422 - 4
This method cannot be used to determine compounds that (1) are polymeric(high molecular weight). (2) can polymerize before analysis, or (3) have very lowvapor pressures at stack or instrument conditions.
Alternative sampling and analytical methodologies that are demonstrated to besubstantially equivalent may be used if approved by the Executive Officer. Theterm Executive Officer as used in this document shall mean the Executive Officerof the Air Resources Board or the Executive Officer (Air Pollution Control Officer)of the Air Pollution Control District/Air Quality Management District at whoserequest the test is conducted. The Executive Officer may require the submissionof test data or other information showing that the alternate method is equivalentto method 422. Any modifications to the sampling and analytical proceduresdescribed must also be approved in writing by the Executive Officer.
3. PRINCIPLE
A sample of source gas containing one or more organics is subjected to gaschromatographic (GC) analysis.
4. DEFINITIONS AND ABBREVIATIONS
4.1 Response Factor
The response of the gas chromatograph detector to a known amount ofstandard.
4.2 Performance Evaluation Sample
A sample prepared by EPA, ARB, or other laboratories containing knownconcentrations of method analytes that has been analyzed by multiplelaboratories to determine statistically the accuracy and precision that canbe expected when a method is performed by a competent analyst.Analyte concentrations are usually known to the analyst.
4.3 Calibration Check Sample
A standard, normally the midpoint of multipoint calibrations (see section422.199.4.1), which is analyzed each shift to monitor detector drift. Thevalues of all analytes must be within 30% of the mean values establishedin the multipoint calibration or a new calibration curve must be prepared.
4.4 Analytical Limit of detection (LOD)
The lowest level at which detector response can be distinguished fromnoise. Refer to section 4.1.6 of method 422.199 for more detail.
422 - 5
4.5 Analytical Limit of Quantitation (LOQ).
The lowest level at which a compound can be accurately quantified. Thisvalue is 3.3 times the Limit of Detection.
4.6 Reporting Limit (RL)
The reporting limit (RL) is the lowest level that can be reliably quantitatedwithin specified limits of precision and accuracy during routine analyses ofsource samples. Reporting limits will be based on parameters such assampling volumes, dilutions, sample injection volume andchromatographic interferences. The reporting limit will also be based onthe level of Tedlar bag contamination as determined during pretest bagchecks (see Appendix A, method 422.1) and field blanks. The level ofcontamination is multiplied by a factor of 5 to calculate the RL.Contamination levels below the LOQ are assigned the value of the LOQ,with the minimum RL equal to 5 times LOQ. Thus, in the absence of anyother interferences or dilutions, 5 times the LOQ will be the minimumamount that can be reported in field samples.
4.7 Field Blank
A field blank is taken in the same way as a sample is taken except thatpure air or nitrogen is used as a sample. The field blank is used todetermine background levels in the sampling system. The gas used forblank runs should be certified by the gas supplier or laboratory to containconcentrations less than the limit of detection for the analytes of interest.
4.8 Field Spike
A gas standard of the target compounds is sampled in the same way asthe sample is taken. The purpose of the field spike is to determine anyanomalies in sampling and analysis.
4.9 Laboratory Replicate Samples
Replicates serve to measure the precision of an analysis. Ten percent ofall samples are analyzed in duplicate to indicate reproducibility of theanalysis and to monitor such conditions as instrument drift.
5. RANGE AND SENSITIVITY
5.1 Range
The range of the specific method is given in Table 1.
422 - 6
5.2 Sensitivity
The limits of quantitation (LOQ), as determined by ARB analyses, aregiven in Table 1. Each laboratory that uses method 422 is required tocalculate LOD’s, LOQ’s, and RL’s. The values listed in Table 1 are to beused as a general guide for comparing laboratory performance.
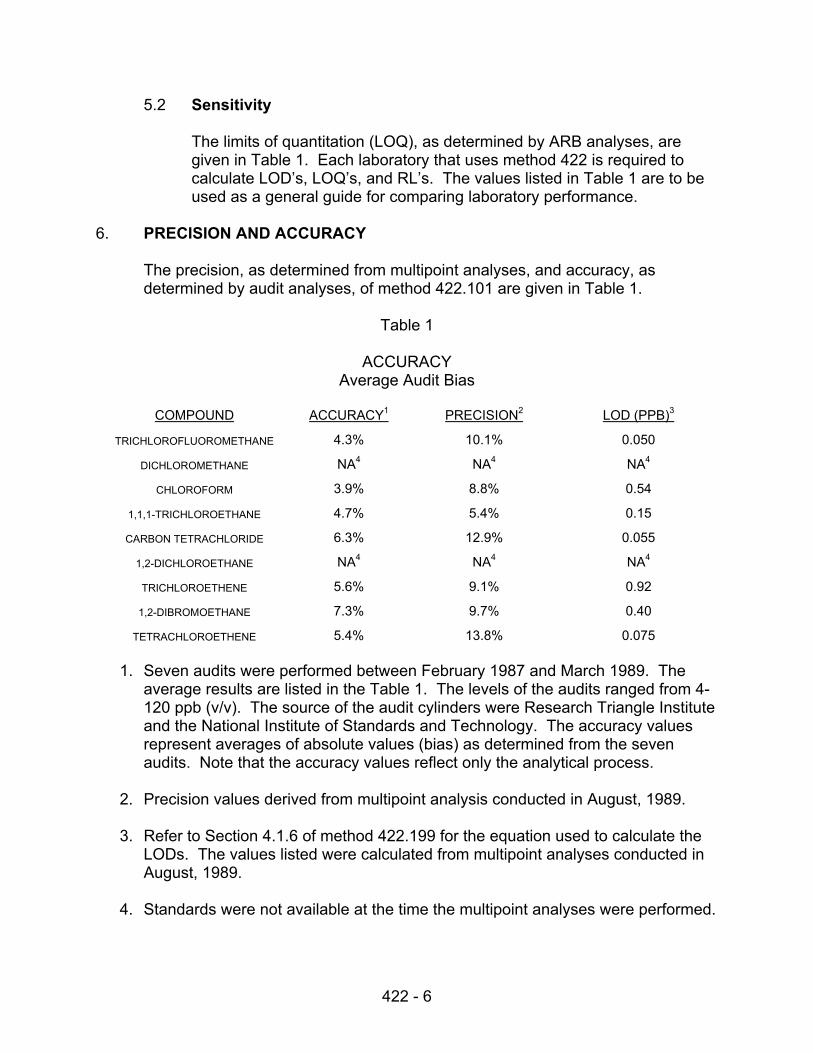
6. PRECISION AND ACCURACY
The precision, as determined from multipoint analyses, and accuracy, asdetermined by audit analyses, of method 422.101 are given in Table 1.
Table 1
ACCURACYAverage Audit Bias
COMPOUND ACCURACY1 PRECISION2 LOD (PPB)3
TRICHLOROFLUOROMETHANE 4.3% 10.1% 0.050
DICHLOROMETHANE NA4 NA4 NA4
CHLOROFORM 3.9% 8.8% 0.54
1,1,1-TRICHLOROETHANE 4.7% 5.4% 0.15
CARBON TETRACHLORIDE 6.3% 12.9% 0.055
1,2-DICHLOROETHANE NA4 NA4 NA4
TRICHLOROETHENE 5.6% 9.1% 0.92
1,2-DIBROMOETHANE 7.3% 9.7% 0.40
TETRACHLOROETHENE 5.4% 13.8% 0.075
1. Seven audits were performed between February 1987 and March 1989. Theaverage results are listed in the Table 1. The levels of the audits ranged from 4-120 ppb (v/v). The source of the audit cylinders were Research Triangle Instituteand the National Institute of Standards and Technology. The accuracy valuesrepresent averages of absolute values (bias) as determined from the sevenaudits. Note that the accuracy values reflect only the analytical process.
2. Precision values derived from multipoint analysis conducted in August, 1989.
3. Refer to Section 4.1.6 of method 422.199 for the equation used to calculate theLODs. The values listed were calculated from multipoint analyses conducted inAugust, 1989.
4. Standards were not available at the time the multipoint analyses were performed.
422 - 7
7. PRESURVEY
Perform a pre-survey for each source to be tested. The purpose of the pre-survey is to obtain source information so as to select the appropriate samplingand analysis parameters for that source. Potential interferences may bedetected and resolved during the presurvey. In some cases, lack of sourceinformation could require actual source samples to be collected and analyzed.
The following information must be collected during a presurvey before a test canbe conducted. The information can be collected from literature surveys andsource personnel. A copy of the presurvey results must be forwarded to thechemist performing sample analyses.
1. Determination of moisture content. Moisture is determined by ARB method 4.The purpose of knowing the moisture content is to determine the need forheat trace line and/or the need for predilution of Tedlar bags. If the moisturecontent is high then the bags are prediluted. Also this information will helpavoid problems in the analytical system.
2. Determination of stack gas temperature. The purpose for determining stackgas temperature is to select the proper probe for sampling. Also stack gastemperature is needed in order to calculate if moisture will condense atambient temperatures.
3. Determination of corrosives (i.e. Ca(OH)2). Corrosives may affect theanalytical system.
4. Determination of amount of acids (i.e. HCl). Acids are scrubbed out of thesample stream by the use of an NaOH impinger.
5. Safety for personnel including exposure of test crew to unsafe or unhealthylevels of toxic substances.
6. Determine if sampling is in a potentially explosive atmosphere. This methoddoes not apply to sampling in a potentially explosive atmosphere.
7. Determine approximate levels of target compounds. This information isneeded to establish parameters for the analytical system. See Section 8.1.
The following information is important to the analytical chemist, and it isrecommended that this information be obtained during a presurvey.
1. Determination of Static Pressure. This is to be done in accordance with ARBmethod 3. If the static pressure of the stack is negative, care should be takento avoid dilution of the stack gas sample with ambient air. If the static
422 - 8
pressure is positive, care should be taken to avoid exposure of test crew totoxic gases.
2. Determination of levels of criteria pollutants. This information is important indetermining staff safety.
3. Determination of amount of total organics. This measurement will give theupper limit in target compound levels. This will allow for an estimate of theamount of sample needed per injection.
4. Adequate power to operate source test equipment.
5. Adequate space to operate source test equipment.
6. Determination of representative sampling sites.
7.1 Pretest
If information on target compound concentrations and stack gascomposition is unknown a pretest is recomended. The pretest will requirethat a sample of stack gas is collected and analyses for the targetcompounds performed.
7.1.1 Test Protocol. A draft protocol should be completed before thepretest. The purpose of the pretest is to determine the appropriateuse of method 422.
7.1.2 Pretest sampling. The pretest sampling method should be done inthe same way as proposed in the test protocol. Sample transportand storage should also follow the protocol.
7.1.3 Pretest Analysis. The pretest analysis is done to determine targetcompound levels.
7.1.4 Protocol Review. Information from the presurvey will then be usedto fine tune the source test method.
422 - 9
State of CaliforniaAir Resources Board
Method 422.1
Standard Operating Procedure forthe Sampling of Volatile Organic Compounds in
Emissions from Stationary Sources into Tedlar Bags.
422 - 10
METHOD 422.1
Standard Operating Procedure for the Sampling ofVolatile Organic Compounds in Emissions from Stationary Sources
Page
1 APPLICABILITY .......................................................................................12
2 LIMITATIONS...........................................................................................12
3 EQUIVALENCY........................................................................................12
4 APPARATUS............................................................................................13
4.1 Probe .............................................................................................13
4.2 Alkaline Impinger ...........................................................................13
4.3 Water Impinger ..............................................................................13
4.4 Sample Line...................................................................................13
4.5 Teflon Valves .................................................................................13
4.6 Sample Bags .................................................................................13
4.7 Rigid Containers ............................................................................13
4.8 Pump .............................................................................................14
4.9 Flow Meter .....................................................................................14
4.10 Shipping Containers ......................................................................14
4.11 Expendable Materials ....................................................................14
4.11.1 Standard Gas Mixture .........................................................14
4.11.2 Pure Distilled Water ............................................................14
4.11.3 Reagent Grade Sodium Hydroxide Solution .......................14
4.11.4 99.999% N2 or Zero Air .......................................................14

422 - 11
5 PROCEDURE...........................................................................................14
6 QUALITY CONTROL................................................................................17
6.1 Sampling Runs, Time and Volume ................................................17
6.1.1 Sampling Runs.....................................................................17
6.1.2 Sample Time.......................................................................17
6.1.3 Sample Volume...................................................................17
6.2 Routine Sampling Quality Control ..................................................17
6.2.1 Field Blank Samples ...........................................................18
6.2.2 Field Spike Samples ...........................................................18
6.2.3 Collocated Samples ............................................................18
6.2.4 Tedlar Bag Contamination Checks......................................18
Appendix A: Procedure for Production, Cleaning, andContamination Testing of Tedlar Bags...........................................23
List of Figures
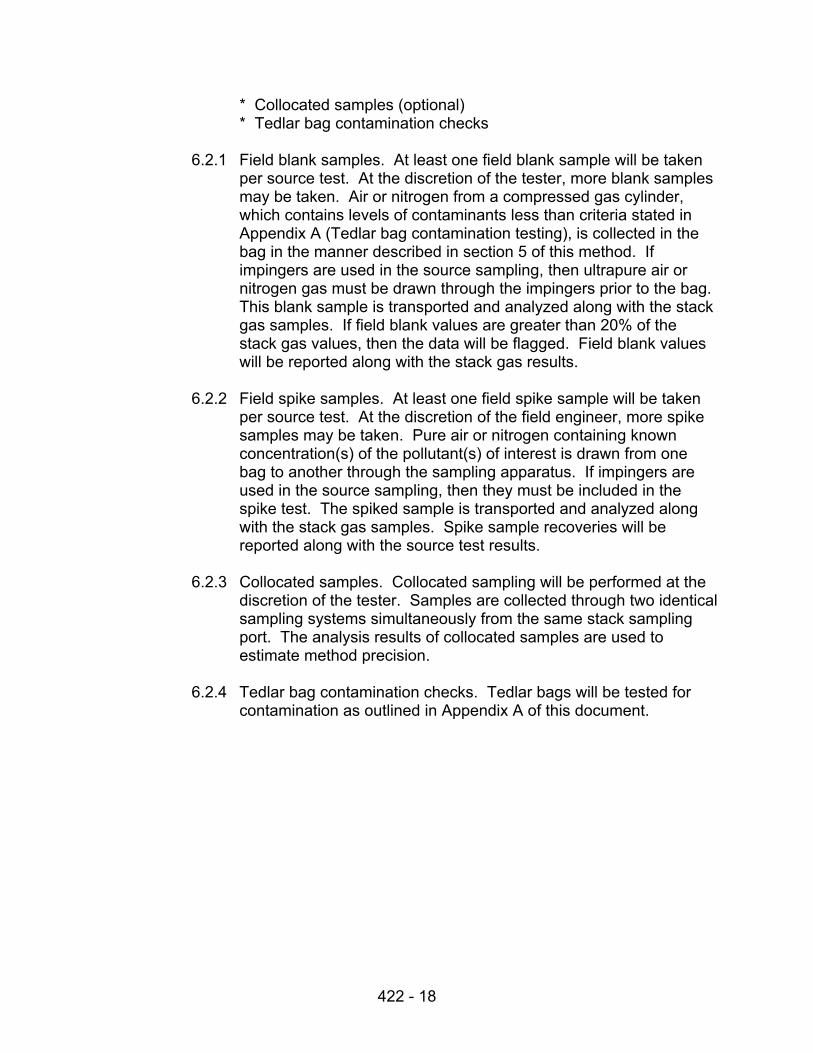
Figure 1 Tedlar Bag Sampling Train ............................................................19
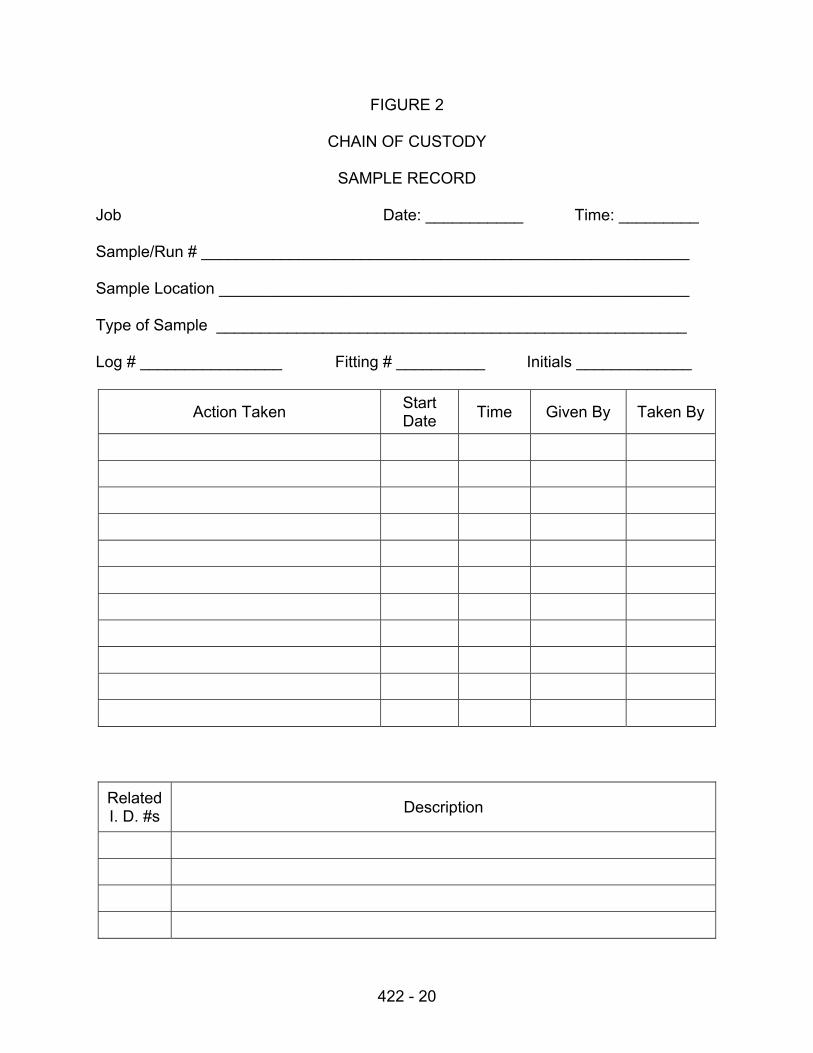
Figure 2 Chain of Custody, Sample Record Form .......................................20
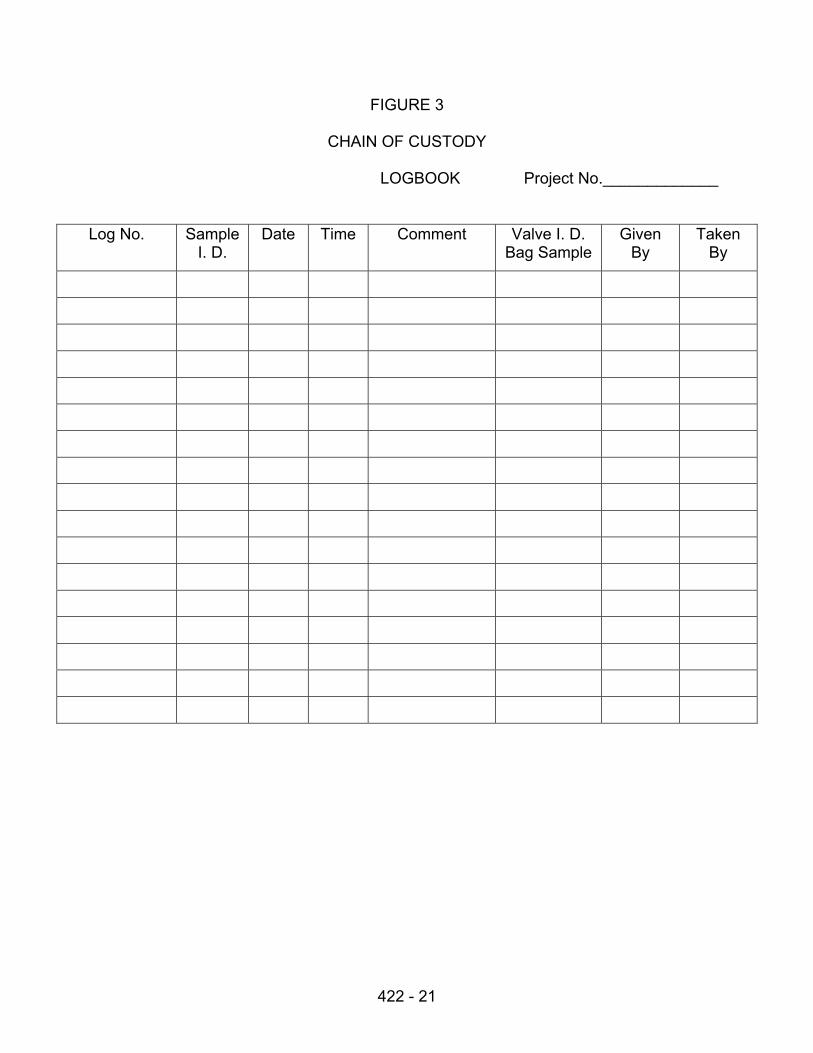
Figure 3 Chain of Custody, Log Book Form.................................................21
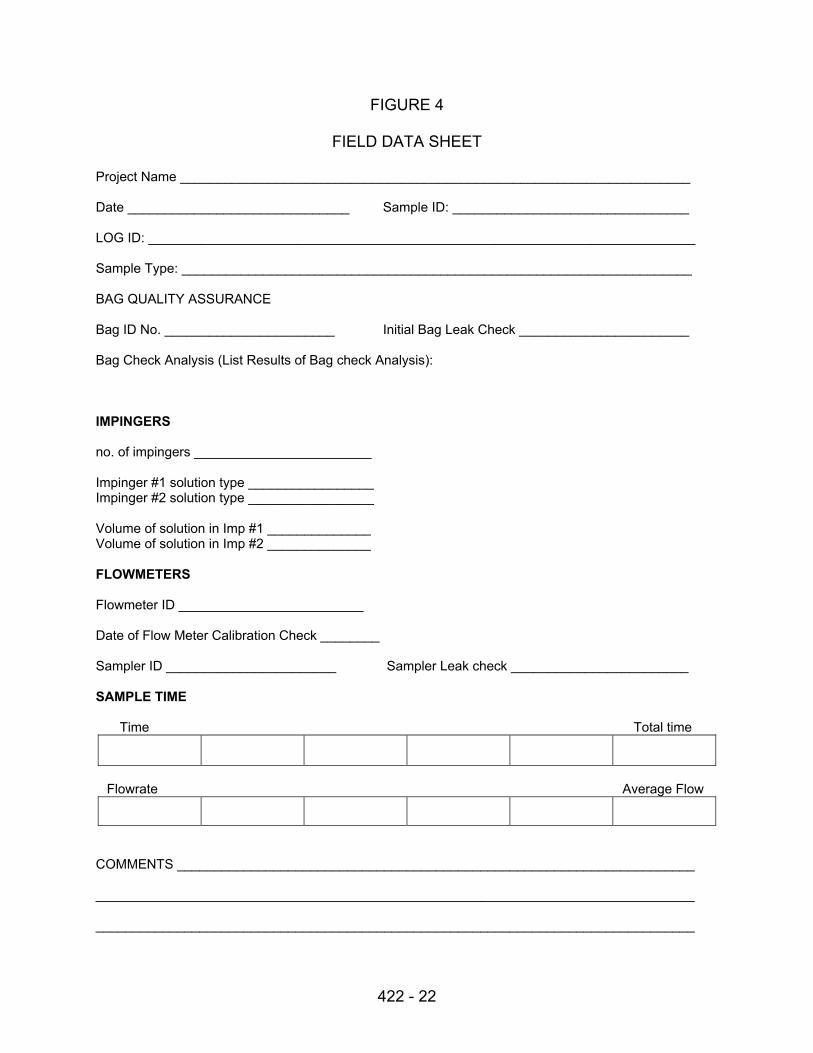
Figure 4 Field Data Sheet ............................................................................22
422 - 12
METHOD 422.1 STANDARD OPERATING PROCEDURE FOR THE SAMPLINGOF VOLATILE ORGANIC COMPOUNDS IN EMISSIONS FROMSTATIONARY SOURCES INTO TEDLAR BAGS.
INTRODUCTION
This method should not be attempted by persons unfamiliar with source sampling, asthere are many details that are beyond the scope of this presentation. Care must beexercised to prevent exposure of sampling personnel to hazardous emissions.
1. APPLICABILITY
This sampling method will use a Tedlar bag to collect volatile organic compounds(VOCs) samples from applicable source emissions and source-impacted ambientair. This sampling method is approved for use with the compounds (withexceptions) referenced in Table 1 (general information). Tedlar bags cannot beused to collect 1,3-butadiene samples from combustion sources.
The procedure described herein is applicable to the sampling of volatile organicsin approximately the 0.001 to 200 ppm range. The lower limit is determined bybag cleanliness, the upper limit may depend on compound vapor pressure andsample matrix.
2. LIMITATIONS
2.1 This method is not applicable where the gases are occluded in particulatematter. Entrainment of gases from the particulate trap (in probe) into thesample gas stream has not been investigated.
2.2 Sampling efficiencies in actual source gas matrices have not beenevaluated.
2.3 Source gas samples collected in Tedlar bags must be analyzed within 72hours.
2.4 This method is not applicable to the collection of samples where there is apotential for explosion.
3. EQUIVALENCY
Alternative sampling methodologies that are demonstrated to be substantiallyequivalent may be used if approved by the Executive Officer. The ExecutiveOfficer may require the submission of test data or other information showing thealternate method is equivalent to method 422. Any modifications to the samplingprocedures described must also be approved in writing by the Executive Officer.
422 - 13
4. APPARATUS
Apparatus required for sampling is described below. It is recommended that allequipment which comes in contact with sampled gas be made of ceramic, glass,Teflon, or Tedlar unless these materials are found unsatisfactory and othermaterials demonstrated suitable in specific situations.
4.1 Probe. Pyrex glass, ceramic or Teflon as appropriate for stacktemperature, equipped with a silanized glass wool plug to removeparticulate matter.
4.2 Alkaline Impinger. An impinger with alkaline solution may be required totrap acid gases in certain cases; if used it will be located between theprobe and the sample line as shown in Figure 1. A Wheaton micro-impinger is recommended. Acid knockout is necessary due to potential formatrix effects (for some compounds) in Tedlar bag samples in thepresence of strong acids. In addition, acids may damage analyticalequipment, ie., corrode tubing and degrade columns.
4.3 Water Impinger. A water impinger is required to control liquid carry overfrom the alkaline impinger. A Wheaton micro-impinger is suitable.
4.4 Sample Line. Teflon tubing, 6.4 mm (1/4 inch) outside diameter, ofminimum length sufficient to connect the probe to bag and not longer than10 feet. If the sample line must be longer than 10 feet, then the sampleline shall be heated and insulated and capable of operation at above100°C (212°F).
4.5 Teflon valves or fittings shall be used to connect sample traincomponents. Mininert Teflon valves are recommended.
4.6 Sample Bags. Bags shall be made of Tedlar film, at least 0.002 in. thick.
4.6.1 Mininert Teflon valves are recommended.
4.6.2 Refer to Appendix A for apparatus used in Tedlar bag manufacture,cleaning, and contamination testing.
4.7 Rigid container(s) for filling sample bags by application of vacuum.
4.7.1 The container shall be airtight when sealed.
4.7.2 The container shall be opaque except that a small window to checkthe condition of the bag within is permissible.
422 - 14
4.7.3 The container shall be fitted with couplings to mate with samplebags, sample line and vacuum line and a flow control valve capableof shutting off flow to the bag.
4.7.4 Sample bags may be fabricated with rigid containers as an integralunit.
4.7.5 An appropriate vacuum relief valve is suggested to protect bagsand rigid container.
4.8 Pump, leak free, with capacity of at least 2 liters per minute.
4.9 Flow meter, rotameter type or equivalent, with measurement range of 0.05to 1.0 liters per minute for observing sampling rate.
4.10 Shipping containers to protect bags in transport shall be opaque to protectbags from ultraviolet light. Containers shall have no staples, sharp edgesor metal closures which might damage bags. The rigid container for fillingbags may be used for bag transport; any window in the container shall becovered with opaque material during such transport.
4.11 Expendable Materials
4.11.1 Standard gas mixture for field spikes. Appropriate cylinder gasescontaining the pollutant(s) of interest in known concentration.
4.11.2 Pure distilled water.
4.11.3 Reagent grade sodium hydroxide solution, 0.1 Normal.
4.11.4 99.999% N2 or zero air.
5. PROCEDURE
The following describes the procedure for collecting samples from stacks. A fieldblank and a field spike must be obtained for each source test (Refer to section 6for discussion).
5.1 (Optional) Determine stack moisture content by ARB Method 4; if moisturecontent is above the 60°F saturation level, then dilution of the sample bagmay be required. If moisture content of stack gas is not determined, thenTedlar bag shall be monitored for condensation during sampling (seeSection 5.7).
5.1.1 Procedure for Sample Bag Dilution. Bags should be pre-filled with99.999% nitrogen or zero air to approximately one-third the final
422 - 15
sample volume. The exact volume of dilution gas must be recordedto allow for correction of data. If condensation still occurs, increasedilution as necessary.
5.2 Determine sample gas acid content with universal pH paper; if pH is lessthan 4, a knockout impinger containing 10 ml of 0.1 N NaOH is required.A water impinger containing 5 ml of distilled water is required to controlcarryover from the alkaline impinger.
5.3 Assemble the sampling train at the sampling site as shown in Figure 1,using impingers when appropriate. The impingers will be placed in thesampling line between the Tedlar bag and the probe.
5.4 Leak check the sample train. If impingers are used, they and the requiredrotameter must be installed prior to the leak test. If impingers are notused, a rotameter must still be installed at the inlet of the box in line withthe probe. To start the leak check, connect the sample line to the bag,making sure the valve on the bag is closed. Place the bag in the rigidcontainer and close as if for sampling. Turn on the vacuum pump until areading of 15 inches H2O is maintained. Make sure that the probe line isnot plugged and that the ON/OFF valve is open. If a leak greater than 5%of the sampling flow rate is found, then the problem must be located andfixed before the leak check continues. Turn the pump off, break thevacuum on the rigid container and open the mininert valve on the Tedlarbag. Place the bag back in the container and close as if for sampling.Plug (leak tight) the end of the probe. Turn on the vacuum pump andadjust until a reading of 15 inches H2O is maintained. If a leak greaterthan 5% of the sampling flow rate is found, then the problem must belocated and fixed before sampling continues. If impingers are used,extreme care must be used when applying and removing the vacuum toavoid carry over of the liquids in the impingers.
5.5 Break the vacuum on the rigid container. Unplug the end of the probe andplace the end of the probe in the stack away from the walls. Care shouldbe taken to avoid dilution of the stack gas sample with ambient air bysealing the open port area around the probe, especially in stacks withnegative static pressure.
5.6 Make sure the sampling train is configured correctly, the valve on thesample bag is open and the ON/OFF valve is closed. Turn the vacuumpump on and adjust until a reading of the 15 inches H2O is maintained.Begin sampling by opening the ON/OFF valve. Record the sample starttime on the field data sheet.
5.7 Monitor the container vacuum and sample flow rate and adjust asnecessary. After sampling for the planned interval, close the ON/OFF
422 - 16
valve noting the time on the field data sheet. Bags should be filled nomore than half full. If condensation occurs, discard sample and resampleas per 5.1.1.
5.8 If impingers are used, the sampling apparatus is purged with 99.999%nitrogen into the Tedlar bag at the same flow rate as normal sampling butfor 1/3 the actual sample time. Disconnect the probe line from theON/OFF valve and connect the purge gas line. Open the ON/OFF valveand record the purge flow rate and time on the field data sheet.
5.9 After sample purge is complete, close the ON/OFF valve, turn the pumpoff, break the vacuum on the rigid container and close the mininert valveon the bag.
5.10 Attach a label to each Tedlar bag sample (and impinger if used) containingthe following information:
Job #DateTimeSample/Run #Plant NameSample LocationLog #Initials of Sampler Operator
5.11 Promptly place the sealed bag in a shipping container; close the containerto prevent possible degradation of the sample by ultraviolet light. Severalbags may be placed in the same shipping container.
5.12 If impingers were used, promptly place impinger solutions in vials with noair space, cap and enclose in a shipping container (or wrap with aluminumfoil to prevent possible degradation of the sample by ultraviolet light).Store impinger solutions on ice. Impinger solutions may be analyzed ifsuspected to contain analytes of interest. EPA purge and trap protocolsfor VOC analysis of water samples should be used (i.e., Method 624).
5.13 Fill out the Chain of Custody-Sample Record, Log Book Data sheets, andField Data sheets. Copies of these forms are attached as Figures 2, 3and 4.
5.14 Sample Bag Transport Procedure
5.14.1 Transport sample bags in opaque shipping containers.
422 - 17
5.14.2 Airborne transport could potentially result in rupturing of bagscontaining toxic samples. Surface shipment is advised. If airbornetransport is unavoidable then bags should not be filled more thanhalf way to avoid bag rupture.
5.14.3 Deliver bags to laboratory for analysis promptly. Check analysismethod for allowable sample holding times.
6. QUALITY CONTROL
6.1 Sampling Runs, Time and Volume
6.1.1 Sampling runs. The number of sampling runs must be sufficient toprovide minimal statistical data and in no case shall be less thanthree (3) runs per source test.
6.1.2 Sample time. Integrated bag sampling. The sampling must be ofsufficient duration to provide coverage of the average operatingcondition of the source. However, the minimum sampling time shallnot be less than 20 minutes.
6.1.3 Sample volume. The sample volume will be based on the facility’spermitted emission rate of the target analytes and the amountneeded to meet the specific analyte’s LOD. The volume may becalculated using the following formula:
Sample Volume = nCI
B100A ×××
Where:
A = The analytical LOD in ngB = The percent (%) of the sample required per analytical runC = Allowable stack emissions (ng/l)n = multiplier to insure that sufficient sample is collected for
additional analytical runs; must be ≥ 3.
The calculated sample volume is in liters.
6.2 Routine Sampling Quality Control. This section outlines the minimumquality control operations necessary to assure accuracy of data generatedfrom samples collected in Tedlar bags. These QC operations are asfollows:
* Field blank samples* Field spike samples
422 - 18
* Collocated samples (optional)* Tedlar bag contamination checks
6.2.1 Field blank samples. At least one field blank sample will be takenper source test. At the discretion of the tester, more blank samplesmay be taken. Air or nitrogen from a compressed gas cylinder,which contains levels of contaminants less than criteria stated inAppendix A (Tedlar bag contamination testing), is collected in thebag in the manner described in section 5 of this method. Ifimpingers are used in the source sampling, then ultrapure air ornitrogen gas must be drawn through the impingers prior to the bag.This blank sample is transported and analyzed along with the stackgas samples. If field blank values are greater than 20% of thestack gas values, then the data will be flagged. Field blank valueswill be reported along with the stack gas results.
6.2.2 Field spike samples. At least one field spike sample will be takenper source test. At the discretion of the field engineer, more spikesamples may be taken. Pure air or nitrogen containing knownconcentration(s) of the pollutant(s) of interest is drawn from onebag to another through the sampling apparatus. If impingers areused in the source sampling, then they must be included in thespike test. The spiked sample is transported and analyzed alongwith the stack gas samples. Spike sample recoveries will bereported along with the source test results.
6.2.3 Collocated samples. Collocated sampling will be performed at thediscretion of the tester. Samples are collected through two identicalsampling systems simultaneously from the same stack samplingport. The analysis results of collocated samples are used toestimate method precision.
6.2.4 Tedlar bag contamination checks. Tedlar bags will be tested forcontamination as outlined in Appendix A of this document.
422 - 19
FIGURE 1
422 - 20
FIGURE 2
CHAIN OF CUSTODY
SAMPLE RECORD
Job Date: ___________ Time: _________
Sample/Run # _______________________________________________________
Sample Location _____________________________________________________
Type of Sample _____________________________________________________
Log # ________________ Fitting # __________ Initials _____________
Action Taken StartDate Time Given By Taken By
RelatedI. D. #s Description
422 - 21
FIGURE 3
CHAIN OF CUSTODY
LOGBOOK Project No._____________
Log No. SampleI. D.
Date Time Comment Valve I. D.Bag Sample
GivenBy
TakenBy
422 - 22
FIGURE 4
FIELD DATA SHEET
Project Name _____________________________________________________________________
Date ______________________________ Sample ID: ________________________________
LOG ID: __________________________________________________________________________
Sample Type: _____________________________________________________________________
BAG QUALITY ASSURANCE
Bag ID No. _______________________ Initial Bag Leak Check _______________________
Bag Check Analysis (List Results of Bag check Analysis):
IMPINGERS
no. of impingers ________________________
Impinger #1 solution type _________________Impinger #2 solution type _________________
Volume of solution in Imp #1 ______________Volume of solution in Imp #2 ______________
FLOWMETERS
Flowmeter ID _________________________
Date of Flow Meter Calibration Check ________
Sampler ID _______________________ Sampler Leak check ________________________
SAMPLE TIME
Time Total time
Flowrate Average Flow
COMMENTS ______________________________________________________________________
_________________________________________________________________________________
_________________________________________________________________________________
422 - 23
Method 422.1
Appendix A
Procedure for production, Cleaning and ContaminationTesting of Tedlar Bags
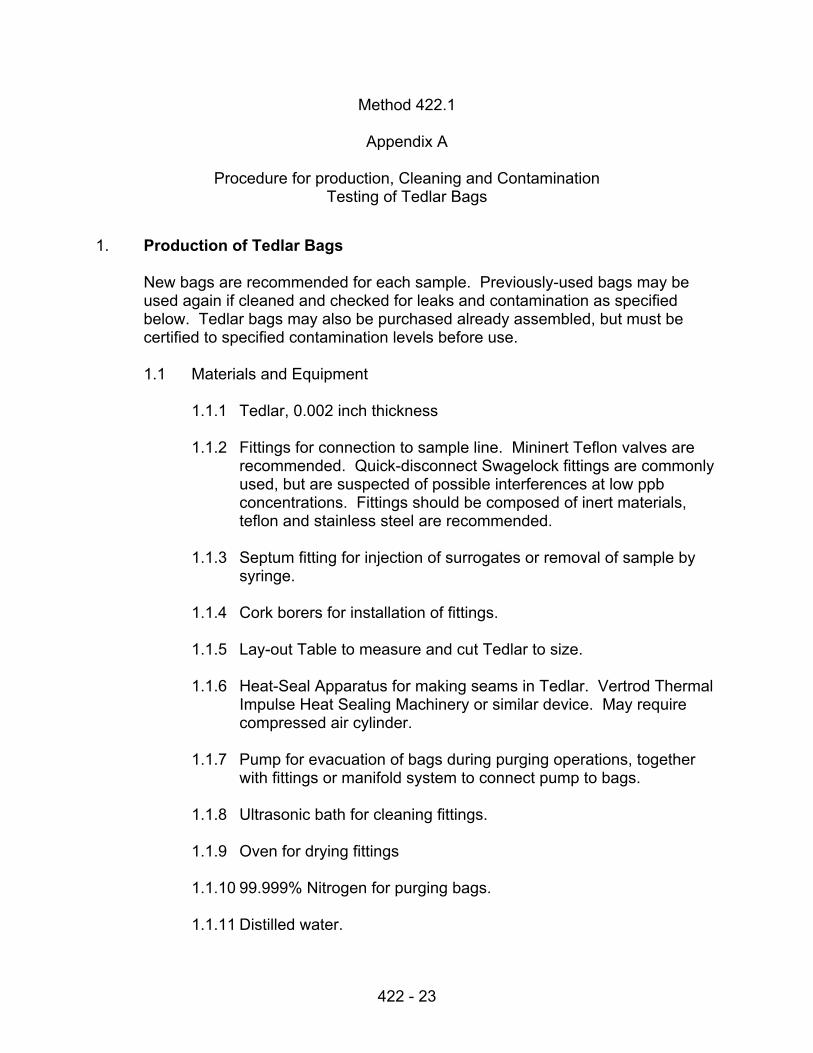
1. Production of Tedlar Bags
New bags are recommended for each sample. Previously-used bags may beused again if cleaned and checked for leaks and contamination as specifiedbelow. Tedlar bags may also be purchased already assembled, but must becertified to specified contamination levels before use.
1.1 Materials and Equipment
1.1.1 Tedlar, 0.002 inch thickness
1.1.2 Fittings for connection to sample line. Mininert Teflon valves arerecommended. Quick-disconnect Swagelock fittings are commonlyused, but are suspected of possible interferences at low ppbconcentrations. Fittings should be composed of inert materials,teflon and stainless steel are recommended.
1.1.3 Septum fitting for injection of surrogates or removal of sample bysyringe.
1.1.4 Cork borers for installation of fittings.
1.1.5 Lay-out Table to measure and cut Tedlar to size.
1.1.6 Heat-Seal Apparatus for making seams in Tedlar. Vertrod ThermalImpulse Heat Sealing Machinery or similar device. May requirecompressed air cylinder.
1.1.7 Pump for evacuation of bags during purging operations, togetherwith fittings or manifold system to connect pump to bags.
1.1.8 Ultrasonic bath for cleaning fittings.
1.1.9 Oven for drying fittings
1.1.10 99.999% Nitrogen for purging bags.
1.1.11 Distilled water.
422 - 24
1.2 Clean Fittings
Use of organic solvents is not recommended due to possiblecontamination of bags.
1.2.1 Clean fittings by placing them in soapy water in ultrasonic bath forabout one hour. Rinse fittings thoroughly with clean water, followedby a rinse with distilled water.
1.2.2 Bake fittings in a 100°F oven for at least 8 hours.
1.3 Manufacture of Tedlar bag
Tedlar bags should be constructed in a clean area, with care taken toavoid contamination such as exposure to chemical fumes, solvent vaporsor motor exhaust.
1.3.1 Cut one piece of Tedlar film from roll on lay-out table using a razorblade. A sheet of Tedlar measuring about 54” by 30” will makeabout a 30 Liter capacity bag (15 L at half-full).
1.3.2 Fold Tedlar sheet in half and make two seams using heat-sealapparatus. Seams should be at least ½ inch from edge.
1.3.3 Place piece of cardboard inside bag. Use cork borer to makeappropriate size hole for fittings, using cardboard to protect otherside of bag. Tedlar film should fit snugly around base of fitting.
1.3.4 Attach previously cleaned sample line fitting. Use Teflon washerson inside and outside of bag to secure fitting.
1.3.5 Attach septum fitting if necessary. (Mininert valves have septumand sample line connections all on one fitting)
1.3.6 Seal remaining seam using heat-seal apparatus.
2. Leak Test
Check all sample bags for leaks by inflating with 99.999% nitrogen to a pressureof 2 to 4 inches of water. Good bags should hold constant pressure as indicatedby a manometer for 10 minutes or (alternative test) should remain taut andinflated overnight. A small weight (e. g. Kimwipe box) may be placed on top ofbag for the overnight leak check. Report bag acceptability on field data sheet(figure 4); destroy or repair and retest defective bags.
422 - 25
3. Bag Cleaning
Purge the bag with 99.999% nitrogen repeatedly until acceptable contaminantvalues are attained. ARB staff experience has shown that 3 to 8 purges areneeded to meet the target contamination levels of <1 ppb for most VOCs ofinterest.
4. Bag Contamination Check
4.1 Check bags for contamination by filling them halfway (so that checkvolume approximates actual sample volume) with 99.999% nitrogen, allowto equilibriate for 24 hours, then analyze for the pollutant(s) of interest.Refer to appropriate Method 422 analysis procedure.
4.2 Acceptable contamination levels may vary depending on the expectedsample concentration. However, bags which contain contaminants atlevels greater than 20% of the desired reportable limit should be rejected.Thus, the minimum reportable limit will be 5 times the LOQ.
4.3 Label bags and record contamination levels. Also record contaminationlevels on field data sheets.
422 - 26
State of CaliforniaAir Resources Board
Method 422.101
Standard Operating Procedure for the GasChromatographic Analysis of Volatile Halogenated
Organic Compounds from Stationary Source SamplesCollected in Tedlar Bags
422 - 27
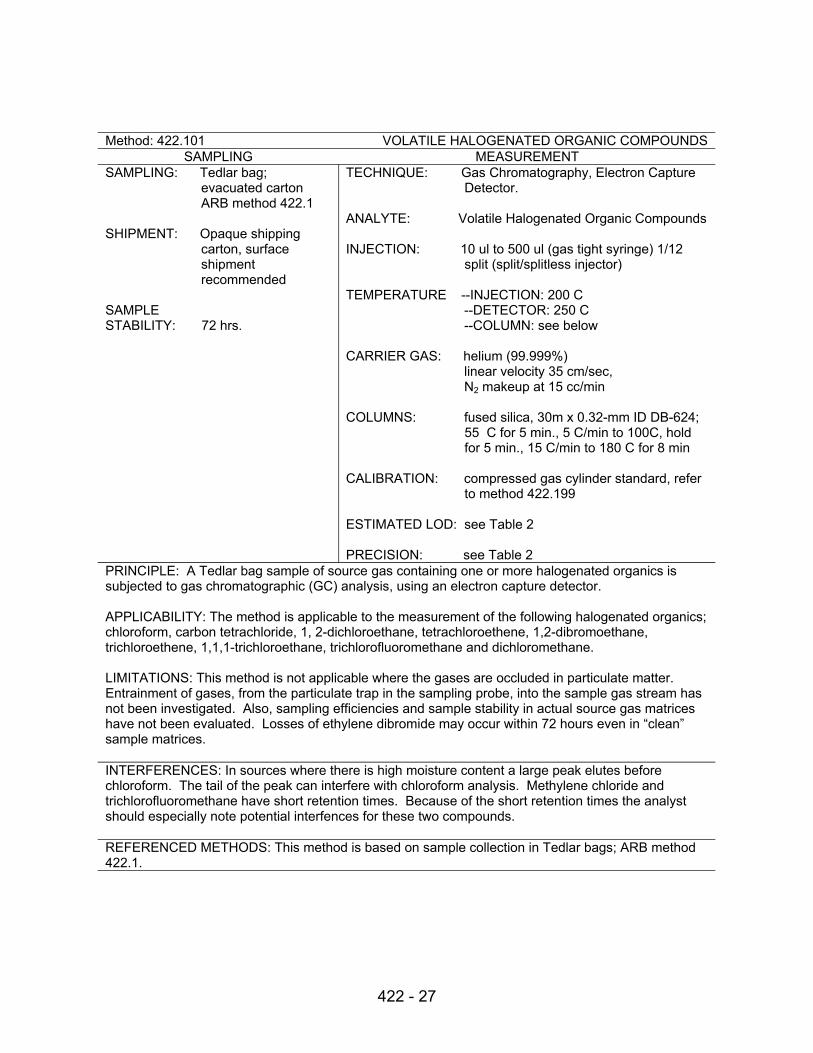
Method: 422.101 VOLATILE HALOGENATED ORGANIC COMPOUNDSSAMPLING MEASUREMENT
SAMPLING: Tedlar bag;evacuated cartonARB method 422.1
SHIPMENT: Opaque shippingcarton, surfaceshipmentrecommended
SAMPLESTABILITY: 72 hrs.
TECHNIQUE: Gas Chromatography, Electron CaptureDetector.
ANALYTE: Volatile Halogenated Organic Compounds
INJECTION: 10 ul to 500 ul (gas tight syringe) 1/12split (split/splitless injector)
TEMPERATURE --INJECTION: 200 C --DETECTOR: 250 C --COLUMN: see below
CARRIER GAS: helium (99.999%) linear velocity 35 cm/sec, N2 makeup at 15 cc/min
COLUMNS: fused silica, 30m x 0.32-mm ID DB-624;55 C for 5 min., 5 C/min to 100C, holdfor 5 min., 15 C/min to 180 C for 8 min
CALIBRATION: compressed gas cylinder standard, referto method 422.199
ESTIMATED LOD: see Table 2
PRECISION: see Table 2PRINCIPLE: A Tedlar bag sample of source gas containing one or more halogenated organics issubjected to gas chromatographic (GC) analysis, using an electron capture detector.
APPLICABILITY: The method is applicable to the measurement of the following halogenated organics;chloroform, carbon tetrachloride, 1, 2-dichloroethane, tetrachloroethene, 1,2-dibromoethane,trichloroethene, 1,1,1-trichloroethane, trichlorofluoromethane and dichloromethane.
LIMITATIONS: This method is not applicable where the gases are occluded in particulate matter.Entrainment of gases, from the particulate trap in the sampling probe, into the sample gas stream hasnot been investigated. Also, sampling efficiencies and sample stability in actual source gas matriceshave not been evaluated. Losses of ethylene dibromide may occur within 72 hours even in “clean”sample matrices.
INTERFERENCES: In sources where there is high moisture content a large peak elutes beforechloroform. The tail of the peak can interfere with chloroform analysis. Methylene chloride andtrichlorofluoromethane have short retention times. Because of the short retention times the analystshould especially note potential interfences for these two compounds.
REFERENCED METHODS: This method is based on sample collection in Tedlar bags; ARB method422.1.
422 - 28
VOLATILE HALOGENATED ORGANICS METHOD: 422.101REAGENTS:*1. Halogenated organics, @1000 ppb, 100, and
10 ppb in compressed gas cylinders.2. Helium, 99.999%3. Air, purified, to be used for dilutions, blank
preparation, and standard preparation.
EQUIPMENT:*1. Gas chromatograph, electron capture detector,
intergrator, and columns.2. Syringes, gas tight, 100-, 250-, 500- uL3. Flow meters; rotameter type, 0 to 100 ml/min.4. Gas regulators, stainless steel, dual stage with
metal or teflon diaphrams.
* Refer to ARB method 422.1 for reagents and equipment used in Tedlar bag sampling
SAMPLING:Refer to ARB method 422.1 for procedures used in Tedlar bag sampling.
CALIBRATION AND QUALITY CONTROL:Refer to ARB method 442.199 for multipoint and daily calibration and quality control procedures.
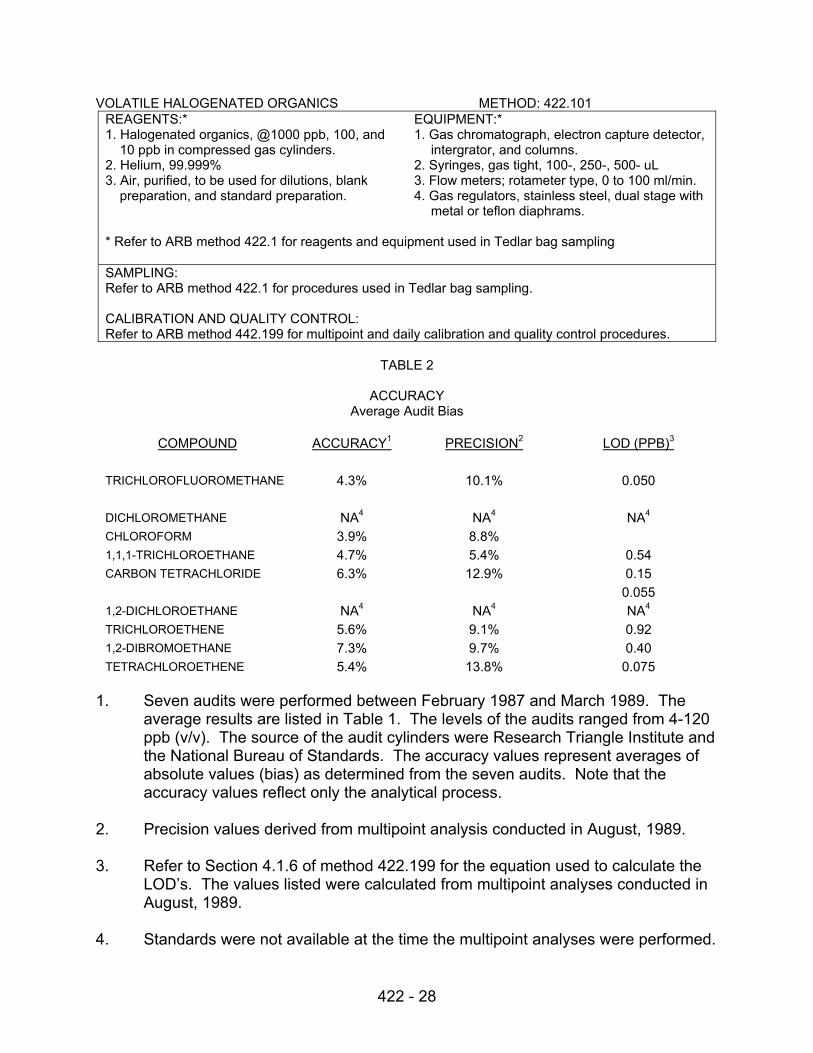
TABLE 2
ACCURACYAverage Audit Bias
COMPOUND ACCURACY1 PRECISION2 LOD (PPB)3
TRICHLOROFLUOROMETHANE 4.3% 10.1% 0.050
DICHLOROMETHANE NA4 NA4 NA4
CHLOROFORM 3.9% 8.8%1,1,1-TRICHLOROETHANE 4.7% 5.4% 0.54CARBON TETRACHLORIDE 6.3% 12.9% 0.15
0.0551,2-DICHLOROETHANE NA4 NA4 NA4
TRICHLOROETHENE 5.6% 9.1% 0.921,2-DIBROMOETHANE 7.3% 9.7% 0.40TETRACHLOROETHENE 5.4% 13.8% 0.075
1. Seven audits were performed between February 1987 and March 1989. Theaverage results are listed in Table 1. The levels of the audits ranged from 4-120ppb (v/v). The source of the audit cylinders were Research Triangle Institute andthe National Bureau of Standards. The accuracy values represent averages ofabsolute values (bias) as determined from the seven audits. Note that theaccuracy values reflect only the analytical process.
2. Precision values derived from multipoint analysis conducted in August, 1989.
3. Refer to Section 4.1.6 of method 422.199 for the equation used to calculate theLOD’s. The values listed were calculated from multipoint analyses conducted inAugust, 1989.
4. Standards were not available at the time the multipoint analyses were performed.
422 - 29
State of CaliforniaAir Resources Board
Method 422.102
Standard Operating Procedure for theGas Chromatographic Analysis of 1,3-Butadiene
in Emissions from Stationary Sources
422 - 30
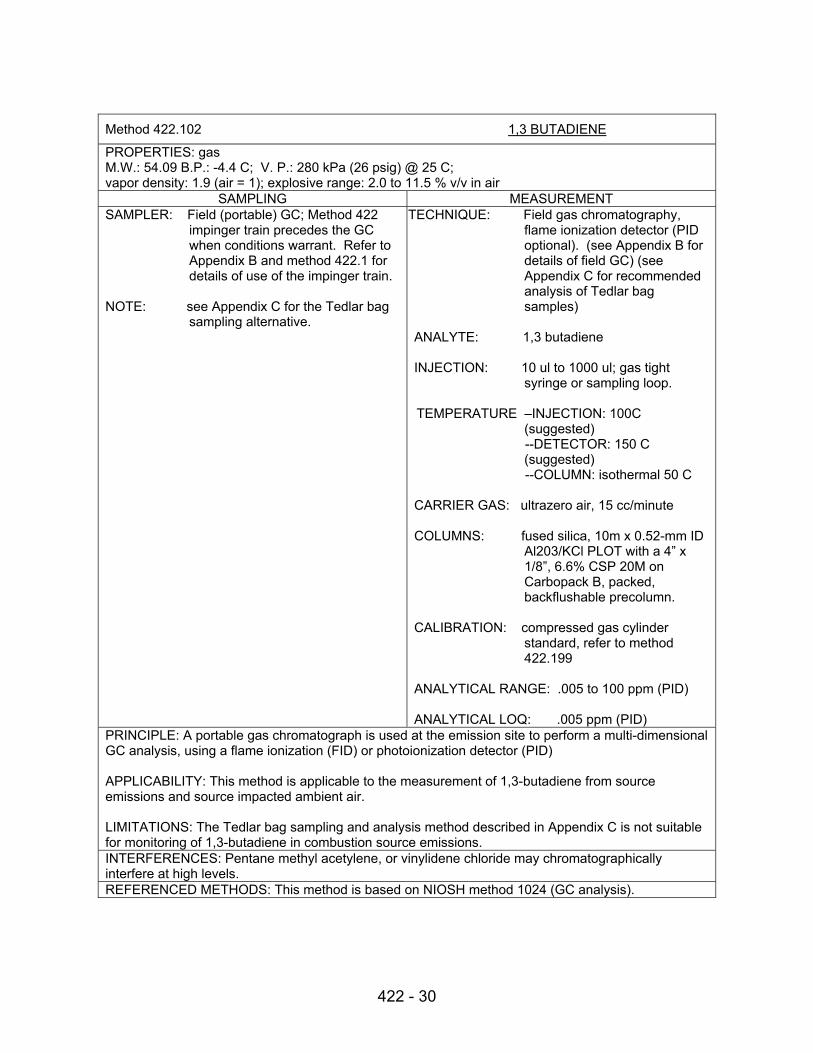
Method 422.102 1,3 BUTADIENE
PROPERTIES: gasM.W.: 54.09 B.P.: -4.4 C; V. P.: 280 kPa (26 psig) @ 25 C;vapor density: 1.9 (air = 1); explosive range: 2.0 to 11.5 % v/v in air
SAMPLING MEASUREMENTSAMPLER: Field (portable) GC; Method 422
impinger train precedes the GCwhen conditions warrant. Refer toAppendix B and method 422.1 fordetails of use of the impinger train.
NOTE: see Appendix C for the Tedlar bagsampling alternative.
TECHNIQUE: Field gas chromatography,flame ionization detector (PIDoptional). (see Appendix B fordetails of field GC) (seeAppendix C for recommendedanalysis of Tedlar bagsamples)
ANALYTE: 1,3 butadiene
INJECTION: 10 ul to 1000 ul; gas tightsyringe or sampling loop.
TEMPERATURE –INJECTION: 100C(suggested)
--DETECTOR: 150 C(suggested)
--COLUMN: isothermal 50 C
CARRIER GAS: ultrazero air, 15 cc/minute
COLUMNS: fused silica, 10m x 0.52-mm IDAl203/KCl PLOT with a 4” x1/8”, 6.6% CSP 20M onCarbopack B, packed,backflushable precolumn.
CALIBRATION: compressed gas cylinderstandard, refer to method422.199
ANALYTICAL RANGE: .005 to 100 ppm (PID)
ANALYTICAL LOQ: .005 ppm (PID)PRINCIPLE: A portable gas chromatograph is used at the emission site to perform a multi-dimensionalGC analysis, using a flame ionization (FID) or photoionization detector (PID)
APPLICABILITY: This method is applicable to the measurement of 1,3-butadiene from sourceemissions and source impacted ambient air.
LIMITATIONS: The Tedlar bag sampling and analysis method described in Appendix C is not suitablefor monitoring of 1,3-butadiene in combustion source emissions.INTERFERENCES: Pentane methyl acetylene, or vinylidene chloride may chromatographicallyinterfere at high levels.REFERENCED METHODS: This method is based on NIOSH method 1024 (GC analysis).
422 - 31
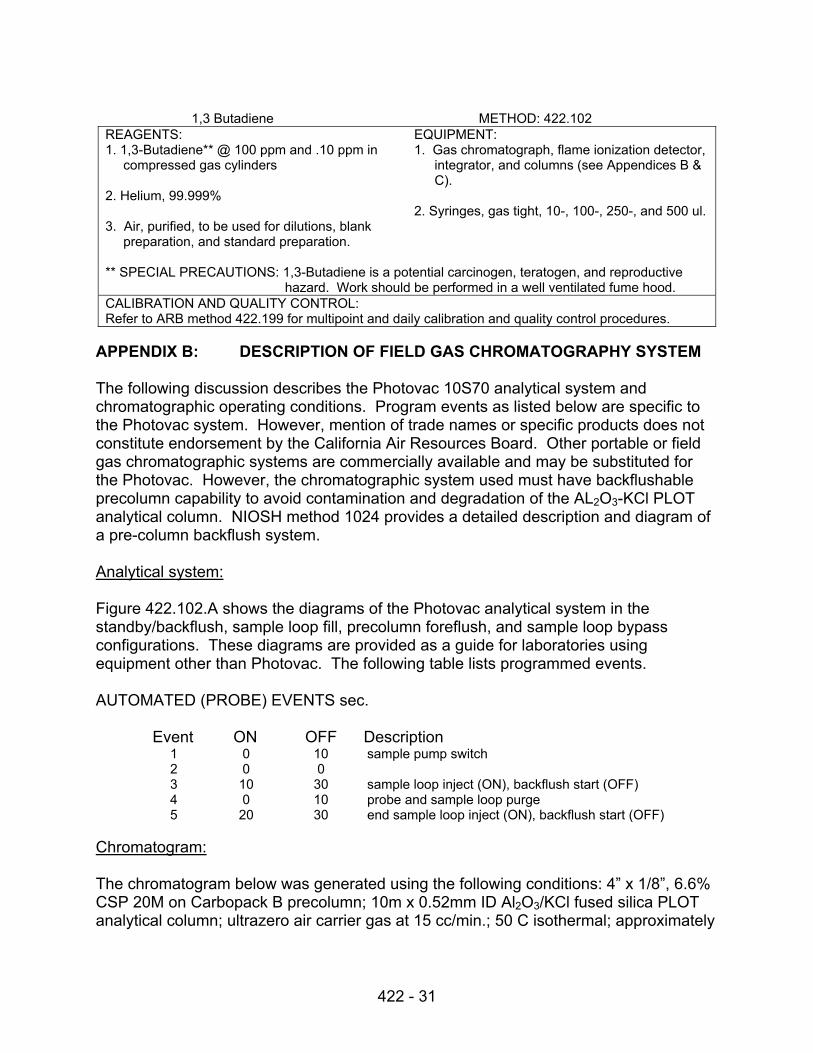
1,3 Butadiene METHOD: 422.102REAGENTS:1. 1,3-Butadiene** @ 100 ppm and .10 ppm in
compressed gas cylinders
2. Helium, 99.999%
3. Air, purified, to be used for dilutions, blankpreparation, and standard preparation.
EQUIPMENT:1. Gas chromatograph, flame ionization detector,
integrator, and columns (see Appendices B &C).
2. Syringes, gas tight, 10-, 100-, 250-, and 500 ul.
** SPECIAL PRECAUTIONS: 1,3-Butadiene is a potential carcinogen, teratogen, and reproductivehazard. Work should be performed in a well ventilated fume hood.
CALIBRATION AND QUALITY CONTROL:Refer to ARB method 422.199 for multipoint and daily calibration and quality control procedures.
APPENDIX B: DESCRIPTION OF FIELD GAS CHROMATOGRAPHY SYSTEM
The following discussion describes the Photovac 10S70 analytical system andchromatographic operating conditions. Program events as listed below are specific tothe Photovac system. However, mention of trade names or specific products does notconstitute endorsement by the California Air Resources Board. Other portable or fieldgas chromatographic systems are commercially available and may be substituted forthe Photovac. However, the chromatographic system used must have backflushableprecolumn capability to avoid contamination and degradation of the AL2O3-KCl PLOTanalytical column. NIOSH method 1024 provides a detailed description and diagram ofa pre-column backflush system.
Analytical system:
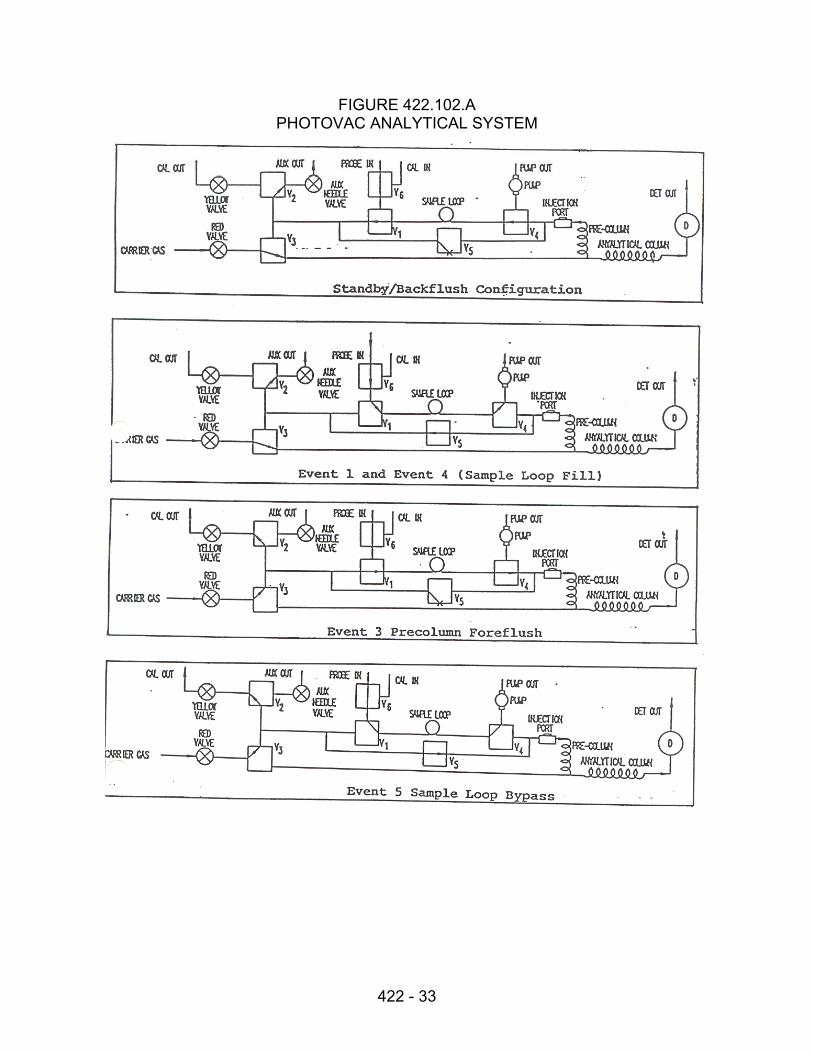
Figure 422.102.A shows the diagrams of the Photovac analytical system in thestandby/backflush, sample loop fill, precolumn foreflush, and sample loop bypassconfigurations. These diagrams are provided as a guide for laboratories usingequipment other than Photovac. The following table lists programmed events.
AUTOMATED (PROBE) EVENTS sec.
Event ON OFF Description1 0 10 sample pump switch2 0 03 10 30 sample loop inject (ON), backflush start (OFF)4 0 10 probe and sample loop purge5 20 30 end sample loop inject (ON), backflush start (OFF)
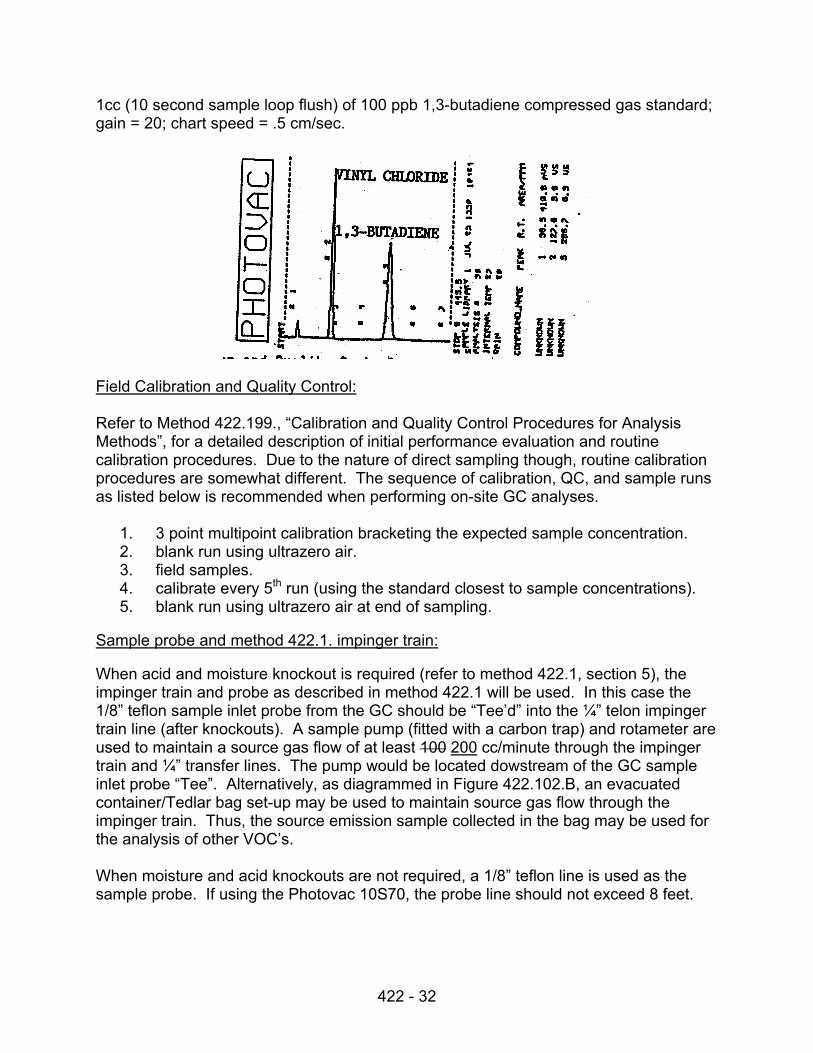
Chromatogram:
The chromatogram below was generated using the following conditions: 4” x 1/8”, 6.6%CSP 20M on Carbopack B precolumn; 10m x 0.52mm ID Al2O3/KCl fused silica PLOTanalytical column; ultrazero air carrier gas at 15 cc/min.; 50 C isothermal; approximately
422 - 32
1cc (10 second sample loop flush) of 100 ppb 1,3-butadiene compressed gas standard;gain = 20; chart speed = .5 cm/sec.
Field Calibration and Quality Control:
Refer to Method 422.199., “Calibration and Quality Control Procedures for AnalysisMethods”, for a detailed description of initial performance evaluation and routinecalibration procedures. Due to the nature of direct sampling though, routine calibrationprocedures are somewhat different. The sequence of calibration, QC, and sample runsas listed below is recommended when performing on-site GC analyses.
1. 3 point multipoint calibration bracketing the expected sample concentration.2. blank run using ultrazero air.3. field samples.4. calibrate every 5th run (using the standard closest to sample concentrations).5. blank run using ultrazero air at end of sampling.
Sample probe and method 422.1. impinger train:
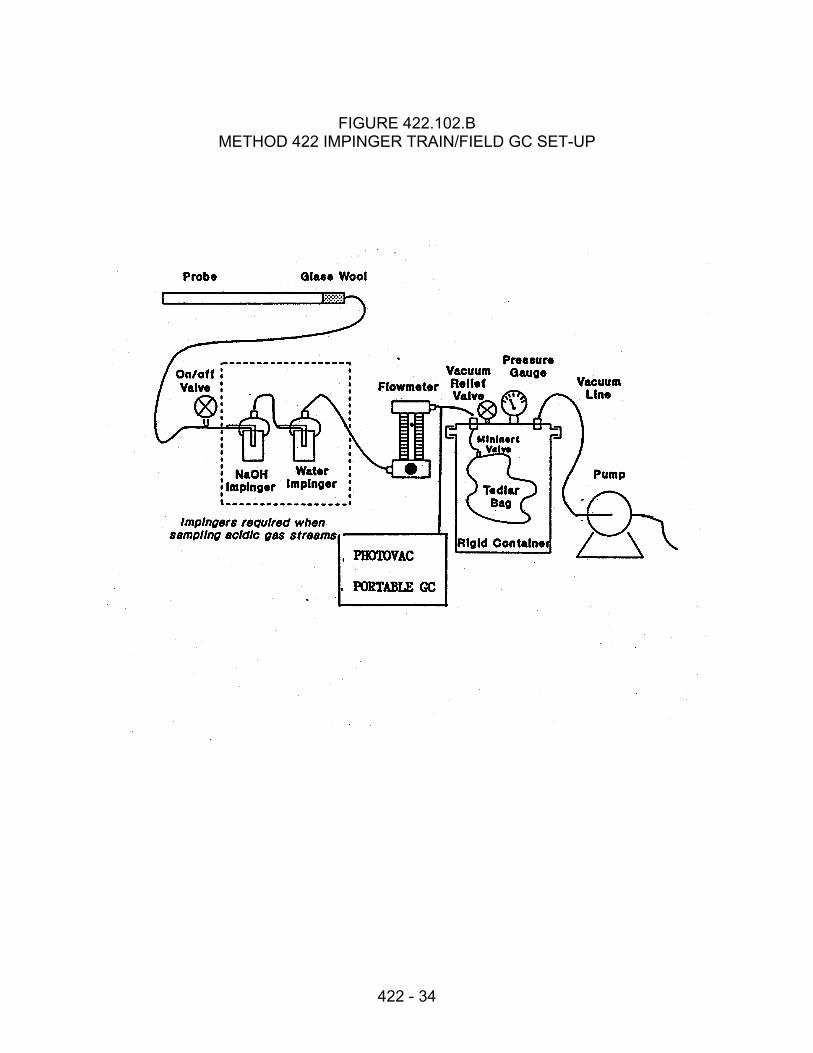
When acid and moisture knockout is required (refer to method 422.1, section 5), theimpinger train and probe as described in method 422.1 will be used. In this case the1/8” teflon sample inlet probe from the GC should be “Tee’d” into the ¼” telon impingertrain line (after knockouts). A sample pump (fitted with a carbon trap) and rotameter areused to maintain a source gas flow of at least 100 200 cc/minute through the impingertrain and ¼” transfer lines. The pump would be located dowstream of the GC sampleinlet probe “Tee”. Alternatively, as diagrammed in Figure 422.102.B, an evacuatedcontainer/Tedlar bag set-up may be used to maintain source gas flow through theimpinger train. Thus, the source emission sample collected in the bag may be used forthe analysis of other VOC’s.
When moisture and acid knockouts are not required, a 1/8” teflon line is used as thesample probe. If using the Photovac 10S70, the probe line should not exceed 8 feet.
422 - 33
FIGURE 422.102.APHOTOVAC ANALYTICAL SYSTEM
422 - 34
FIGURE 422.102.BMETHOD 422 IMPINGER TRAIN/FIELD GC SET-UP
422 - 35
1,3-Butadiene METHOD: 422.102
APPENDIX C: TEDLAR BAG SAMPLING (METHOD 422.1) AND ANALYSISALTERNATIVE
Emissions from sources other than the combustion type (i.e., waste incineration, internalcombustion engines, etc.) may be sampled using CARB method 422.1, which is anevacuated container/Tedlar bag procedure. If the tester is unsure of the samplestability, the tester should conduct a stability test. Validation tests performed by ARBstaff have shown that 1,3-butadiene is not stable in bag samples collected from wasteincinerators and IC engines. Decomposition of 1,3-butadiene in these type of samplestends to be too fast to allow even for a strict time requirement on bag analysis. Thus,for combustion type sources, the direct sampling/analysis described in Appendix B isnecessary.
Recommended Analytical Procedure:
NIOSH method 1024 describes a method of GC analysis for 1,3-butadiene using a 50-mx 0.32-mm ID fused-silica porous-layer open-tubular (PLOT) analytical column coatedwith Al2O3/KCl (Cat. #7515, Chrompack, Bridgewater, NJ) along with a 10-m x 0.5-mmID fused silica CP Wax 57 CB precolumn (Cat. # 7648, Chrompack, Bridgewater, NJ).The Al2O3 column provides a very efficient separation of 1,3-butadiene from other C4 toC6 hydrocarbons at temperatures above ambient. The backflushable precolumn allowslight hydrocarbons to pass through, but water, and polar or high boiling compounds areretained and can be backflushed. The precolumn is especially necessary when usingthe Al2O3/KCl column because water from the samples would deactivate the aluminumoxide, reducing the retention times, and high boiling or polar substances couldaccumulate on the column and irreversibly degrade the separation.
The chromatography in NIOSH method 1024 is set up for syringe injection of solventextracted samples. In order to accomodate whole air samples, some modification of thesystem may be required. For source samples with relatively high levels of 1,3-butadiene (i.e., 1 ppm and above), gas tight sringes or sample loops would beappropriate for sample transfer to the GC. However, to achieve detection limits in thelow ppb range, some means of sample preconcentration is required. A modified versionof the NIOSH method has been used by ARB and is presented below. The onlysignificant changes are the addition of a cryogenic preconcentrator (to handle whole airsamples and get adequate detection limits) and the use of a poraplot Q precolumn.Refer to Figures 422.201.C & D for a diagram of the analytical system, list ofprogrammed events and chromatogram.
Technique: gas chromatography, PID; column pressure switching system
Preconcentration: 18 cc, 9cc/min for 2 minutes, controlled by mass flowcontroller; cyrotrapped on a 5” x 0.32-mm ID GSQ capillary
422 - 36
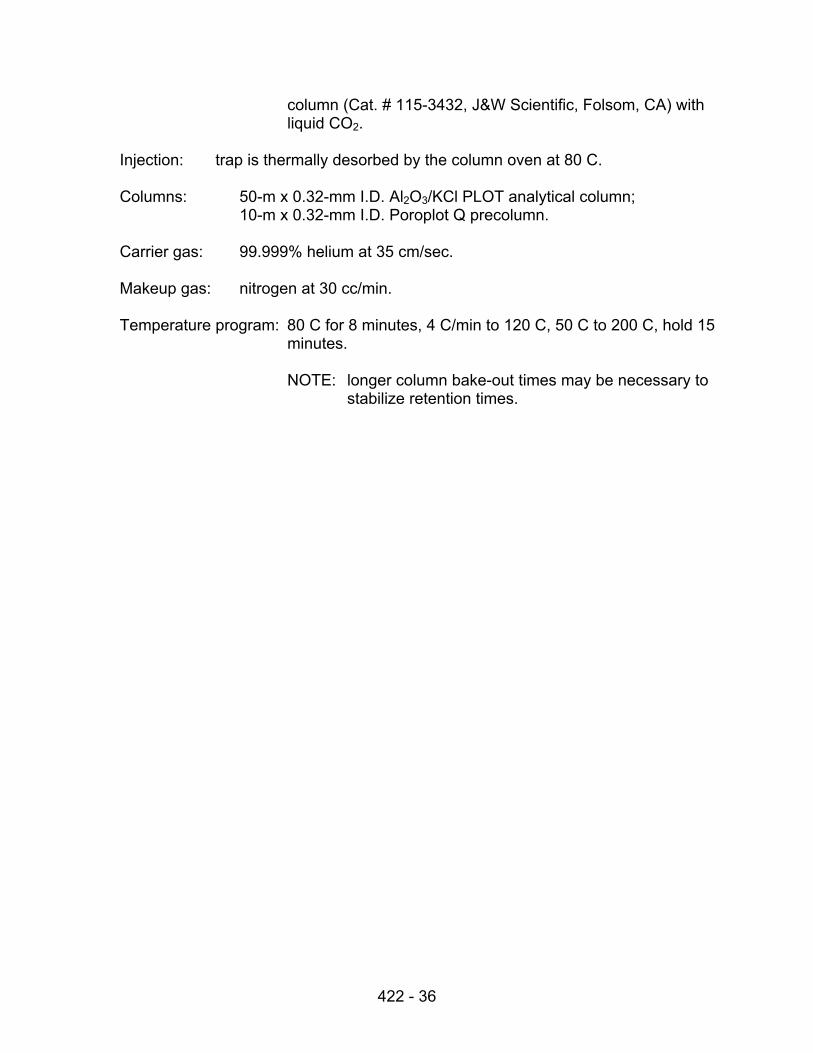
column (Cat. # 115-3432, J&W Scientific, Folsom, CA) withliquid CO2.
Injection: trap is thermally desorbed by the column oven at 80 C.
Columns: 50-m x 0.32-mm I.D. Al2O3/KCl PLOT analytical column;10-m x 0.32-mm I.D. Poroplot Q precolumn.
Carrier gas: 99.999% helium at 35 cm/sec.
Makeup gas: nitrogen at 30 cc/min.
Temperature program: 80 C for 8 minutes, 4 C/min to 120 C, 50 C to 200 C, hold 15minutes.
NOTE: longer column bake-out times may be necessary tostabilize retention times.
422 - 37
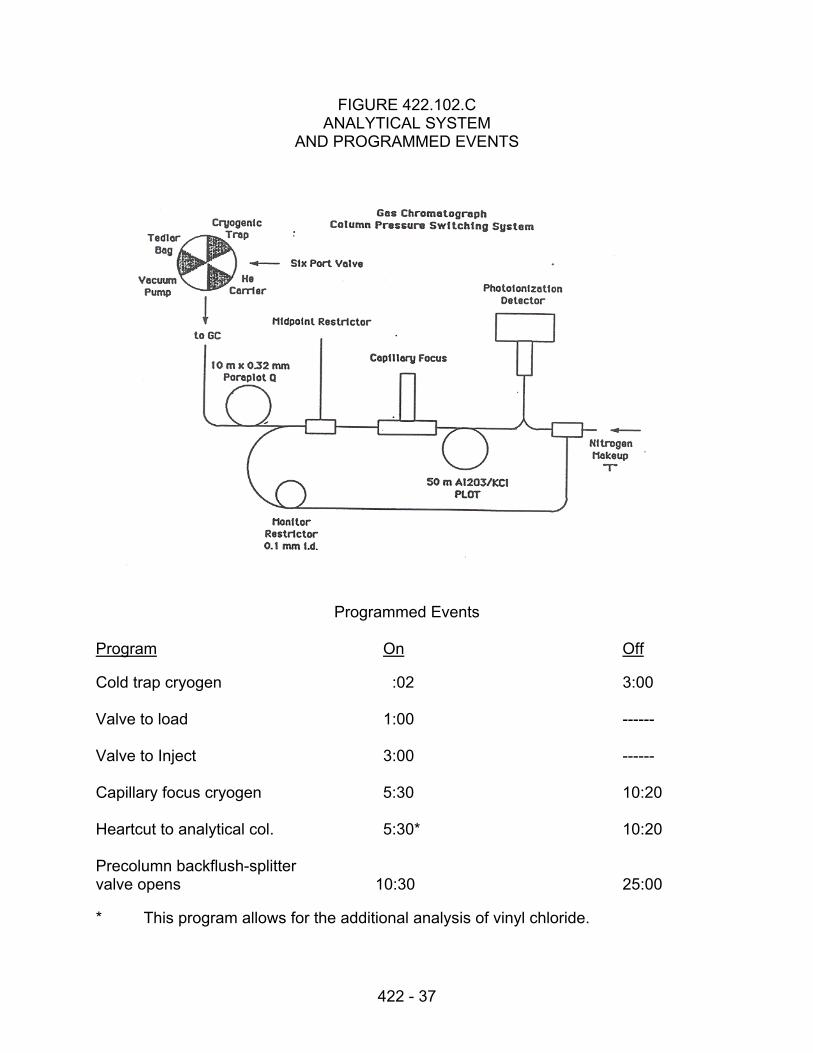
FIGURE 422.102.CANALYTICAL SYSTEM
AND PROGRAMMED EVENTS
Programmed Events
Program On Off
Cold trap cryogen :02 3:00
Valve to load 1:00 ------
Valve to Inject 3:00 ------
Capillary focus cryogen 5:30 10:20
Heartcut to analytical col. 5:30* 10:20
Precolumn backflush-splitter valve opens 10:30 25:00
* This program allows for the additional analysis of vinyl chloride.
422 - 38
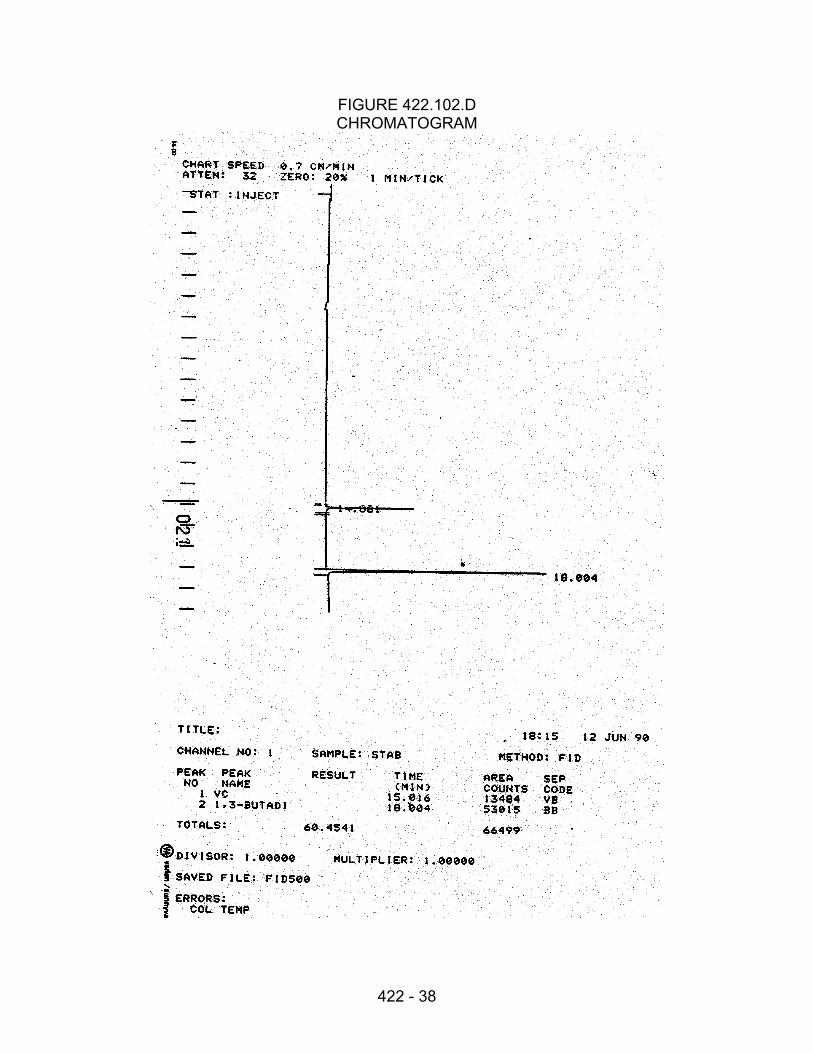
FIGURE 422.102.DCHROMATOGRAM
422 - 39
State of CaliforniaAir Resources Board
METHOD 422.199
Calibration and Quality Control Procedures For Analysis Methods
422 - 40
Method 422.199
Calibration and Quality Control Proceduresfor Analysis Methods
Page
1 INTRODUCTION ......................................................................................42
2 APPARATUS ...........................................................................................42
3 REAGENTS..............................................................................................42
4 INITIAL PERFORMANCE EVALUATION................................................42
4.1 Multipoint calibration ......................................................................43
5 ROUTINE CALIBRATION PROCEDURE ................................................44
5.1 Option 1, Linear Regression ..........................................................44
5.2 Option 2, Response Factor ............................................................45
6 ROUTINE QUALITY CONTROL ..............................................................45
6.1 Analytical Blanks............................................................................45
6.2 Laboratory Replicate Samples.......................................................45
6.3 Calibration Check Sample .............................................................46
6.4 Performance Evaluation Samples..................................................46
6.5 Qualitative Analysis Criteria ...........................................................46
6.6 Quantitation Criteria .......................................................................47
7 REPORTING ............................................................................................47
7.1 Complete Identification ..................................................................47
7.2 Date of Submittal ...........................................................................47
7.3 The Raw and Calculated Data .......................................................47
7.4 The Calibration Data......................................................................47
422 - 41
7.5 Data Used to Define the Reporting Limit........................................47
List of Figures
Figure 5 Preparation of Standards in Tedlar Bags, Data Sheet ...................50
Figure 6 Two-stage Calibration Gas Dilution system ...................................51
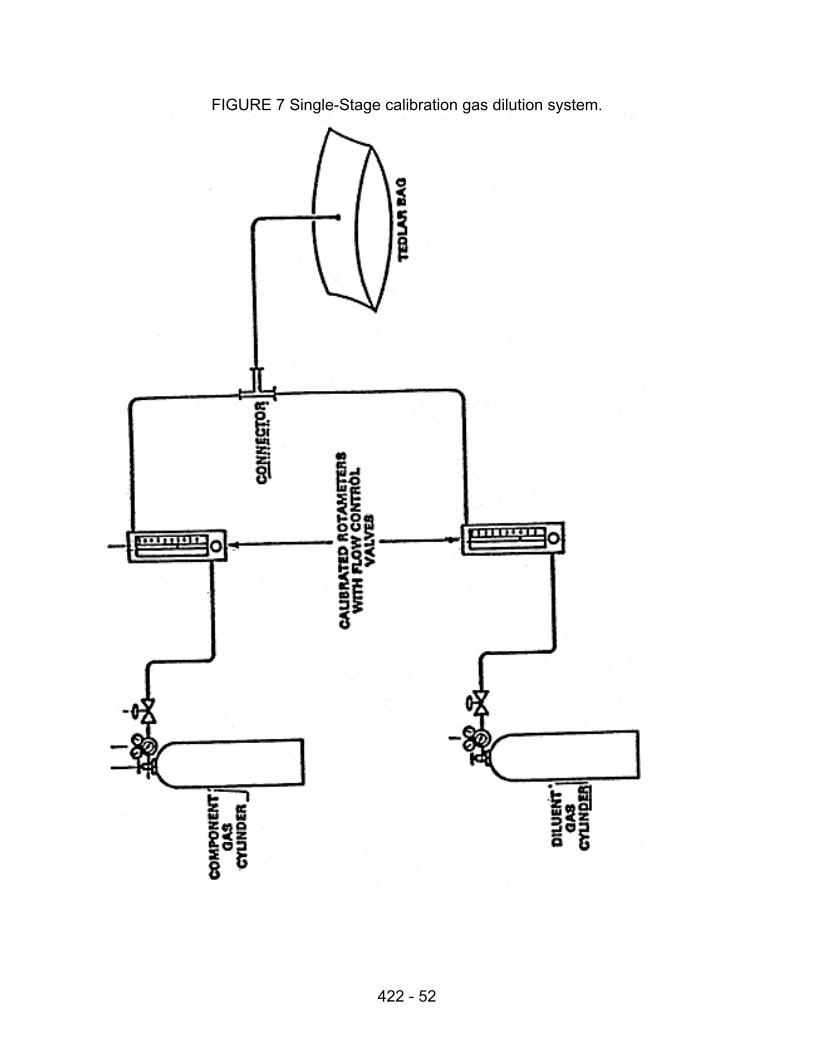
Figure 7 Single-stage Calibration Gas Dilution System ...............................52
Appendix D Preparation of Standards from High Concentration Standards ...48
Appendix E Calculations.................................................................................53
422 - 42
METHOD 422.199 CALIBRATION AND QUALITY CONTROL PROCEDURES FORANALYSIS METHODS
1. INTRODUCTION
Each laboratory that uses a procedure listed in method 422 is required to operatea formal quality control program. The minimum quality control requirements ofthis program consists of an initial demonstration of laboratory capability and anongoing program of routine calibration and analysis of performance checksamples to evaluate and document data quality. Two options are provided forroutine calibration; calculation by linear regression or average response factor.The laboratory must maintain records of all performance checks to document thequality of generated data.
2. APPARATUS
2.1 Flowmeter, 100 sccm.
2.2 Tedlar bags, 10 L.
3. REAGENTS
3.1 Calibration standards can be obtained commercially in specially treatedcompressed gas cylinders. Concentrations of the minor components ineach mixture must be traceable to the National Institute of Standards &Technology (NIST) or to a national measurement system approved by theExecutive Officer of the Air Resources Board. NIST traceability may beaccomplished by the specialty gas vendor via several methods:
(1) By analyzing the gas mixture directly against a NIST StandardReference Material (SRM). This alternative can be utilized when anSRM with a proper component is available and the concentration iswithin a factor of two (2) from the gas mixture concentration.
(2) If SRM’s are not available, analyzing the gas mixture against wellcharacterized Gas Manufacturer Primary Standards (GMPS).These GMPS mixtures are analyzed against internal laboratorystandards, gravimetric or volumetric, traceable to NIST.
4. INITIAL PERFORMANCE DEMONSTRATION
The following steps must be followed before the analytical method may be used.The performance evaluation must be repeated at least every six months. NOTE:Two options are provided for daily calibration (see Section 5). If response factor
422 - 43
method (5.2) is used, both Option 1 and 2 (4.1.2 and 4.1.4) must be conductedduring initial performance evaluation.
4.1 Multipoint calibration
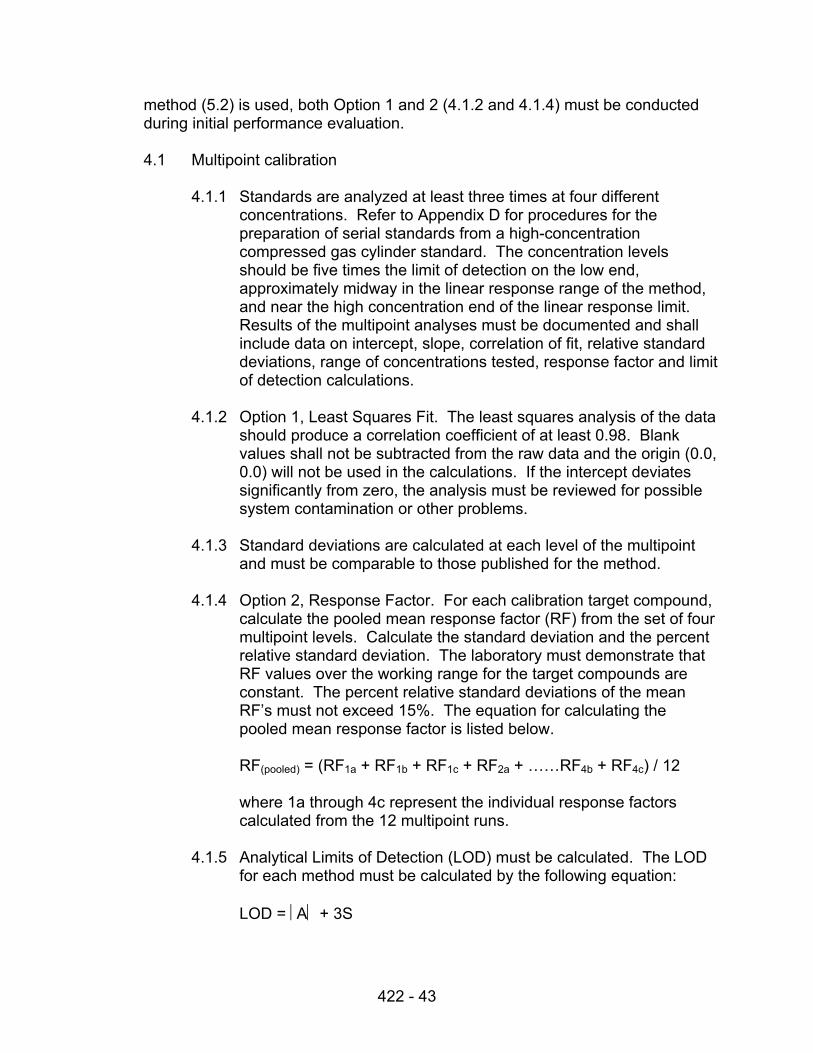
4.1.1 Standards are analyzed at least three times at four differentconcentrations. Refer to Appendix D for procedures for thepreparation of serial standards from a high-concentrationcompressed gas cylinder standard. The concentration levelsshould be five times the limit of detection on the low end,approximately midway in the linear response range of the method,and near the high concentration end of the linear response limit.Results of the multipoint analyses must be documented and shallinclude data on intercept, slope, correlation of fit, relative standarddeviations, range of concentrations tested, response factor and limitof detection calculations.
4.1.2 Option 1, Least Squares Fit. The least squares analysis of the datashould produce a correlation coefficient of at least 0.98. Blankvalues shall not be subtracted from the raw data and the origin (0.0,0.0) will not be used in the calculations. If the intercept deviatessignificantly from zero, the analysis must be reviewed for possiblesystem contamination or other problems.
4.1.3 Standard deviations are calculated at each level of the multipointand must be comparable to those published for the method.
4.1.4 Option 2, Response Factor. For each calibration target compound,calculate the pooled mean response factor (RF) from the set of fourmultipoint levels. Calculate the standard deviation and the percentrelative standard deviation. The laboratory must demonstrate thatRF values over the working range for the target compounds areconstant. The percent relative standard deviations of the meanRF’s must not exceed 15%. The equation for calculating thepooled mean response factor is listed below.
RF(pooled) = (RF1a + RF1b + RF1c + RF2a + ……RF4b + RF4c) / 12
where 1a through 4c represent the individual response factorscalculated from the 12 multipoint runs.
4.1.5 Analytical Limits of Detection (LOD) must be calculated. The LODfor each method must be calculated by the following equation:
LOD = A + 3S
422 - 44
where
A is the least squares intercept calculated from the multipont data(section 4.1.1).
S is the standard deviation of replicate determinations of the loweststandard. At least 3 replicates are required. The lowest standardmust be run at 1 to 5 times the estimated detection limit. If data isnot available in the concentration range near the detection limit, Smay be estimated by:
S = RSD × A
where RSD is the relative deviation of the lowest standardanalyzed.
The equation as listed above was obtained from the Compendiumof Methods for the Determination of Toxic Organics in Ambient Air,Research Triangle Park, North Carolina: U.S. EnvironmentalProtection Agency; April 1984: Method T01. Publication No. EPA-600/4-84-041.
4.1.6 The Limit of Quantitation (LOQ) must be calculated by the followingequation:
LOQ = 3.3 × LOD
No analysis results will be reported below the LOQ.
5. ROUTINE CALIBRATION PROCEDURE
Routine users of the method, ie. daily, will use one of the following options forcalibrations and result calculations. Compound concentrations used in thecalibration curves must bracket levels found in stationary source emissionsamples.
5.1 Option 1, Least Squares Fit
A least squares fit, i.e. as determined with the initial multipoint calibration,must be used for sample quantitative calculations. A calibration checkmust be performed every eight hours, or every ten sample analyses,whichever is more frequent. Use the midpoint calibration as a check. TheGC response of all analytes must be within 30% of the mean valuesestablished in the multipoint calibration or a new calibration curve must beprepared. The GC responses are recorded and inspected to check for
422 - 45
trends which indicate the degradation of standards or instrumentperformance.
5.2 Option 2, Response Factor
The average response factors, i.e. as determined with the multipointcalibration, must be used for sample quantitative calculations. Acalibration check must be performed every eight hours, or every tensample analyses, whichever is more frequent. Use the midpointcalibration (see section 4.1) as a check. The measured RF’s of allanalytes must be within 30% of the mean values established in themultipoint calibration or a new calibration curve must be prepared. Theresponse factors are recorded and inspected to check for trends whichindicate the degradation of standards or instrument performance.
For non-routine users of the method, ie. 1 test per month or less, calibrationinvolves generation of at least a 3 point curve during each analysis day and amidpoint calibration check after every 10 samples. Either linear regression ormean response factor calculations can be used. The initial performanceevaluation is still required.
6. ROUTINE QUALITY CONTROL
6.1 Laboratory Blanks
A laboratory method blank is a volume of ultra high purity gas carriedthrough the entire analytical scheme (preconcentration and analysis). Thegas used for blank runs should be certified by the gas supplier orlaboratory to contain less than the analytical limit of detection (LOD) of theanalytes of interest. The laboratory blank volume must be equal to thesample volumes being processed. Laboratory blanks are analyzed eachshift before the analysis of samples may proceed. A blank is alsoanalyzed after the analysis of a sample containing components withconcentrations greater than the most concentrated standard used. Thelaboratory blank results will be reported along with raw sample data in finalreports. Sample results should not be corrected for blank contribution.Note that a field blank analysis may be used in place of the laboratoryblank. However, if the results of the field blank are greater than LOQ, alaboratory blank will be run to isolate the source of contamination.
6.2 Laboratory Replicate Samples
Replicates serve to measure the precision of an analysis. Ten percent ofall samples, or at least one sample per batch, will be analyzed in duplicateto indicate reproducibility of the analysis and to monitor such conditions asinstrument drift. The precision ( Ave. – X1 /Ave.) × 100) of duplicate
422 - 46
analyses must fall within predetermined limits, i.e, 3 × RSD as establishedduring the initial performance evaluation.
6.3 Calibration Check Sample
The midpoint standard used in multipoint calibrations must be analyzedevery eight hours, or every ten samples, whichever is more frequent, tocheck instrument performance. The GC response of all analytes must bewithin 30% of the mean values established in the multipoint calibration ora new calibration curve must be generated. The GC responses arerecorded and inspected to check for trends which indicate the degradationof standards or instrument performance.
6.4 Performance Evaluation Samples
To demonstrate data quality, performance evaluation samples may beanalyzed periodically. At the discretion of the Executive Officer, periodicanalysis of performance evaluation samples may be required. Suchmaterials for this method will be available for purchase through privatevendors (e.g., Scott Specialty Gases’ facilities in San Bernardino (714-887-2571) and Fremont (415-659-0162) California). The vendor shouldbe informed of the component of interest and the concentration rangeexpected. The vendor will forward the gas mixture and gas deliveryequipment.
If analysis of performance evaluation samples is required by the ExecutiveOfficer, the analyses shall be conducted in the following manner. Theperformance evaluation material shall be used to evaluate both samplingand analytical systems. Performance evaluation samples shall beanalyzed at a frequency dependent on how often the method is used. Ifthe method is used on a daily basis, the performance evaluation samplemust be analyzed twice a month. If the method is used less frequently,the performance evaluation sample must be analyzed once a month orwhenever the method is used (whichever is less). A value of ±20% of thestated concentration of the performance evaluation sample must berecovered for the analyte of interest. The results of these analyses mustalso be recorded and placed on permanent file for at least three years andshall be made available to the Executive Officer upon request. Allperformance evaluation samples will be labeled with an expiration dateand may be re-certified by the vendor if they contain sufficient volume (i.e.greater then 60% residual).
6.5 Qualitative Analysis Criteria
The retention time of the target compound must be within 0.06 RRT unitsof the standard RRT.
422 - 47
6.6 Quantitation Criteria
The column resolution criteria of 20% valley (as measured from thebaseline to valley minimum) between a target compound and aninterfering compound must be achieved before any quantitation can beallowed. When a compound interferes with the target compound and thedegree of the interferences exceeds the column resolution criteria thecompound can still be quantified if the following criteria is met. Set thereporting limit for the lowest amount that can be quantified high enoughsuch that the interfering compound accounts for less than 10% of the areaof the target compound. If integrations are done automatically as inautomated data systems or integrators the baseline must be checked.Any improper baseline assignments must be corrected.
7 REPORTING
Each report of analyses shall be in the following format and will include thefollowing information. Refer to Appendix E for result calculations format.
7.1 Complete identification of the samples analyzed (sample numbers andsource). Pertinent information should be submitted to the analyticallaboratory via a chain of custody record.
7.2 Date of submittal of the sample, date and time of GC analysis. The lattershould appear on each chromatogram included with the report.
7.3 The raw and calculated data which are reported for the actual samples willalso be reported for the duplicate analyses, laboratory and field blankanalyses, the field spike sample analyses, and any other QA orperformance evaluation samples analyzed in conjunction with the actualsample set(s).
7.4 The calibration data, including average response factors calculated fromthe calibration procedure described in Section 5. Include the relativestandard deviation, and data showing that the midpoint response factorshave been verified at least once during each 8-hour period of operation orwith each seperate set of samples analyzed.
7.5 All relevant data used to define the reporting limit will be reported. Thiswill include parameters such as sampling volumes, sample injectionvolume, chromatographic interferences, and Tedlar bag contaminationlevels. In no case will results be reported below the established reportinglimit. Test reports should include a table summarizing reporting limits (persample) including a description of causes of variation.
422 - 48
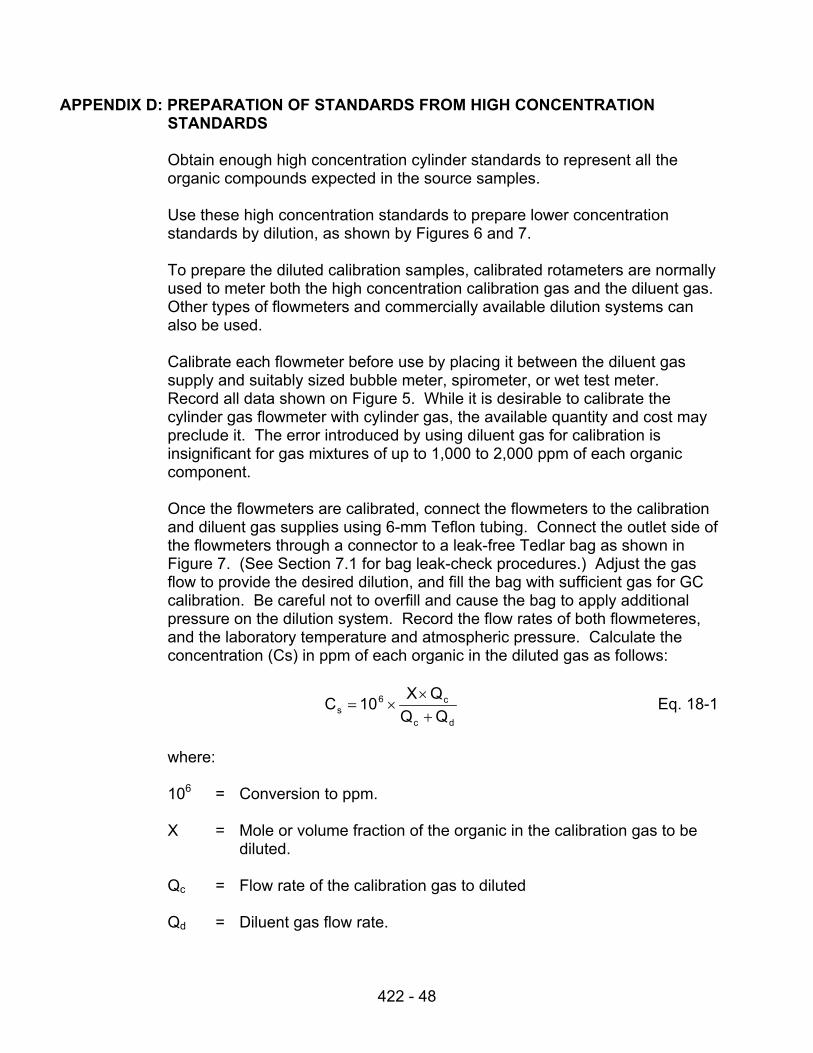
APPENDIX D: PREPARATION OF STANDARDS FROM HIGH CONCENTRATIONSTANDARDS
Obtain enough high concentration cylinder standards to represent all theorganic compounds expected in the source samples.
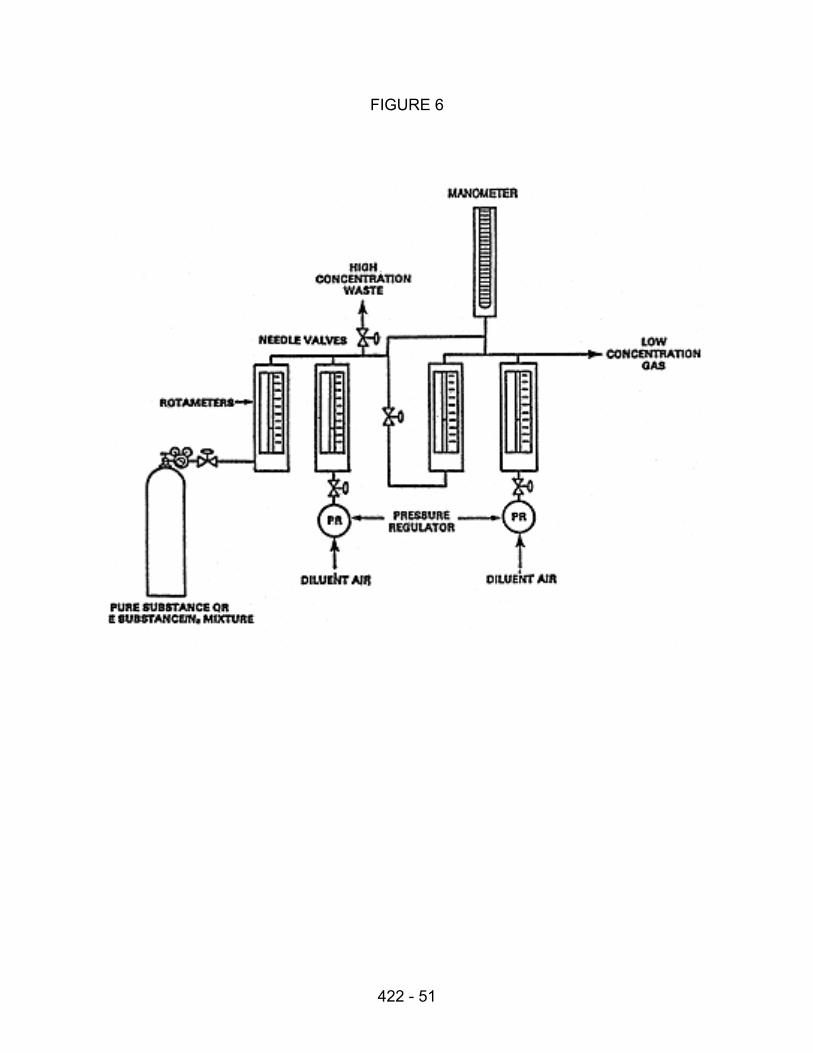
Use these high concentration standards to prepare lower concentrationstandards by dilution, as shown by Figures 6 and 7.
To prepare the diluted calibration samples, calibrated rotameters are normallyused to meter both the high concentration calibration gas and the diluent gas.Other types of flowmeters and commercially available dilution systems canalso be used.
Calibrate each flowmeter before use by placing it between the diluent gassupply and suitably sized bubble meter, spirometer, or wet test meter.Record all data shown on Figure 5. While it is desirable to calibrate thecylinder gas flowmeter with cylinder gas, the available quantity and cost maypreclude it. The error introduced by using diluent gas for calibration isinsignificant for gas mixtures of up to 1,000 to 2,000 ppm of each organiccomponent.
Once the flowmeters are calibrated, connect the flowmeters to the calibrationand diluent gas supplies using 6-mm Teflon tubing. Connect the outlet side ofthe flowmeters through a connector to a leak-free Tedlar bag as shown inFigure 7. (See Section 7.1 for bag leak-check procedures.) Adjust the gasflow to provide the desired dilution, and fill the bag with sufficient gas for GCcalibration. Be careful not to overfill and cause the bag to apply additionalpressure on the dilution system. Record the flow rates of both flowmeteres,and the laboratory temperature and atmospheric pressure. Calculate theconcentration (Cs) in ppm of each organic in the diluted gas as follows:
dc
c6s QQ
QX10C+×
×= Eq. 18-1
where:
106 = Conversion to ppm.
X = Mole or volume fraction of the organic in the calibration gas to bediluted.
Qc = Flow rate of the calibration gas to diluted
Qd = Diluent gas flow rate.
422 - 49
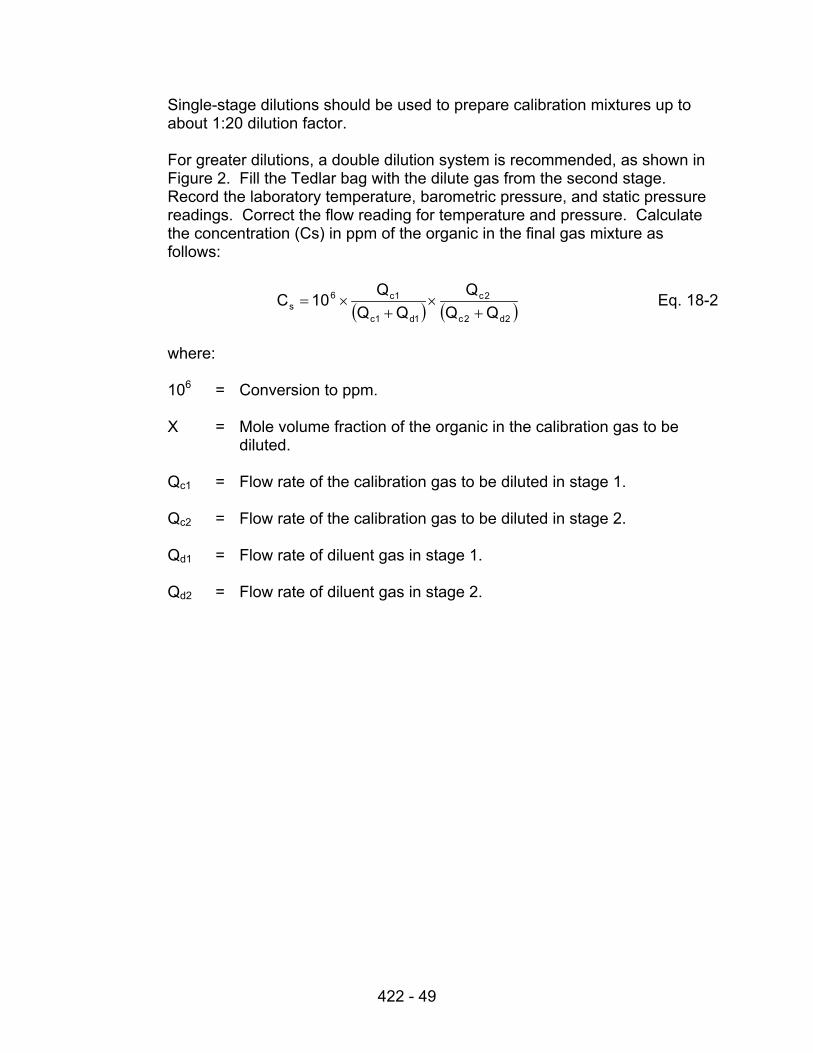
Single-stage dilutions should be used to prepare calibration mixtures up toabout 1:20 dilution factor.
For greater dilutions, a double dilution system is recommended, as shown inFigure 2. Fill the Tedlar bag with the dilute gas from the second stage.Record the laboratory temperature, barometric pressure, and static pressurereadings. Correct the flow reading for temperature and pressure. Calculatethe concentration (Cs) in ppm of the organic in the final gas mixture asfollows:
( ) ( )2d2c
2c
1d1c
1c6s QQ
QQQ
Q10C+
×+
×= Eq. 18-2
where:
106 = Conversion to ppm.
X = Mole volume fraction of the organic in the calibration gas to bediluted.
Qc1 = Flow rate of the calibration gas to be diluted in stage 1.
Qc2 = Flow rate of the calibration gas to be diluted in stage 2.
Qd1 = Flow rate of diluent gas in stage 1.
Qd2 = Flow rate of diluent gas in stage 2.
422 - 50
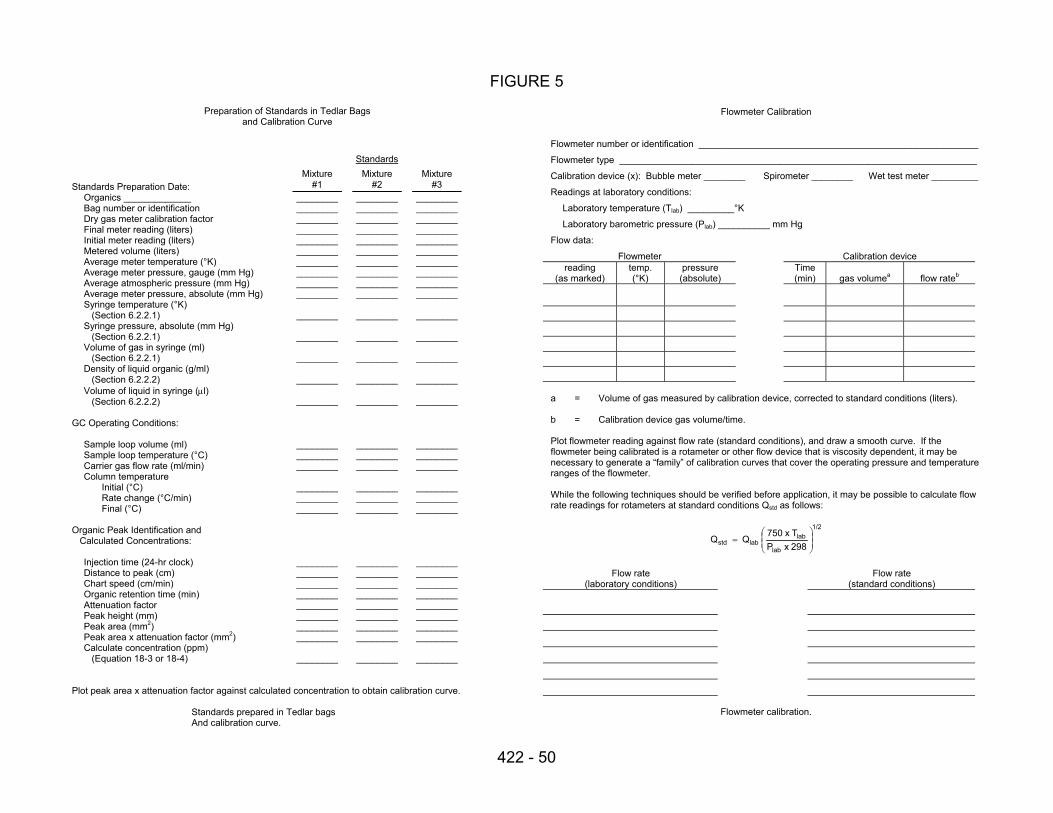
FIGURE 5
Preparation of Standards in Tedlar Bagsand Calibration Curve
Standards
Standards Preparation Date:Mixture
#1Mixture
#2Mixture
#3Organics _____________Bag number or identificationDry gas meter calibration factorFinal meter reading (liters)Initial meter reading (liters)Metered volume (liters)Average meter temperature (°K)Average meter pressure, gauge (mm Hg)Average atmospheric pressure (mm Hg)Average meter pressure, absolute (mm Hg)Syringe temperature (°K) (Section 6.2.2.1)Syringe pressure, absolute (mm Hg) (Section 6.2.2.1)Volume of gas in syringe (ml) (Section 6.2.2.1)Density of liquid organic (g/ml) (Section 6.2.2.2)Volume of liquid in syringe (µl) (Section 6.2.2.2)
________________________________________________________________________________
________
________
________
________
________
________________________________________________________________________________
________
________
________
________
________
________________________________________________________________________________
________
________
________
________
________
GC Operating Conditions:
Sample loop volume (ml)Sample loop temperature (°C)Carrier gas flow rate (ml/min)Column temperature
Initial (°C)Rate change (°C/min)Final (°C)
________________________
________________________
________________________
________________________
________________________
________________________
Organic Peak Identification and Calculated Concentrations:
Injection time (24-hr clock)Distance to peak (cm)Chart speed (cm/min)Organic retention time (min)Attenuation factorPeak height (mm)Peak area (mm2)Peak area x attenuation factor (mm2)Calculate concentration (ppm) (Equation 18-3 or 18-4)
________________________________________________________________
________
________________________________________________________________
________
________________________________________________________________
________
Plot peak area x attenuation factor against calculated concentration to obtain calibration curve.
Standards prepared in Tedlar bagsAnd calibration curve.
Flowmeter Calibration
Flowmeter number or identification ______________________________________________________
Flowmeter type _____________________________________________________________________
Calibration device (x): Bubble meter ________ Spirometer ________ Wet test meter _________
Readings at laboratory conditions:
Laboratory temperature (Tlab) _________°K
Laboratory barometric pressure (Plab) __________ mm Hg
Flow data:
Flowmeter Calibration devicereading
(as marked)temp.(°K)
pressure(absolute)
Time(min) gas volumea flow rateb
a = Volume of gas measured by calibration device, corrected to standard conditions (liters).
b = Calibration device gas volume/time.
Plot flowmeter reading against flow rate (standard conditions), and draw a smooth curve. If theflowmeter being calibrated is a rotameter or other flow device that is viscosity dependent, it may benecessary to generate a “family” of calibration curves that cover the operating pressure and temperatureranges of the flowmeter.
While the following techniques should be verified before application, it may be possible to calculate flowrate readings for rotameters at standard conditions Qstd as follows:
1/2
lab
lablabstd 298 x P
T x 750 Q Q
=
Flow rate(laboratory conditions)
Flow rate(standard conditions)
Flowmeter calibration.
422 - 51
FIGURE 6
422 - 52
FIGURE 7 Single-Stage calibration gas dilution system.
422 - 53
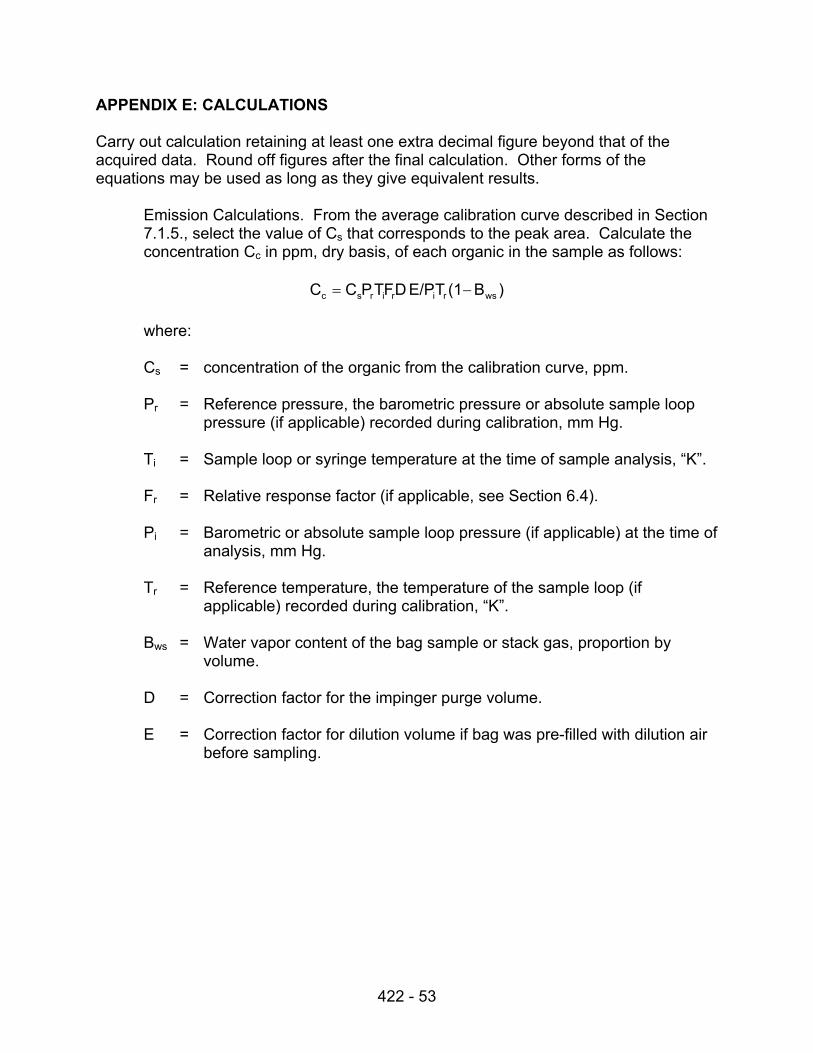
APPENDIX E: CALCULATIONS
Carry out calculation retaining at least one extra decimal figure beyond that of theacquired data. Round off figures after the final calculation. Other forms of theequations may be used as long as they give equivalent results.
Emission Calculations. From the average calibration curve described in Section7.1.5., select the value of Cs that corresponds to the peak area. Calculate theconcentration Cc in ppm, dry basis, of each organic in the sample as follows:
)B(1TE/P DFTPCC wsririrsc −=
where:
Cs = concentration of the organic from the calibration curve, ppm.
Pr = Reference pressure, the barometric pressure or absolute sample looppressure (if applicable) recorded during calibration, mm Hg.
Ti = Sample loop or syringe temperature at the time of sample analysis, “K”.
Fr = Relative response factor (if applicable, see Section 6.4).
Pi = Barometric or absolute sample loop pressure (if applicable) at the time ofanalysis, mm Hg.
Tr = Reference temperature, the temperature of the sample loop (ifapplicable) recorded during calibration, “K”.
Bws = Water vapor content of the bag sample or stack gas, proportion byvolume.
D = Correction factor for the impinger purge volume.
E = Correction factor for dilution volume if bag was pre-filled with dilution airbefore sampling.