Embed Size (px)
Citation preview
NIST Technical Note 1902
Test Results Prepared for Honeywell: Igniter Material Effects in the
Japanese High Pressure Gas Law Test
Gregory Linteris John Pagliaro
Peter Sunderland
This publication is available free of charge from: http://dx.doi.org/10.6028/NIST.TN.1902
NIST Technical Note 1902
Test Results Prepared for Honeywell: Igniter Material Effects in the
Japanese High Pressure Gas Law Test
Gregory Linteris John Pagliaro
Peter Sunderland Energy and Environment Division
Engineering Laboratory
This publication is available free of charge from: http://dx.doi.org/10.6028/NIST.TN.1902
August 2016
U.S. Department of Commerce Penny Pritzker, Secretary
National Institute of Standards and Technology Willie May, Under Secretary of Commerce for Standards and Technology and Director
Certain commercial entities, equipment, or materials may be identified in this document in order to describe an experimental procedure or concept adequately.
Such identification is not intended to imply recommendation or endorsement by the National Institute of Standards and Technology, nor is it intended to imply that the entities, materials, or equipment are necessarily the best available for the purpose.
National Institute of Standards and Technology Technical Note 1902 Natl. Inst. Stand. Technol. Tech. Note 1902, 55 pages (August 2016)
CODEN: NTNOEF
This publication is available free of charge from: http://dx.doi.org/10.6028/NIST.TN.1902

Test Results Prepared for Honeywell: Igniter Material Effects in the
Japanese High Pressure Gas Law Test1,2
Gregory T. Linteris, John Pagliaro, and Peter Sunderland Fire Research Division
Engineering Laboratory National Institute of Standards and Technology
August 04, 2016
Introduction The goal of the work was to determine the flammability of R1234ze(E) (C3H2F4) per the Japanese High Pressure Gas Law (see Appendix I). Tests were also performed with R32 (CH2F2), R134a (C2H2F4) and methane (CH4), to provide a baseline for comparison of the results with R1234ze(E). Since the measured flammability of the mixture might be affected by the ignition source, tests were conducted with either copper wire (0.08 mm or 0.361 mm diameter), tungsten wire (0.3 mm diameter) or the standard platinum wire (0.3 mm diameter). To aid in the interpretation of the experiments, calculations were also performed for the thermodynamic equilibrium conditions, the homogeneous autoignition time ign, the overall chemical rate from stirred-reactor simulations, and the laminar burning velocity. These latter simulations employed a detailed chemical kinetic model, and solved the conservation equations for mass, energy, and species conservation.
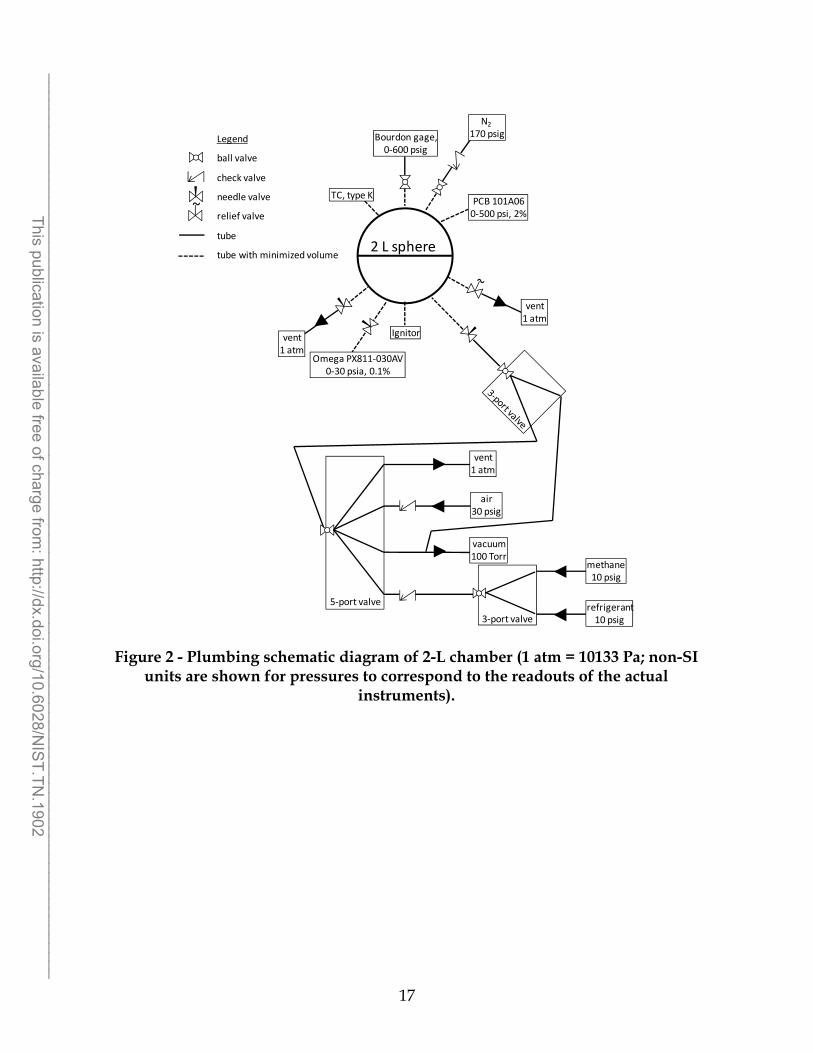
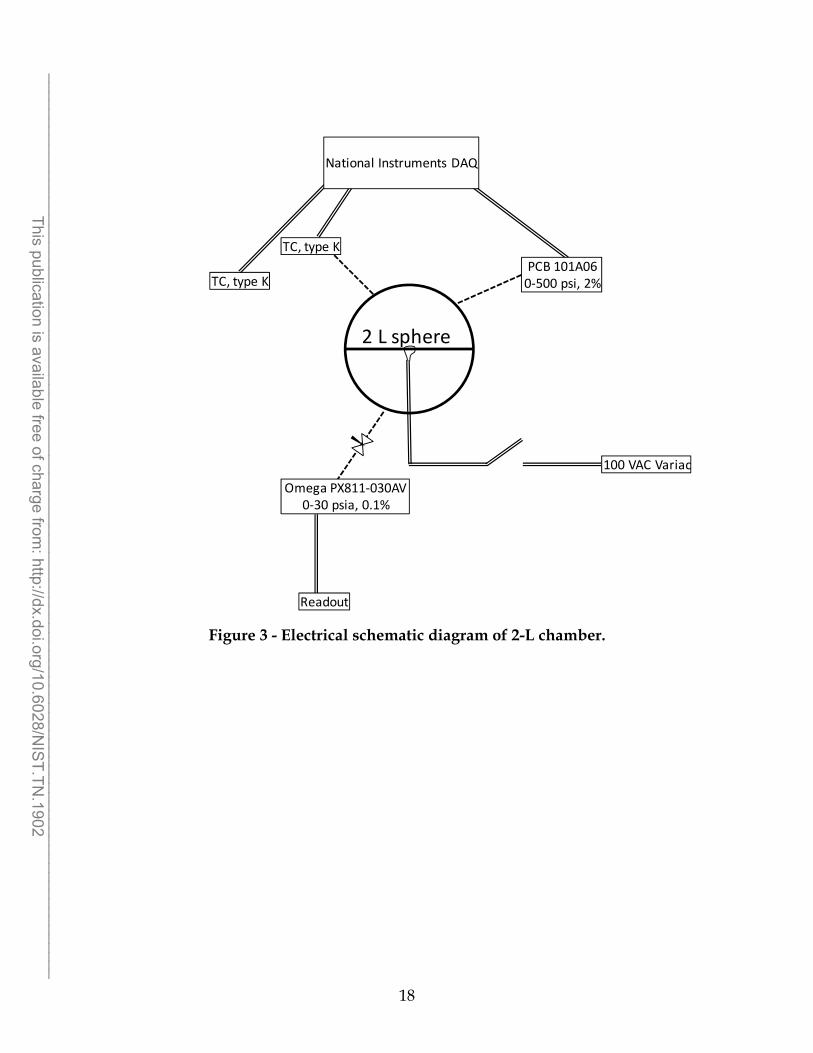
Experimental Methods The constant-volume combustion device [1] is based on the Japanese High Pressure Gas Law (JHPGL), and is similar to the design of Takizawa [2], Shebeko [3], and others. The experimental apparatus is shown in Figure 1, while the plumbing and electrical schematics are shown in Figure 2 and Figure 3. The chamber consists of a stainless steel (316) sphere with an inner diameter of 15.24 cm, a volume of 1.85 L, and walls of
1 Official contribution of NIST, not subject to copyright in the United States. 2 This report is based on a previously published version [1]. In the present report, new data are presented for thinner and thicker diameter copper (0.08 mm, 0.361 mm) and tungsten (0.30 mm) igniters.
1
______________________________________________________________________________________________________ This publication is available free of charge from
: http://dx.doi.org/10.6028/NIS
T.TN.1902
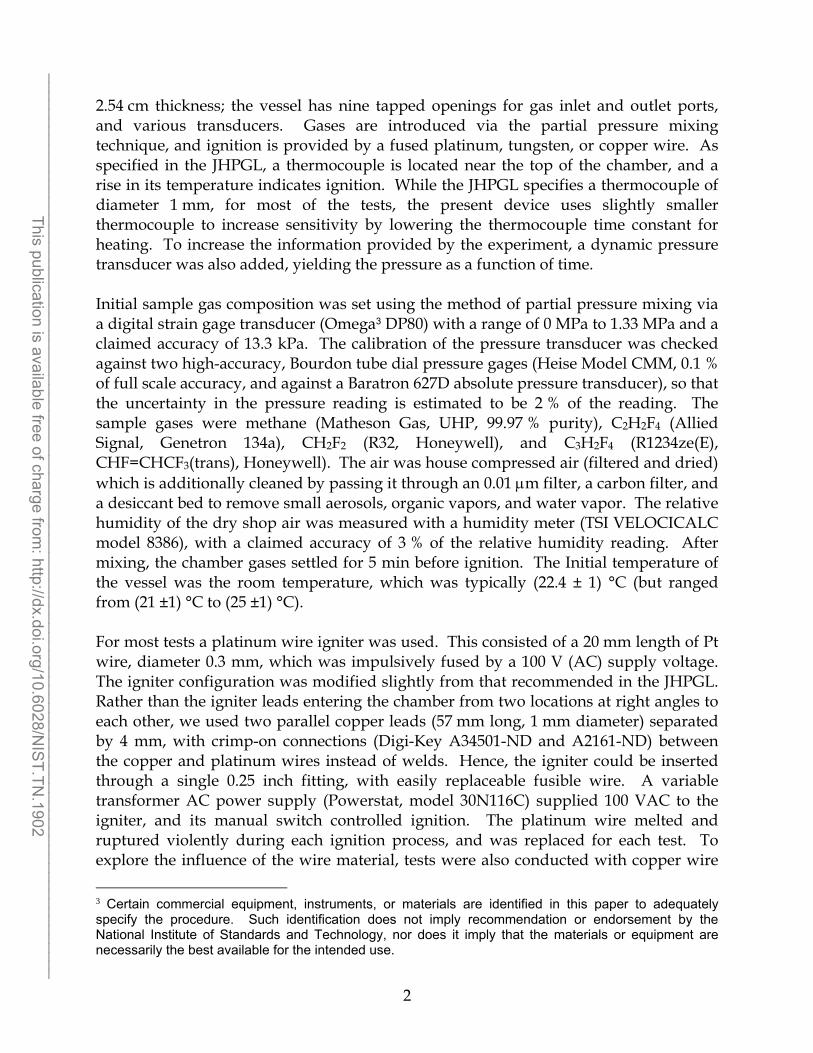
2.54 cm thickness; the vessel has nine tapped openings for gas inlet and outlet ports, and various transducers. Gases are introduced via the partial pressure mixing technique, and ignition is provided by a fused platinum, tungsten, or copper wire. As specified in the JHPGL, a thermocouple is located near the top of the chamber, and a rise in its temperature indicates ignition. While the JHPGL specifies a thermocouple of diameter 1 mm, for most of the tests, the present device uses slightly smaller thermocouple to increase sensitivity by lowering the thermocouple time constant for heating. To increase the information provided by the experiment, a dynamic pressure transducer was also added, yielding the pressure as a function of time.
Initial sample gas composition was set using the method of partial pressure mixing via a digital strain gage transducer (Omega3 DP80) with a range of 0 MPa to 1.33 MPa and a claimed accuracy of 13.3 kPa. The calibration of the pressure transducer was checked against two high-accuracy, Bourdon tube dial pressure gages (Heise Model CMM, 0.1 % of full scale accuracy, and against a Baratron 627D absolute pressure transducer), so that the uncertainty in the pressure reading is estimated to be 2 % of the reading. The sample gases were methane (Matheson Gas, UHP, 99.97 % purity), C2H2F4 (Allied Signal, Genetron 134a), CH2F2 (R32, Honeywell), and C3H2F4 (R1234ze(E), CHF=CHCF3(trans), Honeywell). The air was house compressed air (filtered and dried) which is additionally cleaned by passing it through an 0.01 m filter, a carbon filter, and a desiccant bed to remove small aerosols, organic vapors, and water vapor. The relative humidity of the dry shop air was measured with a humidity meter (TSI VELOCICALC model 8386), with a claimed accuracy of 3 % of the relative humidity reading. After mixing, the chamber gases settled for 5 min before ignition. The Initial temperature of the vessel was the room temperature, which was typically (22.4 ± 1) °C (but ranged from (21 ±1) °C to (25 ±1) °C).
For most tests a platinum wire igniter was used. This consisted of a 20 mm length of Pt wire, diameter 0.3 mm, which was impulsively fused by a 100 V (AC) supply voltage. The igniter configuration was modified slightly from that recommended in the JHPGL. Rather than the igniter leads entering the chamber from two locations at right angles to each other, we used two parallel copper leads (57 mm long, 1 mm diameter) separated by 4 mm, with crimp-on connections (Digi-Key A34501-ND and A2161-ND) between the copper and platinum wires instead of welds. Hence, the igniter could be inserted through a single 0.25 inch fitting, with easily replaceable fusible wire. A variable transformer AC power supply (Powerstat, model 30N116C) supplied 100 VAC to the igniter, and its manual switch controlled ignition. The platinum wire melted and ruptured violently during each ignition process, and was replaced for each test. To explore the influence of the wire material, tests were also conducted with copper wire
3 Certain commercial equipment, instruments, or materials are identified in this paper to adequately specify the procedure. Such identification does not imply recommendation or endorsement by the National Institute of Standards and Technology, nor does it imply that the materials or equipment are necessarily the best available for the intended use.
2
______________________________________________________________________________________________________ This publication is available free of charge from
: http://dx.doi.org/10.6028/NIS
T.TN.1902
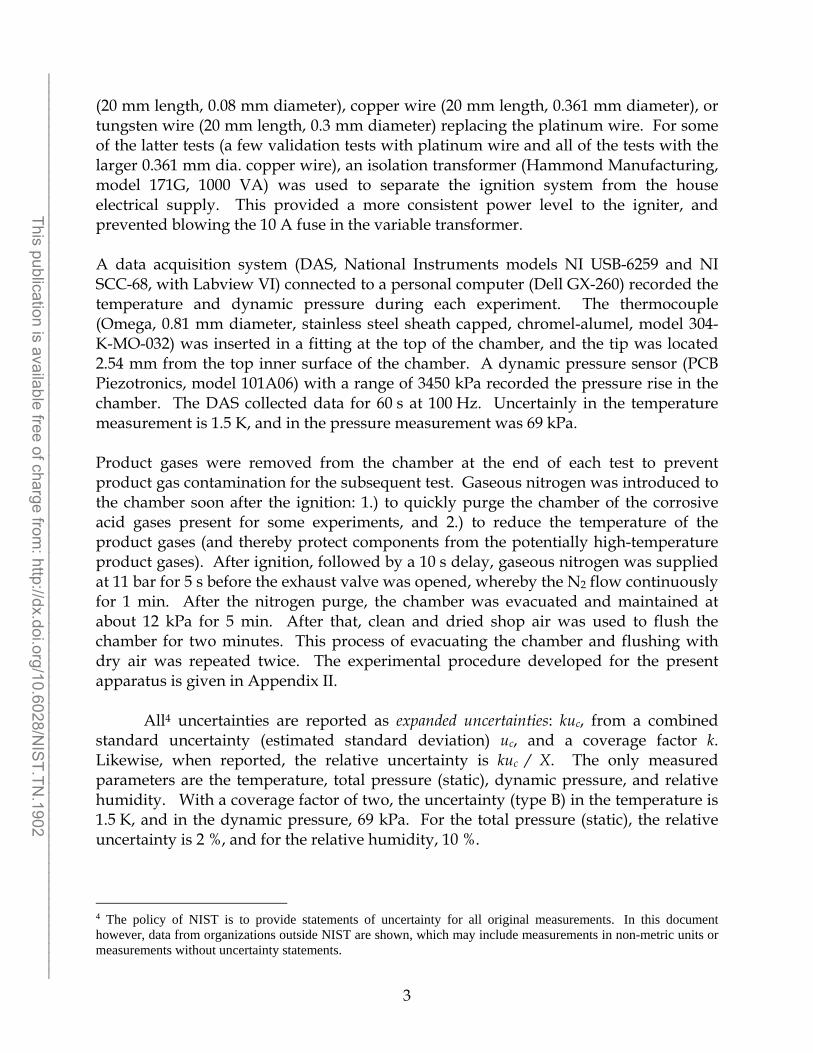
(20 mm length, 0.08 mm diameter), copper wire (20 mm length, 0.361 mm diameter), or tungsten wire (20 mm length, 0.3 mm diameter) replacing the platinum wire. For some of the latter tests (a few validation tests with platinum wire and all of the tests with the larger 0.361 mm dia. copper wire), an isolation transformer (Hammond Manufacturing, model 171G, 1000 VA) was used to separate the ignition system from the house electrical supply. This provided a more consistent power level to the igniter, and prevented blowing the 10 A fuse in the variable transformer.
A data acquisition system (DAS, National Instruments models NI USB-6259 and NI SCC-68, with Labview VI) connected to a personal computer (Dell GX-260) recorded the temperature and dynamic pressure during each experiment. The thermocouple (Omega, 0.81 mm diameter, stainless steel sheath capped, chromel-alumel, model 304K-MO-032) was inserted in a fitting at the top of the chamber, and the tip was located 2.54 mm from the top inner surface of the chamber. A dynamic pressure sensor (PCB Piezotronics, model 101A06) with a range of 3450 kPa recorded the pressure rise in the chamber. The DAS collected data for 60 s at 100 Hz. Uncertainly in the temperature measurement is 1.5 K, and in the pressure measurement was 69 kPa.
Product gases were removed from the chamber at the end of each test to prevent product gas contamination for the subsequent test. Gaseous nitrogen was introduced to the chamber soon after the ignition: 1.) to quickly purge the chamber of the corrosive acid gases present for some experiments, and 2.) to reduce the temperature of the product gases (and thereby protect components from the potentially high-temperature product gases). After ignition, followed by a 10 s delay, gaseous nitrogen was supplied at 11 bar for 5 s before the exhaust valve was opened, whereby the N2 flow continuously for 1 min. After the nitrogen purge, the chamber was evacuated and maintained at about 12 kPa for 5 min. After that, clean and dried shop air was used to flush the chamber for two minutes. This process of evacuating the chamber and flushing with dry air was repeated twice. The experimental procedure developed for the present apparatus is given in Appendix II.
All4 uncertainties are reported as expanded uncertainties: kuc, from a combined standard uncertainty (estimated standard deviation) uc, and a coverage factor k. Likewise, when reported, the relative uncertainty is kuc / X. The only measured parameters are the temperature, total pressure (static), dynamic pressure, and relative humidity. With a coverage factor of two, the uncertainty (type B) in the temperature is 1.5 K, and in the dynamic pressure, 69 kPa. For the total pressure (static), the relative uncertainty is 2 %, and for the relative humidity, 10 %.
4 The policy of NIST is to provide statements of uncertainty for all original measurements. In this document however, data from organizations outside NIST are shown, which may include measurements in non-metric units or measurements without uncertainty statements.
3
______________________________________________________________________________________________________ This publication is available free of charge from
: http://dx.doi.org/10.6028/NIS
T.TN.1902
Numerical Simulations Numerical simulations were performed to compare the predicted overall chemical reactivity of each system with the results of the flammability limit tests. Simulations included premixed steady 1-D planar laminar flame speed, stirred reactor residence time just above blow-out, and homogeneous gas-phase ignition delay. The SANDIA numerical codes PREMIX [4], PSR [5], and SENKIN [6] were used, along with the chemical kinetics [7] and transport [8]interpreters.
Flame extinction is controlled by the characteristic times for chemical reaction and transport, as described by the Damköhler number Da=r/c, in which r is the flow residence time, and c is the chemical time [9]. Hence, an important step for understanding flame extinction is to obtain some measure of the overall reaction rate. The stirred-reactor blow-out residence time has been correlated with both the laminar flame speed [10] and with extinction of laminar diffusion flames with added inert suppressants [11], indicating its utility as a measure of overall reaction rate. The residence time in the reactor is defined as V / m , in which is the mixture density, V is the reactor volume, and m is the mass flow. Heat losses from the reactor to the surroundings can also be considered, but are neglected in the present analyses. The governing equations of conservation of mass, species, and energy form a system of coupled non-linear algebraic equations, which can be solved numerically. In the present work, we employ the SANDIA PSR code [5]. Initial pressure and temperature is 101 kPa and 298 K.
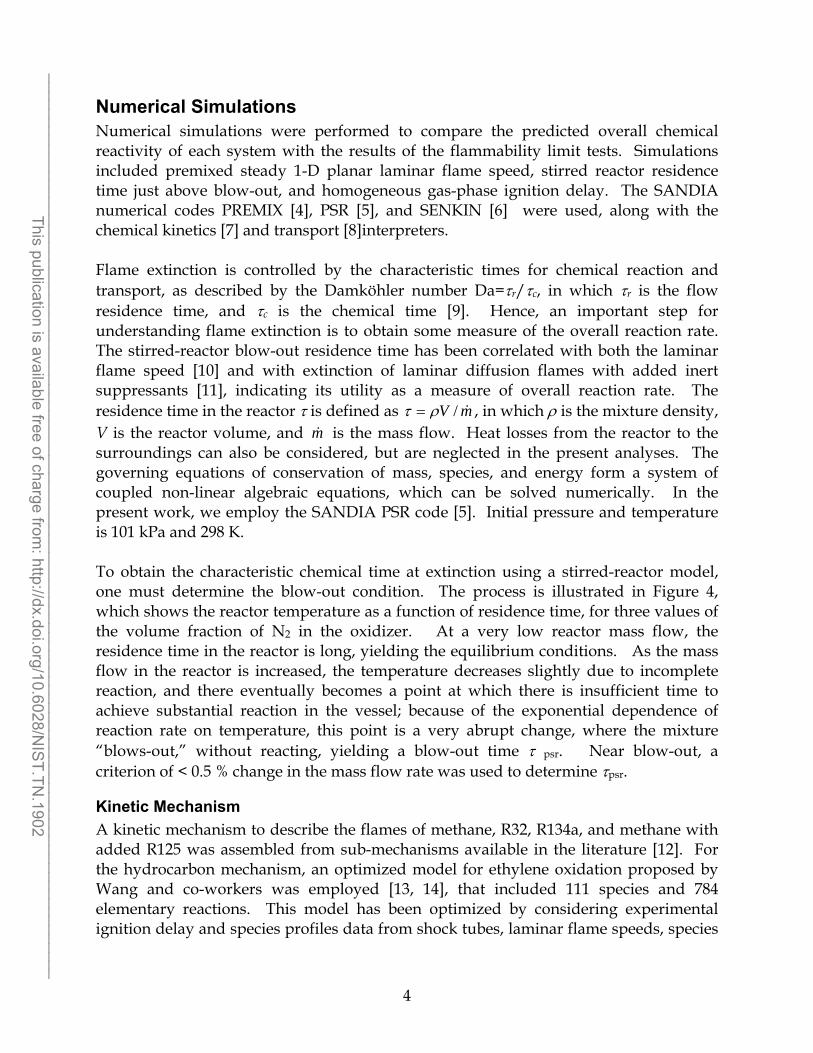
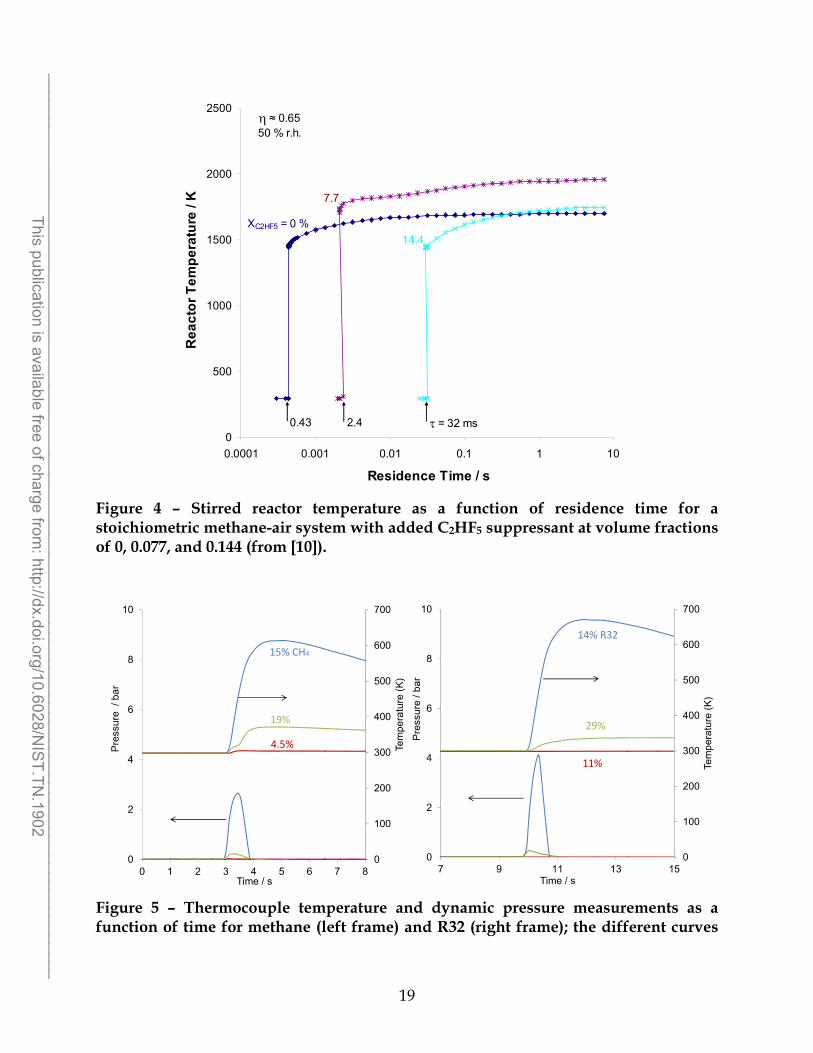
To obtain the characteristic chemical time at extinction using a stirred-reactor model, one must determine the blow-out condition. The process is illustrated in Figure 4, which shows the reactor temperature as a function of residence time, for three values of the volume fraction of N2 in the oxidizer. At a very low reactor mass flow, the residence time in the reactor is long, yielding the equilibrium conditions. As the mass flow in the reactor is increased, the temperature decreases slightly due to incomplete reaction, and there eventually becomes a point at which there is insufficient time to achieve substantial reaction in the vessel; because of the exponential dependence of reaction rate on temperature, this point is a very abrupt change, where the mixture “blows-out,” without reacting, yielding a blow-out time psr. Near blow-out, a criterion of < 0.5 % change in the mass flow rate was used to determine psr.
Kinetic Mechanism
A kinetic mechanism to describe the flames of methane, R32, R134a, and methane with added R125 was assembled from sub-mechanisms available in the literature [12]. For the hydrocarbon mechanism, an optimized model for ethylene oxidation proposed by Wang and co-workers was employed [13, 14], that included 111 species and 784 elementary reactions. This model has been optimized by considering experimental ignition delay and species profiles data from shock tubes, laminar flame speeds, species
4
______________________________________________________________________________________________________ This publication is available free of charge from
: http://dx.doi.org/10.6028/NIS
T.TN.1902
profile data from flow reactors, and species profile data from flat flames. To this mechanism, more detailed reactions of ethanol were added (5 species and 36 reactions), as proposed by Dryer and co-workers [15-17]. For the reactions of the hydrofluorocarbons (HFCs) in hydrocarbon flames, the National Institute of Standards and Technology (NIST) HFC mechanism was used [18, 19]. Subsequent updates to that mechanism were made by NIST workers, as noted L’Espérance et al. [20]. Other changes to the NIST HFC mechanism were made in the present work based on recent experimental measurements and theoretical calculations [21-27] as listed in [20]. A list of potentially important reactions of C2HF5 with the radicals from initial fuel (propane or ethanol) decomposition was developed, and the rates were estimated as given in ref. [12]. The barriers for the reactions were estimated in Evans-Polanyi fashion by analogy to that for the reference reaction CHF2-CF3 + CH3 = CF3-CF2 + CH4 contained in the NIST HFC mechanism by increasing the barriers in proportion (0.3) to the decrease in the heat of reactions relative to the reference reaction. The HFC sub-mechanism finally adopted contained 51 species and 600 reactions. The final mechanism used for the simulations had 177 species and 1494 reactions.
Results and Discussion
Experimental
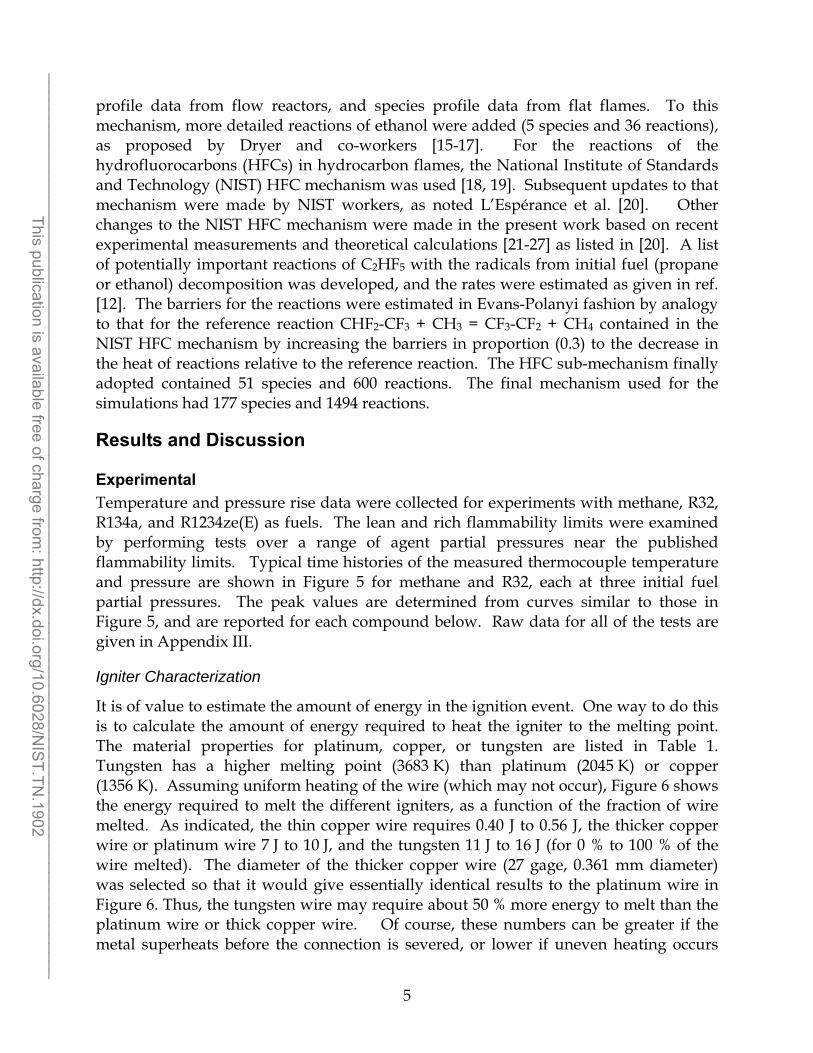
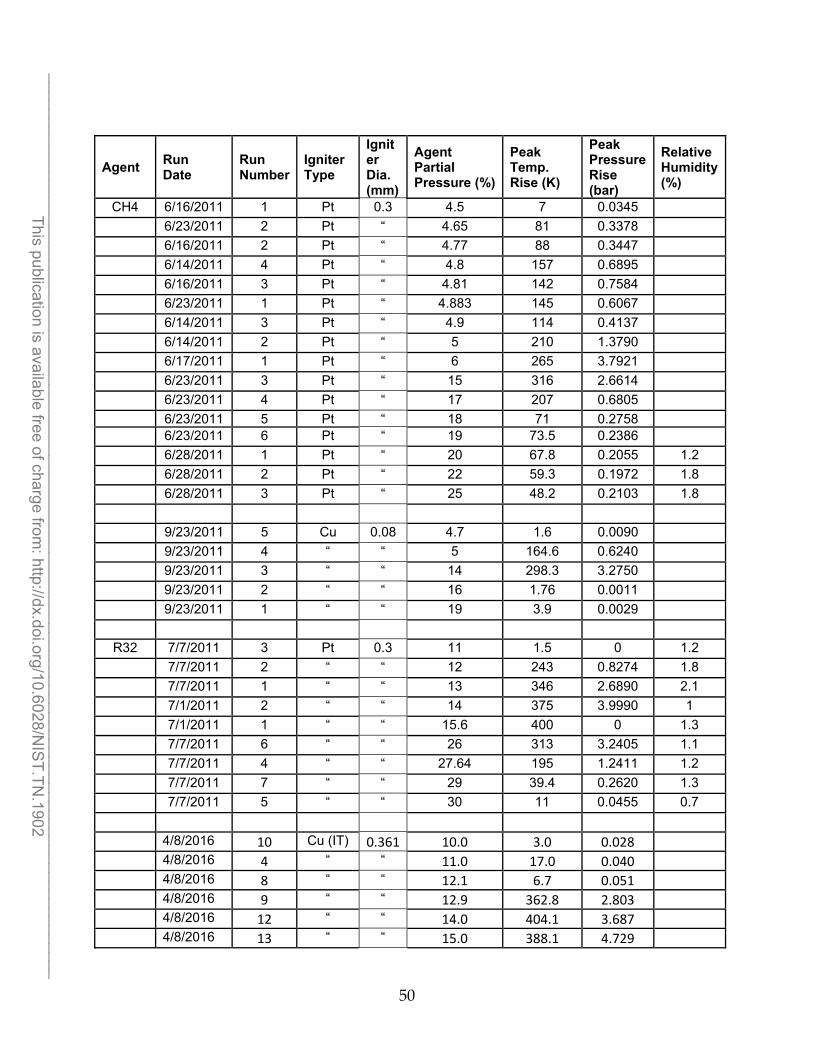
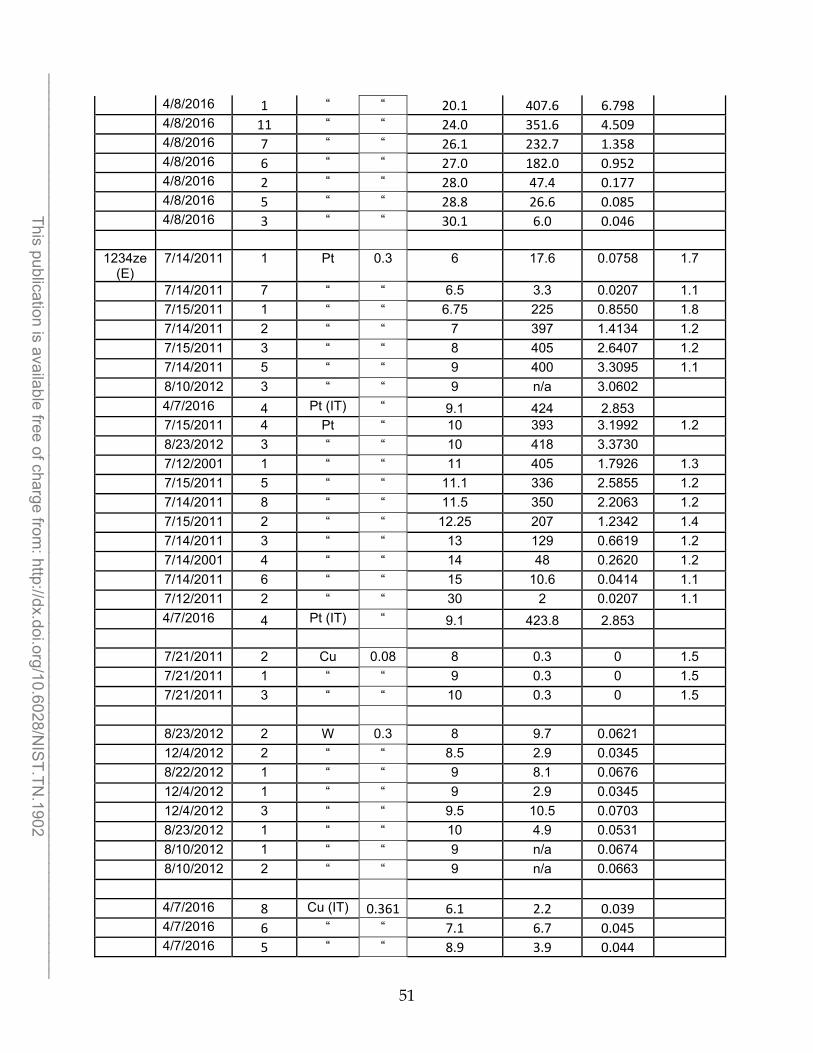
Temperature and pressure rise data were collected for experiments with methane, R32, R134a, and R1234ze(E) as fuels. The lean and rich flammability limits were examined by performing tests over a range of agent partial pressures near the published flammability limits. Typical time histories of the measured thermocouple temperature and pressure are shown in Figure 5 for methane and R32, each at three initial fuel partial pressures. The peak values are determined from curves similar to those in Figure 5, and are reported for each compound below. Raw data for all of the tests are given in Appendix III.
Igniter Characterization
It is of value to estimate the amount of energy in the ignition event. One way to do this is to calculate the amount of energy required to heat the igniter to the melting point. The material properties for platinum, copper, or tungsten are listed in Table 1. Tungsten has a higher melting point (3683 K) than platinum (2045 K) or copper (1356 K). Assuming uniform heating of the wire (which may not occur), Figure 6 shows the energy required to melt the different igniters, as a function of the fraction of wire melted. As indicated, the thin copper wire requires 0.40 J to 0.56 J, the thicker copper wire or platinum wire 7 J to 10 J, and the tungsten 11 J to 16 J (for 0 % to 100 % of the wire melted). The diameter of the thicker copper wire (27 gage, 0.361 mm diameter) was selected so that it would give essentially identical results to the platinum wire in Figure 6. Thus, the tungsten wire may require about 50 % more energy to melt than the platinum wire or thick copper wire. Of course, these numbers can be greater if the metal superheats before the connection is severed, or lower if uneven heating occurs
5
______________________________________________________________________________________________________ This publication is available free of charge from
: http://dx.doi.org/10.6028/NIS
T.TN.1902
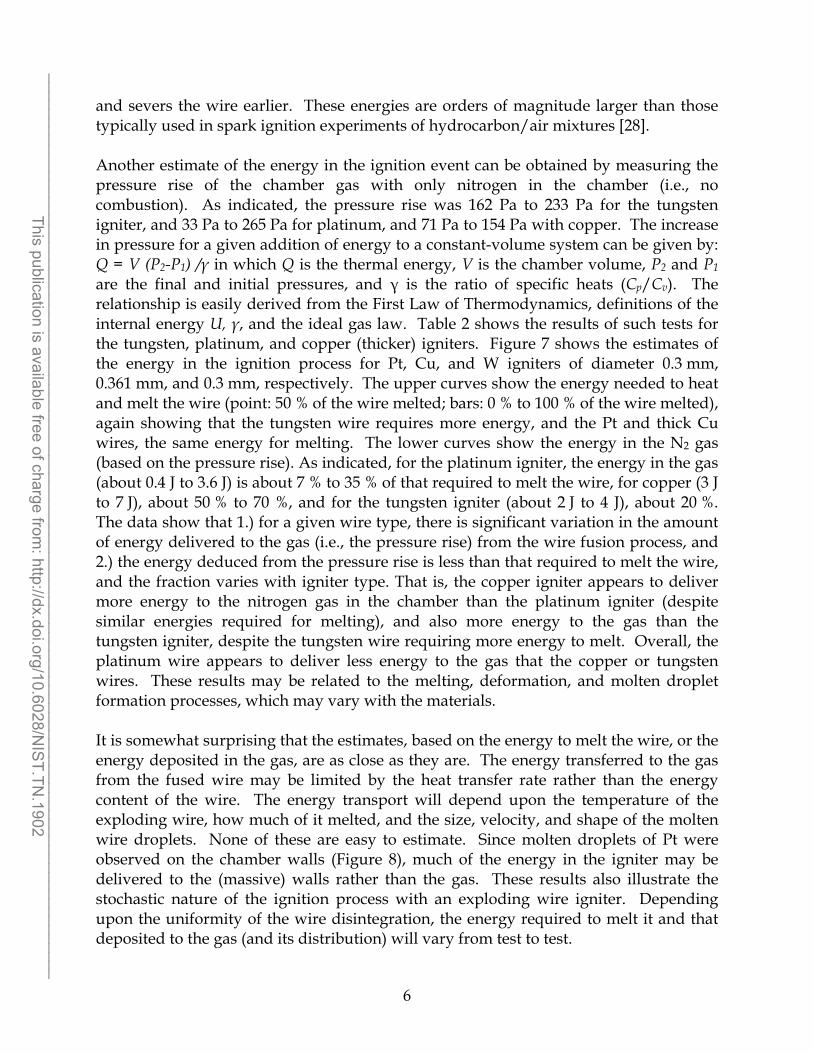
and severs the wire earlier. These energies are orders of magnitude larger than those typically used in spark ignition experiments of hydrocarbon/air mixtures [28].
Another estimate of the energy in the ignition event can be obtained by measuring the pressure rise of the chamber gas with only nitrogen in the chamber (i.e., no combustion). As indicated, the pressure rise was 162 Pa to 233 Pa for the tungsten igniter, and 33 Pa to 265 Pa for platinum, and 71 Pa to 154 Pa with copper. The increase in pressure for a given addition of energy to a constant-volume system can be given by: Q = V (P2-P1) /γ in which Q is the thermal energy, V is the chamber volume, P2 and P1
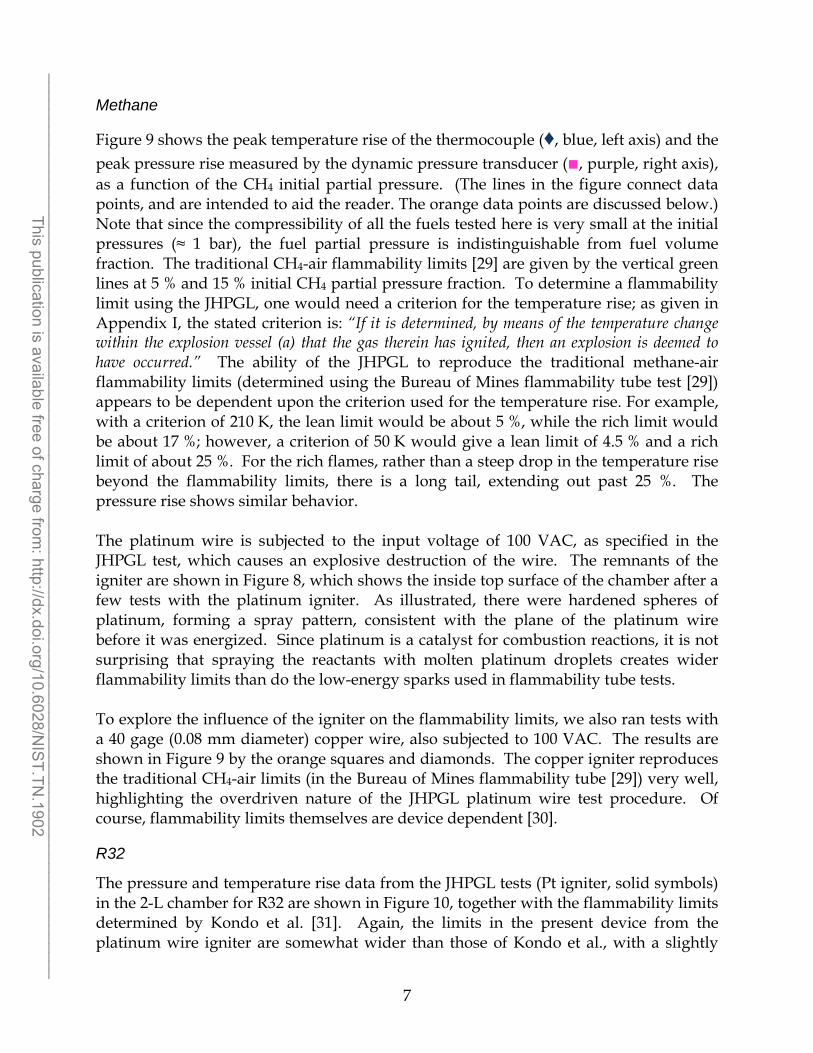
are the final and initial pressures, and γ is the ratio of specific heats (Cp/Cv). The relationship is easily derived from the First Law of Thermodynamics, definitions of the internal energy U, γ, and the ideal gas law. Table 2 shows the results of such tests for the tungsten, platinum, and copper (thicker) igniters. Figure 7 shows the estimates of the energy in the ignition process for Pt, Cu, and W igniters of diameter 0.3 mm, 0.361 mm, and 0.3 mm, respectively. The upper curves show the energy needed to heat and melt the wire (point: 50 % of the wire melted; bars: 0 % to 100 % of the wire melted), again showing that the tungsten wire requires more energy, and the Pt and thick Cu wires, the same energy for melting. The lower curves show the energy in the N2 gas (based on the pressure rise). As indicated, for the platinum igniter, the energy in the gas (about 0.4 J to 3.6 J) is about 7 % to 35 % of that required to melt the wire, for copper (3 J to 7 J), about 50 % to 70 %, and for the tungsten igniter (about 2 J to 4 J), about 20 %. The data show that 1.) for a given wire type, there is significant variation in the amount of energy delivered to the gas (i.e., the pressure rise) from the wire fusion process, and 2.) the energy deduced from the pressure rise is less than that required to melt the wire, and the fraction varies with igniter type. That is, the copper igniter appears to deliver more energy to the nitrogen gas in the chamber than the platinum igniter (despite similar energies required for melting), and also more energy to the gas than the tungsten igniter, despite the tungsten wire requiring more energy to melt. Overall, the platinum wire appears to deliver less energy to the gas that the copper or tungsten wires. These results may be related to the melting, deformation, and molten droplet formation processes, which may vary with the materials.
It is somewhat surprising that the estimates, based on the energy to melt the wire, or the energy deposited in the gas, are as close as they are. The energy transferred to the gas from the fused wire may be limited by the heat transfer rate rather than the energy content of the wire. The energy transport will depend upon the temperature of the exploding wire, how much of it melted, and the size, velocity, and shape of the molten wire droplets. None of these are easy to estimate. Since molten droplets of Pt were observed on the chamber walls (Figure 8), much of the energy in the igniter may be delivered to the (massive) walls rather than the gas. These results also illustrate the stochastic nature of the ignition process with an exploding wire igniter. Depending upon the uniformity of the wire disintegration, the energy required to melt it and that deposited to the gas (and its distribution) will vary from test to test.
6
______________________________________________________________________________________________________ This publication is available free of charge from
: http://dx.doi.org/10.6028/NIS
T.TN.1902
Methane
Figure 9 shows the peak temperature rise of the thermocouple (♦, blue, left axis) and the peak pressure rise measured by the dynamic pressure transducer (■, purple, right axis), as a function of the CH4 initial partial pressure. (The lines in the figure connect data points, and are intended to aid the reader. The orange data points are discussed below.) Note that since the compressibility of all the fuels tested here is very small at the initial pressures (≈ 1 bar), the fuel partial pressure is indistinguishable from fuel volume fraction. The traditional CH4-air flammability limits [29] are given by the vertical green lines at 5 % and 15 % initial CH4 partial pressure fraction. To determine a flammability limit using the JHPGL, one would need a criterion for the temperature rise; as given in Appendix I, the stated criterion is: “If it is determined, by means of the temperature change within the explosion vessel (a) that the gas therein has ignited, then an explosion is deemed to have occurred.” The ability of the JHPGL to reproduce the traditional methane-air flammability limits (determined using the Bureau of Mines flammability tube test [29]) appears to be dependent upon the criterion used for the temperature rise. For example, with a criterion of 210 K, the lean limit would be about 5 %, while the rich limit would be about 17 %; however, a criterion of 50 K would give a lean limit of 4.5 % and a rich limit of about 25 %. For the rich flames, rather than a steep drop in the temperature rise beyond the flammability limits, there is a long tail, extending out past 25 %. The pressure rise shows similar behavior.
The platinum wire is subjected to the input voltage of 100 VAC, as specified in the JHPGL test, which causes an explosive destruction of the wire. The remnants of the igniter are shown in Figure 8, which shows the inside top surface of the chamber after a few tests with the platinum igniter. As illustrated, there were hardened spheres of platinum, forming a spray pattern, consistent with the plane of the platinum wire before it was energized. Since platinum is a catalyst for combustion reactions, it is not surprising that spraying the reactants with molten platinum droplets creates wider flammability limits than do the low-energy sparks used in flammability tube tests.
To explore the influence of the igniter on the flammability limits, we also ran tests with a 40 gage (0.08 mm diameter) copper wire, also subjected to 100 VAC. The results are shown in Figure 9 by the orange squares and diamonds. The copper igniter reproduces the traditional CH4-air limits (in the Bureau of Mines flammability tube [29]) very well, highlighting the overdriven nature of the JHPGL platinum wire test procedure. Of course, flammability limits themselves are device dependent [30].
R32
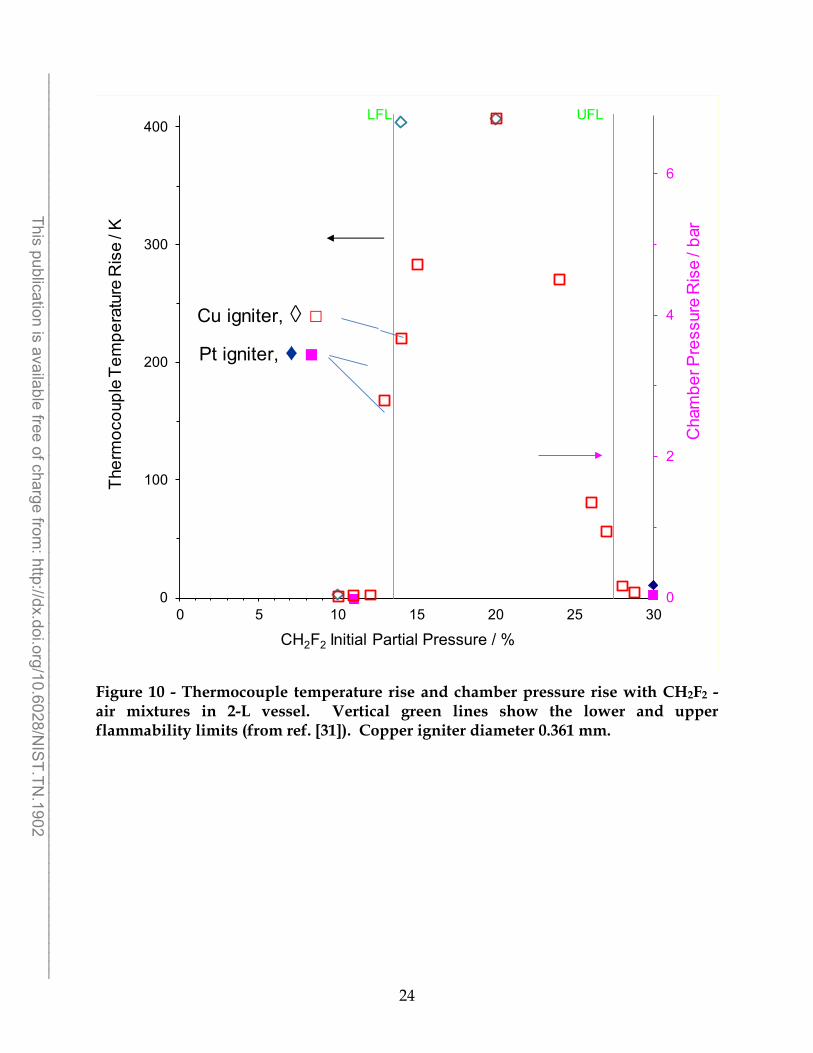
The pressure and temperature rise data from the JHPGL tests (Pt igniter, solid symbols) in the 2-L chamber for R32 are shown in Figure 10, together with the flammability limits determined by Kondo et al. [31]. Again, the limits in the present device from the platinum wire igniter are somewhat wider than those of Kondo et al., with a slightly
7
______________________________________________________________________________________________________ This publication is available free of charge from
: http://dx.doi.org/10.6028/NIS
T.TN.1902
larger discrepancy on the lean side. For comparison, tests were also conducted with the larger copper wire (diameter 0.361 mm), and these tests yield slightly narrower flammability limits than the platinum igniter, closer to those of Kondo et al. [31]. As with methane, the shapes of the pressure and temperature rise curves vs. fuel partial pressure are qualitatively similar, implying that either pressure rise of temperature rise measurements can yield similar flammability limits if the correct temperature or pressure rise criteria are selected. Nonetheless, for both CH4-air and CH2F2-air the pressure rise criterion appears to give slightly narrower flammability limits.
R1234ze(E)
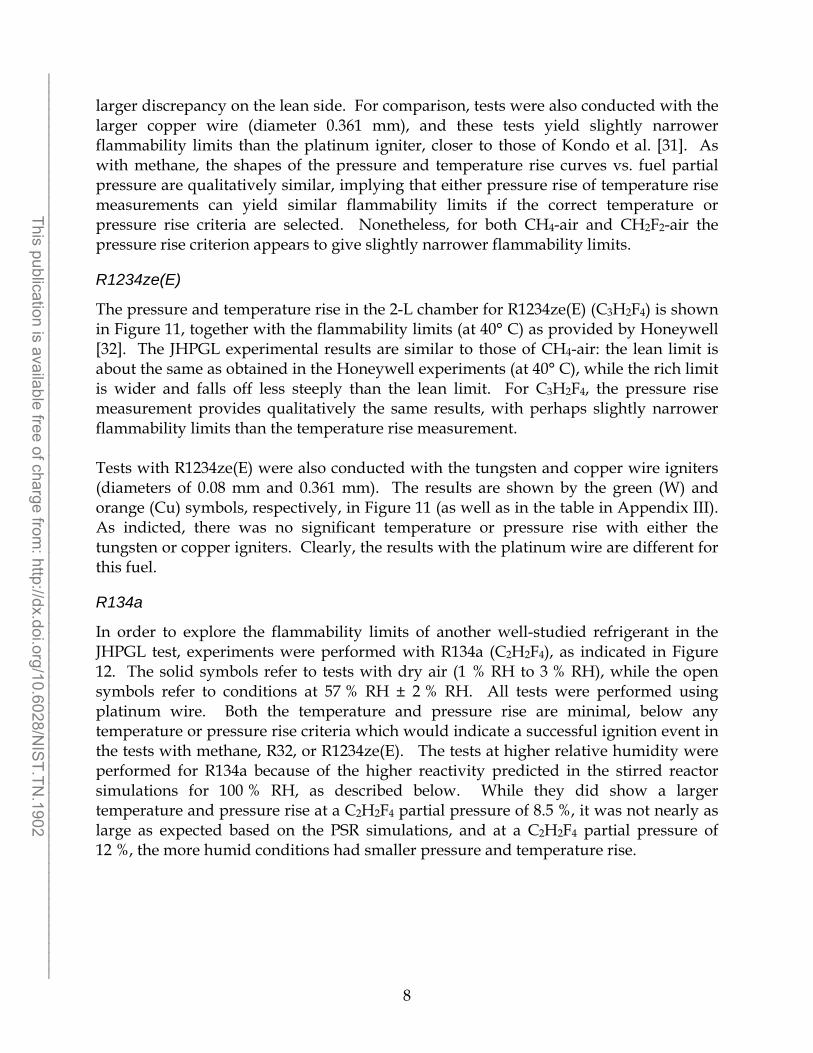
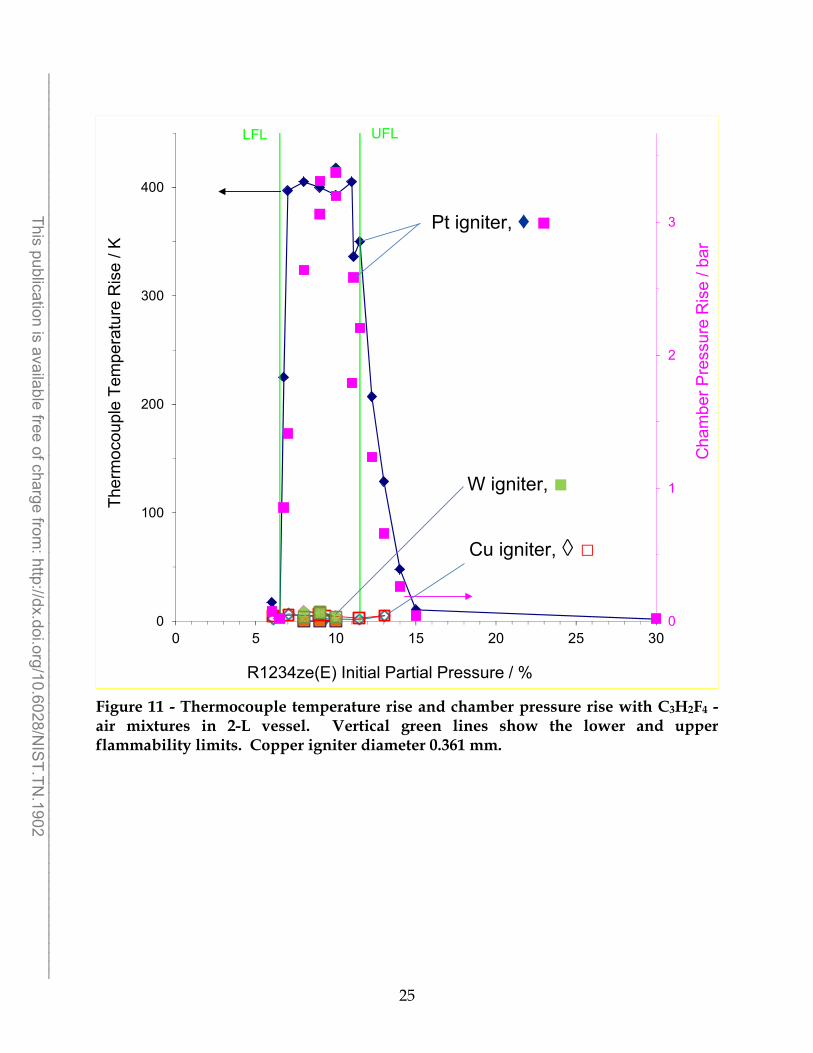
The pressure and temperature rise in the 2-L chamber for R1234ze(E) (C3H2F4) is shown in Figure 11, together with the flammability limits (at 40° C) as provided by Honeywell [32]. The JHPGL experimental results are similar to those of CH4-air: the lean limit is about the same as obtained in the Honeywell experiments (at 40° C), while the rich limit is wider and falls off less steeply than the lean limit. For C3H2F4, the pressure rise measurement provides qualitatively the same results, with perhaps slightly narrower flammability limits than the temperature rise measurement.
Tests with R1234ze(E) were also conducted with the tungsten and copper wire igniters (diameters of 0.08 mm and 0.361 mm). The results are shown by the green (W) and orange (Cu) symbols, respectively, in Figure 11 (as well as in the table in Appendix III). As indicted, there was no significant temperature or pressure rise with either the tungsten or copper igniters. Clearly, the results with the platinum wire are different for this fuel.
R134a
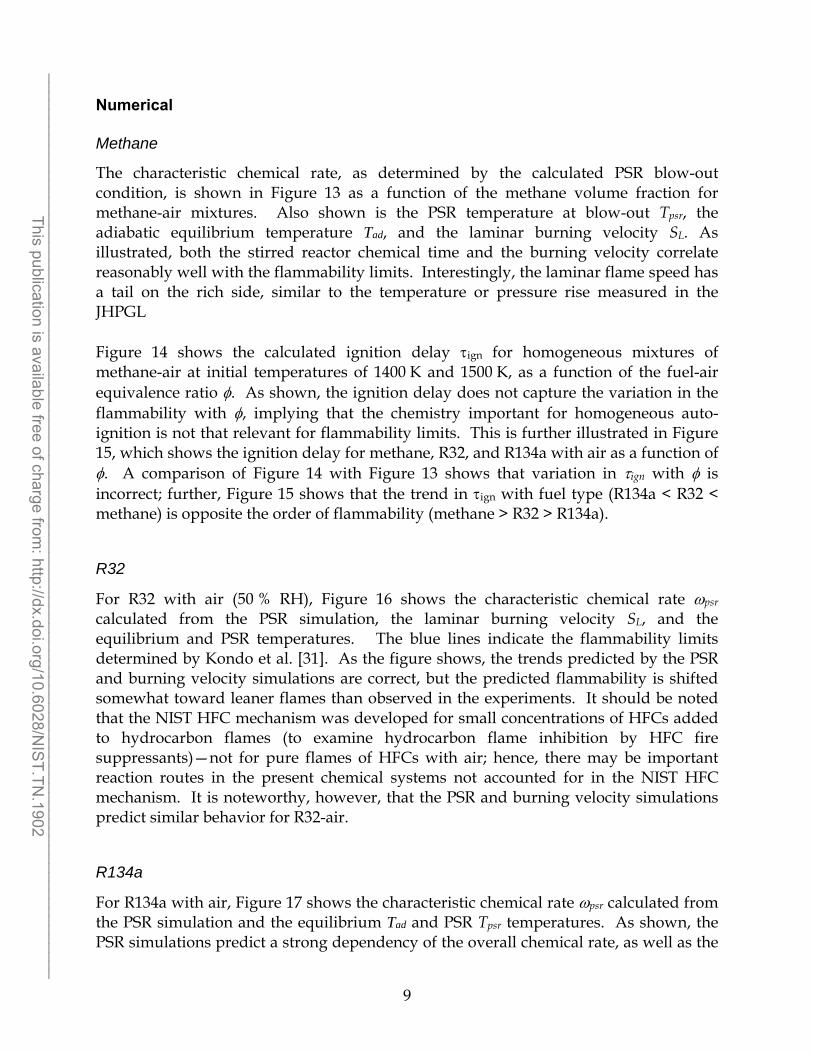
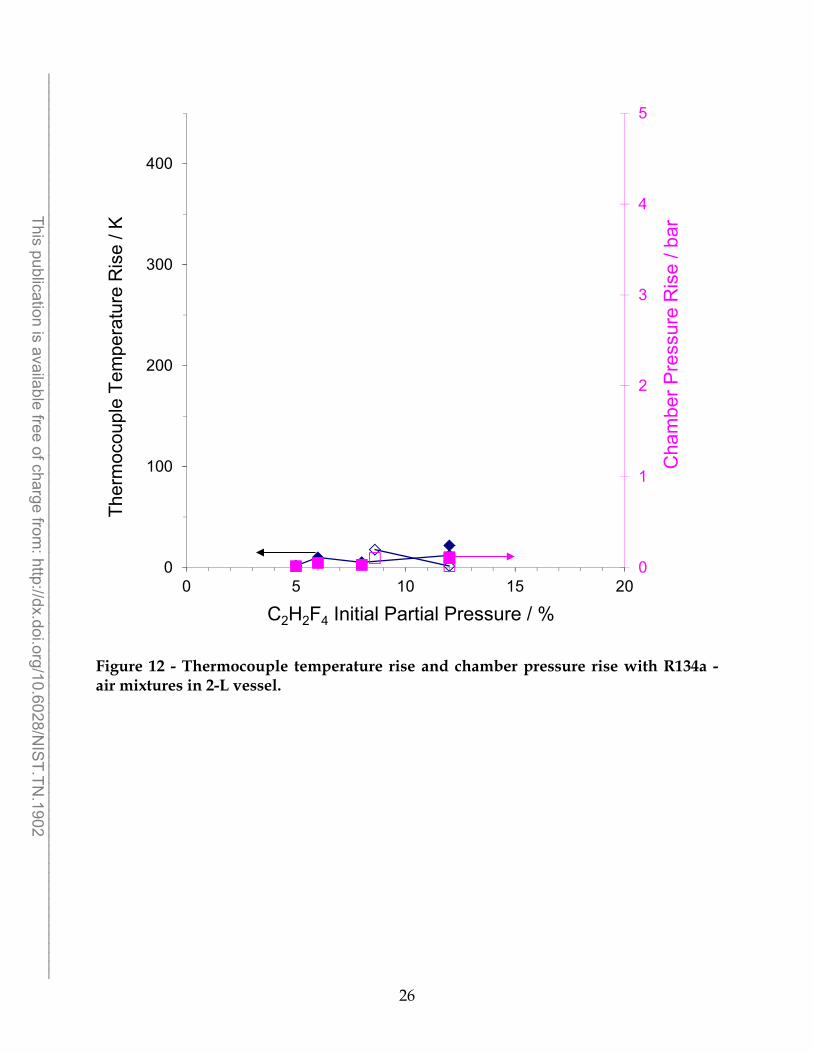
In order to explore the flammability limits of another well-studied refrigerant in the JHPGL test, experiments were performed with R134a (C2H2F4), as indicated in Figure 12. The solid symbols refer to tests with dry air (1 % RH to 3 % RH), while the open symbols refer to conditions at 57 % RH ± 2 % RH. All tests were performed using platinum wire. Both the temperature and pressure rise are minimal, below any temperature or pressure rise criteria which would indicate a successful ignition event in the tests with methane, R32, or R1234ze(E). The tests at higher relative humidity were performed for R134a because of the higher reactivity predicted in the stirred reactor simulations for 100 % RH, as described below. While they did show a larger temperature and pressure rise at a C2H2F4 partial pressure of 8.5 %, it was not nearly as large as expected based on the PSR simulations, and at a C2H2F4 partial pressure of 12 %, the more humid conditions had smaller pressure and temperature rise.
8
______________________________________________________________________________________________________ This publication is available free of charge from
: http://dx.doi.org/10.6028/NIS
T.TN.1902
Numerical
Methane
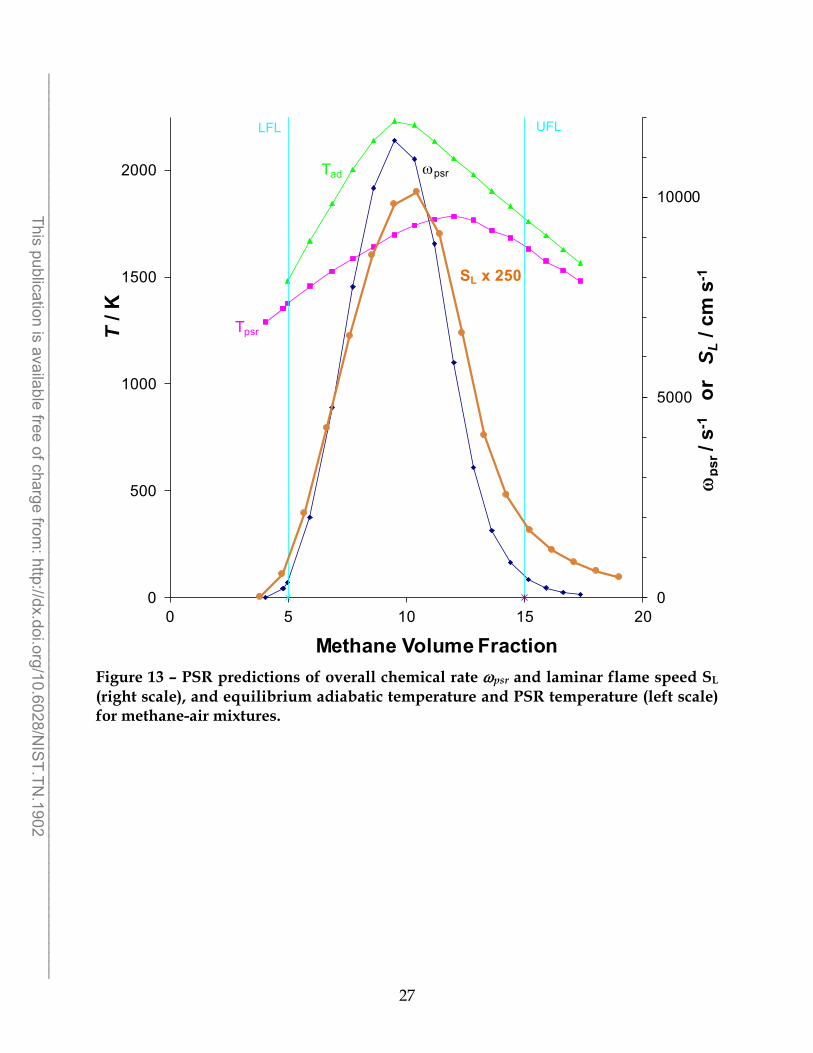
The characteristic chemical rate, as determined by the calculated PSR blow-out condition, is shown in Figure 13 as a function of the methane volume fraction for methane-air mixtures. Also shown is the PSR temperature at blow-out Tpsr, the adiabatic equilibrium temperature Tad, and the laminar burning velocity SL. As illustrated, both the stirred reactor chemical time and the burning velocity correlate reasonably well with the flammability limits. Interestingly, the laminar flame speed has a tail on the rich side, similar to the temperature or pressure rise measured in the JHPGL
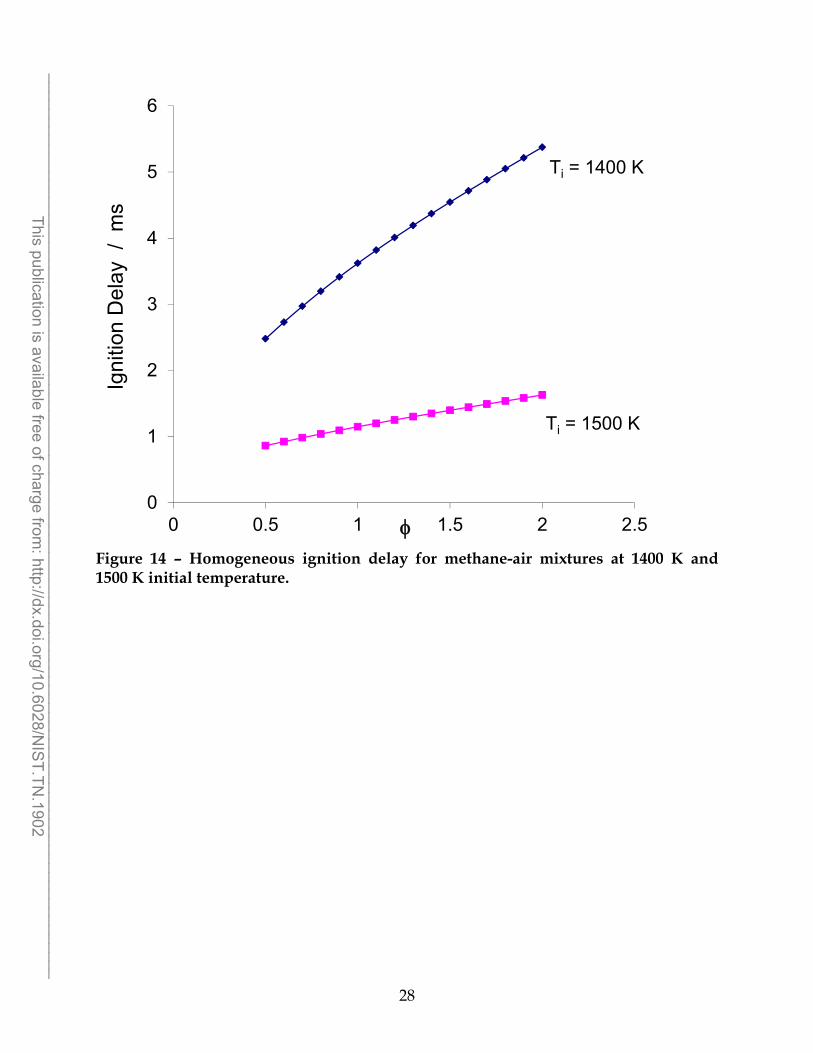
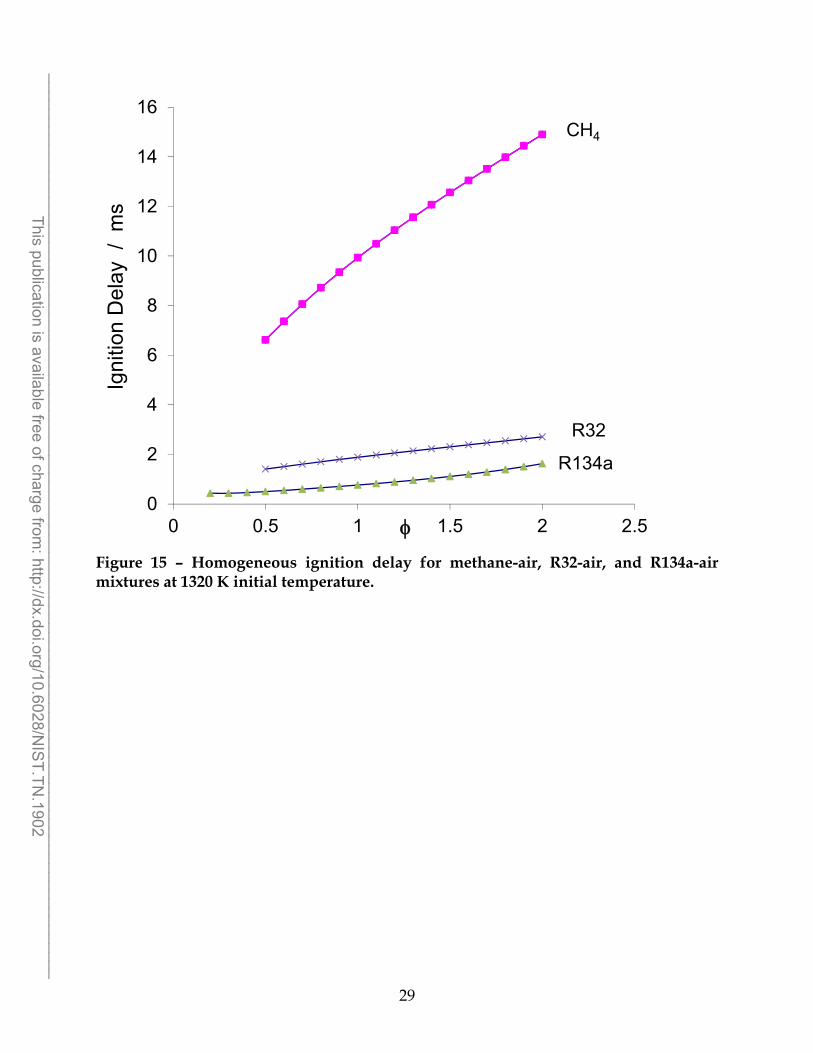
Figure 14 shows the calculated ignition delay ign for homogeneous mixtures of methane-air at initial temperatures of 1400 K and 1500 K, as a function of the fuel-air equivalence ratio . As shown, the ignition delay does not capture the variation in the flammability with , implying that the chemistry important for homogeneous autoignition is not that relevant for flammability limits. This is further illustrated in Figure 15, which shows the ignition delay for methane, R32, and R134a with air as a function of . A comparison of Figure 14 with Figure 13 shows that variation in ign with is incorrect; further, Figure 15 shows that the trend in ign with fuel type (R134a < R32 < methane) is opposite the order of flammability (methane > R32 > R134a).
R32
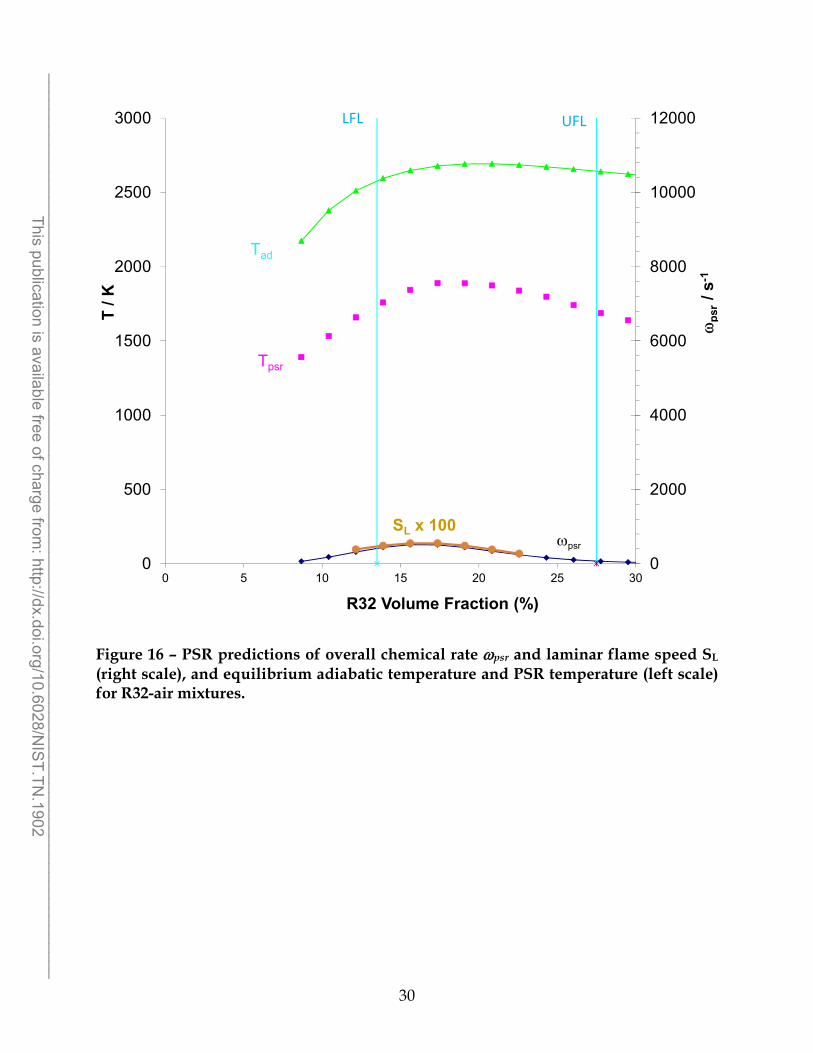
For R32 with air (50 % RH), Figure 16 shows the characteristic chemical rate psr
calculated from the PSR simulation, the laminar burning velocity SL, and the equilibrium and PSR temperatures. The blue lines indicate the flammability limits determined by Kondo et al. [31]. As the figure shows, the trends predicted by the PSR and burning velocity simulations are correct, but the predicted flammability is shifted somewhat toward leaner flames than observed in the experiments. It should be noted that the NIST HFC mechanism was developed for small concentrations of HFCs added to hydrocarbon flames (to examine hydrocarbon flame inhibition by HFC fire suppressants)—not for pure flames of HFCs with air; hence, there may be important reaction routes in the present chemical systems not accounted for in the NIST HFC mechanism. It is noteworthy, however, that the PSR and burning velocity simulations predict similar behavior for R32-air.
R134a
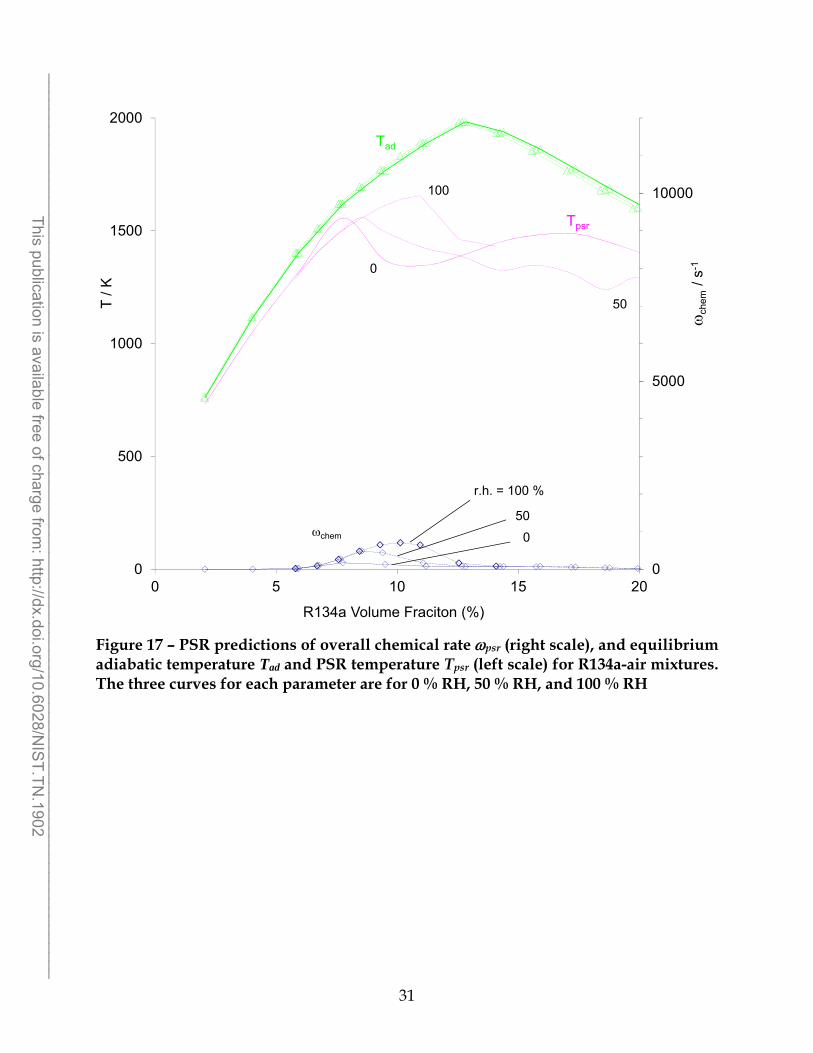
For R134a with air, Figure 17 shows the characteristic chemical rate psr calculated from the PSR simulation and the equilibrium Tad and PSR Tpsr temperatures. As shown, the PSR simulations predict a strong dependency of the overall chemical rate, as well as the
9
______________________________________________________________________________________________________ This publication is available free of charge from
: http://dx.doi.org/10.6028/NIS
T.TN.1902
temperature in the PSR, on the humidity of the air. To test this predicted trend, we conducted experiments with R134a at 2 % RH and 57 % ± 2 % RH. In the 2-L chamber tests, there was some effect of the humidity on the ignition trends at R134a partial pressures of 8.6 % and 12 %, the pressure rise never went above 0.2 bar, and the thermocouple temperature rise did not go above 23 K. The discrepancy between the PSR simulation and the 2-L chamber experiment may be due to shortcomings in the kinetic mechanism for 134a.
R125
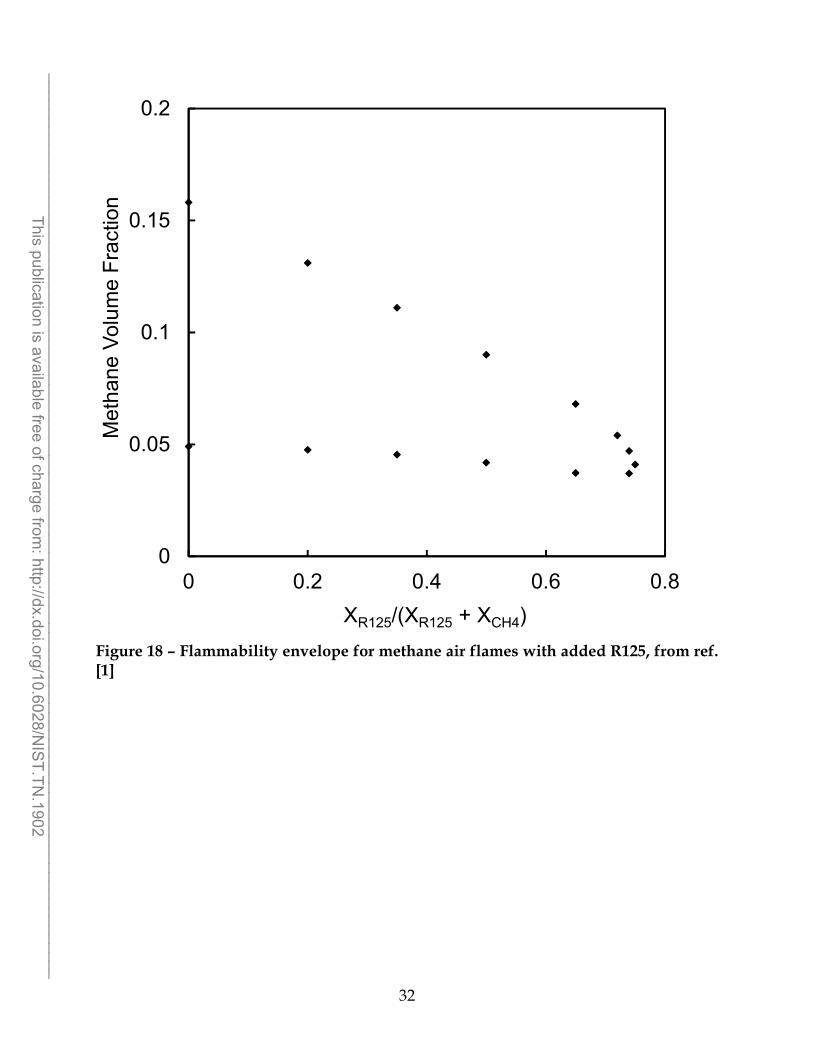
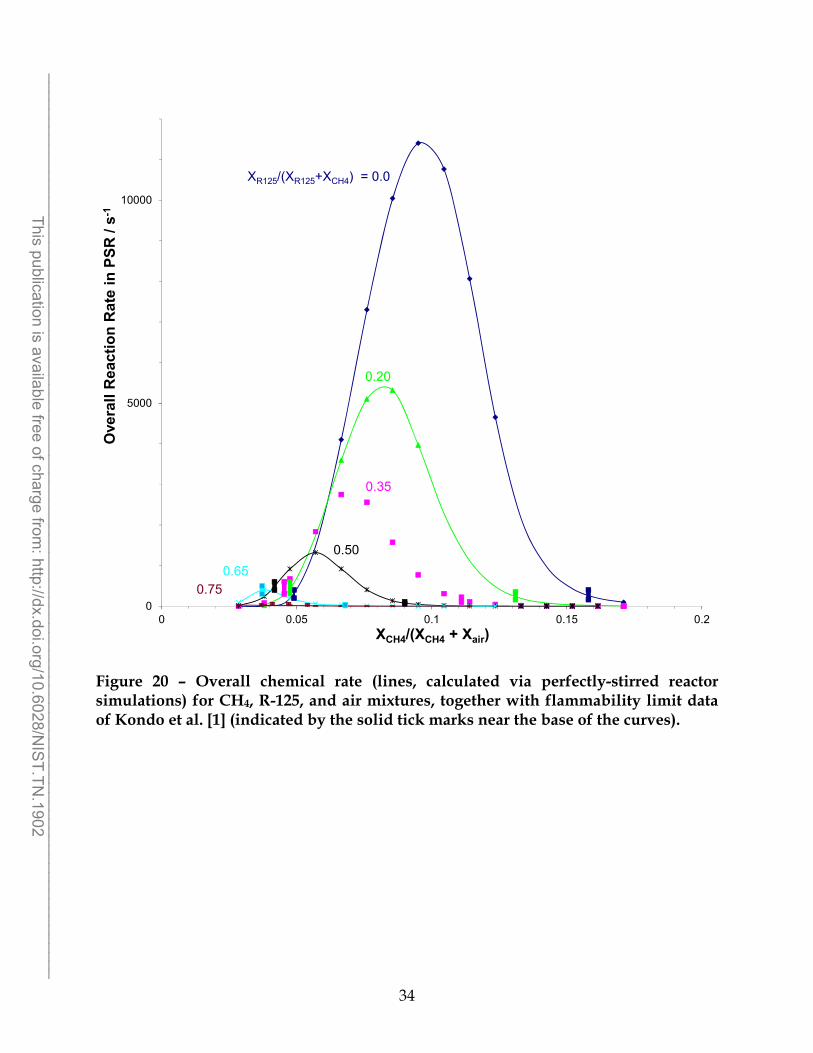
In order to further test the utility of PSR simulations for understanding flammability limits, we preformed calculations for methane-air-C2HF5 mixtures. For comparison with the simulations, we used the flammability map data of Kondo et al. [2] as shown in Figure 18 (inside the curve is flammable, outside is not). The predicted overall chemical rate in the PSR psr is shown in Figure 19 (z-axis) with the flammability contour determined by Kondo et al. on the horizontal surface. The lines across the map are for values of constant R=XR125/(XR125+XCH4), in which XR125 and XCH4 are the volume fraction of R125 and CH4. In Figure 20, the same data of Figure 19 are plotted in 2-D, with different curves representing the different values or R. As shown by Figure 19 and Figure 20, the PSR simulation does a reasonable job of predicting the flammability limits for this chemical system.
Conclusions
The behavior of methane, R32, R1234ze(E), and R134a have been investigated through constant-volume combustion experiments that closely approximate the Japanese High Pressure Gas Law (JHPGL). The flammability limits defined by the present tests are dependent upon the temperature rise criterion specified in the JHPGL, which is not quantitative. When using the specified platinum igniter wire, the indicated flammability limits for R32 and methane were somewhat wider in the JHPGL than in other experiments, particularly for methane on the rich side of stoichiometric. For methane-air flames, experiments with thinner copper wire, rather than thicker platinum wire, gave narrower flammability limits which are closer to those published for the classic Bureau of Mines flammability tube (Coward and Jones) with weak spark ignition. For R32-air mixtures, the copper wire (0.361 mm dia.) that approximates the energy release of the platinum wire gave slightly narrower flammability limits in the JHPGL test than found with the platinum wire. For R1234ze(E), however, the tests with the tungsten igniter or the copper igniter of either size had a pressure or temperature rise of less than 2 % of that with the platinum igniter, indicating non-flammable mixtures). Tests with the platinum igniter gave flammability limit values consistent with the limits provided by Honeywell for R1234ze(E)-air mixtures at elevated initial temperature (40 °C). For R134a, tests with the platinum igniter and dry air gave a maximum peak temperature rise of 21.6 K; hence, any temperature rise criterion above 22 K would indicate no
10
______________________________________________________________________________________________________ This publication is available free of charge from
: http://dx.doi.org/10.6028/NIS
T.TN.1902
ignition. Pressure rise was also measured, and gave results qualitatively the same as the temperature rise.
The flammability limits in the JHPGL test will depend upon the temperature rise, or pressure rise, criterion selected, as well as the type of igniter used.
To aid in the understanding of the chemical systems, numerical simulations were performed, for thermodynamic equilibrium conditions, homogeneous auto-ignition, stirred-reactor blow-out conditions, and laminar burning velocity. Detailed numerical simulations were performed for air (with trace water vapor) for methane, R32, R134a, and R125 systems using a chemical mechanism with 177 species and 1494 reactions. The adiabatic equilibrium temperature, stirred-reactor temperature at blow-out, and the homogeneous ignition delay did not correlate with the measured flammability limits. However, both the burning velocity and the characteristic chemical reaction rate determined with the stirred-reactor simulations correlated reasonably well with the measured flammability limits.
Acknowledgements
This work was supported by Honeywell and with NIST internal funds. There were no limitations placed on NIST concerning the tests or the reporting of results.
11
______________________________________________________________________________________________________ This publication is available free of charge from
: http://dx.doi.org/10.6028/NIS
T.TN.1902
References
1. G. T. Linteris, J. L. Pagliaro, Test results prepared for Honeywell: Flammability of refrigerants in the Japanese high pressure gas law test, Report No. NISTIR 7178, National Institute of Standards and Technology, Gaithersburg MD, 2011.
2. S. Kondo, K. Takizawa, A. Takahashi, K. Tokuhashi, A. Sekiya, Flammability limits of five selected compounds each mixed with HFC-125, Fire Saf. J. 44 (2009) 192-197.
3. Y. N. Shebeko, V. V. Azatyan, I. A. Bolodian, V. Y. Navzenya, S. N. Kopyov, D. Y. Shebeko, E. D. Zamishevski, The influence of fluorinated hydrocarbons on the combustion of gaseous mixtures in a closed vessel, Combust. Flame 121 (2000) 542-547.
4. R. J. Kee, J. F. Grcar, M. D. Smooke, J. A. Miller, A fortran computer program for modeling steady laminar one-dimensional premixed flames, Report No. SAND85-8240, Sandia National Laboratories, Livermore, CA, USA, 1991.
5. P. Glarborg, R. J. Kee, J. F. Grcar, J. A. Miller, PSR: A FORTRAN program for modeling well-stirred reactors, Report No. SAND86-8209, Sandia National Laboratories, Livermore, CA, U"SA, 1986.
6. A. E. Lutz, R. J. Kee, J. A. Miller, SENKIN: A fortran program for predicting homogeneous gas phase chemical kinetics with sensitivity analysis, Report No. SAND87-8248, Sandia National Laboratories, Livermore, CA, USA, 1988.
7. R. J. Kee, F. M. Rupley, J. A. Miller, CHEMKIN-II: A fortran chemical kinetics package for the analysis of gas phase chemical kinetics, Report No. SAND898009B, Sandia National Laboratories, Livermore, CA, USA, 1989.
8. R. J. Kee, G. Dixon-Lewis, J. Warnatz, R. E. Coltrin, J. A. Miller, A fortran computer package for the evaluation of gas-phase, multicomponent transport properties, Report No. SAND86-8246, Sandia National Laboratories, Livermore, CA, USA, 1986.
9. F. A. Williams, A unified view of fire suppression, J. Fire Flamma. 5 (1974) 54-63.
10. R. B. Barat, Correlating laminar burning velocities using perfectly stirred reactor theory, Chem. Eng. Sci. 56 (2001) 2761-2766.
12
______________________________________________________________________________________________________ This publication is available free of charge from
: http://dx.doi.org/10.6028/NIS
T.TN.1902
11. S. Liu, M. C. Soteriou, M. B. Colket, J. A. Senecal, Determination of cup-burner extinguishing concentration using the perfectly stirred reactor model, Fire Saf. J. 43 (2008) 589-597.
12. G. T. Linteris, D. R. Burgess, V. R. Katta, F. Takahashi, H. K. Chelliah, O. Meier, Stirred reactor calculations to understand unwanted combustion enhancement by potential halon replacements, Combust. Flame 159 (2012) 1016-1025.
13. D. A. Sheen, X. Q. You, H. Wang, T. Lovas, Spectral uncertainty quantification, propagation and optimization of a detailed kinetic model for ethylene combustion, Proc. Combust. Inst. 32 (2009) 535-542.
14. H. Wang, X. You, K. W. Jucks, S. G. Davis, A. Laskin, F. Egolfopoulos, C. K. Law, USC Mech Version II. High-temperature combustion reaction model of H2/CO/C1-C4 compounds. <http://ignis.usc.edu/USC_Mech_II.htm> (August 2015).
15. J. Li, A. Kazakov, F. L. Dryer, Ethanol pyrolysis experiments in a variable pressure flow reactor, Int. J. Chem. Kinet. 33 (2001) 859-867.
16. J. Li, A. Kazakov, F. L. Dryer, Experimental and numerical studies of ethanol decomposition reactions, Journal of Physical Chemistry A 108 (2004) 7671-7680.
17. J. Li, A. Kazakov, M. Chaos, F. L. Dryer, Chemical Kinetics of Ethanol Oxidation, in: Fifth Joint Meeting of the U.S. Sections of The Combustion Institute, Combustion Institute, Pittsburgh, PA, 2007, Paper 26.
18. D. R. Burgess, M. R. Zachariah, W. Tsang, P. R. Westmoreland, Thermochemical and chemical kinetic data for fluorinated hydrocarbons, Prog. Energy Combust. Sci. 21 (1995) 453-529.
19. D. Burgess, M. R. Zachariah, W. Tsang, P. R. Westmoreland, Thermochemical and Chemical Kinetic Data for Fluorinated Hydrocarbons, Report No. NIST Technical Note 1412, Gaithersburg, MD, 1995.
20. D. L'Esperance, B. A. Williams, J. W. Fleming, Intermediate species profiles in low pressure premixed flames inhibited by fluoromethanes, Combust. Flame 117 (1999) 709-731.
21. Y. Saso, D. L. Zhu, H. Wang, C. K. Law, N. Saito, Laminar burning velocities of trifluoromethane-methane mixtures: Experiment and numerical simulation, Combust. Flame 114 (1998) 457-468.
13
______________________________________________________________________________________________________ This publication is available free of charge from
: http://dx.doi.org/10.6028/NIS
T.TN.1902
22. K. Takahashi, Y. Sekiuji, Y. Yamamori, T. Inomata, K. Yokoyama, Kinetic studies on the reactions of CF3 with O(P-3) and H atoms at high temperatures, Journal of Physical Chemistry A 102 (1998) 8339-8348.
23. Y. Yamamori, K. Takahashi, T. Inomata, Shock-tube studies on the reactions of CF2(X(1)A(1)) with O(P-3) and H atoms, Journal of Physical Chemistry A 103 (1999) 8803-8811.
24. B. Vetters, B. Dils, T. L. Nguyen, L. Vereecken, S. A. Carl, J. Peeters, Absolute rate coefficients over extended temperature ranges and mechanisms of the CF(X-2 Pi) reactions with F2, Cl2 and O2, Physical Chemistry Chemical Physics 11 (2009) 4319-4325.
25. A. Fernandez, A. Fontijn, Wide temperature range kinetics of the O+CHF3
reaction, Journal of Physical Chemistry A 105 (2001) 8196-8199.
26. C. P. Tsai, D. L. Mcfadden, Gas-phase atom radical kinetics of atomic hydrogen, nitrogen, and oxygen reactions with CHF radicals, Journal of Physical Chemistry 94 (1990) 3298-3300.
27. J. S. Francisco, A coupled-cluster study of the mechanism for the CHF+H reaction, J. Chem. Phys. 111 (1999) 3457-3463.
28. S. D. Tse, D. L. Zhu, C. K. Law, Optically accessible high-pressure combustion apparatus, Review of Scientific Instruments 75 (2004) 233-239.
29. H. F. Coward, G. W. Jones, Limits of flammability of gases and vapors, Report No. AD0701575, U. b. o. Mines, Washington, D.C., 1952.
30. I. Glassman, Combustion, Academic Press, San Diego, CA, 1996.
31. S. Kondo, Y. Urano, K. Takizawa, A. Takahashi, K. Tokuhashi, A. Sekiya, Flammability limits of multi-fluorinated compounds, Fire Saf. J. 41 (2006) 46-56.
32. R. G. Richard, Personal Communication, 2011.
14
______________________________________________________________________________________________________ This publication is available free of charge from
: http://dx.doi.org/10.6028/NIS
T.TN.1902
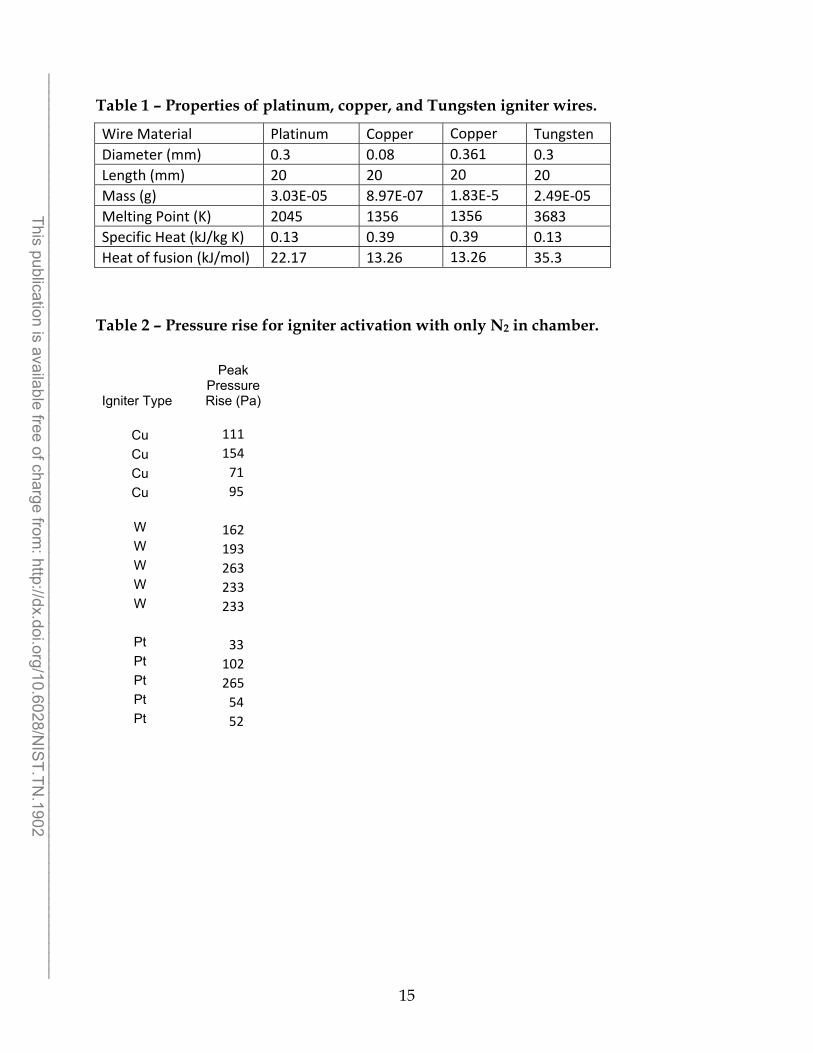
Table 1 – Properties of platinum, copper, and Tungsten igniter wires.
Wire Material Platinum Copper Copper Tungsten Diameter (mm) 0.3 0.08 0.361 0.3 Length (mm) 20 20 20 20 Mass (g) 3.03E‐05 8.97E‐07 1.83E‐5 2.49E‐05 Melting Point (K) 2045 1356 1356 3683 Specific Heat (kJ/kg K) 0.13 0.39 0.39 0.13 Heat of fusion (kJ/mol) 22.17 13.26 13.26 35.3
Table 2 – Pressure rise for igniter activation with only N2 in chamber.
Peak Pressure
Igniter Type Rise (Pa)
Cu 111 Cu 154 Cu 71 Cu 95
W 162 W 193 W 263 W 233 W 233
Pt 33 Pt 102 Pt 265 Pt 54 Pt 52
15
______________________________________________________________________________________________________ This publication is available free of charge from
: http://dx.doi.org/10.6028/NIS
T.TN.1902
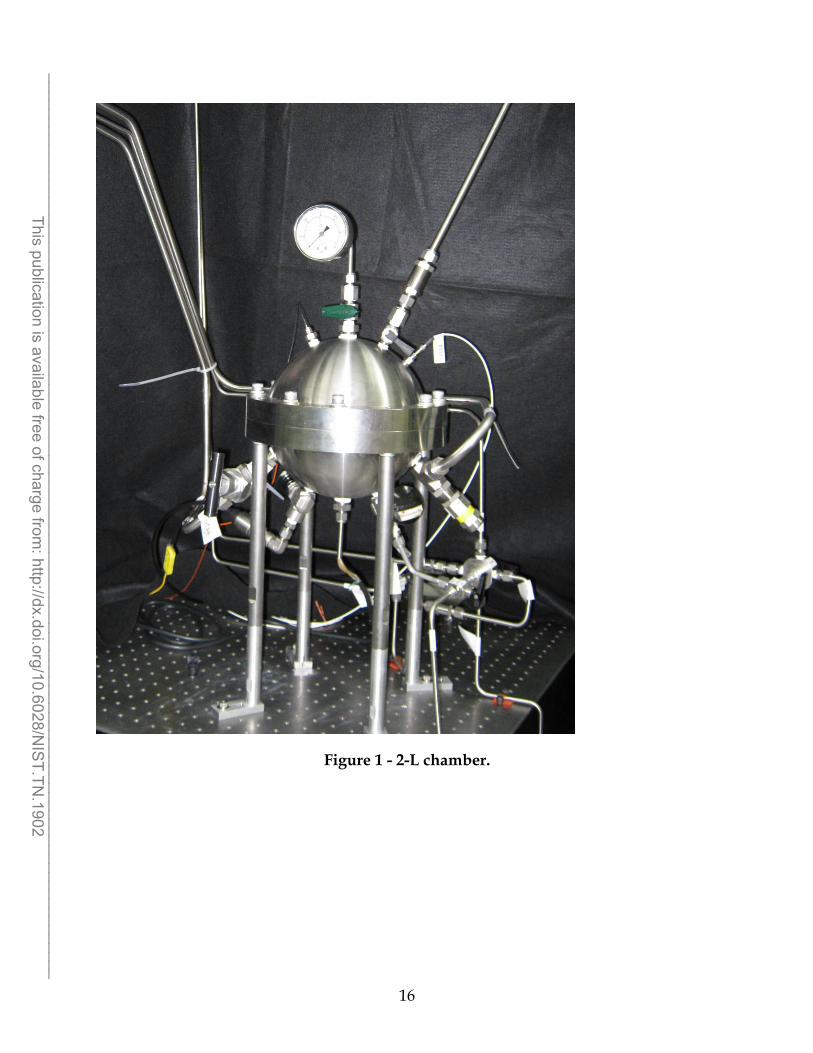
Figure 1 - 2-L chamber.
16
______________________________________________________________________________________________________ This publication is available free of charge from
: http://dx.doi.org/10.6028/NIS
T.TN.1902
Legend
~ PCB 101A06 0‐500 psi, 2%
Omega PX811‐030AV 0‐30 psia, 0.1%
ball valve
check valve
needle valve
relief valve
tube
tube with minimized volume
5‐port valve
air 30 psig
vacuum 100 Torr
vent 1 atm
2 L sphere
TC, type K
Bourdon gage, 0‐600 psig
Ignitor
refrigerant 10 psig
methane 10 psig
3‐port valve
N2
170 psig
vent 1 atm
vent 1 atm
17
______________________________________________________________________________________________________ This publication is available free of charge from
: http://dx.doi.org/10.6028/NIS
T.TN.1902
Figure 2 - Plumbing schematic diagram of 2-L chamber (1 atm = 10133 Pa; non-SI units are shown for pressures to correspond to the readouts of the actual
instruments).
100 VAC Variac
2 L sphere
PCB 101A06 0‐500 psi, 2%
TC, type K
Omega PX811‐030AV 0‐30 psia, 0.1%
Readout
TC, type K
National Instruments DAQ
Figure 3 - Electrical schematic diagram of 2-L chamber.
18
______________________________________________________________________________________________________ This publication is available free of charge from
: http://dx.doi.org/10.6028/NIS
T.TN.1902
8
0
500
1000
1500
2000
2500
Re
ac
tor
Te
mp
era
ture
/ K
XC2HF5 = 0 %
7.7
14.4
≈ 0.65 50 % r.h.
0.43 = 32 ms 2.4
0.0001 0.001 0.01 0.1 1 10
Residence Time / s
Figure 4 – Stirred reactor temperature as a function of residence time for a stoichiometric methane-air system with added C2HF5 suppressant at volume fractions of 0, 0.077, and 0.144 (from [10]).
700 10 700 10
600 8
14% R32
29%
11%
15% CH4
19%
4.5%
200 200
2
100
2 100
0 0
0 1 2 3 4 5 6 7 8 0 0
7 9 11 13 15 Time / s Time / s
Figure 5 – Thermocouple temperature and dynamic pressure measurements as a function of time for methane (left frame) and R32 (right frame); the different curves
500
Tem
pera
ture
(K
)
Pre
ssur
e /
bar
Pre
ssu
re /
bar
Tem
per
atu
re (
K)
66 400 400
300 300 44
19
500
600
______________________________________________________________________________________________________ This publication is available free of charge from
: http://dx.doi.org/10.6028/NIS
T.TN.1902
refer to non-flammable (red), marginally flammable (green), and flammable mixtures (blue).
0
5
10
15
Energy / J
Platinum
Copper (thick)
Copper (thin)
Tungsten
0 0.5 1 Fraction of Wire Melted
Figure 6 – Energy required to melt the tungsten, platinum, copper (thick), or copper (thin) wires (diameter: 0.3 mm, 0.3 mm, 0.361 mm, and 0.08 mm) in the present experiment as a function of the fraction of igniter melted.
20
______________________________________________________________________________________________________ This publication is available free of charge from
: http://dx.doi.org/10.6028/NIS
T.TN.1902
Energy / J
15
E to Melt Wire
10
5 E From Pressure Rise
0 Pt Cu W
Igniter Material
Figure 7 – Ignition energy estimates for tungsten, platinum, or copper wires (diameters: 0.3 mm, 0.3 mm, 0.361 mm). Top, energy required to melt 50 % of the wire (error bars, 0 % or 100 % of wire melted); bottom, energy in gas (N2) estimated from the observed pressure rise.
21
______________________________________________________________________________________________________ This publication is available free of charge from
: http://dx.doi.org/10.6028/NIS
T.TN.1902
Figure 8 – Top, inside surface of 2-L chamber after several tests with the platinum igniter.
22
______________________________________________________________________________________________________ This publication is available free of charge from
: http://dx.doi.org/10.6028/NIS
T.TN.1902
0
1
2
3
4
5
0
100
200
300
400
Cha
mbe
r P
ress
ure
Ris
e / b
ar
The
rmoc
oupl
e Te
mpe
ratu
re R
ise
/ K
LFL UFL
0 5 10 15 20 25 30
CH4 Initial Partial Pressure / %
Figure 9 - Thermocouple temperature rise and chamber pressure rise with CH4 – air mixtures in 2-L vessel with Pt igniter (orange points, Cu igniter, dia. 0.08 mm). Vertical green lines show the lower and upper flammability limits (from ref. [29] ).
23
______________________________________________________________________________________________________ This publication is available free of charge from
: http://dx.doi.org/10.6028/NIS
T.TN.1902
400
6
300
LFL UFL
Pt igniter, ♦ ■
Cu igniter, ◊ □
0 5 10 15 20 25 30
The
rmo
coup
le T
em
pe
ratu
re R
ise
/ K
Cha
mb
er P
ress
ure
Ris
e /
bar
4
200
2
100
0 0
CH2F2 Initial Partial Pressure / %
Figure 10 - Thermocouple temperature rise and chamber pressure rise with CH2F2 -air mixtures in 2-L vessel. Vertical green lines show the lower and upper flammability limits (from ref. [31]). Copper igniter diameter 0.361 mm.
24
______________________________________________________________________________________________________ This publication is available free of charge from
: http://dx.doi.org/10.6028/NIS
T.TN.1902
0
1
2
3
0
100
200
300
400
Cha
mbe
r P
ress
ure
Ris
e / b
ar
The
rmoc
oupl
e T
empe
ratu
re R
ise
/ K
LFL UFL
W igniter, ■
Pt igniter, ♦ ■
Cu igniter, ◊ □
0 5 10 15 20 25 30
R1234ze(E) Initial Partial Pressure / %
Figure 11 - Thermocouple temperature rise and chamber pressure rise with C3H2F4 -air mixtures in 2-L vessel. Vertical green lines show the lower and upper flammability limits. Copper igniter diameter 0.361 mm.
25
______________________________________________________________________________________________________ This publication is available free of charge from
: http://dx.doi.org/10.6028/NIS
T.TN.1902
0
1
2
3
4
5
0
100
200
300
400
Cha
mbe
r P
ress
ure
Ris
e / b
ar
The
rmoc
oupl
e T
empe
ratu
re R
ise
/ K
0 5 10 15 20
C2H2F4 Initial Partial Pressure / %
Figure 12 - Thermocouple temperature rise and chamber pressure rise with R134a -air mixtures in 2-L vessel.
26
______________________________________________________________________________________________________ This publication is available free of charge from
: http://dx.doi.org/10.6028/NIS
T.TN.1902
T /
K
Tpsr
Tad psr
UFLLFL
SL x 250
0 5 10 15 20
2000
10000
1500
ps
r/ s
-1
or
SL
/ cm
s-1
1000 5000
500
0 0
Methane Volume Fraction
Figure 13 – PSR predictions of overall chemical rate psr and laminar flame speed SL
(right scale), and equilibrium adiabatic temperature and PSR temperature (left scale) for methane-air mixtures.
27
______________________________________________________________________________________________________ This publication is available free of charge from
: http://dx.doi.org/10.6028/NIS
T.TN.1902
6
5
4
3
Ti = 1400 K
Igni
tion
Del
ay /
ms
2
1 Ti = 1500 K
0 0 0.5 1 1.5 2 2.5
Figure 14 – Homogeneous ignition delay for methane-air mixtures at 1400 K and 1500 K initial temperature.
28
______________________________________________________________________________________________________ This publication is available free of charge from
: http://dx.doi.org/10.6028/NIS
T.TN.1902
Igni
tion
Del
ay /
ms
16
14
12
10
8
6
4
CH4
0
2 R32
R134a
0 0.5 1 1.5 2 2.5
Figure 15 – Homogeneous ignition delay for methane-air, R32-air, and R134a-air mixtures at 1320 K initial temperature.
29
______________________________________________________________________________________________________ This publication is available free of charge from
: http://dx.doi.org/10.6028/NIS
T.TN.1902
0
2000
4000
6000
8000
10000
12000
0
500
1000
1500
2000
2500
3000
p
sr /
s-1
T /
K
Tpsr
Tad
psr
SL x 100
LFL UFL
0 5 10 15 20 25 30
R32 Volume Fraction (%)
Figure 16 – PSR predictions of overall chemical rate psr and laminar flame speed SL
(right scale), and equilibrium adiabatic temperature and PSR temperature (left scale) for R32-air mixtures.
30
______________________________________________________________________________________________________ This publication is available free of charge from
: http://dx.doi.org/10.6028/NIS
T.TN.1902
1000
5000
500
00
R134a Volume Fraciton (%)
Figure 17 – PSR predictions of overall chemical rate psr (right scale), and equilibrium adiabatic temperature Tad and PSR temperature Tpsr (left scale) for R134a-air mixtures. The three curves for each parameter are for 0 % RH, 50 % RH, and 100 % RH
2000
10000
1500
0 5 10 15 20
ch
em /
s -1
T /
K
Tpsr
Tad
chem
r.h. = 100 %
50
0
50
100
0
31
______________________________________________________________________________________________________ This publication is available free of charge from
: http://dx.doi.org/10.6028/NIS
T.TN.1902
0
0.05
0.1
0.15
0.2M
etha
ne V
olum
e F
ract
ion
0 0.2 0.4 0.6 0.8
XR125/(XR125 + XCH4)
Figure 18 – Flammability envelope for methane air flames with added R125, from ref. [1]
32
______________________________________________________________________________________________________ This publication is available free of charge from
: http://dx.doi.org/10.6028/NIS
T.TN.1902
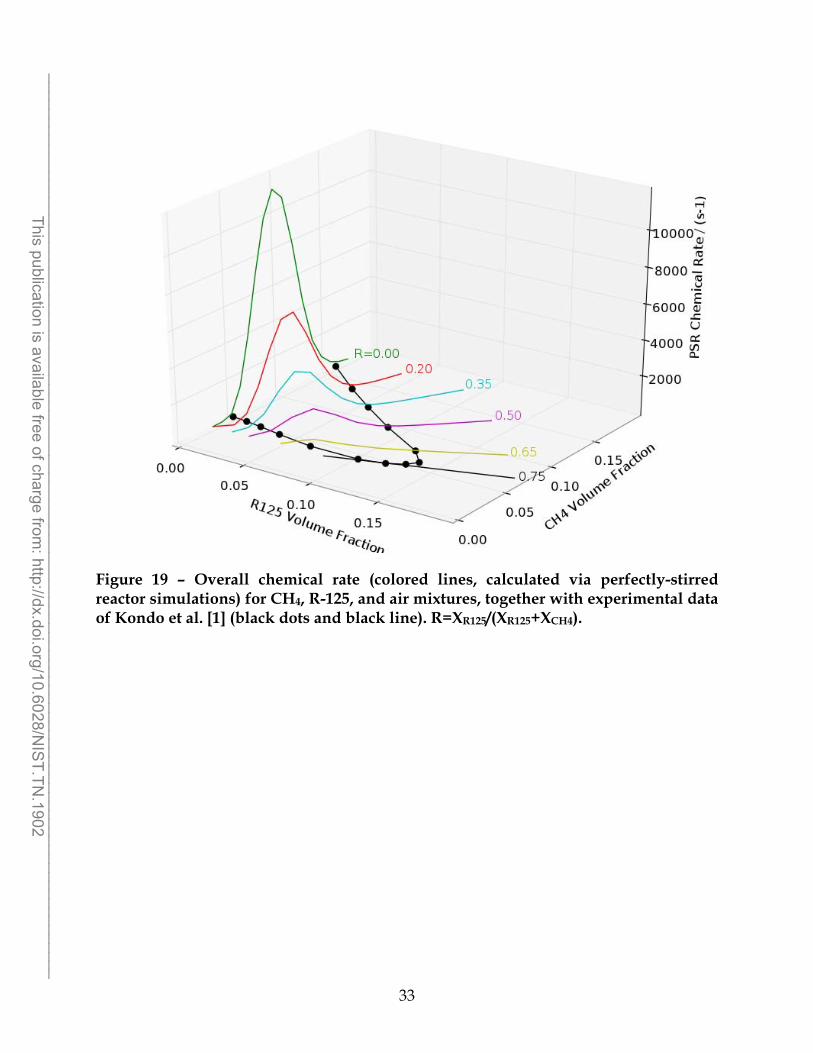
Figure 19 – Overall chemical rate (colored lines, calculated via perfectly-stirred reactor simulations) for CH4, R-125, and air mixtures, together with experimental data of Kondo et al. [1] (black dots and black line). R=XR125/(XR125+XCH4).
33
______________________________________________________________________________________________________ This publication is available free of charge from
: http://dx.doi.org/10.6028/NIS
T.TN.1902
10000
5000
0
XCH4/(XCH4 + Xair)
Figure 20 – Overall chemical rate (lines, calculated via perfectly-stirred reactor simulations) for CH4, R-125, and air mixtures, together with flammability limit data of Kondo et al. [1] (indicated by the solid tick marks near the base of the curves).
Ove
rall
Rea
ctio
n R
ate
in P
SR
/ s
-1
XR125/(XR125+XCH4) = 0.0
0.20
0.35
0.50
0.65 0.75
0 0.05 0.1 0.15 0.2
34
______________________________________________________________________________________________________ This publication is available free of charge from
: http://dx.doi.org/10.6028/NIS
T.TN.1902
APPENDIX I - Japanese High Pressure Gas Law (translation)
35
______________________________________________________________________________________________________ This publication is available free of charge from
: http://dx.doi.org/10.6028/NIS
T.TN.1902
Japanese High Pressure Gas Law (translation)
7 Hermetically sealed test pressure
For cryogenic vessels and low-temperature vessels, a
pressure of 1.1 times the maximum filling pressure; for vessels
filled with acetylene gas, a pressure of 1.8 times the maximum
filling pressure; and for other vessels, the maximum filling
pressure (Ordinance 29, 1980, part amended)
8 Flammable gases
Acetylene, ammonia, carbon monoxide, ethane, ethylene, vinyl
chloride, chloromethane, ethylene oxide, hydrogen cyanide,
cyclopropane, hydrogen, trimethylamine, butadiene, butane,
butylene, propane, propylene, methane, monomethylamine, methyl
ether, hydrogen sulfide, and other gases that correspond to
either i) or ii) below (Ordinance 29, 1980, part amended)
i) Having a lower explosion limit (referring to the explosion
limit when mixed with air. The same definition is used
hereinbelow) of 10 percent or less
ii) Having a difference of 20 percent or more between the upper
and lower explosion limits
9 Toxic gases
Sulfur dioxide gas, ammonia, carbon monoxide, chlorine,
chloromethane, ethylene oxide, hydrogen cyanide, trimethylamine,
monomethylamine, hydrogen sulfide and other gases whose
permissible concentration volume is 200/1,000,000 or less
(Ordinance 29, 1980, part amended)
Methods for Measuring the Explosion Limits of Flammable Gases
36
______________________________________________________________________________________________________ This publication is available free of charge from
: http://dx.doi.org/10.6028/NIS
T.TN.1902
Notification is hereby given that, as per the appendix
hereto, methods have been established for measuring the explosion
limits mentioned in i) and ii) of the General High-Pressure Gas
Safety Regulations, Article 2, Section 1.
The reasons for establishing this standard are as follows.
Article 2, Section 1 of said Safety Regulations defines a
flammable gas as “i) Having a lower explosion limit of 10 percent
or less, or ii) having a difference of 20 percent or more between
the upper and lower explosion limits”, but no standard currently
exists for the measurement method, with various methods being
used. Furthermore, values measured using different measurement
methods do not necessarily correspond, and in certain situations
a significant disparity can arise. There is thus the danger that
problems may arise in relation to whether or not an aerosol
propellant or the like, for example, falls within the definition
of a flammable gas.
The purpose is thus to standardize the measurement method,
by selecting from these various measurement methods the methods
described in the appendix, which are currently thought to be the
most reliable and most widely used, and further to ensure
reproducibility and repeatability of the measured values by
standardizing the measurement device, method of operation,
calculation method and the like.
This proposal was drafted by preparing a first draft which
took account of the opinions of several specialists, including
the Government Chemical Industrial Research Institute, Tokyo,
then presenting this first draft to related industries
(approximately ten organizations) for opinions, and finally
making necessary revisions.
It should be noted that the intention is for this standard
to be used if JIS Standards or the like are established in the
future.
(Appendix)
Standard methods of measuring explosion limits
37
______________________________________________________________________________________________________ This publication is available free of charge from
: http://dx.doi.org/10.6028/NIS
T.TN.1902
The methods of measuring the explosion limits mentioned in
i) and ii) of the General High-Pressure Gas Safety Regulations,
Article 2, Section 1 shall be as follows.
1 Selection of measurement method
To measure the explosion limits of flammable gas or vapor
(referred to hereinafter simply as ‘gas’), Method A shall be used
for gases whose molecules contain halogen, or gases comprising
gases whose molecules contain halogen, mixed with other gases
(excluding air or oxygen), and Method B shall be used for other
gases.
2 Method of measurement
(1) Method A
1. Measurement device
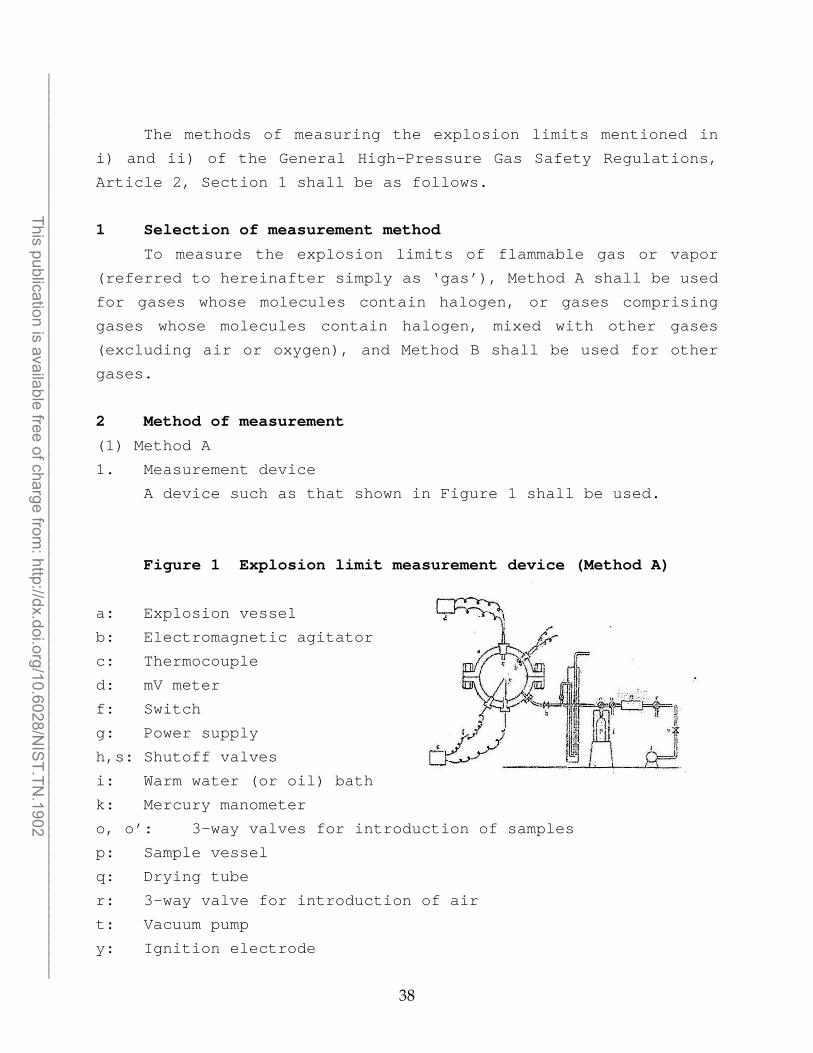
A device such as that shown in Figure 1 shall be used.
Figure 1 Explosion limit measurement device (Method A)
a: Explosion vessel
b: Electromagnetic agitator
c: Thermocouple
d: mV meter
f: Switch
g: Power supply
h,s: Shutoff valves
i: Warm water (or oil) bath
k: Mercury manometer
o, o’: 3-way valves for introduction of samples
p: Sample vessel
q: Drying tube
r: 3-way valve for introduction of air
t: Vacuum pump
y: Ignition electrode
38
______________________________________________________________________________________________________ This publication is available free of charge from
: http://dx.doi.org/10.6028/NIS
T.TN.1902
(i) Explosion vessel (a)
Shall be a spherical vessel having a capacity of
approximately 2 liters, able to withstand an explosive pressure
of at least 10kg/cm.
(ii) Ignition device
A platinum wire (diameter 0.3mm, length 20mm) shall be
brazed to an electrode (y) which is inserted into the central
portion of the vessel, and which is connected to a 100 volt
alternating current power supply (g).
(iii) Explosion temperature measuring device
A chromel-alumel thermocouple (c) (sheath cap type, diameter
approximately 1mm) shall be mounted inside the vessel, and
connected to a full-scale 5mV millivolt recording meter (d).
2. Operation
(i) The entire system within the device is evacuated using a
vacuum pump (t).
(ii) The sample gas is introduced into the vessel (a) by opening
a sample introduction valve (o or o’). The amount introduced is
measured using a mercury manometer (k).
Note: With liquefied gases comprising a mixture of two or more
gases, to measure the explosion limits of the composition as
exhibited in the liquefied state, a sample is collected in
accordance with JIS K2550 (Method of sampling liquefied petroleum
gas); when the sample is introduced into the explosion chamber
care should be taken to ensure that the composition of the gas
inside the explosion chamber does not differ from the composition
of the gas in the liquefied state, for example by vaporizing all
of the liquefied gas within the sample vessel (p) (such that no
liquefied gas remains).
(iii) Air is introduced by opening the air introduction valve (r)
until the pressure inside the explosion vessel (a) reaches
atmospheric pressure.
39
______________________________________________________________________________________________________ This publication is available free of charge from
: http://dx.doi.org/10.6028/NIS
T.TN.1902
(iv) The gas inside the explosion vessel (a) is mixed
sufficiently using an electromagnetic agitator (b) to achieve a
uniform concentration.
(v) After closing the valve (h), the ignition device switch (f)
is turned on, causing the platinum wire to melt and thereby
generating a spark.
(vi) If it is determined, by means of the temperature change
within the explosion vessel (a), that the gas therein has
ignited, then an explosion is deemed to have occurred.
(2) Method B
1. Measurement device
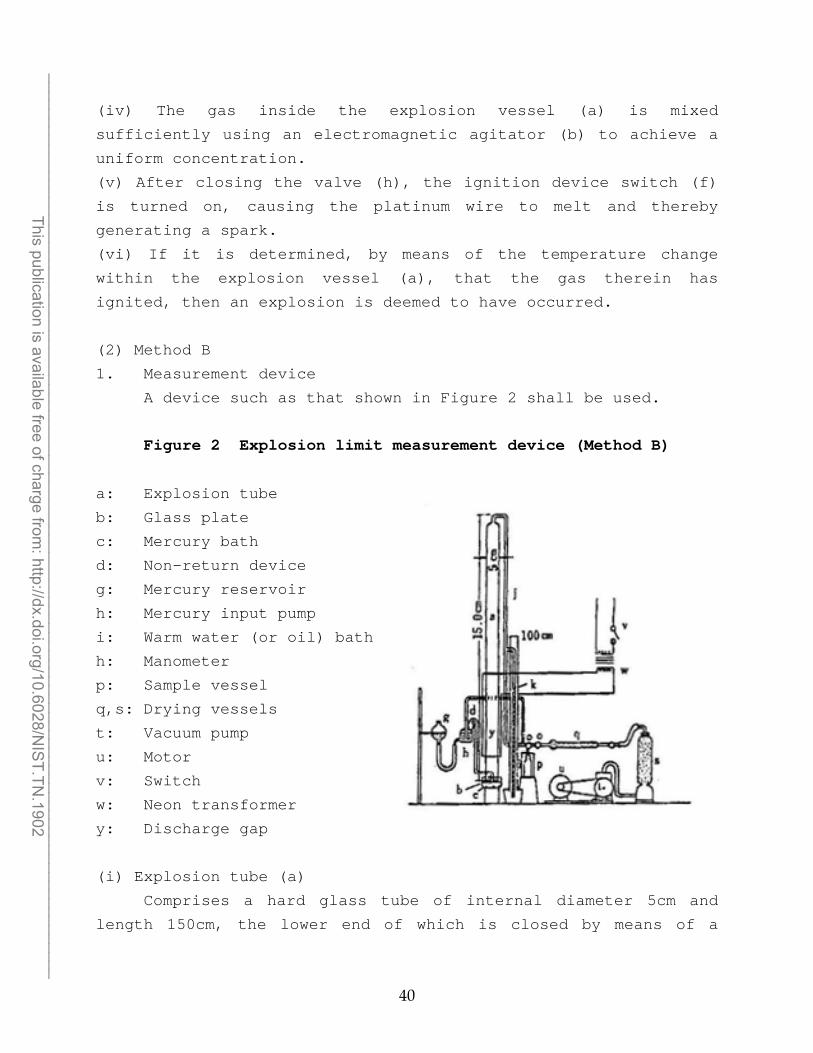
A device such as that shown in Figure 2 shall be used.
Figure 2 Explosion limit measurement device (Method B)
a: Explosion tube
b: Glass plate
c: Mercury bath
d: Non-return device
g: Mercury reservoir
h: Mercury input pump
i: Warm water (or oil) bath
h: Manometer
p: Sample vessel
q,s: Drying vessels
t: Vacuum pump
u: Motor
v: Switch
w: Neon transformer
y: Discharge gap
(i) Explosion tube (a)
Comprises a hard glass tube of internal diameter 5cm and
length 150cm, the lower end of which is closed by means of a
40
______________________________________________________________________________________________________ This publication is available free of charge from
: http://dx.doi.org/10.6028/NIS
T.TN.1902
ground glass joint, using a lid comprising a glass plate (b), and
hermetically sealed by immersion in a mercury bath (c).
(ii) Ignition device
A spark discharge electrode (y) having a gap of
approximately 3mm is mounted in the lower portion of the
explosion tube, and is connected to a neon transformer (w) which
generates a voltage of at least 12 kV.
2. Operation
(i) The entire system within the device is evacuated by operating
a vacuum pump (t).
(ii) The sample gas is introduced into the explosion tube (a) by
opening a sample introduction valve (o or o’). The amount
introduced is measured using a mercury manometer (k).
(iii) Air is introduced via a drying tube (q) until the pressure
inside the tube (a) reaches atmospheric pressure.
(iv) The gas within the tube is agitated by raising and lowering
a mercury reservoir (g) repeatedly for a period of 10 to 30
minutes to achieve a uniform concentration. Alternatively an
electromagnetic agitator or the like may be used.
(v) The mercury bath (c) is lowered and the glass plate (b) is
removed, immediately after which the switch (v) is operated,
generating a spark discharge at the electrode (y).
(vi) At this time, the flame generated at the ignition location
rises up the tube, and an explosion is deemed to have occurred if
the flame is observed to have reached the top of the tube.
Note: Propagation of the flame should be observed in a darkened
place. If observation is difficult even in a darkened place, then
confirmation shall be performed by mounting in the upper portion
of the explosion tube the same type of explosion temperature
measuring device as in 2-(1)-1-(iii).
Determining explosion limits
(1) Upper explosion limit
1. Tests are performed using various different concentrations
in the vicinity of the concentration assumed to be the upper
41
3
______________________________________________________________________________________________________ This publication is available free of charge from
: http://dx.doi.org/10.6028/NIS
T.TN.1902
explosion limit (at least two tests each without the occurrence
of an explosion and with the occurrence of an explosion); the
lowest gas concentration at which an explosion does not occur is
defined as Vn (volume %), and the highest gas concentration at
which an explosion does occur is defined as Vi (volume %).
2. The upper explosion limit is defined as the value obtained
by calculation using the following formula.
Upper explosion limit Ev (volume %) = (Vn + Vi) / 2
Provided that Vn and Vi are sufficiently close together that
both of the following two formulae are satisfied:
Vn – Vi < 3 (%)
(Vn – Vi) / Vi < 0.1
(2) Lower explosion limit
1. Tests are performed using various different concentrations
in the vicinity of the concentration assumed to be the lower
explosion limit (at least two tests each without the occurrence
of an explosion and with the occurrence of an explosion); the
lowest gas concentration at which an explosion does occur is
defined as Li (volume %), and the highest gas concentration at
which an explosion does not occur is defined as Ln (volume %).
2. The lower explosion limit is defined as the value obtained
by calculation using the following formula.
Lower explosion limit El (volume %) = (Li + Ln) / 2
Provided that Li and Ln are sufficiently close together that
both of the following two formulae are satisfied:
Li – Ln < 3 (%)
(Li – Ln) / Ln < 0.1
42
______________________________________________________________________________________________________ This publication is available free of charge from
: http://dx.doi.org/10.6028/NIS
T.TN.1902
APPENDIX II – Standard Operating Procedure for 2-L Chamber
43
______________________________________________________________________________________________________ This publication is available free of charge from
: http://dx.doi.org/10.6028/NIS
T.TN.1902
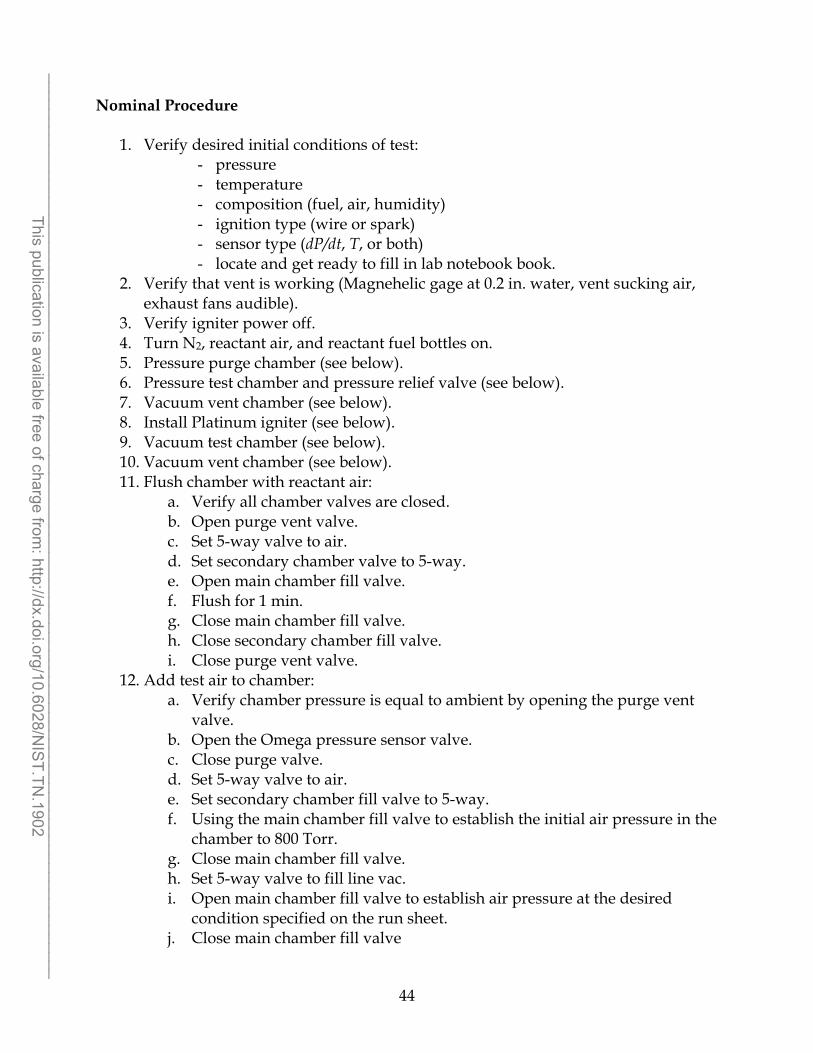
Nominal Procedure
1. Verify desired initial conditions of test: - pressure - temperature - composition (fuel, air, humidity) - ignition type (wire or spark) - sensor type (dP/dt, T, or both) - locate and get ready to fill in lab notebook book.
2. Verify that vent is working (Magnehelic gage at 0.2 in. water, vent sucking air, exhaust fans audible).
3. Verify igniter power off. 4. Turn N2, reactant air, and reactant fuel bottles on. 5. Pressure purge chamber (see below). 6. Pressure test chamber and pressure relief valve (see below). 7. Vacuum vent chamber (see below). 8. Install Platinum igniter (see below). 9. Vacuum test chamber (see below). 10. Vacuum vent chamber (see below). 11. Flush chamber with reactant air:
a. Verify all chamber valves are closed. b. Open purge vent valve. c. Set 5-way valve to air. d. Set secondary chamber valve to 5-way. e. Open main chamber fill valve. f. Flush for 1 min. g. Close main chamber fill valve. h. Close secondary chamber fill valve. i. Close purge vent valve.
12. Add test air to chamber: a. Verify chamber pressure is equal to ambient by opening the purge vent
valve. b. Open the Omega pressure sensor valve. c. Close purge valve. d. Set 5-way valve to air. e. Set secondary chamber fill valve to 5-way. f. Using the main chamber fill valve to establish the initial air pressure in the
chamber to 800 Torr. g. Close main chamber fill valve. h. Set 5-way valve to fill line vac. i. Open main chamber fill valve to establish air pressure at the desired
condition specified on the run sheet. j. Close main chamber fill valve
44
______________________________________________________________________________________________________ This publication is available free of charge from
: http://dx.doi.org/10.6028/NIS
T.TN.1902
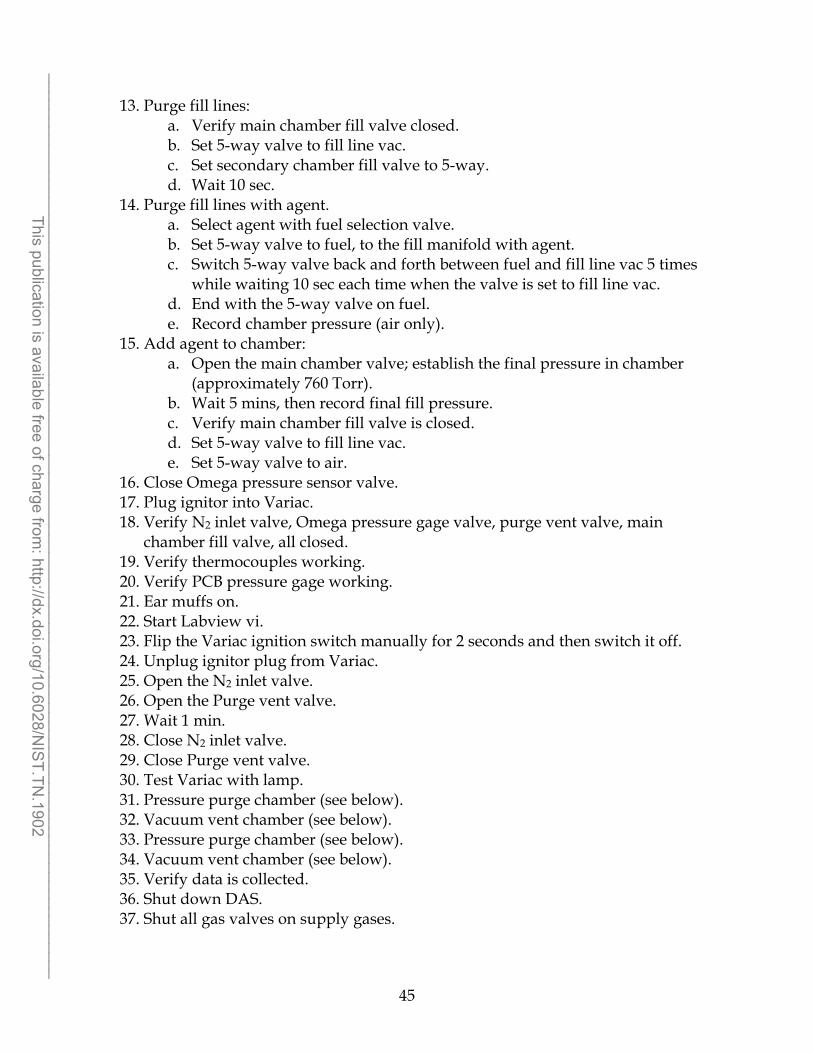
13. Purge fill lines: a. Verify main chamber fill valve closed. b. Set 5-way valve to fill line vac. c. Set secondary chamber fill valve to 5-way. d. Wait 10 sec.
14. Purge fill lines with agent. a. Select agent with fuel selection valve. b. Set 5-way valve to fuel, to the fill manifold with agent. c. Switch 5-way valve back and forth between fuel and fill line vac 5 times
while waiting 10 sec each time when the valve is set to fill line vac. d. End with the 5-way valve on fuel. e. Record chamber pressure (air only).
15. Add agent to chamber: a. Open the main chamber valve; establish the final pressure in chamber
(approximately 760 Torr). b. Wait 5 mins, then record final fill pressure. c. Verify main chamber fill valve is closed. d. Set 5-way valve to fill line vac. e. Set 5-way valve to air.
16. Close Omega pressure sensor valve. 17. Plug ignitor into Variac. 18. Verify N2 inlet valve, Omega pressure gage valve, purge vent valve, main
chamber fill valve, all closed. 19. Verify thermocouples working. 20. Verify PCB pressure gage working. 21. Ear muffs on. 22. Start Labview vi. 23. Flip the Variac ignition switch manually for 2 seconds and then switch it off. 24. Unplug ignitor plug from Variac. 25. Open the N2 inlet valve. 26. Open the Purge vent valve. 27. Wait 1 min. 28. Close N2 inlet valve. 29. Close Purge vent valve. 30. Test Variac with lamp. 31. Pressure purge chamber (see below). 32. Vacuum vent chamber (see below). 33. Pressure purge chamber (see below). 34. Vacuum vent chamber (see below). 35. Verify data is collected. 36. Shut down DAS. 37. Shut all gas valves on supply gases.
45
______________________________________________________________________________________________________ This publication is available free of charge from
: http://dx.doi.org/10.6028/NIS
T.TN.1902
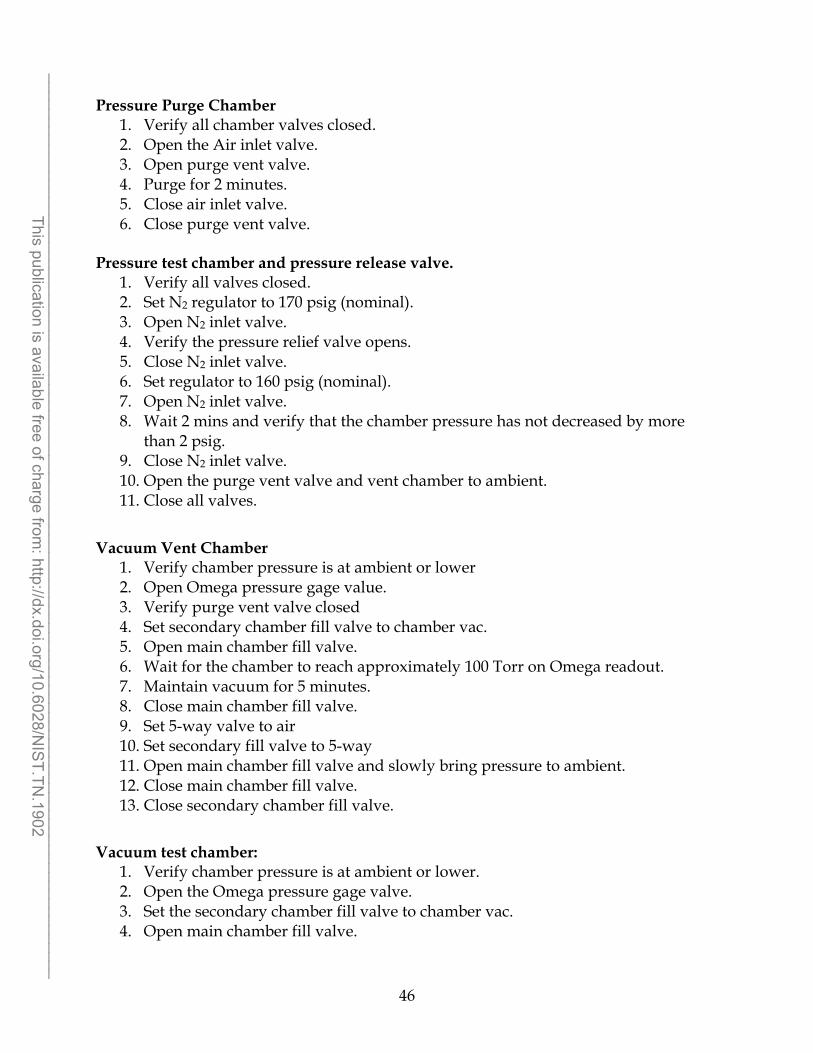
Pressure Purge Chamber 1. Verify all chamber valves closed. 2. Open the Air inlet valve. 3. Open purge vent valve. 4. Purge for 2 minutes. 5. Close air inlet valve. 6. Close purge vent valve.
Pressure test chamber and pressure release valve. 1. Verify all valves closed. 2. Set N2 regulator to 170 psig (nominal). 3. Open N2 inlet valve. 4. Verify the pressure relief valve opens. 5. Close N2 inlet valve. 6. Set regulator to 160 psig (nominal). 7. Open N2 inlet valve. 8. Wait 2 mins and verify that the chamber pressure has not decreased by more
than 2 psig. 9. Close N2 inlet valve. 10. Open the purge vent valve and vent chamber to ambient. 11. Close all valves.
Vacuum Vent Chamber 1. Verify chamber pressure is at ambient or lower 2. Open Omega pressure gage value. 3. Verify purge vent valve closed 4. Set secondary chamber fill valve to chamber vac. 5. Open main chamber fill valve. 6. Wait for the chamber to reach approximately 100 Torr on Omega readout. 7. Maintain vacuum for 5 minutes. 8. Close main chamber fill valve. 9. Set 5-way valve to air 10. Set secondary fill valve to 5-way 11. Open main chamber fill valve and slowly bring pressure to ambient. 12. Close main chamber fill valve. 13. Close secondary chamber fill valve.
Vacuum test chamber: 1. Verify chamber pressure is at ambient or lower. 2. Open the Omega pressure gage valve. 3. Set the secondary chamber fill valve to chamber vac. 4. Open main chamber fill valve.
46
______________________________________________________________________________________________________ This publication is available free of charge from
: http://dx.doi.org/10.6028/NIS
T.TN.1902
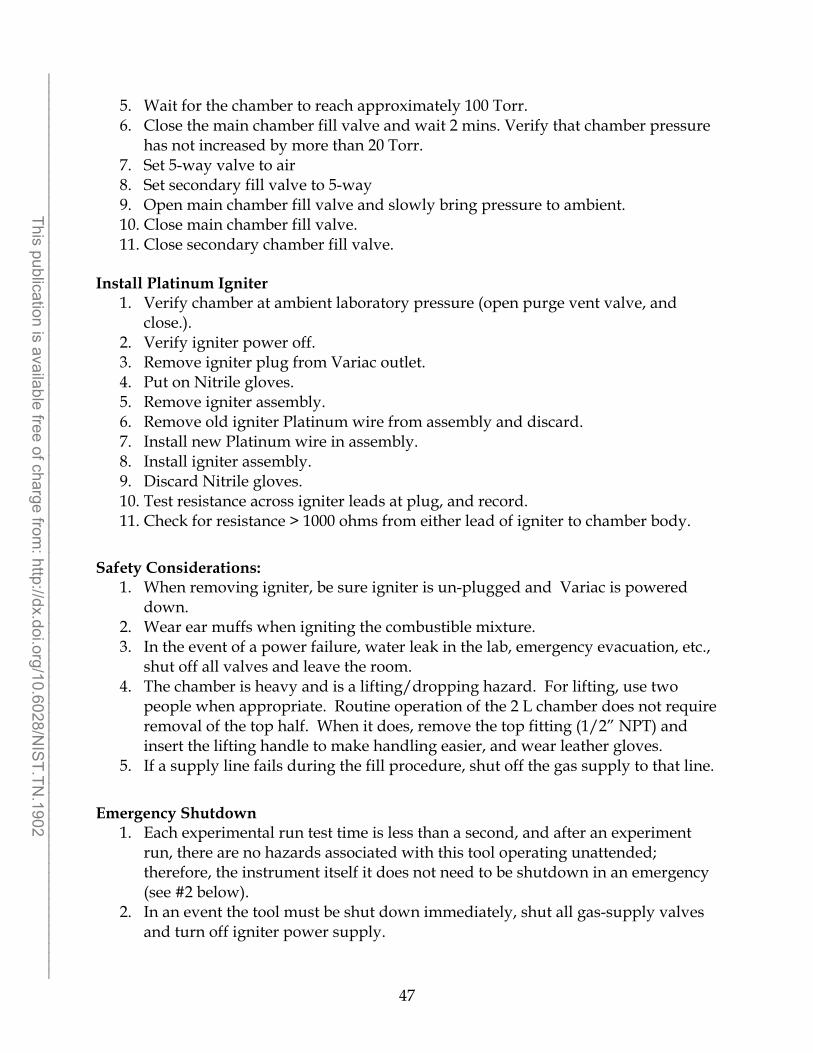
5. Wait for the chamber to reach approximately 100 Torr. 6. Close the main chamber fill valve and wait 2 mins. Verify that chamber pressure
has not increased by more than 20 Torr. 7. Set 5-way valve to air 8. Set secondary fill valve to 5-way 9. Open main chamber fill valve and slowly bring pressure to ambient. 10. Close main chamber fill valve. 11. Close secondary chamber fill valve.
Install Platinum Igniter 1. Verify chamber at ambient laboratory pressure (open purge vent valve, and
close.). 2. Verify igniter power off. 3. Remove igniter plug from Variac outlet. 4. Put on Nitrile gloves. 5. Remove igniter assembly. 6. Remove old igniter Platinum wire from assembly and discard. 7. Install new Platinum wire in assembly. 8. Install igniter assembly. 9. Discard Nitrile gloves. 10. Test resistance across igniter leads at plug, and record. 11. Check for resistance > 1000 ohms from either lead of igniter to chamber body.
Safety Considerations: 1. When removing igniter, be sure igniter is un-plugged and Variac is powered
down. 2. Wear ear muffs when igniting the combustible mixture. 3. In the event of a power failure, water leak in the lab, emergency evacuation, etc.,
shut off all valves and leave the room. 4. The chamber is heavy and is a lifting/dropping hazard. For lifting, use two
people when appropriate. Routine operation of the 2 L chamber does not require removal of the top half. When it does, remove the top fitting (1/2” NPT) and insert the lifting handle to make handling easier, and wear leather gloves.
5. If a supply line fails during the fill procedure, shut off the gas supply to that line.
Emergency Shutdown 1. Each experimental run test time is less than a second, and after an experiment
run, there are no hazards associated with this tool operating unattended; therefore, the instrument itself it does not need to be shutdown in an emergency (see #2 below).
2. In an event the tool must be shut down immediately, shut all gas-supply valves and turn off igniter power supply.
47
______________________________________________________________________________________________________ This publication is available free of charge from
: http://dx.doi.org/10.6028/NIS
T.TN.1902

3. If an alarm occurs for fire, shelter in place, etc., shut off gases at the supply bottle and immediately leave the room. It is not necessary to shutdown the instrument.
If the emergency is in the lab, leave immediately and contact NIST emergency operator at extension x2222.
48
______________________________________________________________________________________________________ This publication is available free of charge from
: http://dx.doi.org/10.6028/NIS
T.TN.1902
APPENDIX III - Raw data for flammability tests with 2-L chamber
49
______________________________________________________________________________________________________ This publication is available free of charge from
: http://dx.doi.org/10.6028/NIS
T.TN.1902
Agent Run Date
Run Number
Igniter Type
Ignit er Dia. (mm)
Agent Partial Pressure (%)
Peak Temp. Rise (K)
Peak Pressure Rise (bar)
Relative Humidity (%)
CH4 6/16/2011 1 Pt 0.3 4.5 7 0.0345
6/23/2011 2 Pt “ 4.65 81 0.3378
6/16/2011 2 Pt “ 4.77 88 0.3447
6/14/2011 4 Pt “ 4.8 157 0.6895
6/16/2011 3 Pt “ 4.81 142 0.7584
6/23/2011 1 Pt “ 4.883 145 0.6067
6/14/2011 3 Pt “ 4.9 114 0.4137
6/14/2011 2 Pt “ 5 210 1.3790
6/17/2011 1 Pt “ 6 265 3.7921
6/23/2011 3 Pt “ 15 316 2.6614
6/23/2011 4 Pt “ 17 207 0.6805
6/23/2011 5 Pt “ 18 71 0.2758 6/23/2011 6 Pt “ 19 73.5 0.2386
6/28/2011 1 Pt “ 20 67.8 0.2055 1.2
6/28/2011 2 Pt “ 22 59.3 0.1972 1.8
6/28/2011 3 Pt “ 25 48.2 0.2103 1.8
9/23/2011 5 Cu 0.08 4.7 1.6 0.0090
9/23/2011 4 “ “ 5 164.6 0.6240
9/23/2011 3 “ “ 14 298.3 3.2750
9/23/2011 2 “ “ 16 1.76 0.0011
9/23/2011 1 “ “ 19 3.9 0.0029
R32 7/7/2011 3 Pt 0.3 11 1.5 0 1.2
7/7/2011 2 “ “ 12 243 0.8274 1.8
7/7/2011 1 “ “ 13 346 2.6890 2.1
7/1/2011 2 “ “ 14 375 3.9990 1
7/1/2011 1 “ “ 15.6 400 0 1.3
7/7/2011 6 “ “ 26 313 3.2405 1.1
7/7/2011 4 “ “ 27.64 195 1.2411 1.2
7/7/2011 7 “ “ 29 39.4 0.2620 1.3
7/7/2011 5 “ “ 30 11 0.0455 0.7
4/8/2016 10 Cu (IT) 0.361 10.0 3.0 0.028 4/8/2016 4 “ “ 11.0 17.0 0.040 4/8/2016 8 “ “ 12.1 6.7 0.051 4/8/2016 9 “ “ 12.9 362.8 2.803 4/8/2016 12 “ “ 14.0 404.1 3.687 4/8/2016 13 “ “ 15.0 388.1 4.729
50
______________________________________________________________________________________________________ This publication is available free of charge from
: http://dx.doi.org/10.6028/NIS
T.TN.1902
4/8/2016 1 “ “ 20.1 407.6 6.798 4/8/2016 11 “ “ 24.0 351.6 4.509 4/8/2016 7 “ “ 26.1 232.7 1.358 4/8/2016 6 “ “ 27.0 182.0 0.952 4/8/2016 2 “ “ 28.0 47.4 0.177 4/8/2016 5 “ “ 28.8 26.6 0.085 4/8/2016 3 “ “ 30.1 6.0 0.046
1234ze (E)
7/14/2011 1 Pt 0.3 6 17.6 0.0758 1.7
7/14/2011 7 “ “ 6.5 3.3 0.0207 1.1
7/15/2011 1 “ “ 6.75 225 0.8550 1.8
7/14/2011 2 “ “ 7 397 1.4134 1.2
7/15/2011 3 “ “ 8 405 2.6407 1.2
7/14/2011 5 “ “ 9 400 3.3095 1.1
8/10/2012 3 “ “ 9 n/a 3.0602
4/7/2016 4 Pt (IT) “ 9.1 424 2.853 7/15/2011 4 Pt “ 10 393 3.1992 1.2
8/23/2012 3 “ “ 10 418 3.3730
7/12/2001 1 “ “ 11 405 1.7926 1.3
7/15/2011 5 “ “ 11.1 336 2.5855 1.2
7/14/2011 8 “ “ 11.5 350 2.2063 1.2
7/15/2011 2 “ “ 12.25 207 1.2342 1.4
7/14/2011 3 “ “ 13 129 0.6619 1.2
7/14/2001 4 “ “ 14 48 0.2620 1.2
7/14/2011 6 “ “ 15 10.6 0.0414 1.1
7/12/2011 2 “ “ 30 2 0.0207 1.1
4/7/2016 4 Pt (IT) “ 9.1 423.8 2.853
7/21/2011 2 Cu 0.08 8 0.3 0 1.5
7/21/2011 1 “ “ 9 0.3 0 1.5
7/21/2011 3 “ “ 10 0.3 0 1.5
8/23/2012 2 W 0.3 8 9.7 0.0621
12/4/2012 2 “ “ 8.5 2.9 0.0345
8/22/2012 1 “ “ 9 8.1 0.0676
12/4/2012 1 “ “ 9 2.9 0.0345
12/4/2012 3 “ “ 9.5 10.5 0.0703
8/23/2012 1 “ “ 10 4.9 0.0531
8/10/2012 1 “ “ 9 n/a 0.0674
8/10/2012 2 “ “ 9 n/a 0.0663
4/7/2016 8 Cu (IT) 0.361 6.1 2.2 0.039 4/7/2016 6 “ “ 7.1 6.7 0.045 4/7/2016 5 “ “ 8.9 3.9 0.044
51
______________________________________________________________________________________________________ This publication is available free of charge from
: http://dx.doi.org/10.6028/NIS
T.TN.1902

4/7/2016 2 “ “ 9.0 1.6 0.057 4/7/2016 3 “ “ 9.4 2.4 0.043 4/7/2016 7 “ “ 11.5 1.6 0.024 4/7/2016 9 “ “ 13.0 5.2 0.043 4/7/2016 1 “ “ 9.0 0.3 0.033
R134a 7/21/2011 3 Pt 0.3 5 1.7 0.0138 1.1
7/21/2011 1 “ “ 6 9.8 0.0483 1.1
7/21/2011 2 “ “ 8 5 0.0276 1.2
7/22/2011 1 “ “ 12 12 0.1034 2.1
7/25/2011 3 “ “ 12 21.6 0.1131 2.5
7/25/2011 1 “ “ 8.6 17.6 0.1034 57.8
7/25/2011 2 “ “ 12 1.3 0.0138 56.8
N2 4/14/2016 2 Cu (IT) 0.361 100 0.01100 0 4/14/2016 3 “ “ “ 0.01520 “
4/14/2016 4 “ “ “ 0.00705 “
4/14/2016 5 “ “ “ 0.00935 “
4/14/2016 1 W (IT) 0.3 100 0.0160 0 4/14/2016 2 “ “ “ 0.0190 “
4/14/2016 3 “ “ “ 0.0260 “
4/14/2016 4 “ “ “ 0.0230 “
4/14/2016 5 “ “ “ 0.0230 “
4/14/2016 6 Pt (IT) 0.3 100 0.00326 0 4/14/2016 7 “ “ “ 0.01010 “
4/14/2016 8 “ “ “ 0.02620 “
4/14/2016 9 “ “ “ 0.00536 “
4/14/2016 10 “ “ “ 0.00516 “
7/25/2011 2 Pt “ 12 1.3 0.0138 56.8
IT : Tests done with the isolation transformer.
52
______________________________________________________________________________________________________ This publication is available free of charge from
: http://dx.doi.org/10.6028/NIS
T.TN.1902