Embed Size (px)
Citation preview

Unit OneTest Review
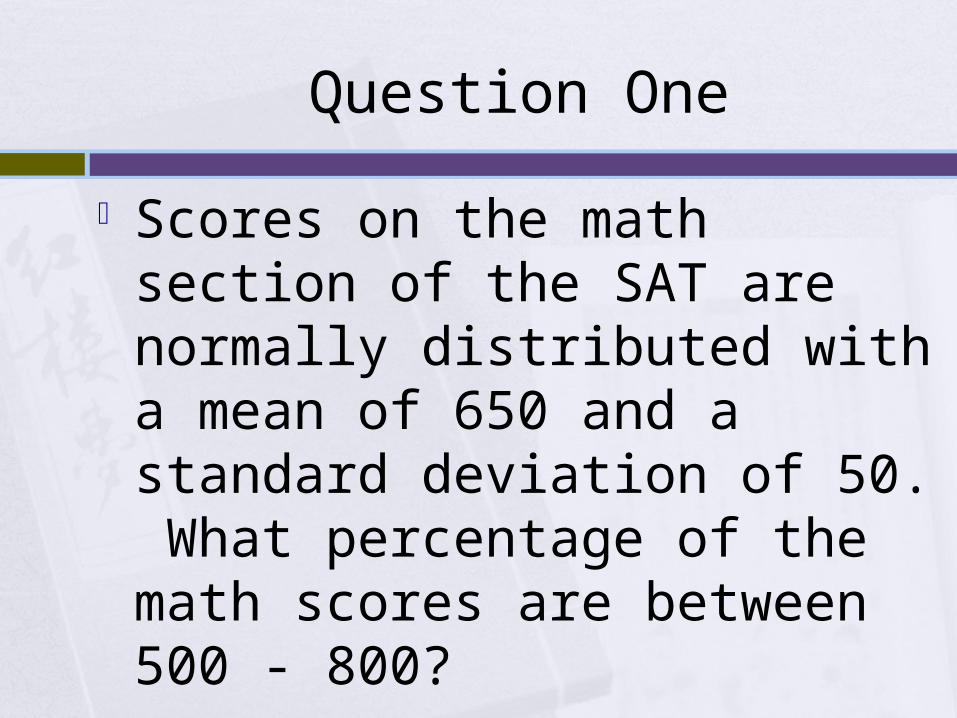
Question One
Scores on the math section of the SAT are normally distributed with a mean of 650 and a standard deviation of 50. What percentage of the math scores are between 500 - 800?
99.7%
Question Two
Weight is normally distributed with a mean of 100 lbs and a standard deviation of 15. What percentage of people fall between 70 - 100?
47.75%
Question Three
Scores on the Social Studies section of the GHSGT are normally distributed with a mean of 210 and a standard deviation of 20. What is the percent of social studies scores that fall between 190 - 270?
84%

Question Four
Soccer goals by year are normally distributed with a mean of 55 and a standard deviation of 3. Find the z-score for 50.
-1.67
Question Five
Juan’s grades are normally distributed with a mean of 78 with a standard deviation of 5. What is the z-score for 85?
1.40
Question Six
The temperatures for September are normally distributed with a mean of 94º and standard deviation of 2º. What is the z-score for 91º?
-1.50
Question Seven
Snowfall in January is normally distributed with a mean of 4.5” and a standard deviation of .5”. What percent of the data is below 5.1”?
88.49%
Question Eight
Love Poems in Mr. Kirkpatrick’s mailbox average 7 per day with a standard deviation of 2. What percent of the data is more than 9?
15.87%
Question Nine
Find the percent that gives the following z-score: 1.57
94.18%
Question Ten
Find the percent that gives the following z-score: -.42
33.72%
Question Eleven
Find the z-score that is closest to having the exact percentage of 56%
.15
Question Twelve
Find the z-score that is closest to having the exact percentage of 21%
-.81
Question Thirteen
What are the two z-scores that contain middle 30% of the data?
-.39, .39
Question Fourteen
What are the two z-scores that contain middle 80% of the data?
-1.28, 1.28
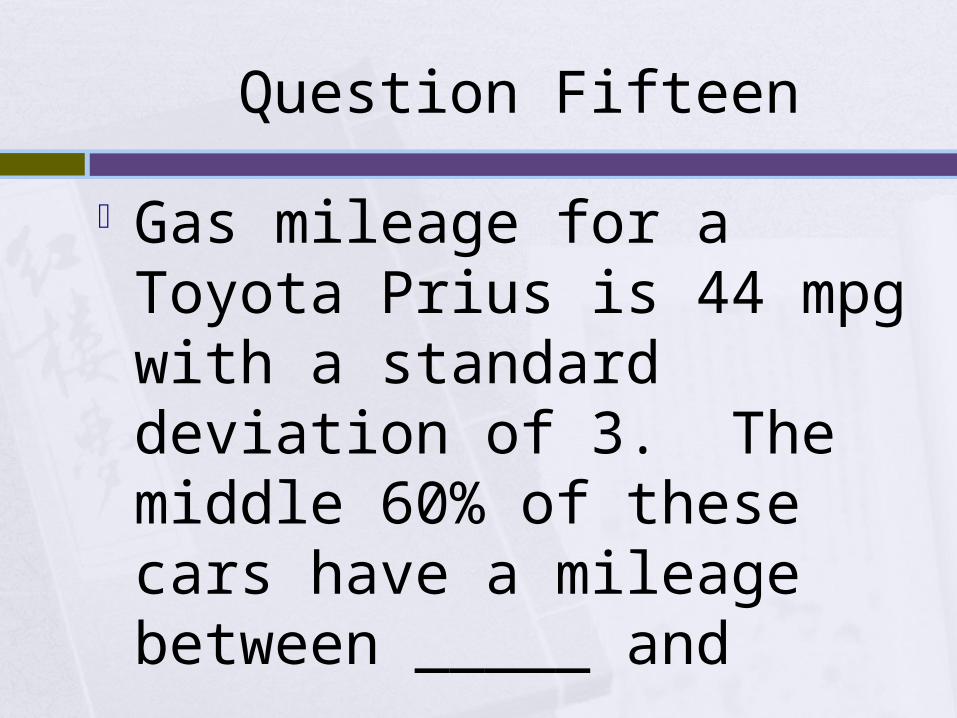
Question Fifteen
Gas mileage for a Toyota Prius is 44 mpg with a standard deviation of 3. The middle 60% of these cars have a mileage between _____ and _____.
41.5, 46.5
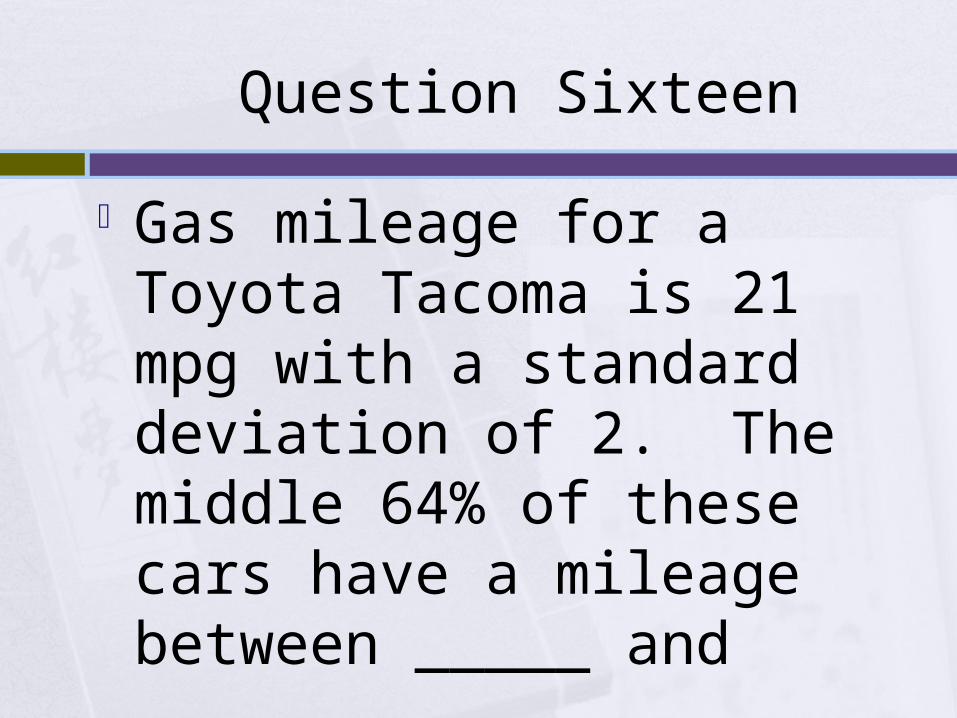
Question Sixteen
Gas mileage for a Toyota Tacoma is 21 mpg with a standard deviation of 2. The middle 64% of these cars have a mileage between _____ and _____.
19.2, 22.8
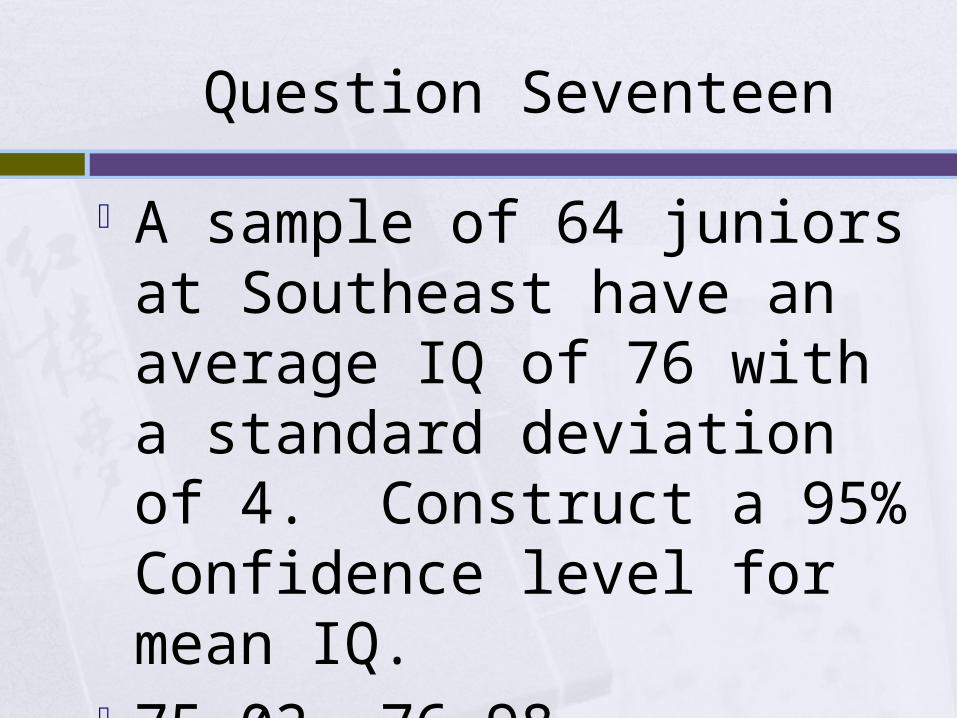
Question Seventeen
A sample of 64 juniors at Southeast have an average IQ of 76 with a standard deviation of 4. Construct a 95% Confidence level for mean IQ.
75.02, 76.98
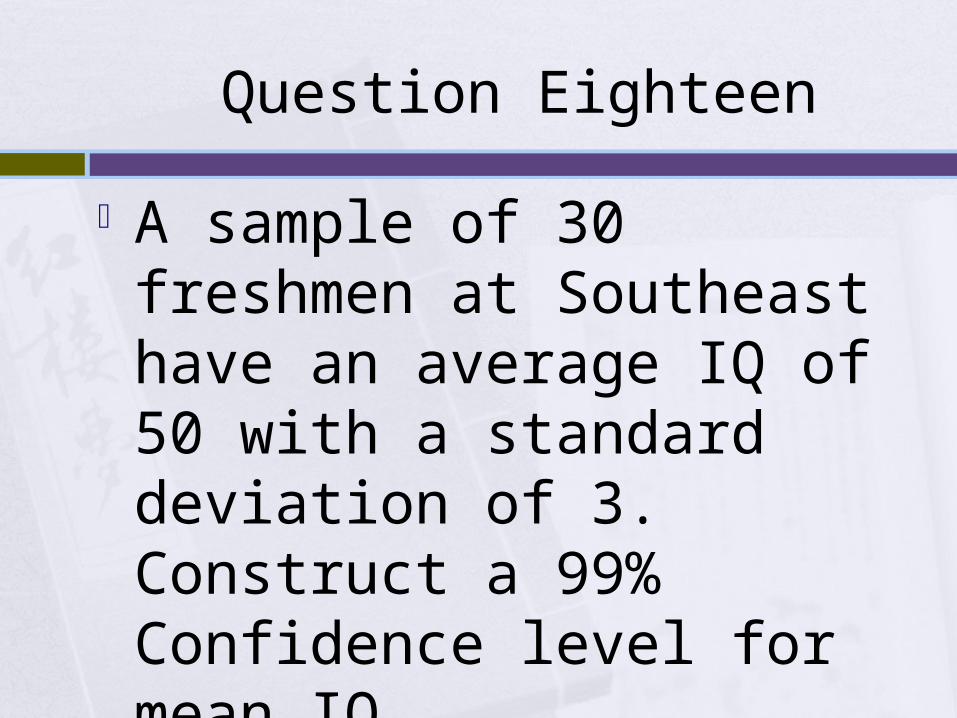
Question Eighteen
A sample of 30 freshmen at Southeast have an average IQ of 50 with a standard deviation of 3. Construct a 99% Confidence level for mean IQ.
48.59, 51.41
Question Nineteen
A recent study was conducted at Southeast High School to examine who was the most loved teacher. Of the 30 students polled, 60% selected Mr. Kirkpatrick. Construct a 95% Confidence Interval for the population percentage for Mr. Kirkpatrick.
42.6%, 77.4%
Question Twenty
A recent study was conducted at Southeast High School to examine who was the most hated teacher. Of the 50 students polled, 85% selected Mr. Appelman. Construct a 99% Confidence Interval for the population percentage for Mr. Appelman.
72.1%, 97.9%