Embed Size (px)
Citation preview
Testimony Concerning the Severe Market Disruption on May 6, 2010
Mary L. Schapiro Chairman
U.S. Securities and Exchange Commission
Before the Subcommittee on Capital Markets, Insurance and Government Sponsored Enterprises of the United States House of Representatives Committee on
Financial Services
May 11, 2010
I. Introduction
Chairman Kanjorski, Ranking Member Garrett, and Members of the Subcommittee: I appreciate the opportunity to testify concerning the severe market disruption that occurred on May 6, 2010.1 The sudden evaporation of meaningful prices for many major exchange-listed stocks in the middle of a trading day is unacceptable and clearly contrary to the vital policy objective of maintaining fair and orderly financial markets. This event directly impacted the many who traded in that interval and undermined confidence in the integrity of the financial markets. My testimony first will summarize the events on May 6 using the best information that is available at this point. Next, it will give an overview of the current market structure for the U.S.-listed securities, including the national market system and Regulation NMS, the highly automated nature of trading in today’s markets, and the market-wide circuit breakers and other individual market “time out” mechanisms designed to address difficult trading conditions. Finally, I will discuss various regulatory tools that need to be considered in determining how best to maintain fair and orderly financial markets and to prevent severe market disruptions in the future.
II. Summary of Events on May 6, 2010
A. Chronology of Trading
On Thursday May 6, the stock markets had spent much of the morning and early afternoon in moderately negative territory, with the Dow Jones Industrial Average (“DJIA”) declining 161 points, or approximately 1.5 percent, by 2:00 p.m. (ET). Concerns over the financial situation in Greece, uncertainty concerning elections in the United Kingdom, and an upcoming jobs report, among other things, hung over the 1 My testimony is on my own behalf, as Chairman of the SEC. The Commission has not voted on this testimony.
market. Shortly after 2:30 p.m., however, the market decline began to steepen and, by 2:42 p.m., the DJIA was at 10,445.84, representing a decline of approximately 3.9 percent. The DJIA then suddenly dropped an additional 573.27 points, representing an additional 5.49 percent decline, in just the next five minutes of trading, hitting 9,872.57 at 2:47 p.m., for a total drop of 9.16 percent from the previous day’s close (which, as discussed below, was not sufficient to trigger a circuit breaker trading halt).
Our preliminary analysis shows that this precipitous decline in stocks (and the
subsequent recovery) followed very closely the drop (and recovery) in the value of the E-mini S&P 500 future (which tracks the normal relationship between futures and stock prices for the broader market). Similar declines were seen in stock market indexes other than the DJIA, such as the S&P 500 Index. In addition, the CBOE Volatility Index (“VIX”), a widely followed measure of market volatility sometimes known as the “fear index,” climbed above 40, a level not reached in over a year.
As quickly as the market dropped, it suddenly and dramatically reversed itself,
recovering 543 points in approximately a minute and a half, to 10,415.65. By 3:00 p.m., the total daily decline in the DJIA had been reduced to 463.05 points (4.26 percent). The DJIA ended the day at 10,520.32, down a total of 347.80, or 3.20 percent, from the prior day’s close. This represented a significant down day for the markets, but the closing numbers belied the market’s dramatic moves down and then up during approximately 20 minutes of trading in the mid-afternoon. In addition, as has been widely reported in the press, many individual securities experienced much larger swings in their trading activity. For example, two DJIA components – Procter & Gamble and 3M – experienced declines of approximately 37 percent and 21 percent, respectively. In addition, certain stocks were executed at absurdly low prices, such as one stock which opened above $40, was traded at one point at a penny, and then closed the day above $40. The charts in Appendix A illustrate the volatility of this activity.
In addition, a large number of registered investment companies known as
Exchange Traded Funds (“ETFs”) traded for short periods of time with massive intraday price swings. The shares of more than 25 percent of all ETFs experienced temporary price declines of more than 50 percent from their 2 p.m. market prices. One large ETF sponsor reported to us that 14 of its domestic stock ETFs experienced executions of $.15 or less per share (including five ETFs that had executions of one cent or less) while also observing that its domestic bond and international ETFs appeared to execute at reasonable prices. We are continuing to examine information about bond and international ETFs against the broader market of ETFs. Of the domestic equity ETFs affected, however, the impact appeared not to discriminate among asset categories or investment objectives.
B. Cancellation of Clearly Erroneous Trades
As the markets closed on May 6, officials from each of the equity markets, pursuant to exchange rules, worked out a common standard to cancel trades that were effected at prices that were sharply divergent from prevailing market prices (so-called
2

“clearly erroneous” trades). The exchanges determined to cancel any trades effected from 2:40 p.m. to 3:00 p.m. at prices 60 percent away from the last trade at or before 2:40 p.m. We understand that transactions in 286 different equity securities were canceled in this manner. In addition, on Friday May 7, several options exchanges similarly decided to cancel certain options trades from the afternoon of May 6.
A significant number of broken trades were in the shares of ETFs for reasons that
are still unclear. These funds are hybrids – they are mutual funds that have shares that trade throughout the day like ordinary stocks. ETF sponsors reported to us that, internally, they experienced no significant problems in managing the funds last Thursday. Stability had returned to the market by the 4 p.m. market close and, as a result, these funds were able to calculate their net asset values based on the market prices of the securities in their portfolios as required by our rules. From the viewpoint of the funds, they saw nothing out of the ordinary or unusual compared to any other day in computing their end-of-day net asset values.
C. Evaluation of Trading
The Commission is committed to understanding fully and exactly what occurred
on the afternoon of May 6, and has been hard at work investigating and analyzing the events of that day. We believe it is critical to understand the causes and effects of this event so that we can work to ensure that it does not occur again. Throughout this time, the Commission and its staff have been in close and continuous contact with the CFTC and other federal agencies, as well as the larger national securities exchanges, FINRA, and clearing organizations. In addition, we have been in contact with a wide variety of market participants, including broker-dealers, proprietary trading firms, and asset managers. We have obtained extensive data from the exchanges and other market participants and are in the process of analyzing that data to ascertain the triggers and impacts of trading that day.
The Commission also has been in close contact with our foreign counterparts.
Some of our counterparts have circuit breaker-like market intervention mechanisms linked to our own and others have market intervention mechanisms that halt trading on specific securities affected by unexpected market volatility. This coordination will continue as we seek information on specific trades or events that may have precipitated any problems.
At this point, our investigation is in the early stages, though we recognize the
pressing need to move rapidly. The various regulatory authorities are making substantial progress in analyzing last Thursday’s trading and sifting through the voluminous trading records involved (including more than 17 million trades in listed equities between 2 p.m. and 3 p.m. alone). We hope to be able to provide investors and the public with more information soon on the events that may have contributed to this volatility, but we should recognize that it will take time to fully analyze the data.2 Although developments in the 2 When regulators and the markets sought to analyze the extraordinary volatility in the October 1987 Market Break, it required several months to identify key elements of that event.
3

markets and in technology may help speed access to market data, they also greatly complicate our efforts to analyze the complex web of trading arrangements and market dynamics that have developed since 1987. For example, the key day in the 1987 Market Break Study involved a trading session processing a little over 600 million shares in NYSE stocks. Last Thursday, the markets processed 10.3 billion shares in NYSE stocks alone.
In addition, the interconnections among markets and among equity securities and
derivatives have grown immensely more complex over the past few years. Orders in one stock directed to one market can now ricochet to other markets and trigger algorithmic executions in other stocks and derivatives in milliseconds. By contrast, in 1987, investigations could focus their attention on discrete transactions largely effected on only one or two markets.
Nevertheless, we are dedicating significant personnel and information technology
resources to addressing the issue. Even as our investigation into this matter continues, we can provide some preliminary findings on the turbulent trading on May 6. At this point, we are unable to point to a single event which could be the sole cause. We can, however, address some common reports that have circulated about the events of May 6.
“Fat Finger”: There have been reports in the press about a “fat-finger” error
where, it is hypothesized, an order of billions of shares was entered, rather than an intended order of millions of shares. While we cannot yet definitely rule that possibility out, neither our review nor reviews by the relevant exchanges and market participants have uncovered such an error.
Procter & Gamble: In addition, there have been reports that one or more
exceptionally large orders in the stock of Procter & Gamble may have preceded and helped to trigger the broader market decline. There does not appear to have been any prior unusual trading in Procter & Gamble that would have triggered the broader market decline.
E-Mini S&P 500 Future: Another focus has been the role of the E-mini S&P
500 future in leading the market decline and recovery. To a great extent, this concern merely reflects a basic fact of market dynamics – much of the price discovery for the broader stock market occurs in the futures markets. Those who believe that the broader market is overpriced (or underpriced) often will first sell (buy) futures for a broad market index rather than sell (buy) the individual stocks that make up that index. Moreover, many arbitrage traders study the relationship between futures prices and stocks prices. If they see a decline (rise) in the price of the futures compared to the price of the stocks, they will sell (buy) the underlying stocks in expectation that the stock prices quickly will follow the futures price. Indeed, this type of activity helps assure that stock prices will closely follow futures prices up or down.
4

Accordingly, given that the E-mini S&P 500 futures price fell by more than 5 percent in a few minutes and then quickly recovered all of the 5 percent decline, it should be no surprise that the broader stock market indexes showed similarly fast and similarly large declines and recoveries. It must be recognized, however, that the fact that stocks prices follow futures prices chronologically does not demonstrate what may have triggered the price movements. The triggering factor may have been an event in the futures market (such as an exceptionally large order), but it could have as readily been events or anomalous activities in individual stocks that caused someone to trade first in the futures markets.
Hacker or Terrorist Activity: At this time, we have not identified any
information consistent with computer hacker or terrorist activity. I would also note that staff from our Enforcement Division are fully integrated in our review of the events of May 6 and will recommend appropriate action if they identify any activity that violates the securities laws.
Ultimately, we may learn that the extraordinary disruption in trading, however it
may have been triggered, was the result of a confluence of events which, taken together, exacerbated what already had been a down day and led to an extraordinarily steep price drop and recovery. However, we are not prepared at this time to draw that conclusion. Of particular concern with respect to securities market structure is why many individual stocks were affected so much more than the broader market. We address some of these issues below.
1. Absence of Professional Liquidity Providers
Most significantly, it appears that some professional liquidity providers3
temporarily did not participate in the market on the buy side in many stocks that suffered particularly egregious price declines, whether because of an intentional decision to withdraw or because of specific market practices. Some types of professional liquidity providers have “affirmative” obligations to provide liquidity whether the market is up or down, as well as “negative” obligations not to take liquidity in ways that would destabilize the markets. Other professional liquidity providers do not have such responsibilities, including some of the high frequency proprietary trading firms that also are discussed below. There is evidence that some firms that had previously been active participants in the markets withdrew their liquidity after prices declined rapidly. These firms may have acted appropriately under current rules, as a firm’s risk models may have concluded that the action in the market presented too substantial a risk. As discussed below, however, we are looking at the data and considering the types of obligations that should apply to certain liquidity providers.
3 Professional liquidity providers are proprietary traders in the business of providing liquidity to the market, often through the submission of limit orders that rest on the electronic order books of exchanges and other trading venues. They include registered entities, such as exchange specialists and market makers, as well as unregistered proprietary trading firms that engage in passive market making and other types of trading strategies.
5

2. Disparate Exchange Practices
The decline in the market on May 6 also focused attention on disparate exchange practices for dealing with major price movements and other unusual trading conditions. One of these is the NYSE’s mechanism for “liquidity replenishment points” (“LRPs”). The NYSE utilizes a hybrid floor/electronic trading model, unlike most other markets today which are fully electronic. There are disagreements regarding whether the one model performed better than another in these circumstances.
Although the ultimate answer to that question requires additional study and
analysis, it is useful to describe the effect a certain feature of the NYSE had on market movements that day. In attempting to meld the traditional open-outcry floor-based auction model with today’s technology, the NYSE’s trading system utilizes what are known as “liquidity replenishment points,” or LRPs. LRPs are best thought of as a “speed bump” and are intended to dampen volatility in a given stock by temporarily converting from an automated market to a manual auction market when a price movement of sufficient size is reached. In such a case, trading on the NYSE in that stock will “go slow” and pause for a time period to allow the Designated Market Maker to solicit additional liquidity before returning to an automated market. This “speed bump” occurs even when there may be additional interest beyond the LRP price point.
On days of major market volatility such as May 6, stocks with significant and
continual declines may frequently cause NYSE trading to go slow for many different stocks. Some have suggested that this practice caused a net loss of liquidity as orders were routed to other markets still offering automated executions. Others believe that the LRP mechanism served to attract additional liquidity that helped soak up some of the excess selling interest. We are focusing on whether the disparity in exchange practices can be addressed to promote more consistency in how orders are handled in the context of rapidly changing prices without undermining the benefits of individual market practices.
Another disparate exchange practice that occurred on May 6 is the use by certain
exchanges of the “self-help” mechanism under Regulation NMS. When an exchange believes that another exchange is experiencing systems problems, the “trade-through” rule under Regulation NMS (described in section III below) permits the exchange to declare what is called “self-help” against the other exchange. This allows the exchange to exclude the quotations of the other exchange from its determination of whether the other exchange has a better “protected” price to which it must route orders for execution.
On the afternoon of May 6, just prior to the steep market decline, two stock
exchanges declared self-help against another exchange, thereby excluding its quotations (and liquidity) from the two exchanges’ routing tables. The excluded exchange has asserted that it did not experience systems problems that would warrant the declaration of self-help. We are investigating these issues and whether there needs to be greater consistency in exchange practices with respect to the self-help mechanism.
6
3. Other Factors
A variety of other factors likely contributed to or potentially exacerbated the events of May 6, but should not necessarily be considered problems that “caused” the severe market disruption. For example, many of the securities that were subject to trade cancellations were thinly-traded, including certain illiquid exchange-traded funds and preferred stocks. For such illiquid securities, a large order or influx of orders easily can soak up available liquidity across the market, resulting in an order, particularly if it is a market order, breaking through many price levels in an effort to obtain an execution at any price. A market order is an order to buy or sell a stock at the best available current price. Market orders do not require an execution at a specific price or price range. With market orders, the order submitted generally is assured an execution; however, there is no limit on what the execution price can be. This contrasts with limit orders, which are submitted with a specified limit price. Limit orders guard against executions at prices at which the order submitter is not willing to trade, though the trade-off is that the order may not be executed if the market suddenly moves away from the suggested limit price.
In addition, the effect of market orders on prices may have been further
exacerbated on May 6 by the use of stop loss market orders. These orders turn into market orders when the stop price of the order is reached. When an investor places a stop loss market order, the investor is instructing the broker to sell a stock at the market if it falls to a certain price. In a normal market, where liquidity exists as the stock price goes up or down, this strategy can protect an investor from taking a major loss if the stock drops significantly by selling at a predetermined price to minimize the loss. However, on May 6, the use of market orders when stop loss orders were triggered may have led to automated selling that resulted in executions at aberrant prices.
Finally, the absurd result of valuable stocks being executed for a penny likely was
attributable to the use of a practice called “stub quoting.” When a market order is submitted for a stock, if available liquidity has already been taken out, the market order will seek the next available liquidity, regardless of price. When a market maker’s liquidity has been exhausted, or if it is unwilling to provide liquidity, it may at that time submit what is called a stub quote – for example, an offer to buy a given stock at a penny. A stub quote is essentially a place holder quote because that quote would never – it is thought – be reached. When a market order is seeking liquidity and the only liquidity available is a penny-priced stub quote, the market order, by its terms, will execute against the stub quote. In this respect, automated trading systems will follow their coded logic regardless of outcome, while human involvement likely would have prevented these orders from executing at absurd prices. As noted below, we are reviewing the practice of displaying stub quotes that are never intended to be executed.
4. Initial Next Steps
Given the unusual trading activity, the Commission is taking a number of steps to
identify the causes and contributing factors, and to take near term and long terms steps to help prevent a recurrence.
7
Yesterday, I met here in Washington with the leaders of six markets - New York
Stock Exchange, NASDAQ Stock Market, BATS Exchange, Direct Edge ECN, International Securities Exchange, and Chicago Board Options Exchange - and the Financial Industry Regulatory Authority (“FINRA”), to discuss the causes of Thursday’s market events, the potential contributing factors, and possible market reforms. The meeting was productive and collaborative, and there was a strong consensus that the type of aberrational volatility experienced on May 6 is not appropriate in our markets. At the meeting, we agreed on a structural framework, to be refined over the next day, for strengthening circuit breakers and handling erroneous trades. There was an understanding that solutions must be implemented on a market-wide basis and that the standards applicable to circuit breakers and erroneous trades must be clear to all market participants.
Also, starting yesterday, Commission staff are on-site at all major markets to
monitor trading conditions. In addition, at the Commission’s request, FINRA has established an open phone line to facilitate open and immediate communications among the markets if issues arise. Commission staff will participate in these communications and remain at the ready to coordinate quickly with senior regulatory and industry officials to fashion a rapid response to a developing problem. These types of open conference lines have been utilized during periods of market volatility in the past, and serve to supplement existing intermarket messaging systems that have been in place since the October 1987 Market Break.
III. Overview of U.S. Securities Market Structure
A. The National Market System and Regulation NMS
In Section 11A of the Securities Exchange Act of 1934 (added to the Act in 1975), Congress directed the Commission to facilitate the establishment of a national market system for securities in accordance with specified findings and objectives. Congress recognized that the securities markets are an important national asset that must be preserved and strengthened, and that new data processing and communications techniques create the opportunity for more efficient and effective market operations. It mandated a national market system composed of multiple competing markets that are linked through technology. A national market system should be contrasted with a structure in which trading is confined to a single trading venue, such as one particular exchange. Congress determined that promoting competition among trading venues and giving as many market makers as possible an opportunity to provide liquidity in stocks would promote greater liquidity and price continuity than a single dominant trading venue. Over the years, the Commission has sought to keep market structure rules up-to-date with continually changing economic conditions and technology advances. The most recent major updating of the national market system rules occurred in 2005, when the
8
Commission adopted Regulation NMS. Regulation NMS addresses four areas: (1) a “trade-through” rule that prevents the execution of trades at prices that are inferior to a displayed and immediately accessible quotation on another trading venue; (2) an “access” rule that, among other things, promotes private linkages among market participants and trading venues; (3) a “sub-penny” rule that prohibits the display, ranking, or accepting of orders with sub-penny prices; and (4) amendments to the joint-industry plans for collecting and distributing consolidated market data to the public. The trade-through rule is probably the most well-known aspect of Regulation NMS and arguably has affected the markets most significantly since it was adopted in 2005. The Regulation NMS trade-through rule eliminated a prior rule that benefited dominant exchanges with trading floors by protecting their manual quotations (that is, orders were required to be routed to the exchange in an attempt to access a manual quotation that could take as long as 10-20 seconds, rather than to another venue with an immediately accessible quotation at an inferior price). To compete under the new regulatory structure, all exchanges developed electronic systems that are capable of providing immediate responses to incoming orders and updating their quotations immediately. These systems enable the exchanges to display quotations that are protected against trade-throughs. Trade-through protection was designed to promote best execution and price stability by preventing one trading venue from ignoring the immediately accessible quotations of another trading venue in a downturn (as well as upturn). The trade-through rule does not protect a trading venue’s quotation if it is not immediately accessible, which, as discussed further below, is the case with the quotations displayed by the NYSE when it hits an LRP.
B. The Nature of Trading in the Current Market Structure
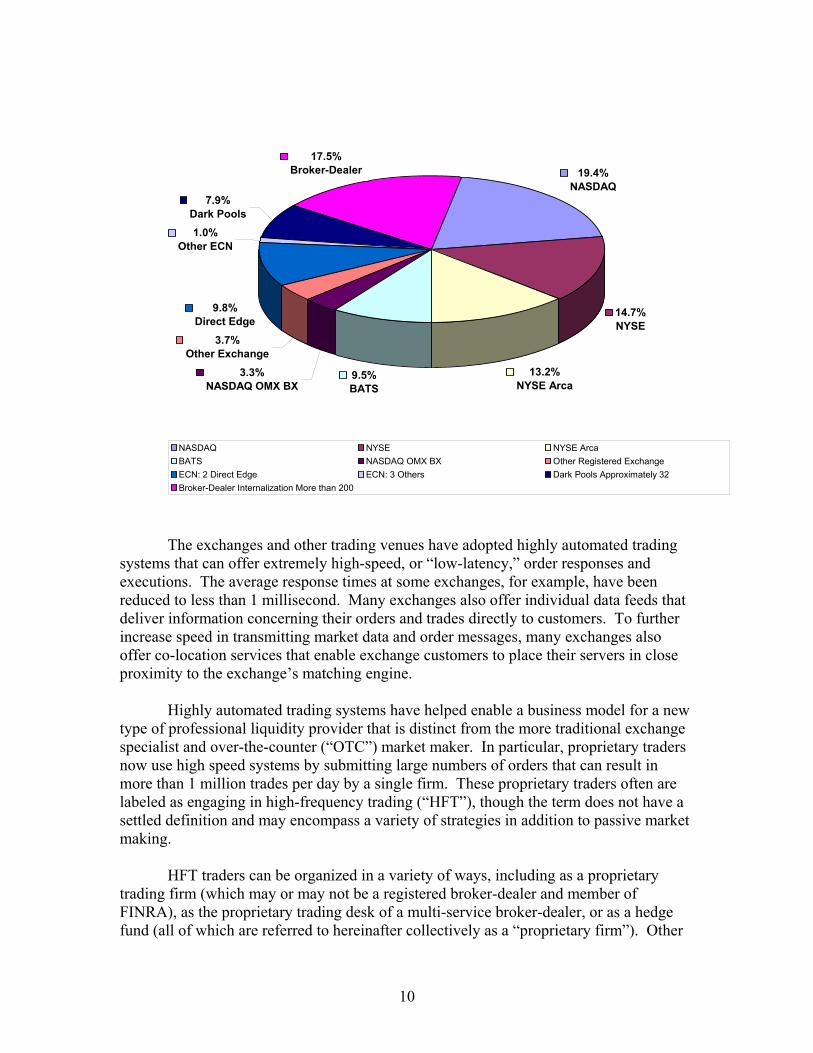
At least partly as a result of Regulation NMS, trading in U.S.-listed stocks has changed dramatically in recent years. Trading volume now is dispersed among many different trading venues. For example, the share of the New York Stock Exchange in the trading in NYSE-listed stocks declined from 79.1 percent in 2005 to 25.1 percent in 2009. Nevertheless, more than 70 percent of volume continues to be executed by public trading venues that display quotations across a wide range of U.S-listed stocks. Figure 1 below sets forth the major types of trading venues, along with estimates of their trading volume in September 2009:4
Figure 1
Trading Centers and Estimated Percentage of Share Volume in NMS Stocks September 2009
4 Sources of estimated trading volume percentages: NASDAQ; NYSE Group; BATS; Direct Edge; data compiled from Forms ATS for 3d quarter 2009.
9
1.0%Other ECN
7.9%Dark Pools
9.8%Direct Edge
3.7%Other Exchange
3.3%NASDAQ OMX BX
9.5%BATS
13.2%NYSE Arca
17.5%Broker-Dealer 19.4%
NASDAQ
14.7%NYSE
NASDAQ NYSE NYSE ArcaBATS NASDAQ OMX BX Other Registered ExchangeECN: 2 Direct Edge ECN: 3 Others Dark Pools Approximately 32Broker-Dealer Internalization More than 200
The exchanges and other trading venues have adopted highly automated trading systems that can offer extremely high-speed, or “low-latency,” order responses and executions. The average response times at some exchanges, for example, have been reduced to less than 1 millisecond. Many exchanges also offer individual data feeds that deliver information concerning their orders and trades directly to customers. To further increase speed in transmitting market data and order messages, many exchanges also offer co-location services that enable exchange customers to place their servers in close proximity to the exchange’s matching engine. Highly automated trading systems have helped enable a business model for a new type of professional liquidity provider that is distinct from the more traditional exchange specialist and over-the-counter (“OTC”) market maker. In particular, proprietary traders now use high speed systems by submitting large numbers of orders that can result in more than 1 million trades per day by a single firm. These proprietary traders often are labeled as engaging in high-frequency trading (“HFT”), though the term does not have a settled definition and may encompass a variety of strategies in addition to passive market making. HFT traders can be organized in a variety of ways, including as a proprietary trading firm (which may or may not be a registered broker-dealer and member of FINRA), as the proprietary trading desk of a multi-service broker-dealer, or as a hedge fund (all of which are referred to hereinafter collectively as a “proprietary firm”). Other
10
characteristics often attributed to proprietary firms engaged in HFT are: (1) the use of extraordinarily high-speed and sophisticated computer programs for generating, routing, and executing orders; (2) use of co-location services and individual data feeds offered by exchanges and others to minimize network and other types of latencies; (3) very short time-frames for establishing and liquidating positions; (4) the submission of numerous orders that are cancelled shortly after submission; and (5) ending the trading day in as close to a flat position as possible (that is, not carrying significant, unhedged positions over-night). Given the competitive pressures to maximize their speed of trading, HFT firms typically will attempt to streamline the code for their trading algorithms. However, every check and filter in that code reduces its speed, creating a tension. HFT is one of the most significant market structure developments in recent years. Estimates of HFT volume in the equity markets vary widely, though they often are 50 percent of total volume or higher. By any measure, HFT is a dominant component of the current market structure and is likely to affect nearly all aspects of its performance.
C. Intermarket Circuit Breakers and Time Out Mechanisms of Individual Trading Venues
One aspect of the current market structure that pre-dates Regulation NMS is the intermarket circuit breakers that apply across all trading venues in the national market system. The only intermarket circuit breakers for stocks are established in NYSE Rule 80B, though all securities trading venues have agreed to halt trading in accordance with the provisions of NYSE Rule 80B. In addition, the futures markets have agreed to halt trading in equity securities-related futures in accordance with the provisions of NYSE Rule 80B. Rule 80B establishes a very broad mechanism that is based on the 30 stocks of the DJIA. It is not currently triggered by the trading in any individual stock. The numerical triggers for NYSE Rule 80B last were updated in 1998 and apply at three levels of price decline – 10 percent, 20 percent, and 30 percent. The first triggering point is a 10 percent decline in the DJIA from its closing value on the previous trading day. If the decline occurs before 2:00 p.m. Eastern time, all trading venues will halt trading for one hour in all stocks, security options, and securities-related futures. If the decline occurs between 2:00 p.m. and 2:30 p.m., trading is halted for 30 minutes. If the 10 percent decline occurs after 2:30 p.m., trading is not halted unless a decline reaches the second level of 20 percent. If a decline reaches 20 percent before 1:00 p.m., trading is halted for two hours. If it occurs between 1:00 p.m. and 2:00 p.m., trading is halted for one hour. If a 20 percent decline occurs after 2:00 p.m., trading is halted for the remainder of the day. Finally, if a decline in the value of the DJIA reaches 30 percent at any time, trading is halted for the rest of the day. Notably, none of the NYSE Rule 80B thresholds was triggered on May 6, despite the severe disruption in trading in many stocks. This issue is addressed below in the
11
context of potential regulatory initiatives to prevent severe market disruptions in the future. Separate and apart from the intermarket circuit breakers established in NYSE Rule 80B, trading venues can establish their own “time out” mechanisms designed to address significant price movements. These time out mechanisms can be more (but not less) restrictive than those in NYSE Rule 80B. An example of such a time out mechanism is the LRP mechanism established solely for the NYSE by its Rule 1000. The LRP mechanism applies at the level of individual stocks, and the thresholds for triggering the mechanism vary by type of stock. In general, however, an LRP is triggered by price declines in the range of 1-3 percent that occur within a 30-second time period. When triggered, the NYSE will display a “non-firm” quotation that cannot be accessed by incoming orders and therefore is not protected against trade-throughs by other trading venues. In the particular case of price declines, trading venues are entitled to trade at prices lower than the NYSE’s non-firm bid quotation during an LRP mechanism. During the LPR mechanism, the NYSE’s Designated Market Maker for a stock attempts to solicit additional liquidity before returning the NYSE to an automated market.
D. Automated Trading and Severe Market Disruptions
It is important to recognize that severe market disruptions in the form of precipitous price declines are not exclusively associated with automated trading. Disruptions are caused by a glut of sellers willing to trade at any price, combined with the near or total absence of buyers at a particular instant in time (who may themselves be influenced by the wave of sell orders crashing on the market). In these circumstances, prices can decline precipitously, as they did in many stocks on May 6. Severe market disruptions have occurred throughout financial market history in a wide variety of market structures. For example, the U.S. equities markets declined by 22.6 percent on October 19, 1987 in a market structure that was dominated by a single manual trading venue. More recently, of course, and particularly since the implementation of Regulation NMS, the U.S.-listed equity markets have become much more automated and much faster. Nevertheless, they generally were able to continue operating smoothly even through the global financial crisis that reached a peak during the autumn of 2008. Accordingly, the inability of the equity markets to maintain fair and orderly trading in many stocks on May 6 is profoundly disappointing and troubling.
IV. Potential Regulatory Responses To the extent there was anything positive in the events of May 6, it was that the markets proved to be resilient and recovered quickly. Nevertheless, such a severe market disruption harms investors and the markets generally. First, it harms those investors who may have traded at erroneous prices. For example, many investors use stop loss orders that are triggered by significant price moves and can liquidate positions at very unfavorable prices. Other investors may see a precipitous price decline and initiate new
12
orders to sell to minimize losses. These new orders likewise may liquidate positions at very unfavorable prices for the investor. Some of these trades may be cancelled and some may not. But even for trades that are cancelled, they may cause losses for those investors and traders who stepped in and bought during the midst of a severe price decline. These investors and traders accepted the risk of a market meltdown and significant losses, but, if their trades are cancelled, were not rewarded for their willingness to buy when everyone else was selling. Finally and more generally, such disruptive price movements undermine the confidence of investors in the integrity and fairness of the securities markets. If investors lose such confidence, the securities markets will no longer be able to perform their essential function of supporting capital formation and the general economic welfare. In response to the global economic crisis and evolving market practices, the Commission had already undertaken a number of initiatives to strengthen the integrity our markets, even before the events of May 6. In February, for example, the Commission adopted a short sale circuit breaker. That rule is designed to limit short selling where an individual stock is under stress and has experienced a decline of 10 percent from the previous day’s close. At that point, the restrictions of the rule provide assurances to investors that short sellers are not taking the stock down. In so doing, we believe that the rule will promote investor confidence.
The market events of last Thursday add greater urgency for the Commission to
vigorously pursue a number of meaningful initiatives to promote investor confidence in the integrity and fairness of the securities markets, including a number of proposals already underway. I first will address additional initiatives relating to time out mechanisms, destabilizing short-term trading strategies, and correction of erroneous trades. I will conclude by noting various initiatives already proposed or soon to be considered that may help address disruptive market conditions.
A. New Initiatives In January, the Commission published a concept release on equity market
structure (“Market Structure Concept Release”) that highlighted many aspects of today’s highly automated markets and requested public comment on a wide variety of issues. The Market Structure Concept Release was designed to further the Commission’s broad review of market structure to assess whether its rules have kept pace with, among other things, changes in trading technology and practices.
The events of May 6 implicate a number of issues raised in the Market Structure
Concept Release. For example, it asked whether the current market structure appropriately minimizes the short-term volatility that can be so harmful to long-term investors. It asked whether the relatively good performance of the market structure in 2008 indicated that systemic risk was appropriately minimized in the current market structure and, if not, what further steps the Commission should take to address systemic risk. Finally, it noted the dominant role of HFT firms in today’s market structure and
13

observed that they had largely replaced the role of specialists and market makers with affirmative and negative obligations for market quality. More specifically, the Market Structure Concept Release asked whether there is any evidence that proprietary firms increase or reduce the amount of liquidity provided to the market during times of stress. It also discussed various types of short-term trading strategies, including “directional” strategies, such as “momentum ignition,” that could present serious problems in today’s market structure by exacerbating short-term volatility.
The public comment period on the Market Structure Concept Release ended on
April 21. The Commission has received more than 100 comment letters reflecting a broad range of perspectives. Many of the letters set forth detailed views on very complex issues, and the Commission continues to review them carefully. To follow up, the Commission intends to host a public roundtable in the next couple of weeks to probe more deeply into these market structure issues.
In addition, the Commission has published a series of concrete market structure
proposals that are designed to strengthen the U.S. securities markets and to protect investors. These include the proposal to prohibit flash orders and the proposal to increase the transparency of “dark” pools of liquidity, as well as the market access proposal (discussed below) to strengthen broker-dealer risk management controls and the large trader reporting proposal (also discussed below) to enhance the Commission’s surveillance and enforcement capabilities.
The events of May 6 demonstrate the urgency and importance of these efforts and
provide a valuable concrete example of how the market structure performed under particularly stressful conditions. As such, they highlight particular regulatory steps that warrant close attention in the near future.
1. Time Out and Other Mechanisms to Maintain a Fair and Orderly Market
Most significantly, we must consider what steps would help foster effective
market making and liquidity, including during times of stress. The markets failed many investors on May 6, and I am committed to finding effective solutions in the very near term.
I believe that the full range of potential solutions must be on the table. In
particular, we must consider the various types of “time out” mechanisms that can help maintain a fair and orderly market, both for the broad market and for individual stocks.
For example, we must ask whether the general, market-wide circuit breaker
provisions that currently are on the books (none of which were triggered on May 6) need to be revised. I note that a vitally important element of the market-wide circuit breakers is that they apply across all stock and options trading venues and all venues for trading
14
equity security-related futures, because markets for all equity security-related products are closely linked.
I believe that we also must consider the various types of time out mechanisms that
can be applied to individual stocks. Although the prices of many stocks on May 6 declined in proportion with the broader market decline that occurred in securities and futures index products, the prices of many other individual stocks declined much, much more (before snapping back largely to the prices at which they were trading prior to the precipitous decline). At this point, the root cause of the sudden disappearance of liquidity in many stocks is unclear. One potential explanation is the inherent nature of algorithmic liquidity providers. In today’s highly automated markets, proprietary trading firms provide much liquidity electronically through algorithms that are programmed to respond to events without human intervention. Such algorithms typically are developed by studying historical trading conditions and identifying patterns for profitable trading. Algorithms may be programmed to shut down trading when events no longer line up with the patterns that they are designed to exploit. Stated another way, algorithms may be very effective in adding liquidity in normal trading conditions, but may be inherently ineffective in adding liquidity when dealing with highly unusual events such as occurred on May 6.
Unlike pre-coded algorithms, people have the capacity, flexibility, and creativity
to assess and respond to highly unusual events. Consequently, we must consider whether today’s highly automated markets need additional time out mechanisms to deal with unusual events that may lead to a sudden loss of algorithmic liquidity sufficient to satisfy the demand for liquidity. For example, we are considering whether all trading venues in the national market system should be subject to a requirement to stop trading for a brief period of time on a stock-by-stock basis when prices move beyond normal trading patterns. The time period should be sufficiently long for traders to assess trading conditions (or to assess the operation of algorithms).
In addition to time out mechanisms, we will consider any other steps that
potentially could prevent or help minimize the harm that occurred on May 6. These include: (1) exchange-level erroneous order filters; (2) “collars” on the prices at which market orders or aggressively priced limit orders can be executed; (3) limitations on the size of market orders or aggressively priced limit orders; and (4) eliminating the practice of displaying stub quotes that were never intended to be executed.
2. Destabilizing Short-Term Trading Strategies In addition to focusing on liquidity, we must also consider the sources of the
selling pressure that can suddenly generate such enormous demand for liquidity to buy. What triggered the selling pressure? What types of market participants were selling and what types of trading strategies were they pursuing?
For example, to what extent, if at all, did the wave of selling on May 6 come from
proprietary firms employing “directional” strategies triggered by signals that attempt to
15
exploit short-term price movements? These directional strategies were discussed in the Market Structure Concept Release and include “momentum ignition” strategies that are designed to start and exacerbate price movements. It is too early to know whether short-term professional trading strategies played any role in the events of May 6. If they contributed significantly to the precipitous decline, however, we must consider whether additional regulatory requirements are necessary to prevent such strategies from threatening the fairness and integrity of the markets.
For example, in the past, professional liquidity providers with the best and fastest
access to the markets were charged with affirmative and negative obligations to promote market quality. One of the most significant negative obligations was a restriction on “reaching across the market” to take out quotations and thereby drive prices up or down. Many of the most active and sophisticated traders in today’s market structure are not subject to any obligations with respect to the nature of their trading. If active trading firms exploited their superior trading resources and significantly contributed to the severe price swings on May 6, we must consider whether regulatory action is needed to address the problem.
3. Fair and Consistent Process and Policies for Correcting
Erroneous Trades We also must work with the various exchanges and other trading venues to assure
that the process and policies for dealing with the correction of erroneous trades are fair for investors and consistently applied – both in the context of a single event and across different events. Currently, the threshold level for correcting trades is set by the exchanges on a case-by-case basis. The particular level that is chosen may affect investors and other market participants in profound and varying ways. Obviously, the primary objective should be a market structure that minimizes to the greatest extent possible any need to correct erroneous trades. When necessary, however, the process and policies should be applied in a consistent manner under established rules that are fair to investors.
B. Ongoing Initiatives
1. Market Access Proposal
In January, the Commission proposed a rule that would require effective risk
management controls for broker-dealers with market access, including those providing customers sponsored access to the markets. Our proposal would effectively prohibit the growing practice by some broker-dealers of providing “unfiltered” sponsored access, where a customer is permitted to directly access the markets using the broker-dealer’s market participant identifier but without the imposition of effective pre-trade risk management controls. All broker-dealers accessing the markets should implement controls to effectively manage the risks associated with this activity, and our proposal would unequivocally require them to do so. These risks include the potential breach of a credit or capital limit, the submission of erroneous orders as a result of computer
16
malfunction or human error, and the failure to comply with regulatory requirements. Effective risk management controls for market access are necessary to protect the broker-dealer, the markets, the financial system, and ultimately investors. Such controls would help prevent trading activity that could trigger a severe market disruption. We have received numerous comment letters on our sponsored access proposal and the staff is considering those comments and will soon make a recommendation to the Commission. I expect the Commission to act on this important proposal by this summer.
2. Large Trader Reporting Proposal
Last month, the Commission proposed to create a large trader reporting system
that would enhance our ability to identify large market participants, collect information on their trades, and analyze their trading activity. To keep pace with rapid technological advances that have impacted trading strategies and the ways in which some market participants trade, the Commission must be able to readily identify large traders operating in the U.S. securities markets, and obtain basic identifying information on each large trader, its accounts, and its affiliates. In addition, to support its regulatory and enforcement activities, the Commission must have a mechanism to track efficiently and obtain promptly trading records on large trader activity.
The current system for collecting transaction data from registered broker-dealers
is generally utilized in more narrowly-focused investigations involving trading in particular securities, and is not generally conducive to larger-scale market reconstructions and analyses involving numerous stocks during periods of peak trading volume. In addition, existing tools often require weeks or longer to compile trading data to identify potentially large traders. The Commission’s need to develop the tools necessary to readily identify large traders and be able to evaluate their trading activity is heightened by the fact that large traders, including certain high-frequency traders, are playing an increasingly prominent role in the securities markets.
The proposed rule would enhance the Commission’s ability to identify those
“large trader” market participants that conduct a substantial amount of trading activity in U.S. securities, as measured by volume or market value. In addition, the proposal would facilitate the Commission’s ability to obtain from broker-dealers records of large trader activity. By providing the Commission with prompt access to information about large traders and their trading activity, the proposed rule is intended to facilitate the Commission’s efforts in reconstructing market activity and performing analyses of trading data, as well as assist in investigations of manipulative, abusive, and other illegal trading activity.
3. Consideration of Consolidated Audit Trail Proposal
One of the challenges we face in recreating the events of last Thursday is the
reality that the technologies used for market oversight and surveillance have not kept pace with the technology and trading patterns of the rapidly evolving and expanding securities markets. There are mechanisms already in place to coordinate surveillance
17

18
among markets. For example, the Intermarket Surveillance Group provides a framework for the sharing of information and the coordination of regulatory efforts among exchanges trading securities and related products to address potential intermarket manipulations and trading abuses. However, audit trail requirements vary between markets, resulting in a lack of current, readily accessible securities order and execution data. Today's fast, electronic, and interconnected markets demand a robust consolidated audit trail and execution tracking system.
Since last summer, SEC staff have been working, in consultation with SROs and
others, on a rule proposal that would require the SROs to jointly develop, implement and maintain a consolidated order tracking system, or consolidated audit trail. Within the next few weeks, I expect the Commission to consider this rule proposal, which should result in a continuous reporting mechanism for market participants that would capture the data needed for effective cross-market surveillance. The proposed changes will significantly improve the ability to conduct timely and accurate trading analyses for market reconstructions and complex investigations, as well as inspections and examinations. Indeed, I expect that the proposed consolidated audit trail would result in our ability to access in real time the majority of the data needed to reconstruct the type of market disruption that occurred last week, with remaining information available within a matter of days rather than weeks. A consolidated audit trail would be invaluable to enhance the ability to detect and monitor aberrant and illegal activity across multiple markets, and would greatly benefit investors and help to restore trust in the securities markets.
V. Conclusion
In conclusion, the events of last week are unacceptable. The SEC is engaging in a comprehensive review and will take necessary steps to implement additional safeguards to prevent the type of unusual trading activity that occurred briefly last week. The Commission is considering a number of proposals that will address key issues raised on May 6 and we will move expeditiously to address all issues we determine caused or contributed to those events.
APPENDIX A
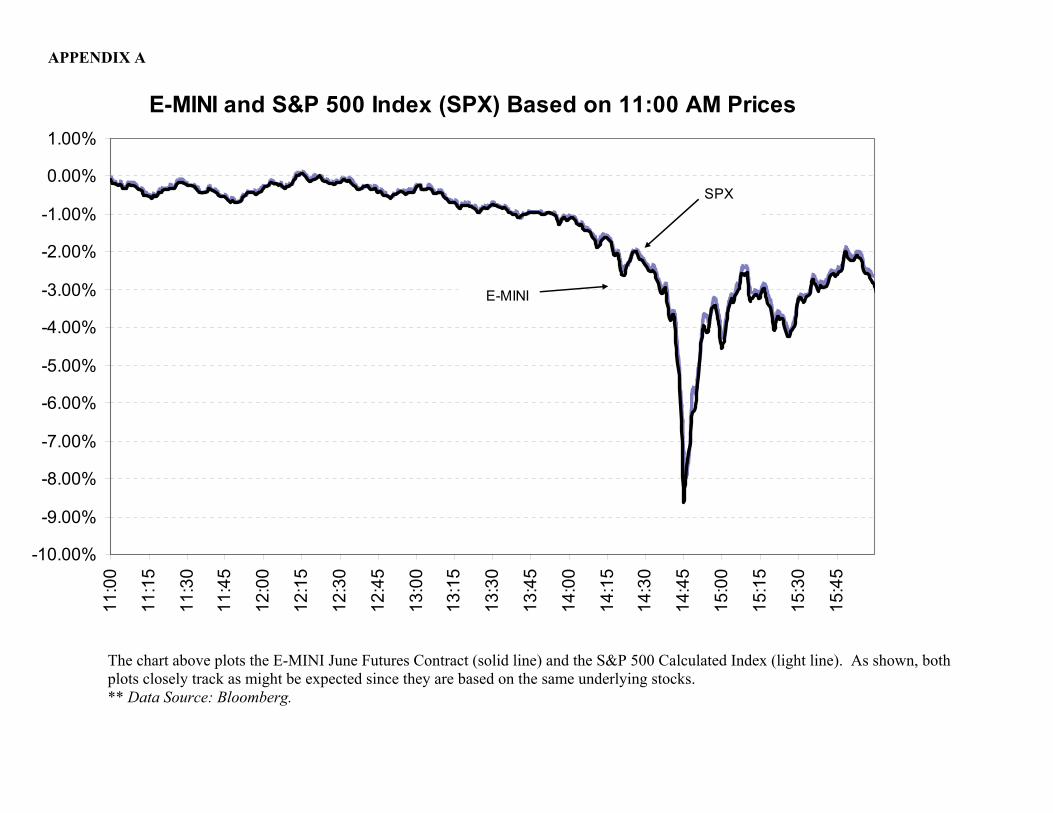
E-MINI and S&P 500 Index (SPX) Based on 11:00 AM Prices
-10.00%
-9.00%
-8.00%
-7.00%
-6.00%
-5.00%
-4.00%
-3.00%
-2.00%
-1.00%
0.00%
1.00%11
:00
11:1
5
11:3
0
11:4
5
12:0
0
12:1
5
12:3
0
12:4
5
13:0
0
13:1
5
13:3
0
13:4
5
14:0
0
14:1
5
14:3
0
14:4
5
15:0
0
15:1
5
15:3
0
15:4
5
SPX
E-MINI
The chart above plots the E-MINI June Futures Contract (solid line) and the S&P 500 Calculated Index (light line). As shown, both plots closely track as might be expected since they are based on the same underlying stocks. ** Data Source: Bloomberg.
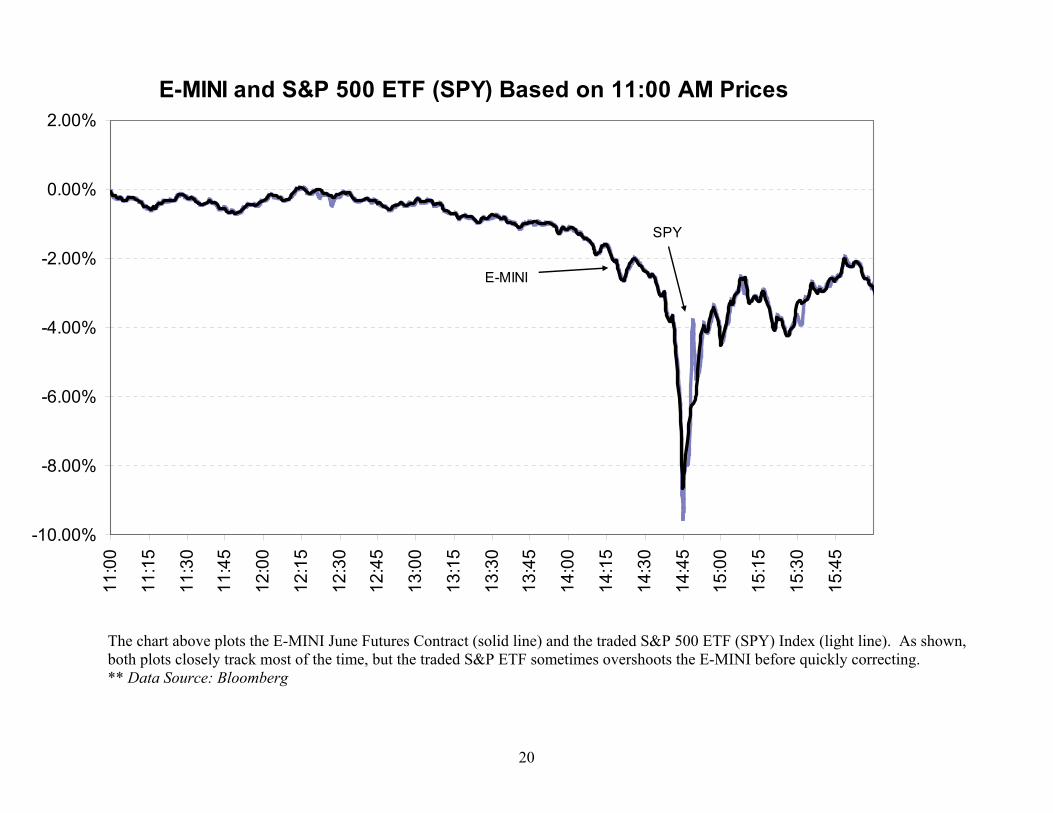
E-MINI and S&P 500 ETF (SPY) Based on 11:00 AM Prices
-10.00%
-8.00%
-6.00%
-4.00%
-2.00%
0.00%
2.00%11
:00
11:1
5
11:3
0
11:4
5
12:0
0
12:1
5
12:3
0
12:4
5
13:0
0
13:1
5
13:3
0
13:4
5
14:0
0
14:1
5
14:3
0
14:4
5
15:0
0
15:1
5
15:3
0
15:4
5
SPY
E-MINI
The chart above plots the E-MINI June Futures Contract (solid line) and the traded S&P 500 ETF (SPY) Index (light line). As shown, both plots closely track most of the time, but the traded S&P ETF sometimes overshoots the E-MINI before quickly correcting. ** Data Source: Bloomberg
20
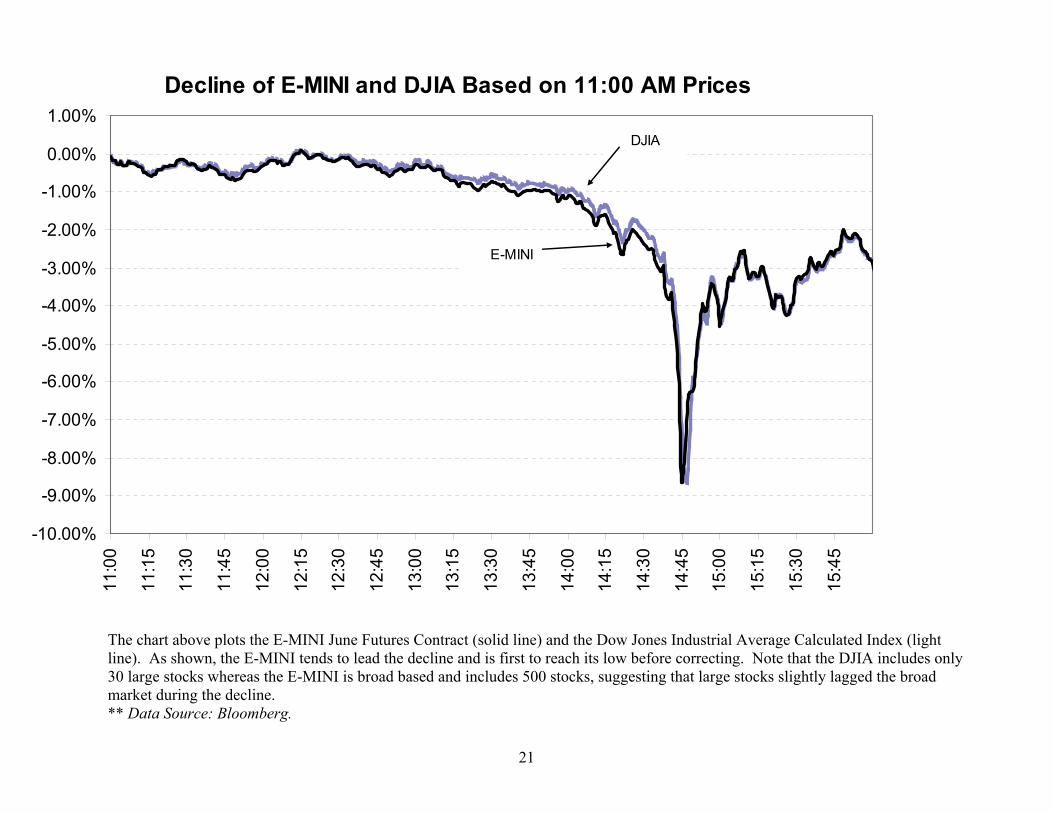
The chart above plots the E-MINI June Futures Contract (solid line) and the Dow Jones Industrial Average Calculated Index (light line). As shown, the E-MINI tends to lead the decline and is first to reach its low before correcting. Note that the DJIA includes only 30 large stocks whereas the E-MINI is broad based and includes 500 stocks, suggesting that large stocks slightly lagged the broad market during the decline.
Decline of E-MINI and DJIA Based on 11:00 AM Prices
-10.00%
-9.00%
-8.00%
-7.00%
-6.00%
-5.00%
-4.00%
-3.00%
-2.00%
-1.00%
0.00%
1.00%11
:00
11:1
5
11:3
0
11:4
5
12:0
0
12:1
5
12:3
0
12:4
5
13:0
0
13:1
5
13:3
0
13:4
5
14:0
0
14:1
5
14:3
0
14:4
5
15:0
0
15:1
5
15:3
0
15:4
5
DJIA
E-MINI
21
** Data Source: Bloomberg.