Embed Size (px)
Citation preview
Testimony on the Massachusetts Milk Price Situation and the Proposed Massachusetts Milk Price
Gouging Law
by
Ronald W. Cotterill, Adam N. Rabinowitz, and Matthew Schwane
Committee on the Environment Massachusetts Legislature
September 4, 2003
Boston, Massachusetts
Food Marketing Policy Center Department of Agricultural and Resource Economics
University of Connecticut Storrs, CT 06269-4021
Tel: (860) 486-2742 Fax: (860) 486-2461
Email: [email protected]
Website: http://www.fmpc.uconn.edu Authors are professor and director, graduate research assistant, and undergraduate summer intern, Food Marketing Policy Center, Dept. of Agricultural and Resource Economics, University of Connecticut, respectively.
ii
Testimony on the Massachusetts Milk Price Situation and the Proposed Massachusetts Milk Price
Gouging Law
Table of Contents List of Charts, Tables, and Figures ................................................................................................iii Text .............................................................................................................................................1 Appendix: New York State Ag and Markets Milk Price Threshold Announcements for
June and September 2003
iii
List of Charts, Tables, and Figures Chart 1. The Impact of the Proposed Massachusetts Milk Price Gouging Law: An
Example for June and September 2003 ...................................................................12 Figure 1. Boston Market Level Retail and Farm Fluid Milk Price, (1/96-9/03) ........................13 Figure 2. Actual Raw Milk, Estimated Wholesale, and Actual Retail Milk Pricing by
Brand for the Four Leading Supermarket Chains in Southern New England: March 2003 ..............................................................................................................14
Figure 3. New York Retail Price vs. Raw Milk Cost, Gallon Milk (1/01-7/03) ........................15 Figure 4. New York Retail Price vs. Threshold, Upstate – Gallon (1/01-7/03) .........................16 Figure 5 New York Retail Price vs. Threshold, Metro – Gallon (1/01-7/03)............................17 Table 1. Weighted Average Price by Channel for all Types of Milk (Skim, 1%, 2%,
3.25%)......................................................................................................................18 Table 2. Weighted Average Price by Chain for all Types of Milk (Skim, 1%, 2%,
3.25%)......................................................................................................................18 Table 3. Average Prices by Channel for all Types of Milk and New York Milk Law
Threshold Prices: June 2003 ....................................................................................19 Table 4a Lowest Priced Milk by Type and Channel..................................................................20 Table 4b. Number of Observations (stores) for Lowest Priced Milk by Type and
Channel for June 2003 .............................................................................................20 Table 5a. Lowest Priced Milk by Type and Chain .....................................................................21 Table 5b. Number of Observations (Stores) for Lowest Priced Milk by Type and Chain
for June 2003............................................................................................................22
1
Testimony on the Massachusetts Milk Price Situation and the Proposed Massachusetts Milk Price
Gouging Law
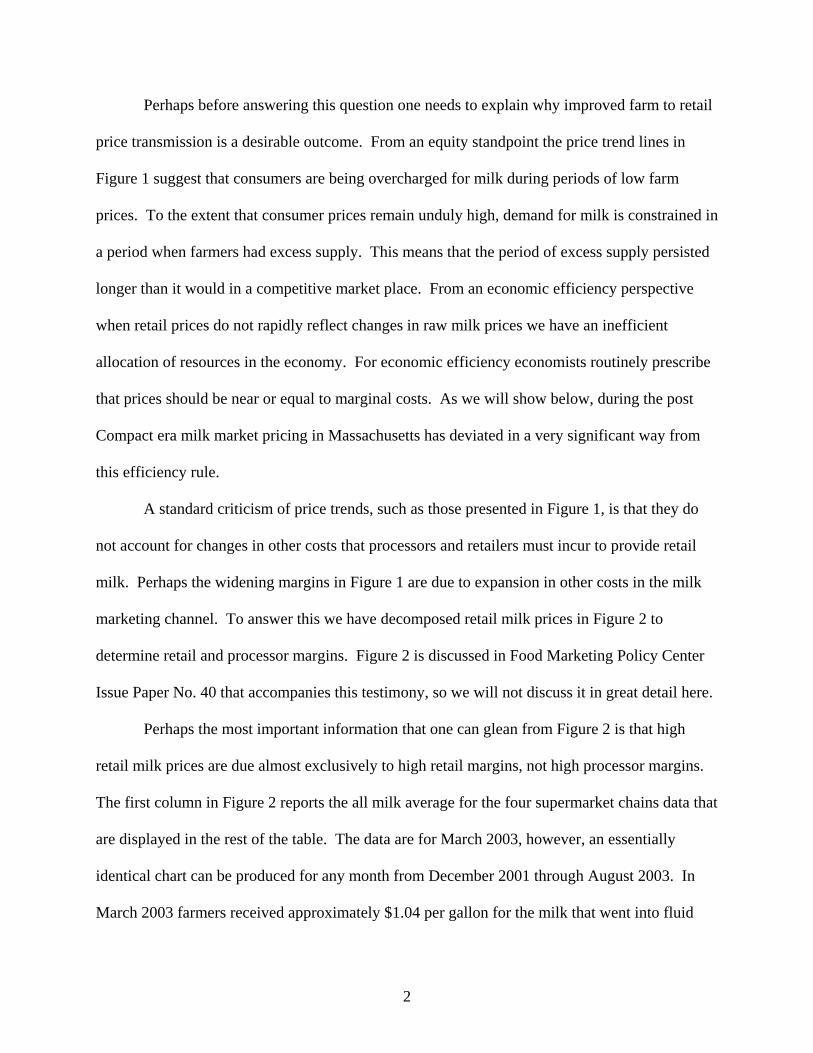
At the outset we would like to thank the Committee on the Environment for the
opportunities to submit this written testimony and to address the Committee on an important
issue today. Milk pricing in New England and Massachusetts has been contentious for several
years because of two interrelated issues. Those issues are of low milk prices to New England
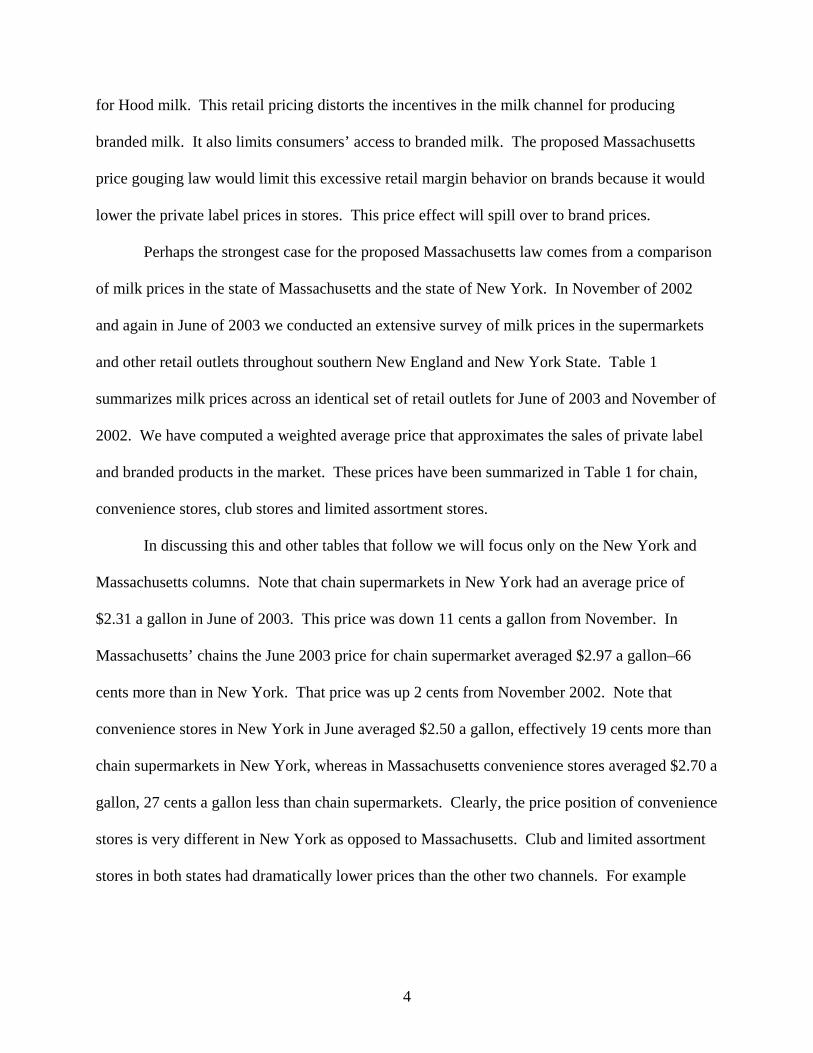
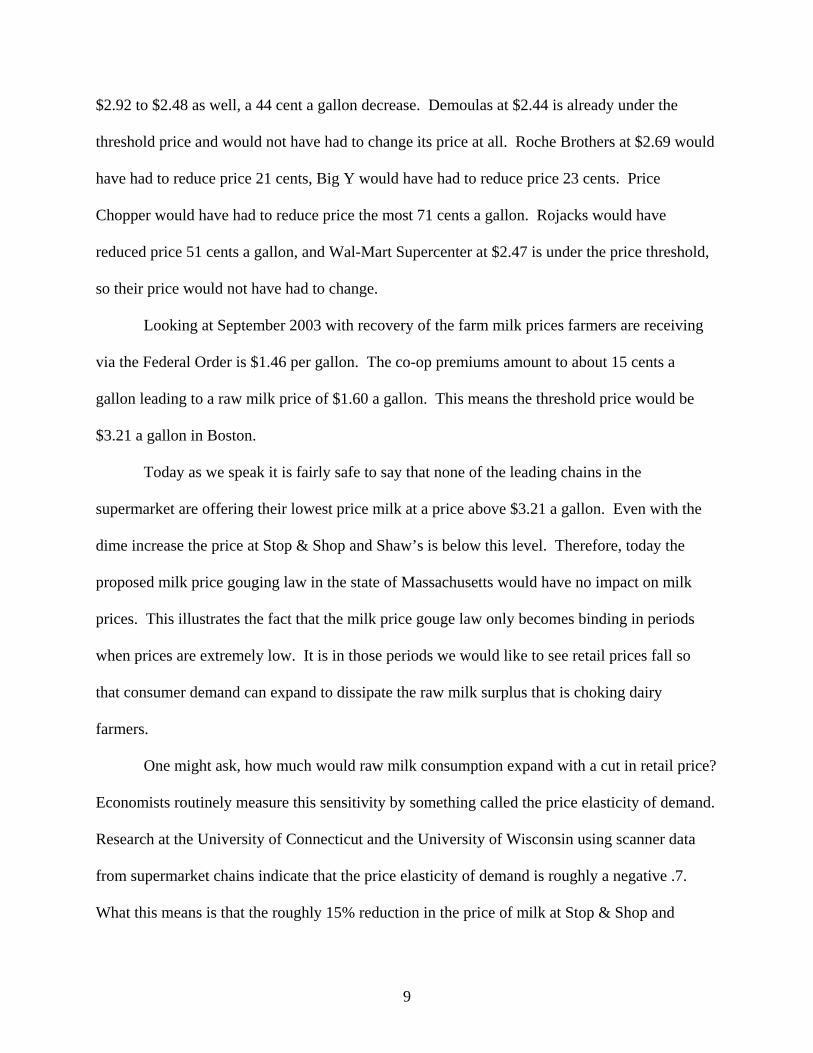
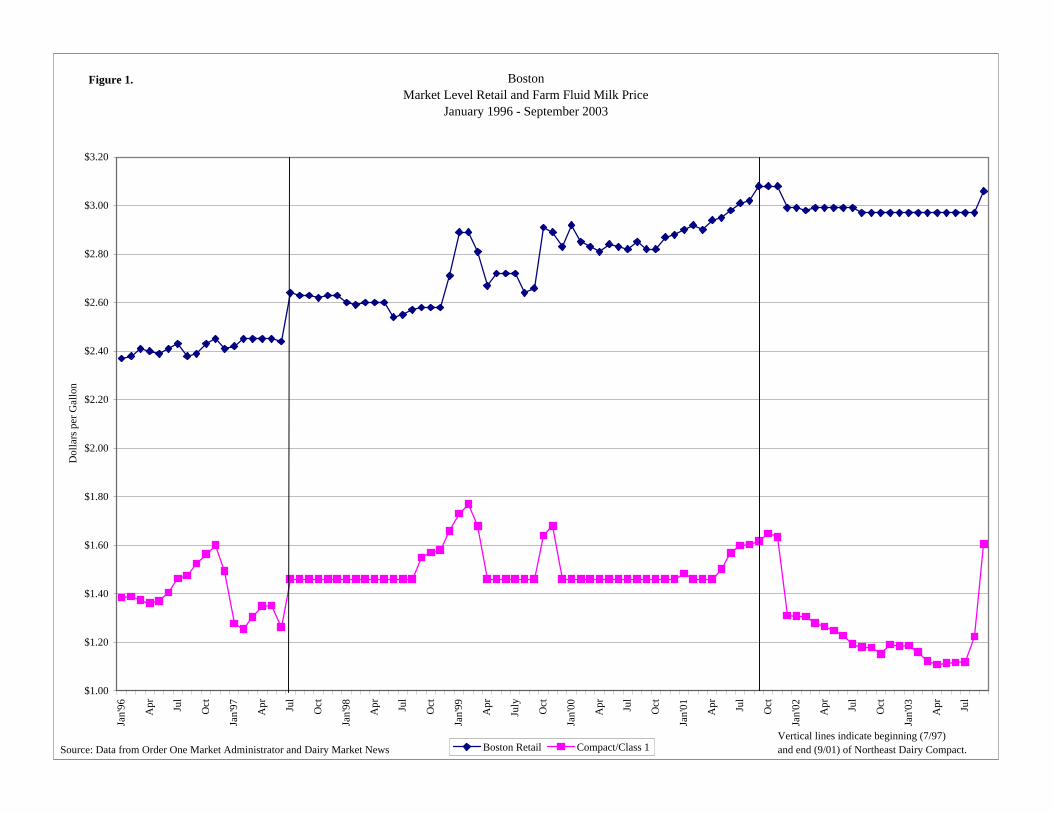
farmers and high milk prices to New England’s consumers. Figure 1 is a graphic picture of the
problem. It gives the retail milk prices for Boston and the raw milk prices that farmers received
for that fluid milk. The two vertical lines denote the era of the Dairy Compact. Note that the
Dairy Compact established a price floor at $1.46 a gallon that shielded farmers from low raw
fluid milk prices. Note also that outside of the Dairy Compact period there was considerable
volatility in raw milk prices. Also note that before and after the Compact volatility in raw milk
prices was not transmitted in any visible or major form to variation in retail milk prices. During
the post Compact period within two months of the end of the Compact raw milk prices
plummeted as much 50 cents a gallon to dairy farmers. At the time retailers in Boston dropped
the price approximately 10 cents a gallon. After that major price drop raw milk prices continued
to drift downward, and retail milk prices remained essentially constant, near $3 a gallon. Now
we have experienced a 35 cent per gallon increase in the raw milk prices, and retail prices are
moving up again.
The fundamental question that we are here to address today is the following. Is the
proposed Massachusetts price gouging law appropriate legislation to improve farm to retail price
transmission in the Massachusetts milk channel?
2
Perhaps before answering this question one needs to explain why improved farm to retail
price transmission is a desirable outcome. From an equity standpoint the price trend lines in
Figure 1 suggest that consumers are being overcharged for milk during periods of low farm
prices. To the extent that consumer prices remain unduly high, demand for milk is constrained in
a period when farmers had excess supply. This means that the period of excess supply persisted
longer than it would in a competitive market place. From an economic efficiency perspective
when retail prices do not rapidly reflect changes in raw milk prices we have an inefficient
allocation of resources in the economy. For economic efficiency economists routinely prescribe
that prices should be near or equal to marginal costs. As we will show below, during the post
Compact era milk market pricing in Massachusetts has deviated in a very significant way from
this efficiency rule.
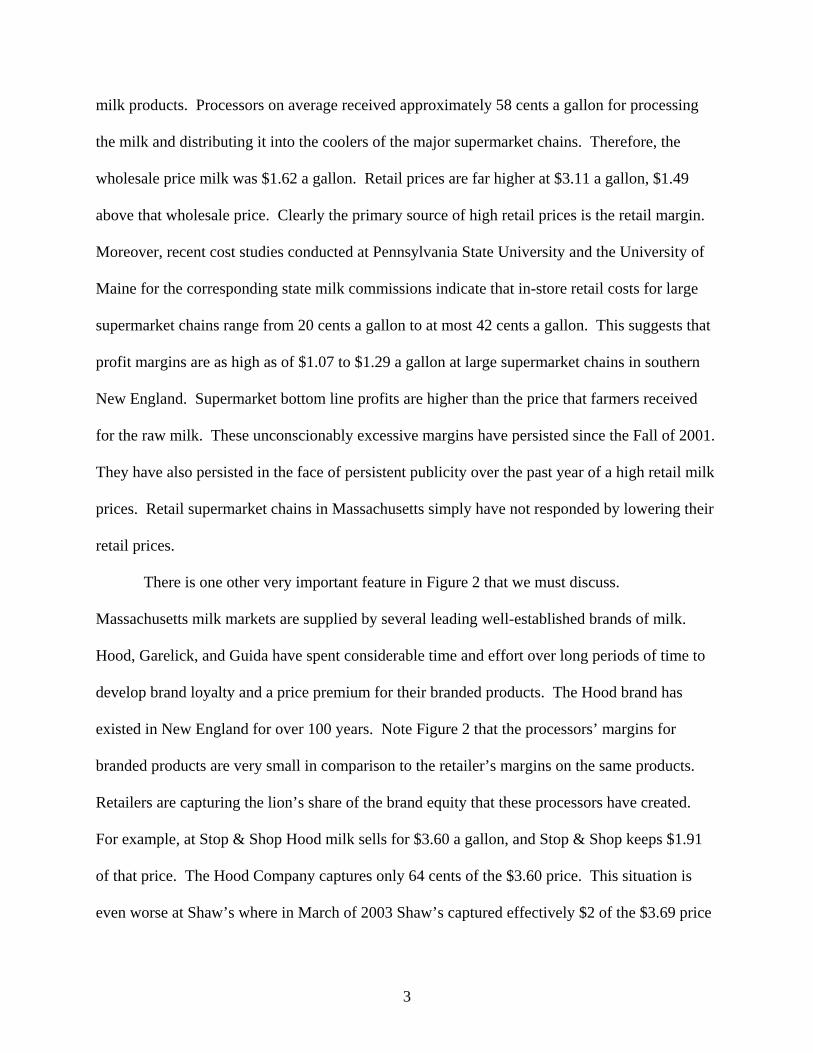
A standard criticism of price trends, such as those presented in Figure 1, is that they do
not account for changes in other costs that processors and retailers must incur to provide retail
milk. Perhaps the widening margins in Figure 1 are due to expansion in other costs in the milk
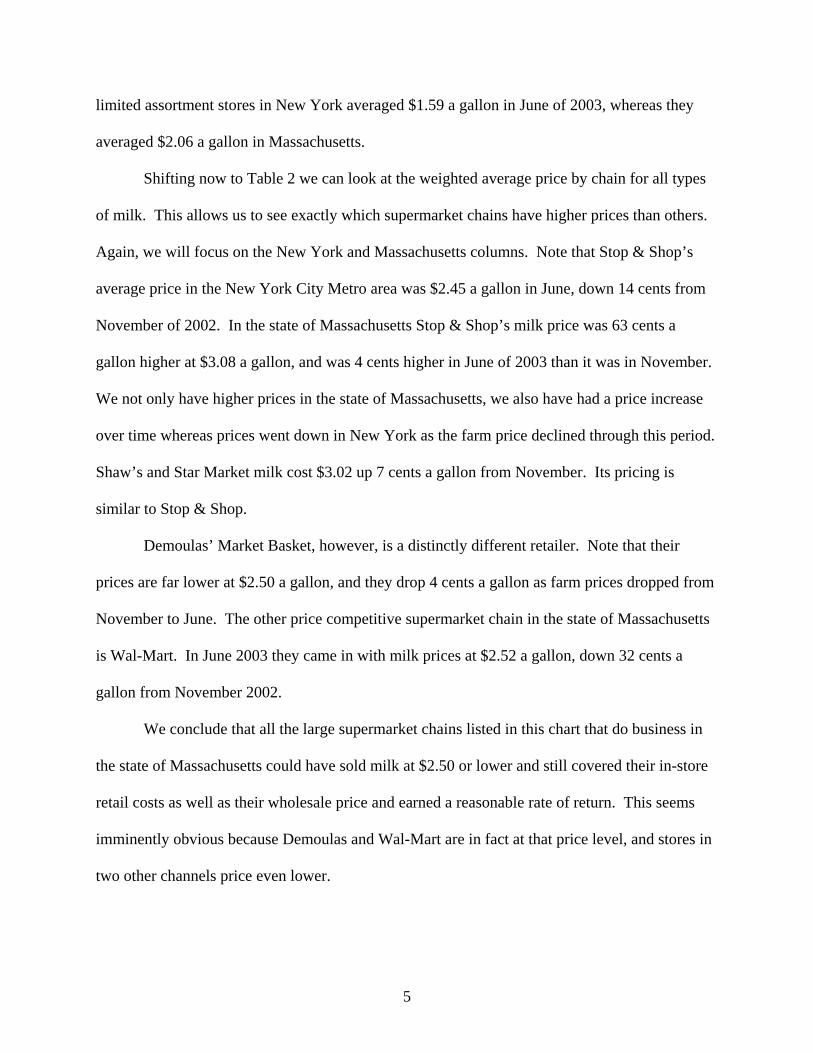
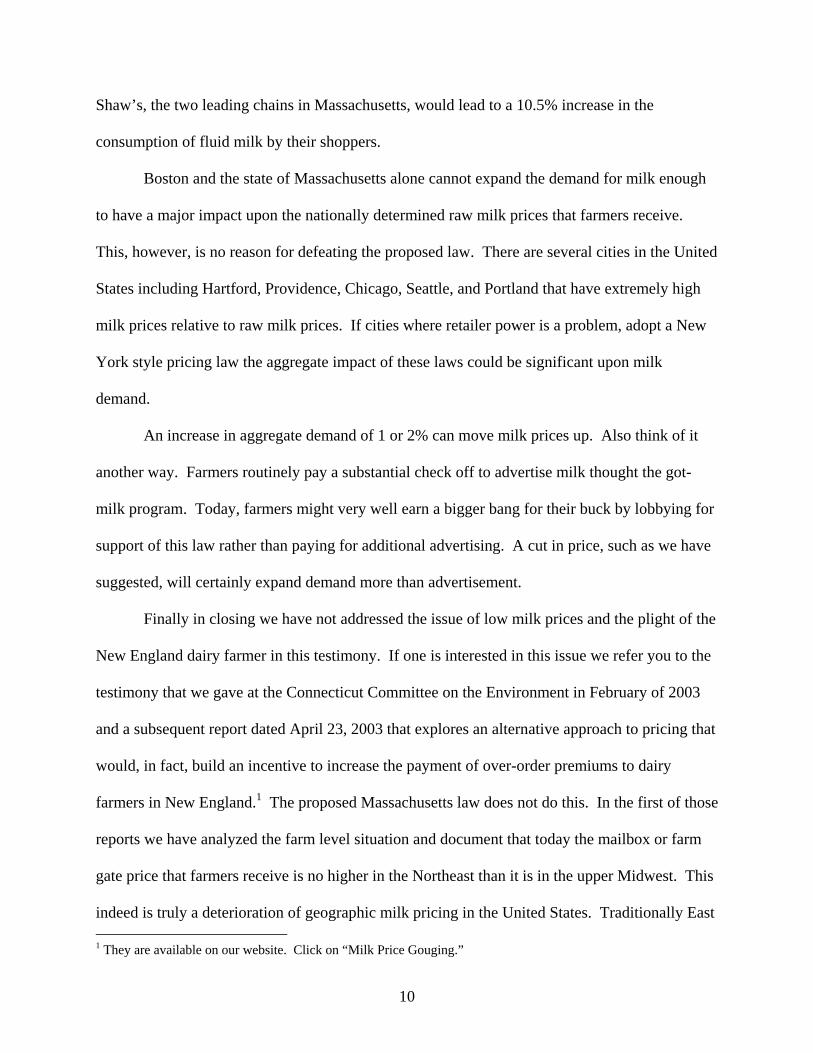
marketing channel. To answer this we have decomposed retail milk prices in Figure 2 to
determine retail and processor margins. Figure 2 is discussed in Food Marketing Policy Center
Issue Paper No. 40 that accompanies this testimony, so we will not discuss it in great detail here.
Perhaps the most important information that one can glean from Figure 2 is that high
retail milk prices are due almost exclusively to high retail margins, not high processor margins.
The first column in Figure 2 reports the all milk average for the four supermarket chains data that
are displayed in the rest of the table. The data are for March 2003, however, an essentially
identical chart can be produced for any month from December 2001 through August 2003. In
March 2003 farmers received approximately $1.04 per gallon for the milk that went into fluid
3
milk products. Processors on average received approximately 58 cents a gallon for processing
the milk and distributing it into the coolers of the major supermarket chains. Therefore, the
wholesale price milk was $1.62 a gallon. Retail prices are far higher at $3.11 a gallon, $1.49
above that wholesale price. Clearly the primary source of high retail prices is the retail margin.
Moreover, recent cost studies conducted at Pennsylvania State University and the University of
Maine for the corresponding state milk commissions indicate that in-store retail costs for large
supermarket chains range from 20 cents a gallon to at most 42 cents a gallon. This suggests that
profit margins are as high as of $1.07 to $1.29 a gallon at large supermarket chains in southern
New England. Supermarket bottom line profits are higher than the price that farmers received
for the raw milk. These unconscionably excessive margins have persisted since the Fall of 2001.
They have also persisted in the face of persistent publicity over the past year of a high retail milk
prices. Retail supermarket chains in Massachusetts simply have not responded by lowering their
retail prices.
There is one other very important feature in Figure 2 that we must discuss.
Massachusetts milk markets are supplied by several leading well-established brands of milk.
Hood, Garelick, and Guida have spent considerable time and effort over long periods of time to
develop brand loyalty and a price premium for their branded products. The Hood brand has
existed in New England for over 100 years. Note Figure 2 that the processors’ margins for
branded products are very small in comparison to the retailer’s margins on the same products.
Retailers are capturing the lion’s share of the brand equity that these processors have created.
For example, at Stop & Shop Hood milk sells for $3.60 a gallon, and Stop & Shop keeps $1.91
of that price. The Hood Company captures only 64 cents of the $3.60 price. This situation is
even worse at Shaw’s where in March of 2003 Shaw’s captured effectively $2 of the $3.69 price
4
for Hood milk. This retail pricing distorts the incentives in the milk channel for producing
branded milk. It also limits consumers’ access to branded milk. The proposed Massachusetts
price gouging law would limit this excessive retail margin behavior on brands because it would
lower the private label prices in stores. This price effect will spill over to brand prices.
Perhaps the strongest case for the proposed Massachusetts law comes from a comparison
of milk prices in the state of Massachusetts and the state of New York. In November of 2002
and again in June of 2003 we conducted an extensive survey of milk prices in the supermarkets
and other retail outlets throughout southern New England and New York State. Table 1
summarizes milk prices across an identical set of retail outlets for June of 2003 and November of
2002. We have computed a weighted average price that approximates the sales of private label
and branded products in the market. These prices have been summarized in Table 1 for chain,
convenience stores, club stores and limited assortment stores.
In discussing this and other tables that follow we will focus only on the New York and
Massachusetts columns. Note that chain supermarkets in New York had an average price of
$2.31 a gallon in June of 2003. This price was down 11 cents a gallon from November. In
Massachusetts’ chains the June 2003 price for chain supermarket averaged $2.97 a gallon–66
cents more than in New York. That price was up 2 cents from November 2002. Note that
convenience stores in New York in June averaged $2.50 a gallon, effectively 19 cents more than
chain supermarkets in New York, whereas in Massachusetts convenience stores averaged $2.70 a
gallon, 27 cents a gallon less than chain supermarkets. Clearly, the price position of convenience
stores is very different in New York as opposed to Massachusetts. Club and limited assortment
stores in both states had dramatically lower prices than the other two channels. For example
5
limited assortment stores in New York averaged $1.59 a gallon in June of 2003, whereas they
averaged $2.06 a gallon in Massachusetts.
Shifting now to Table 2 we can look at the weighted average price by chain for all types
of milk. This allows us to see exactly which supermarket chains have higher prices than others.
Again, we will focus on the New York and Massachusetts columns. Note that Stop & Shop’s
average price in the New York City Metro area was $2.45 a gallon in June, down 14 cents from
November of 2002. In the state of Massachusetts Stop & Shop’s milk price was 63 cents a
gallon higher at $3.08 a gallon, and was 4 cents higher in June of 2003 than it was in November.
We not only have higher prices in the state of Massachusetts, we also have had a price increase
over time whereas prices went down in New York as the farm price declined through this period.
Shaw’s and Star Market milk cost $3.02 up 7 cents a gallon from November. Its pricing is
similar to Stop & Shop.
Demoulas’ Market Basket, however, is a distinctly different retailer. Note that their
prices are far lower at $2.50 a gallon, and they drop 4 cents a gallon as farm prices dropped from
November to June. The other price competitive supermarket chain in the state of Massachusetts
is Wal-Mart. In June 2003 they came in with milk prices at $2.52 a gallon, down 32 cents a
gallon from November 2002.
We conclude that all the large supermarket chains listed in this chart that do business in
the state of Massachusetts could have sold milk at $2.50 or lower and still covered their in-store
retail costs as well as their wholesale price and earned a reasonable rate of return. This seems
imminently obvious because Demoulas and Wal-Mart are in fact at that price level, and stores in
two other channels price even lower.
6
Permit us, for the moment, to play devil’s advocate. OK. We have shown that leading
supermarket chains in the Boston area and the area throughout the state of Massachusetts have
high milk prices–prices that are well above their cost. We have also shown that some
supermarket chains and several other channels have far lower costs. Why not simply let the
market work this out? Let consumers switch from one store to another. Wouldn’t this consumer
behavior in fact drive prices lower in these high price chains? Well the obvious answer is yes it
would, if indeed consumers were aware of the problem, and if indeed consumers have no time
costs and make the effort to switch their purchases of milk from the high price chains to the low
price retail outlets. Our response on this point is that these high milk prices in supermarket
chains have persisted for almost two years, and for much of that time there has been a good deal
of publicity about the problem. For whatever reason, consumers are not switching to low priced
milk outlets in sufficient numbers to force competitive discipline in this market. Does that mean
that consumers are well served by the current market structure in market pricing regime? The
answer clearly is no. The proposed milk price law would improve the allocative efficiency of the
milk marketing channel and would benefit consumers.
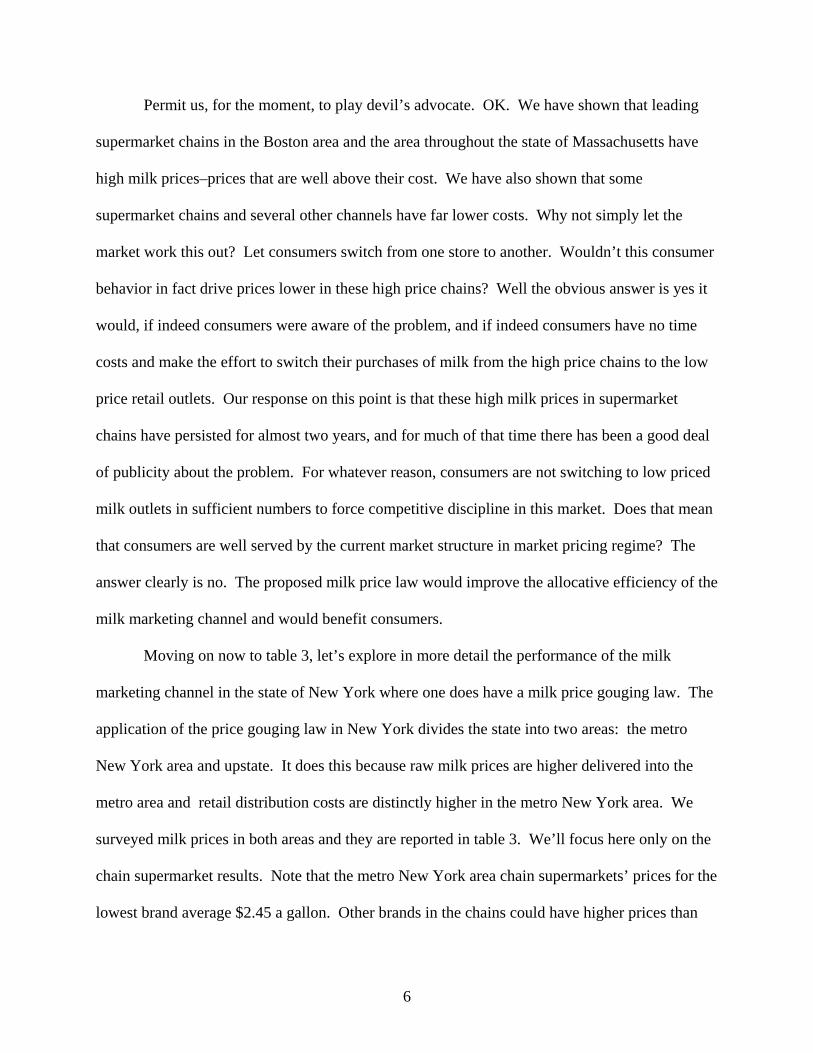
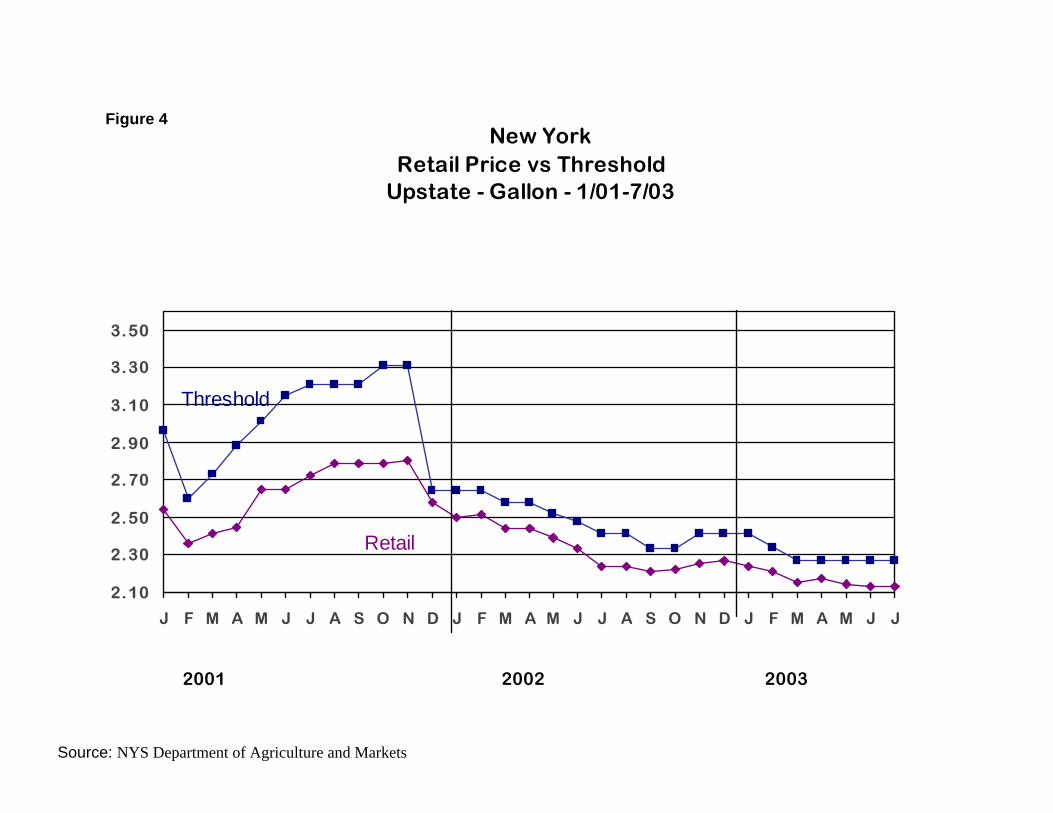
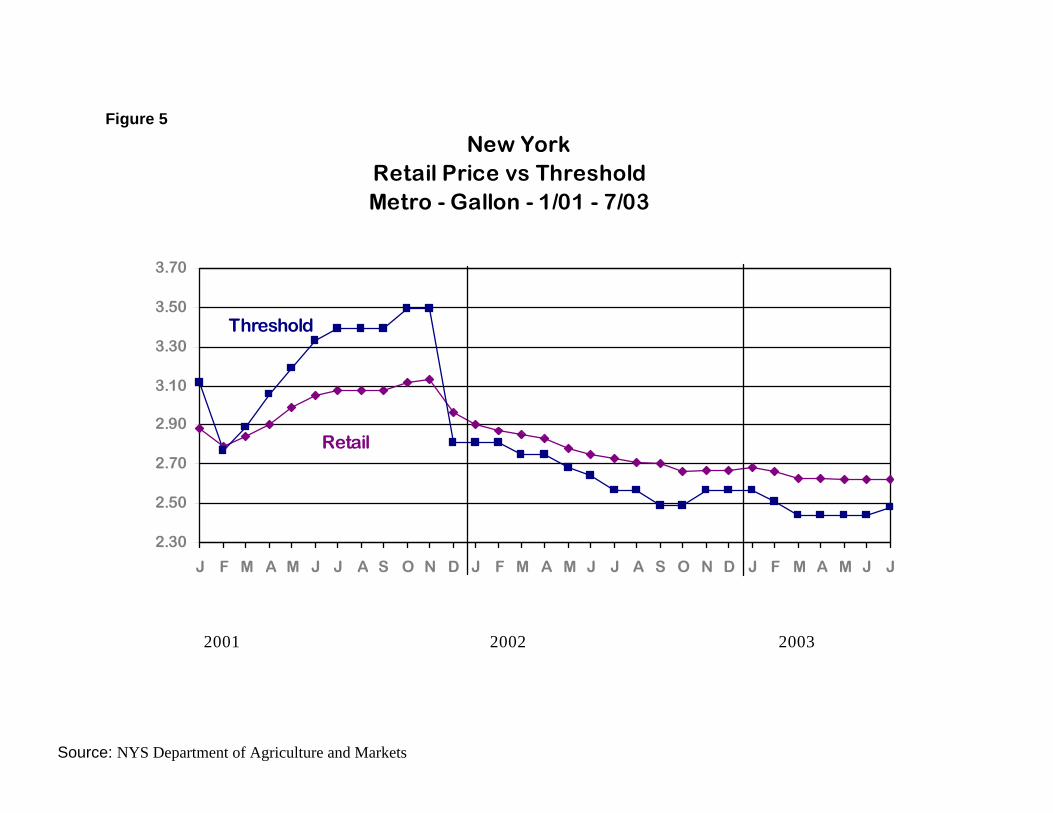
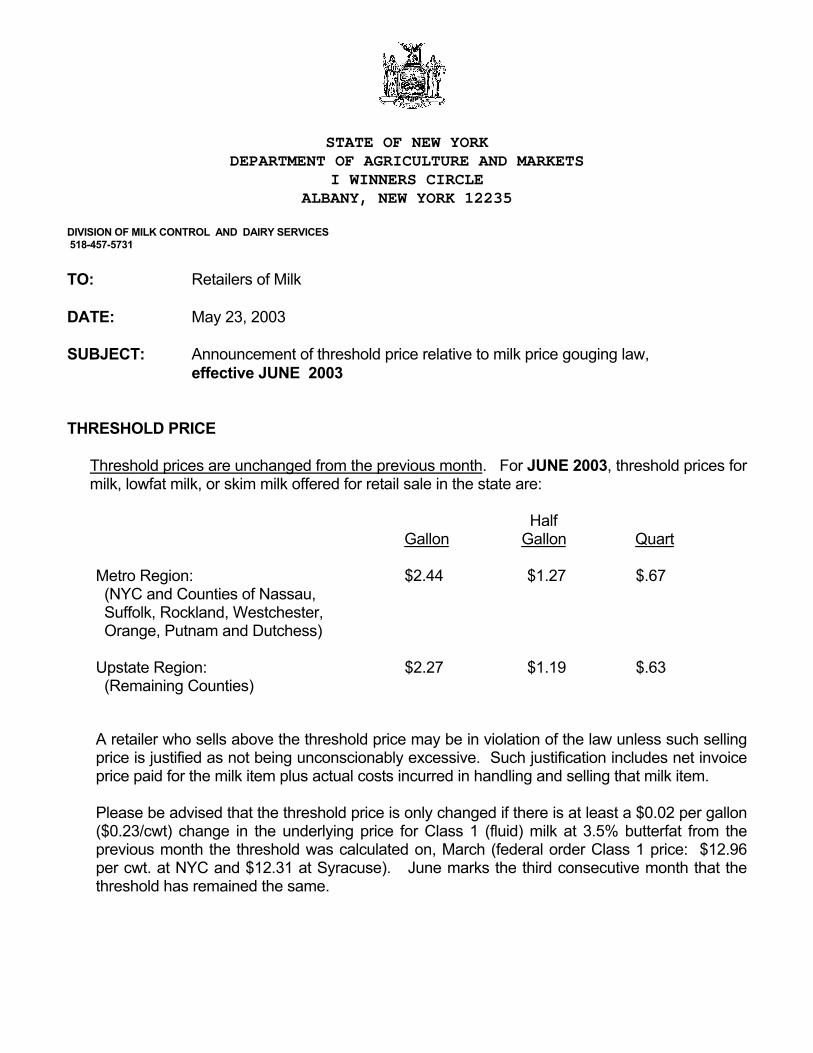
Moving on now to table 3, let’s explore in more detail the performance of the milk
marketing channel in the state of New York where one does have a milk price gouging law. The
application of the price gouging law in New York divides the state into two areas: the metro
New York area and upstate. It does this because raw milk prices are higher delivered into the
metro area and retail distribution costs are distinctly higher in the metro New York area. We
surveyed milk prices in both areas and they are reported in table 3. We’ll focus here only on the
chain supermarket results. Note that the metro New York area chain supermarkets’ prices for the
lowest brand average $2.45 a gallon. Other brands in the chains could have higher prices than
7
this lowest price offer brand. The threshold price for June was in fact $2.44 a gallon, so that the
average price on the lowest brand, which is what the threshold price is applied to, was virtually
identical to the threshold price. In a more detailed report of our price survey results we explore
the distribution around this average and identified chains that in fact are violating the threshold
price. In the upstate New York area the threshold price is far lower at $2.27 a gallon. Note that
the average price for chains is well below that at $2.08 a gallon.
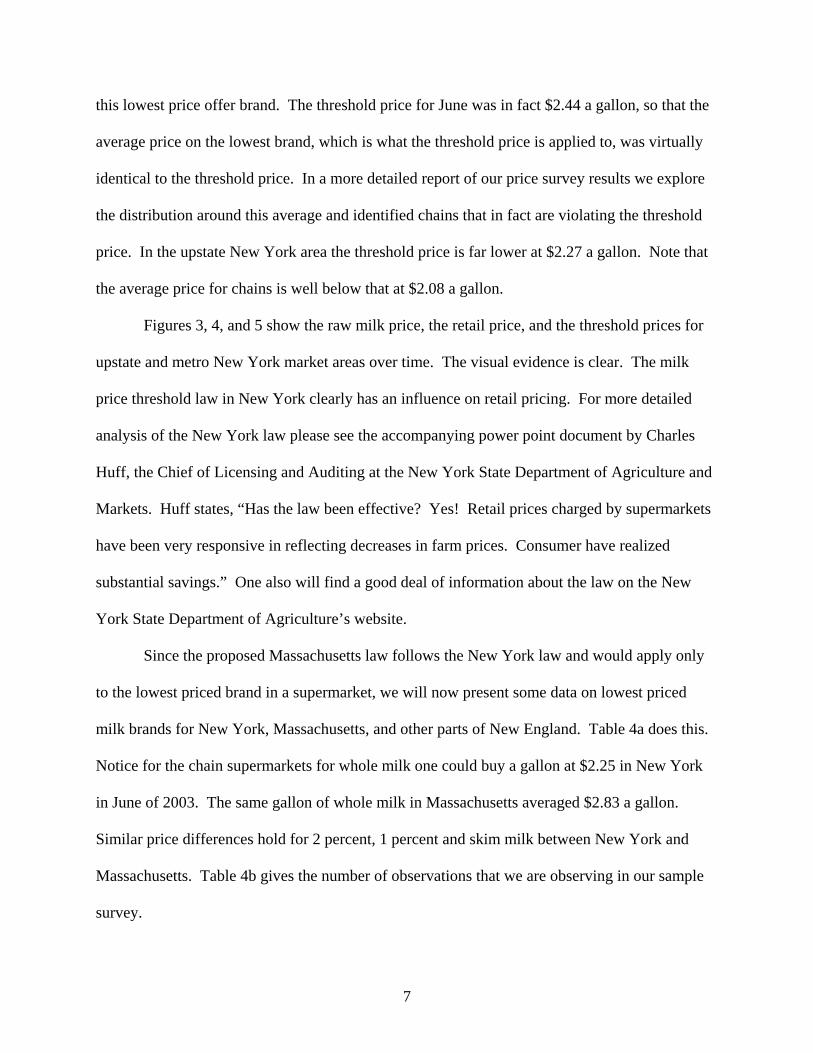
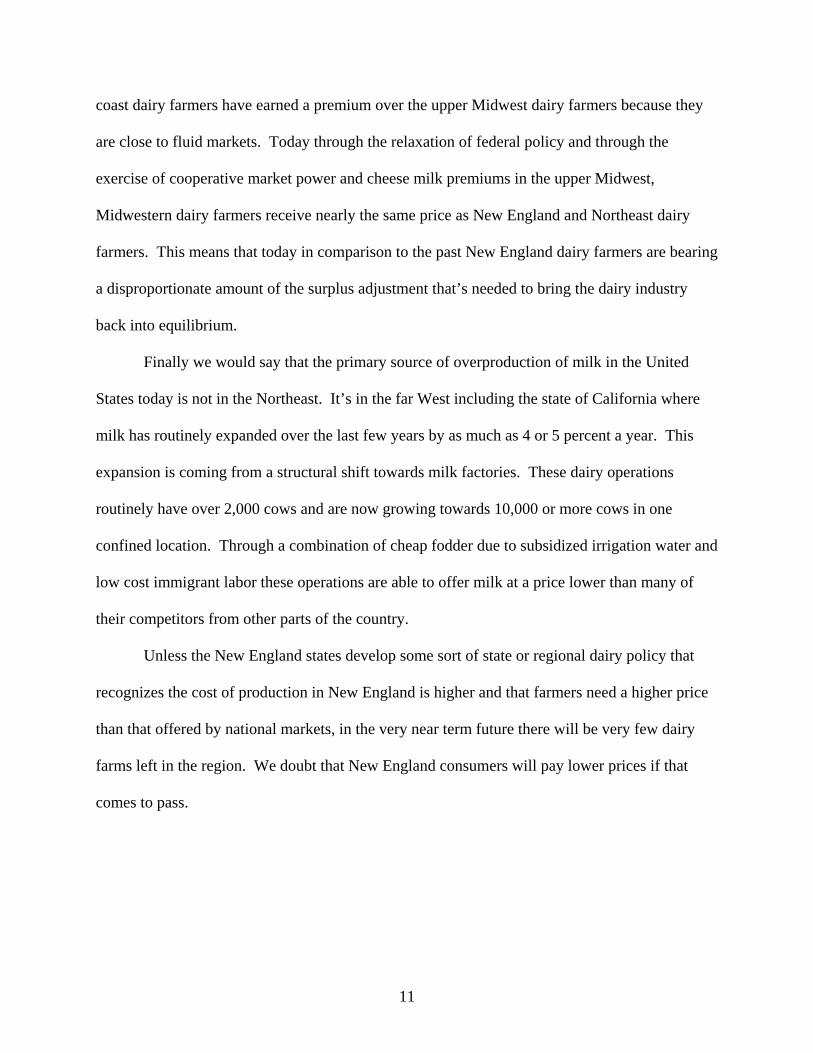
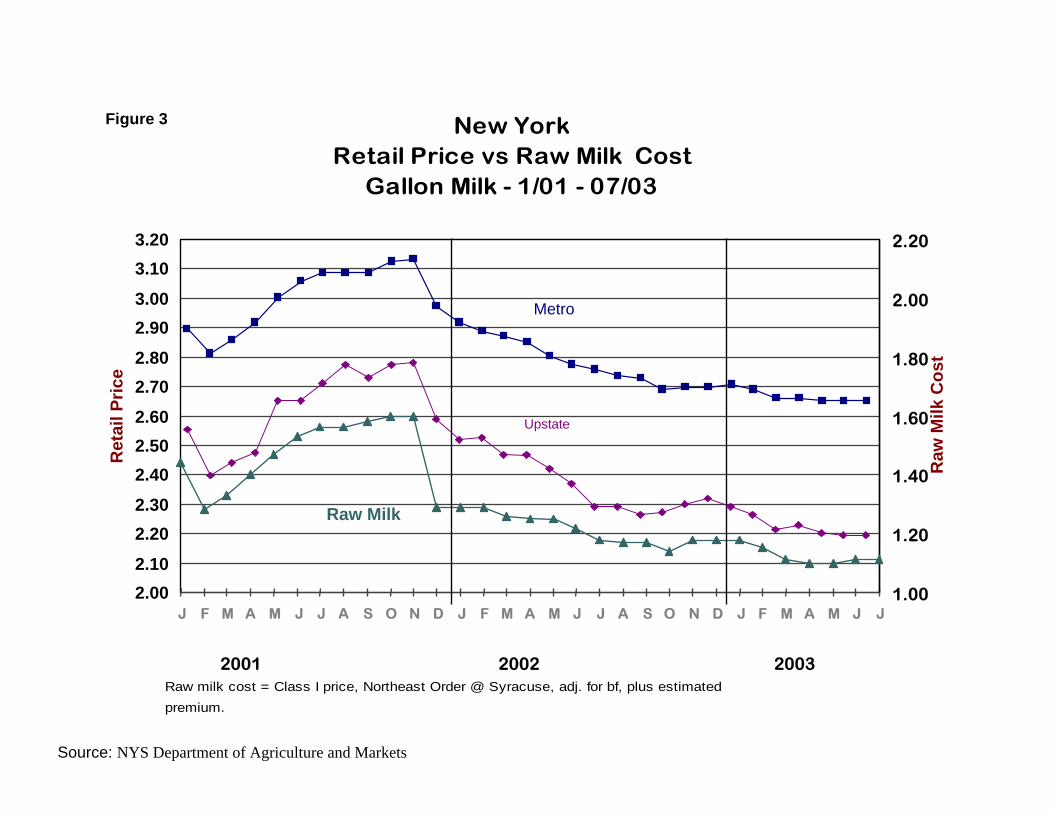
Figures 3, 4, and 5 show the raw milk price, the retail price, and the threshold prices for
upstate and metro New York market areas over time. The visual evidence is clear. The milk
price threshold law in New York clearly has an influence on retail pricing. For more detailed
analysis of the New York law please see the accompanying power point document by Charles
Huff, the Chief of Licensing and Auditing at the New York State Department of Agriculture and
Markets. Huff states, “Has the law been effective? Yes! Retail prices charged by supermarkets
have been very responsive in reflecting decreases in farm prices. Consumer have realized
substantial savings.” One also will find a good deal of information about the law on the New
York State Department of Agriculture’s website.
Since the proposed Massachusetts law follows the New York law and would apply only
to the lowest priced brand in a supermarket, we will now present some data on lowest priced
milk brands for New York, Massachusetts, and other parts of New England. Table 4a does this.
Notice for the chain supermarkets for whole milk one could buy a gallon at $2.25 in New York
in June of 2003. The same gallon of whole milk in Massachusetts averaged $2.83 a gallon.
Similar price differences hold for 2 percent, 1 percent and skim milk between New York and
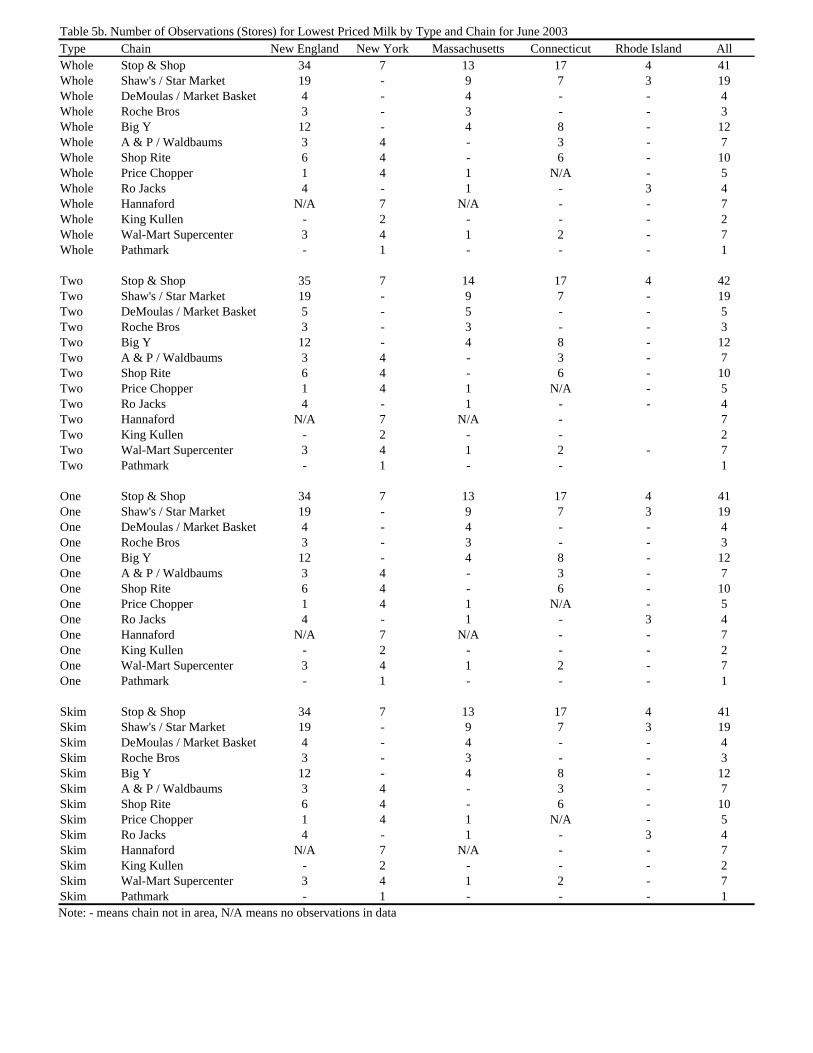
Massachusetts. Table 4b gives the number of observations that we are observing in our sample
survey.
8
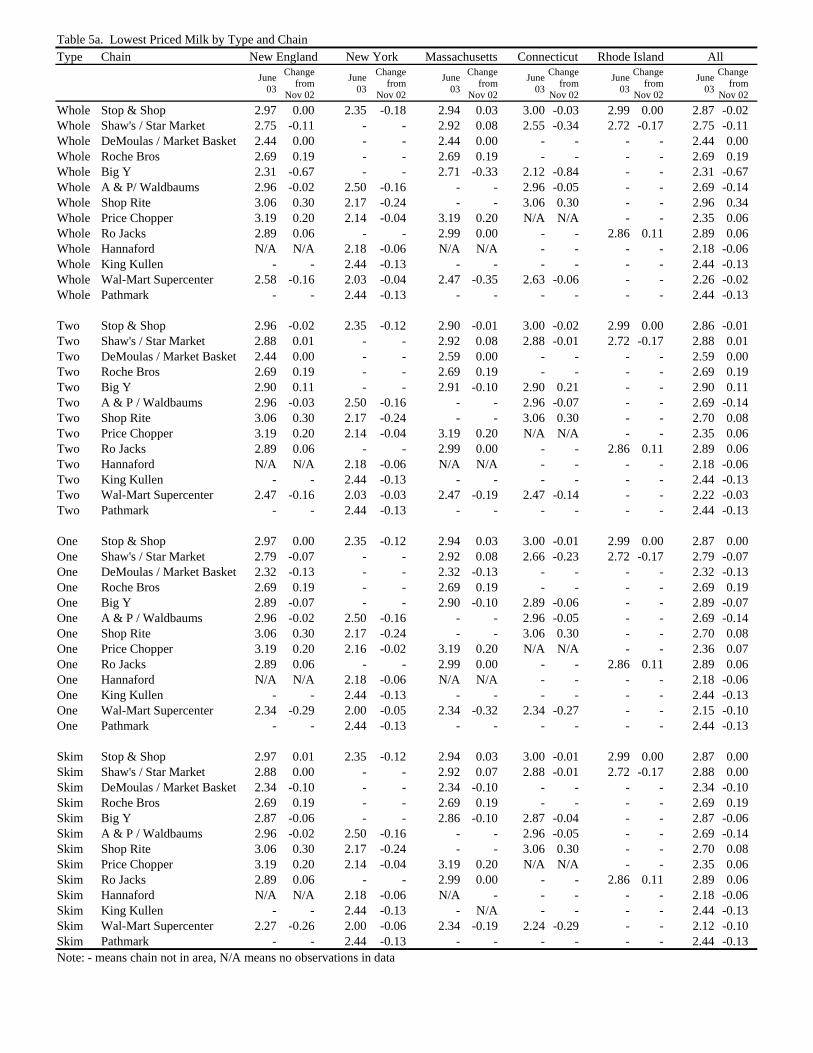
Moving on to Table 5a we have the lowest priced milk by supermarket chain as well as
by type of milk. This indicates, for example, that Stop & Shop sold whole milk at $2.35 a gallon
in the New York City metro area during June of 2003. That same milk was sold in
Massachusetts for $2.94 a gallon. Again, the difference is very substantial–59 cents a gallon.
When examining whole milk the lowest price gallons again are at Demoulas, $2.44 a gallon, and
Wal-Mart Supercenters, $2.47 a gallon. The highest priced whole milk was at Price Chopper,
$3.19 a gallon. These prices essentially are for private label milk in these supermarkets or
branded milk that is on some sort of deep discount. These prices also are the prices that are
actionable under the proposed Massachusetts law. That law would limit these prices to no more
than 200% of the price that processors paid farmers for the raw milk that is in the jugs.
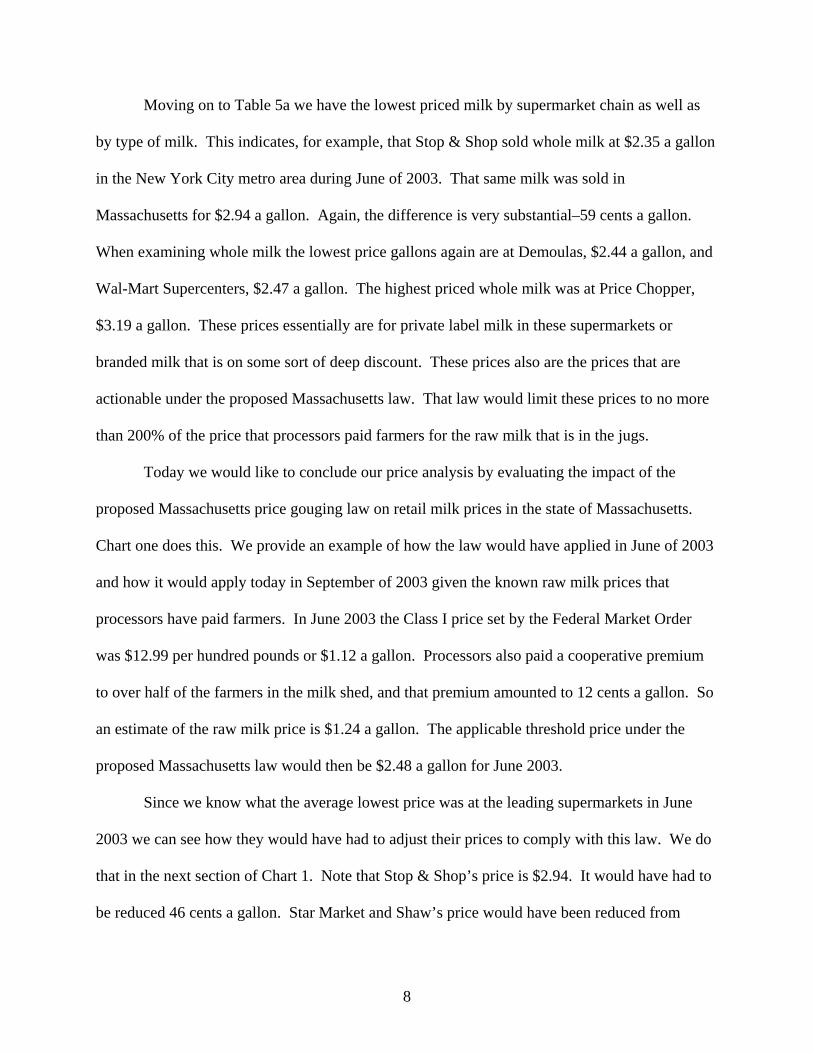
Today we would like to conclude our price analysis by evaluating the impact of the
proposed Massachusetts price gouging law on retail milk prices in the state of Massachusetts.
Chart one does this. We provide an example of how the law would have applied in June of 2003
and how it would apply today in September of 2003 given the known raw milk prices that
processors have paid farmers. In June 2003 the Class I price set by the Federal Market Order
was $12.99 per hundred pounds or $1.12 a gallon. Processors also paid a cooperative premium
to over half of the farmers in the milk shed, and that premium amounted to 12 cents a gallon. So
an estimate of the raw milk price is $1.24 a gallon. The applicable threshold price under the
proposed Massachusetts law would then be $2.48 a gallon for June 2003.
Since we know what the average lowest price was at the leading supermarkets in June
2003 we can see how they would have had to adjust their prices to comply with this law. We do
that in the next section of Chart 1. Note that Stop & Shop’s price is $2.94. It would have had to
be reduced 46 cents a gallon. Star Market and Shaw’s price would have been reduced from
9
$2.92 to $2.48 as well, a 44 cent a gallon decrease. Demoulas at $2.44 is already under the
threshold price and would not have had to change its price at all. Roche Brothers at $2.69 would
have had to reduce price 21 cents, Big Y would have had to reduce price 23 cents. Price
Chopper would have had to reduce price the most 71 cents a gallon. Rojacks would have
reduced price 51 cents a gallon, and Wal-Mart Supercenter at $2.47 is under the price threshold,
so their price would not have had to change.
Looking at September 2003 with recovery of the farm milk prices farmers are receiving
via the Federal Order is $1.46 per gallon. The co-op premiums amount to about 15 cents a
gallon leading to a raw milk price of $1.60 a gallon. This means the threshold price would be
$3.21 a gallon in Boston.
Today as we speak it is fairly safe to say that none of the leading chains in the
supermarket are offering their lowest price milk at a price above $3.21 a gallon. Even with the
dime increase the price at Stop & Shop and Shaw’s is below this level. Therefore, today the
proposed milk price gouging law in the state of Massachusetts would have no impact on milk
prices. This illustrates the fact that the milk price gouge law only becomes binding in periods
when prices are extremely low. It is in those periods we would like to see retail prices fall so
that consumer demand can expand to dissipate the raw milk surplus that is choking dairy
farmers.
One might ask, how much would raw milk consumption expand with a cut in retail price?
Economists routinely measure this sensitivity by something called the price elasticity of demand.
Research at the University of Connecticut and the University of Wisconsin using scanner data
from supermarket chains indicate that the price elasticity of demand is roughly a negative .7.
What this means is that the roughly 15% reduction in the price of milk at Stop & Shop and
10
Shaw’s, the two leading chains in Massachusetts, would lead to a 10.5% increase in the
consumption of fluid milk by their shoppers.
Boston and the state of Massachusetts alone cannot expand the demand for milk enough
to have a major impact upon the nationally determined raw milk prices that farmers receive.
This, however, is no reason for defeating the proposed law. There are several cities in the United
States including Hartford, Providence, Chicago, Seattle, and Portland that have extremely high
milk prices relative to raw milk prices. If cities where retailer power is a problem, adopt a New
York style pricing law the aggregate impact of these laws could be significant upon milk
demand.
An increase in aggregate demand of 1 or 2% can move milk prices up. Also think of it
another way. Farmers routinely pay a substantial check off to advertise milk thought the got-
milk program. Today, farmers might very well earn a bigger bang for their buck by lobbying for
support of this law rather than paying for additional advertising. A cut in price, such as we have
suggested, will certainly expand demand more than advertisement.
Finally in closing we have not addressed the issue of low milk prices and the plight of the
New England dairy farmer in this testimony. If one is interested in this issue we refer you to the
testimony that we gave at the Connecticut Committee on the Environment in February of 2003
and a subsequent report dated April 23, 2003 that explores an alternative approach to pricing that
would, in fact, build an incentive to increase the payment of over-order premiums to dairy
farmers in New England.1 The proposed Massachusetts law does not do this. In the first of those
reports we have analyzed the farm level situation and document that today the mailbox or farm
gate price that farmers receive is no higher in the Northeast than it is in the upper Midwest. This
indeed is truly a deterioration of geographic milk pricing in the United States. Traditionally East 1 They are available on our website. Click on “Milk Price Gouging.”
11
coast dairy farmers have earned a premium over the upper Midwest dairy farmers because they
are close to fluid markets. Today through the relaxation of federal policy and through the
exercise of cooperative market power and cheese milk premiums in the upper Midwest,
Midwestern dairy farmers receive nearly the same price as New England and Northeast dairy
farmers. This means that today in comparison to the past New England dairy farmers are bearing
a disproportionate amount of the surplus adjustment that’s needed to bring the dairy industry
back into equilibrium.
Finally we would say that the primary source of overproduction of milk in the United
States today is not in the Northeast. It’s in the far West including the state of California where
milk has routinely expanded over the last few years by as much as 4 or 5 percent a year. This
expansion is coming from a structural shift towards milk factories. These dairy operations
routinely have over 2,000 cows and are now growing towards 10,000 or more cows in one
confined location. Through a combination of cheap fodder due to subsidized irrigation water and
low cost immigrant labor these operations are able to offer milk at a price lower than many of
their competitors from other parts of the country.
Unless the New England states develop some sort of state or regional dairy policy that
recognizes the cost of production in New England is higher and that farmers need a higher price
than that offered by national markets, in the very near term future there will be very few dairy
farms left in the region. We doubt that New England consumers will pay lower prices if that
comes to pass.
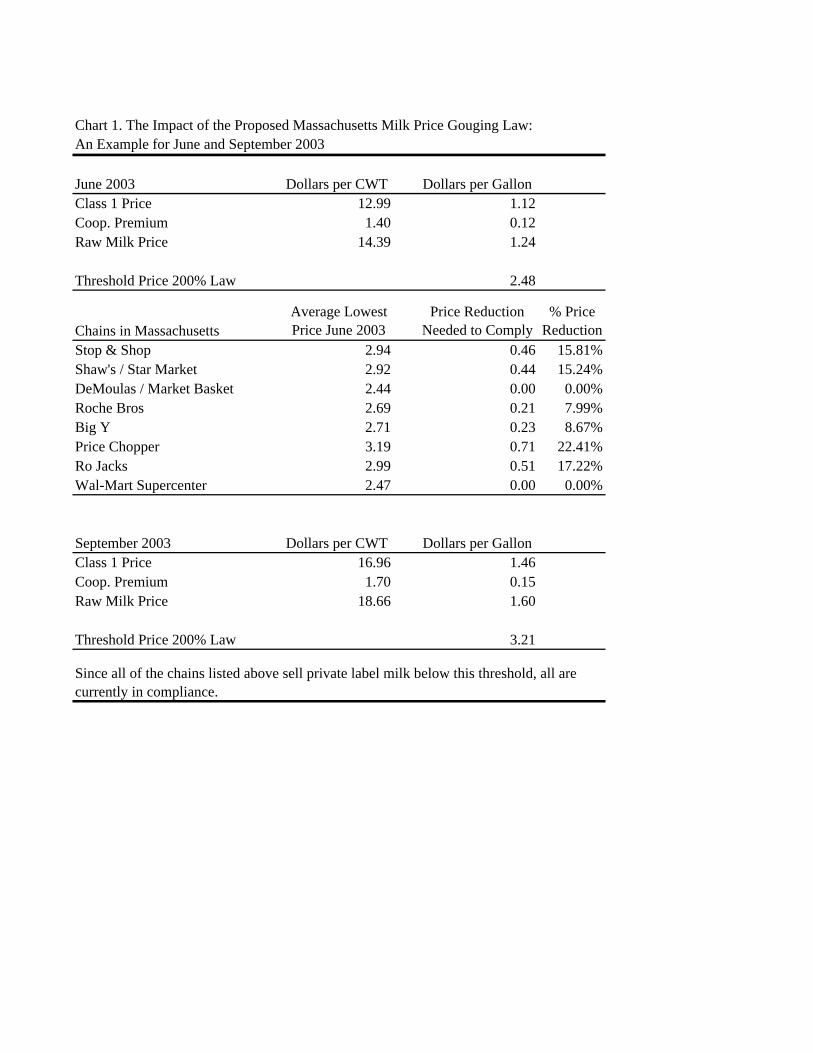
Chart 1. The Impact of the Proposed Massachusetts Milk Price Gouging Law:An Example for June and September 2003
June 2003 Dollars per CWT Dollars per GallonClass 1 Price 12.99 1.12Coop. Premium 1.40 0.12Raw Milk Price 14.39 1.24
Threshold Price 200% Law 2.48
Chains in MassachusettsAverage Lowest Price June 2003
Price Reduction Needed to Comply
% Price Reduction
Stop & Shop 2.94 0.46 15.81%Shaw's / Star Market 2.92 0.44 15.24%DeMoulas / Market Basket 2.44 0.00 0.00%Roche Bros 2.69 0.21 7.99%Big Y 2.71 0.23 8.67%Price Chopper 3.19 0.71 22.41%Ro Jacks 2.99 0.51 17.22%Wal-Mart Supercenter 2.47 0.00 0.00%
September 2003 Dollars per CWT Dollars per GallonClass 1 Price 16.96 1.46Coop. Premium 1.70 0.15Raw Milk Price 18.66 1.60
Threshold Price 200% Law 3.21
Since all of the chains listed above sell private label milk below this threshold, all are currently in compliance.
BostonMarket Level Retail and Farm Fluid Milk Price
January 1996 - September 2003
$1.00
$1.20
$1.40
$1.60
$1.80
$2.00
$2.20
$2.40
$2.60
$2.80
$3.00
$3.20
Jan'
96 Apr Ju
l
Oct
Jan'
97 Apr Ju
l
Oct
Jan'
98 Apr Ju
l
Oct
Jan'
99 Apr
July
Oct
Jan'
00 Apr Ju
l
Oct
Jan'
01 Apr Ju
l
Oct
Jan'
02 Apr Ju
l
Oct
Jan'
03 Apr Ju
l
Dol
lars
per
Gal
lon
Boston Retail Compact/Class 1
Figure 1.
Source: Data from Order One Market Administrator and Dairy Market NewsVertical lines indicate beginning (7/97) and end (9/01) of Northeast Dairy Compact.
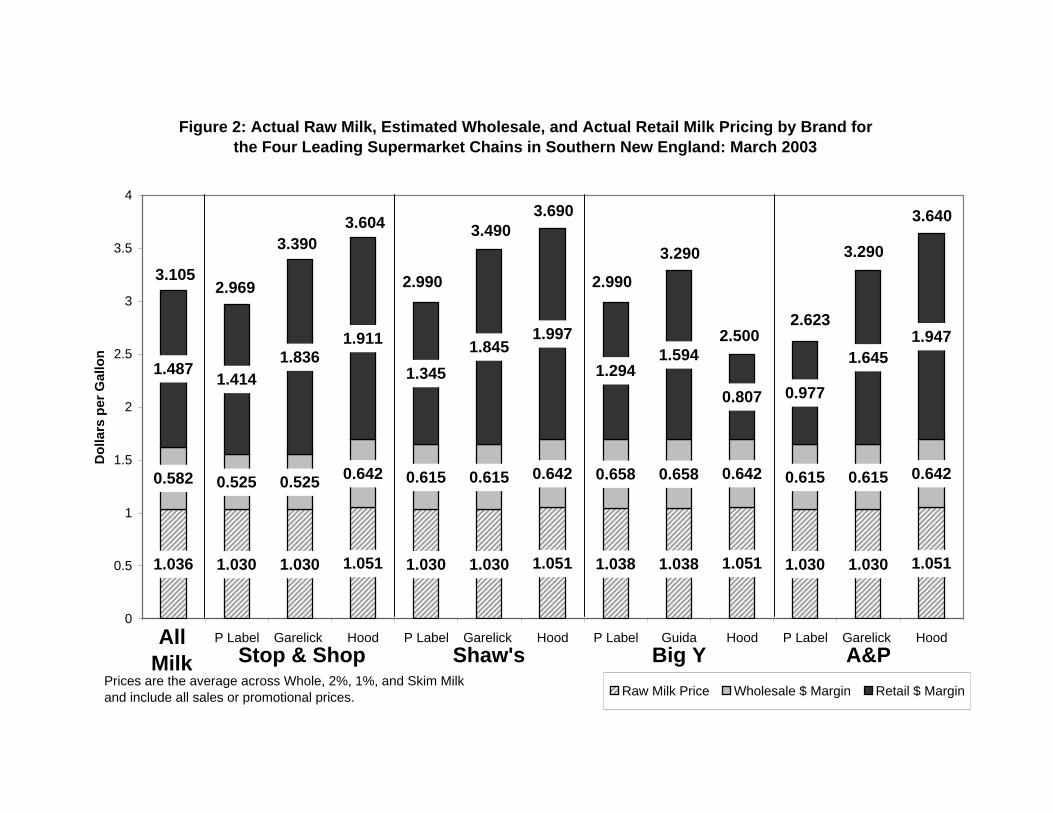
Figure 2: Actual Raw Milk, Estimated Wholesale, and Actual Retail Milk Pricing by Brand for the Four Leading Supermarket Chains in Southern New England: March 2003
1.036 1.030 1.030 1.051 1.030 1.030 1.051 1.038 1.038 1.051 1.030 1.030 1.051
0.582 0.525 0.525 0.642 0.615 0.615 0.642 0.658 0.658 0.642 0.615 0.615 0.642
1.487 1.4141.836
1.911
1.3451.845
1.997
1.2941.594
0.807 0.977
1.6451.947
0
0.5
1
1.5
2
2.5
3
3.5
4
P Label Garelick Hood P Label Garelick Hood P Label Guida Hood P Label Garelick Hood
Dol
lars
per
Gal
lon
Raw Milk Price Wholesale $ Margin Retail $ Margin
Stop & Shop Shaw's Big Y A&P
2.969
3.390 3.604
2.990
3.490 3.690
2.990
3.290
2.500 2.623
3.290
3.640
3.105
AllMilk
Prices are the average across Whole, 2%, 1%, and Skim Milk and include all sales or promotional prices.
2001 2002 2003
2.002.10
2.202.30
2.402.502.60
2.702.80
2.903.00
3.103.20
J F M A M J J A S O N D J F M A M J J A S O N D J F M A M J J
Ret
ail P
rice
1.00
1.20
1.40
1.60
1.80
2.00
2.20
Raw
Milk
Cos
t
Raw Milk
Metro
Upstate
Raw milk cost = Class I price, Northeast Order @ Syracuse, adj. for bf, plus estimatedpremium.
Retail Price vs Raw Milk CostGallon Milk - 1/01 - 07/03
New YorkFigure 3
Source: NYS Department of Agriculture and Markets
Retail Price vs ThresholdUpstate - Gallon - 1/01-7/03
2001 2002 2003
New York
2.10
2.30
2.50
2.70
2.90
3.10
3.30
3.50
J F M A M J J A S O N D J F M A M J J A S O N D J F M A M J J
Threshold
Retail
Figure 4
Source: NYS Department of Agriculture and Markets
2001 2002 2003
2.30
2.50
2.70
2.90
3.10
3.30
3.50
3.70
J F M A M J J A S O N D J F M A M J J A S O N D J F M A M J J
Retail
Threshold
New YorkRetail Price vs ThresholdMetro - Gallon - 1/01 - 7/03
Source: NYS Department of Agriculture and Markets
Figure 5
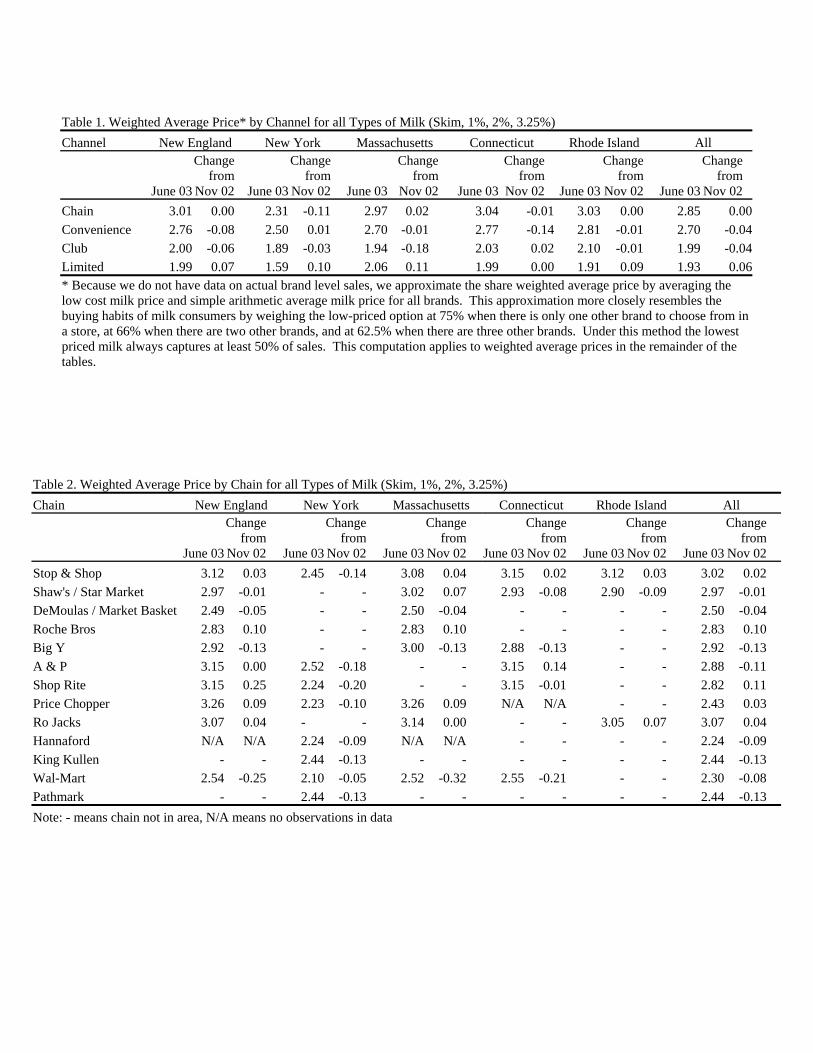
Table 1. Weighted Average Price* by Channel for all Types of Milk (Skim, 1%, 2%, 3.25%) Channel New England New York Massachusetts Connecticut Rhode Island All
June 03
Change from
Nov 02 June 03
Change from
Nov 02 June 03
Change from
Nov 02 June 03
Change from
Nov 02 June 03
Change from
Nov 02 June 03
Change from
Nov 02 Chain 3.01 0.00 2.31 -0.11 2.97 0.02 3.04 -0.01 3.03 0.00 2.85 0.00Convenience 2.76 -0.08 2.50 0.01 2.70 -0.01 2.77 -0.14 2.81 -0.01 2.70 -0.04Club 2.00 -0.06 1.89 -0.03 1.94 -0.18 2.03 0.02 2.10 -0.01 1.99 -0.04Limited 1.99 0.07 1.59 0.10 2.06 0.11 1.99 0.00 1.91 0.09 1.93 0.06* Because we do not have data on actual brand level sales, we approximate the share weighted average price by averaging the low cost milk price and simple arithmetic average milk price for all brands. This approximation more closely resembles the buying habits of milk consumers by weighing the low-priced option at 75% when there is only one other brand to choose from in a store, at 66% when there are two other brands, and at 62.5% when there are three other brands. Under this method the lowest priced milk always captures at least 50% of sales. This computation applies to weighted average prices in the remainder of the tables.
Table 2. Weighted Average Price by Chain for all Types of Milk (Skim, 1%, 2%, 3.25%) Chain New England New York Massachusetts Connecticut Rhode Island All
June 03
Change from
Nov 02 June 03
Change from
Nov 02 June 03
Change from
Nov 02 June 03
Change from
Nov 02 June 03
Change from
Nov 02 June 03
Change from
Nov 02 Stop & Shop 3.12 0.03 2.45 -0.14 3.08 0.04 3.15 0.02 3.12 0.03 3.02 0.02 Shaw's / Star Market 2.97 -0.01 - - 3.02 0.07 2.93 -0.08 2.90 -0.09 2.97 -0.01 DeMoulas / Market Basket 2.49 -0.05 - - 2.50 -0.04 - - - - 2.50 -0.04 Roche Bros 2.83 0.10 - - 2.83 0.10 - - - - 2.83 0.10 Big Y 2.92 -0.13 - - 3.00 -0.13 2.88 -0.13 - - 2.92 -0.13 A & P 3.15 0.00 2.52 -0.18 - - 3.15 0.14 - - 2.88 -0.11 Shop Rite 3.15 0.25 2.24 -0.20 - - 3.15 -0.01 - - 2.82 0.11 Price Chopper 3.26 0.09 2.23 -0.10 3.26 0.09 N/A N/A - - 2.43 0.03 Ro Jacks 3.07 0.04 - - 3.14 0.00 - - 3.05 0.07 3.07 0.04 Hannaford N/A N/A 2.24 -0.09 N/A N/A - - - - 2.24 -0.09 King Kullen - - 2.44 -0.13 - - - - - - 2.44 -0.13 Wal-Mart 2.54 -0.25 2.10 -0.05 2.52 -0.32 2.55 -0.21 - - 2.30 -0.08 Pathmark - - 2.44 -0.13 - - - - - - 2.44 -0.13 Note: - means chain not in area, N/A means no observations in data
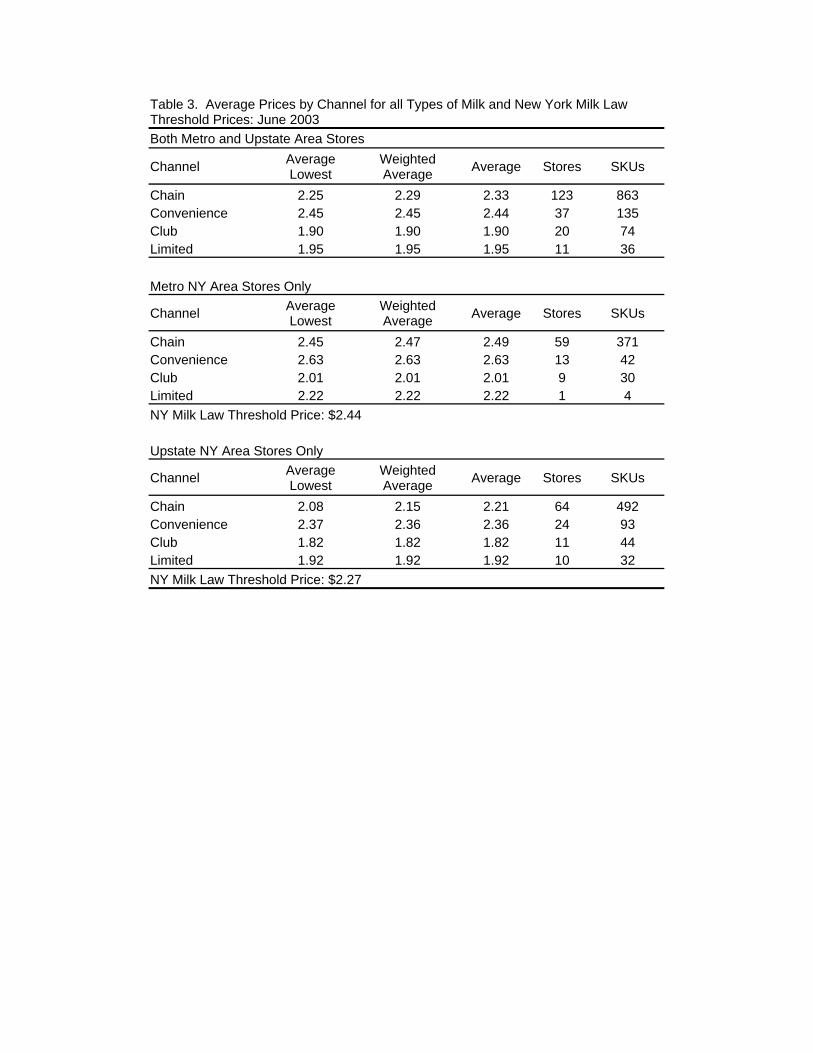
Table 3. Average Prices by Channel for all Types of Milk and New York Milk Law Threshold Prices: June 2003 Both Metro and Upstate Area Stores
Channel Average Lowest
Weighted Average Average Stores SKUs
Chain 2.25 2.29 2.33 123 863 Convenience 2.45 2.45 2.44 37 135 Club 1.90 1.90 1.90 20 74 Limited 1.95 1.95 1.95 11 36 Metro NY Area Stores Only
Channel Average Lowest
Weighted Average Average Stores SKUs
Chain 2.45 2.47 2.49 59 371 Convenience 2.63 2.63 2.63 13 42 Club 2.01 2.01 2.01 9 30 Limited 2.22 2.22 2.22 1 4 NY Milk Law Threshold Price: $2.44 Upstate NY Area Stores Only
Channel Average Lowest
Weighted Average Average Stores SKUs
Chain 2.08 2.15 2.21 64 492 Convenience 2.37 2.36 2.36 24 93 Club 1.82 1.82 1.82 11 44 Limited 1.92 1.92 1.92 10 32 NY Milk Law Threshold Price: $2.27
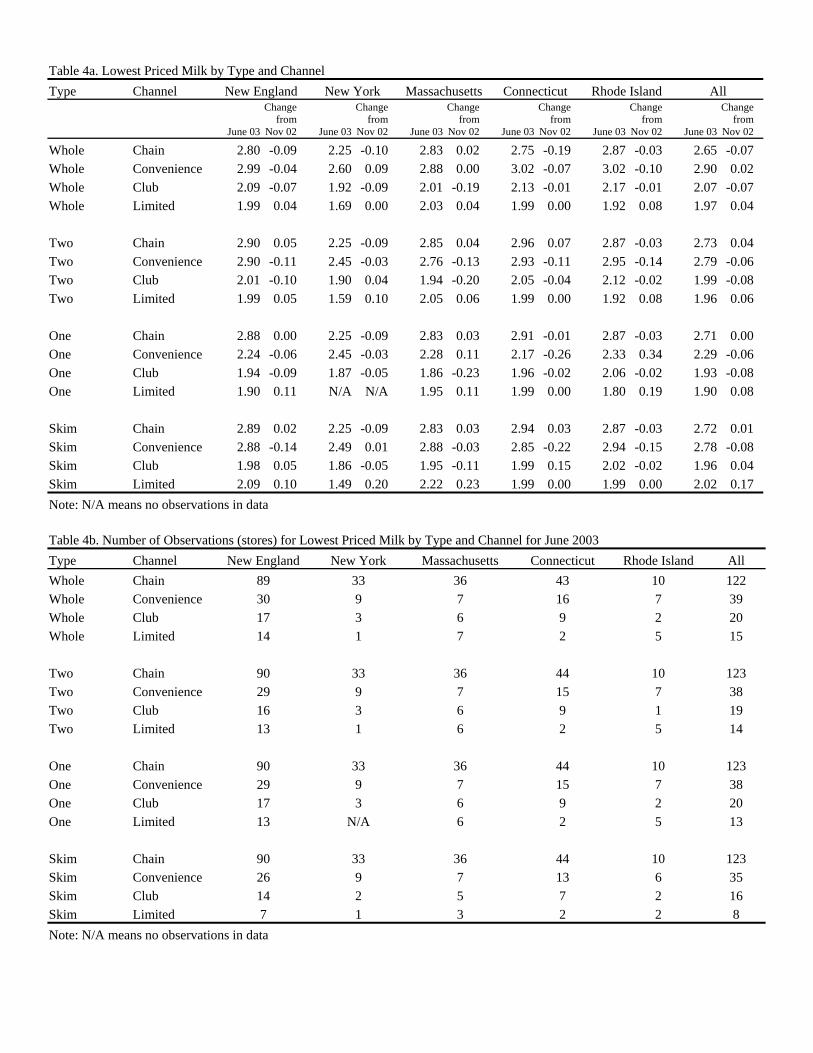
Table 4a. Lowest Priced Milk by Type and Channel Type Channel New England New York Massachusetts Connecticut Rhode Island All
June 03
Change from
Nov 02 June 03
Change from
Nov 02 June 03
Change from
Nov 02 June 03
Change from
Nov 02 June 03
Change from
Nov 02 June 03
Change from
Nov 02
Whole Chain 2.80 -0.09 2.25 -0.10 2.83 0.02 2.75 -0.19 2.87 -0.03 2.65 -0.07 Whole Convenience 2.99 -0.04 2.60 0.09 2.88 0.00 3.02 -0.07 3.02 -0.10 2.90 0.02 Whole Club 2.09 -0.07 1.92 -0.09 2.01 -0.19 2.13 -0.01 2.17 -0.01 2.07 -0.07 Whole Limited 1.99 0.04 1.69 0.00 2.03 0.04 1.99 0.00 1.92 0.08 1.97 0.04 Two Chain 2.90 0.05 2.25 -0.09 2.85 0.04 2.96 0.07 2.87 -0.03 2.73 0.04 Two Convenience 2.90 -0.11 2.45 -0.03 2.76 -0.13 2.93 -0.11 2.95 -0.14 2.79 -0.06 Two Club 2.01 -0.10 1.90 0.04 1.94 -0.20 2.05 -0.04 2.12 -0.02 1.99 -0.08 Two Limited 1.99 0.05 1.59 0.10 2.05 0.06 1.99 0.00 1.92 0.08 1.96 0.06 One Chain 2.88 0.00 2.25 -0.09 2.83 0.03 2.91 -0.01 2.87 -0.03 2.71 0.00 One Convenience 2.24 -0.06 2.45 -0.03 2.28 0.11 2.17 -0.26 2.33 0.34 2.29 -0.06 One Club 1.94 -0.09 1.87 -0.05 1.86 -0.23 1.96 -0.02 2.06 -0.02 1.93 -0.08 One Limited 1.90 0.11 N/A N/A 1.95 0.11 1.99 0.00 1.80 0.19 1.90 0.08 Skim Chain 2.89 0.02 2.25 -0.09 2.83 0.03 2.94 0.03 2.87 -0.03 2.72 0.01 Skim Convenience 2.88 -0.14 2.49 0.01 2.88 -0.03 2.85 -0.22 2.94 -0.15 2.78 -0.08 Skim Club 1.98 0.05 1.86 -0.05 1.95 -0.11 1.99 0.15 2.02 -0.02 1.96 0.04 Skim Limited 2.09 0.10 1.49 0.20 2.22 0.23 1.99 0.00 1.99 0.00 2.02 0.17 Note: N/A means no observations in data
Table 4b. Number of Observations (stores) for Lowest Priced Milk by Type and Channel for June 2003 Type Channel New England New York Massachusetts Connecticut Rhode Island All Whole Chain 89 33 36 43 10 122 Whole Convenience 30 9 7 16 7 39 Whole Club 17 3 6 9 2 20 Whole Limited 14 1 7 2 5 15 Two Chain 90 33 36 44 10 123 Two Convenience 29 9 7 15 7 38 Two Club 16 3 6 9 1 19 Two Limited 13 1 6 2 5 14 One Chain 90 33 36 44 10 123 One Convenience 29 9 7 15 7 38 One Club 17 3 6 9 2 20 One Limited 13 N/A 6 2 5 13 Skim Chain 90 33 36 44 10 123 Skim Convenience 26 9 7 13 6 35 Skim Club 14 2 5 7 2 16 Skim Limited 7 1 3 2 2 8 Note: N/A means no observations in data
Note: - means chain not in area, N/A means no observations in data
Table 5a. Lowest Priced Milk by Type and Chain Type Chain New England New York Massachusetts Connecticut Rhode Island All
June 03
Change from
Nov 02
June 03
Change from
Nov 02
June 03
Change from
Nov 02
June 03
Change from
Nov 02
June 03
Change from
Nov 02
June 03
Change from
Nov 02 Whole Stop & Shop 2.97 0.00 2.35 -0.18 2.94 0.03 3.00 -0.03 2.99 0.00 2.87 -0.02 Whole Shaw's / Star Market 2.75 -0.11 - - 2.92 0.08 2.55 -0.34 2.72 -0.17 2.75 -0.11 Whole DeMoulas / Market Basket 2.44 0.00 - - 2.44 0.00 - - - - 2.44 0.00 Whole Roche Bros 2.69 0.19 - - 2.69 0.19 - - - - 2.69 0.19 Whole Big Y 2.31 -0.67 - - 2.71 -0.33 2.12 -0.84 - - 2.31 -0.67 Whole A & P/ Waldbaums 2.96 -0.02 2.50 -0.16 - - 2.96 -0.05 - - 2.69 -0.14 Whole Shop Rite 3.06 0.30 2.17 -0.24 - - 3.06 0.30 - - 2.96 0.34 Whole Price Chopper 3.19 0.20 2.14 -0.04 3.19 0.20 N/A N/A - - 2.35 0.06 Whole Ro Jacks 2.89 0.06 - - 2.99 0.00 - - 2.86 0.11 2.89 0.06 Whole Hannaford N/A N/A 2.18 -0.06 N/A N/A - - - - 2.18 -0.06 Whole King Kullen - - 2.44 -0.13 - - - - - - 2.44 -0.13 Whole Wal-Mart Supercenter 2.58 -0.16 2.03 -0.04 2.47 -0.35 2.63 -0.06 - - 2.26 -0.02 Whole Pathmark - - 2.44 -0.13 - - - - - - 2.44 -0.13 Two Stop & Shop 2.96 -0.02 2.35 -0.12 2.90 -0.01 3.00 -0.02 2.99 0.00 2.86 -0.01 Two Shaw's / Star Market 2.88 0.01 - - 2.92 0.08 2.88 -0.01 2.72 -0.17 2.88 0.01 Two DeMoulas / Market Basket 2.44 0.00 - - 2.59 0.00 - - - - 2.59 0.00 Two Roche Bros 2.69 0.19 - - 2.69 0.19 - - - - 2.69 0.19 Two Big Y 2.90 0.11 - - 2.91 -0.10 2.90 0.21 - - 2.90 0.11 Two A & P / Waldbaums 2.96 -0.03 2.50 -0.16 - - 2.96 -0.07 - - 2.69 -0.14 Two Shop Rite 3.06 0.30 2.17 -0.24 - - 3.06 0.30 - - 2.70 0.08 Two Price Chopper 3.19 0.20 2.14 -0.04 3.19 0.20 N/A N/A - - 2.35 0.06 Two Ro Jacks 2.89 0.06 - - 2.99 0.00 - - 2.86 0.11 2.89 0.06 Two Hannaford N/A N/A 2.18 -0.06 N/A N/A - - - - 2.18 -0.06 Two King Kullen - - 2.44 -0.13 - - - - - - 2.44 -0.13 Two Wal-Mart Supercenter 2.47 -0.16 2.03 -0.03 2.47 -0.19 2.47 -0.14 - - 2.22 -0.03 Two Pathmark - - 2.44 -0.13 - - - - - - 2.44 -0.13 One Stop & Shop 2.97 0.00 2.35 -0.12 2.94 0.03 3.00 -0.01 2.99 0.00 2.87 0.00 One Shaw's / Star Market 2.79 -0.07 - - 2.92 0.08 2.66 -0.23 2.72 -0.17 2.79 -0.07 One DeMoulas / Market Basket 2.32 -0.13 - - 2.32 -0.13 - - - - 2.32 -0.13 One Roche Bros 2.69 0.19 - - 2.69 0.19 - - - - 2.69 0.19 One Big Y 2.89 -0.07 - - 2.90 -0.10 2.89 -0.06 - - 2.89 -0.07 One A & P / Waldbaums 2.96 -0.02 2.50 -0.16 - - 2.96 -0.05 - - 2.69 -0.14 One Shop Rite 3.06 0.30 2.17 -0.24 - - 3.06 0.30 - - 2.70 0.08 One Price Chopper 3.19 0.20 2.16 -0.02 3.19 0.20 N/A N/A - - 2.36 0.07 One Ro Jacks 2.89 0.06 - - 2.99 0.00 - - 2.86 0.11 2.89 0.06 One Hannaford N/A N/A 2.18 -0.06 N/A N/A - - - - 2.18 -0.06 One King Kullen - - 2.44 -0.13 - - - - - - 2.44 -0.13 One Wal-Mart Supercenter 2.34 -0.29 2.00 -0.05 2.34 -0.32 2.34 -0.27 - - 2.15 -0.10 One Pathmark - - 2.44 -0.13 - - - - - - 2.44 -0.13 Skim Stop & Shop 2.97 0.01 2.35 -0.12 2.94 0.03 3.00 -0.01 2.99 0.00 2.87 0.00 Skim Shaw's / Star Market 2.88 0.00 - - 2.92 0.07 2.88 -0.01 2.72 -0.17 2.88 0.00 Skim DeMoulas / Market Basket 2.34 -0.10 - - 2.34 -0.10 - - - - 2.34 -0.10 Skim Roche Bros 2.69 0.19 - - 2.69 0.19 - - - - 2.69 0.19 Skim Big Y 2.87 -0.06 - - 2.86 -0.10 2.87 -0.04 - - 2.87 -0.06 Skim A & P / Waldbaums 2.96 -0.02 2.50 -0.16 - - 2.96 -0.05 - - 2.69 -0.14 Skim Shop Rite 3.06 0.30 2.17 -0.24 - - 3.06 0.30 - - 2.70 0.08 Skim Price Chopper 3.19 0.20 2.14 -0.04 3.19 0.20 N/A N/A - - 2.35 0.06 Skim Ro Jacks 2.89 0.06 - - 2.99 0.00 - - 2.86 0.11 2.89 0.06 Skim Hannaford N/A N/A 2.18 -0.06 N/A - - - - - 2.18 -0.06 Skim King Kullen - - 2.44 -0.13 - N/A - - - - 2.44 -0.13 Skim Wal-Mart Supercenter 2.27 -0.26 2.00 -0.06 2.34 -0.19 2.24 -0.29 - - 2.12 -0.10 Skim Pathmark - - 2.44 -0.13 - - - - - - 2.44 -0.13
Note: - means chain not in area, N/A means no observations in data
Table 5b. Number of Observations (Stores) for Lowest Priced Milk by Type and Chain for June 2003 Type Chain New England New York Massachusetts Connecticut Rhode Island All Whole Stop & Shop 34 7 13 17 4 41 Whole Shaw's / Star Market 19 - 9 7 3 19 Whole DeMoulas / Market Basket 4 - 4 - - 4 Whole Roche Bros 3 - 3 - - 3 Whole Big Y 12 - 4 8 - 12 Whole A & P / Waldbaums 3 4 - 3 - 7 Whole Shop Rite 6 4 - 6 - 10 Whole Price Chopper 1 4 1 N/A - 5 Whole Ro Jacks 4 - 1 - 3 4 Whole Hannaford N/A 7 N/A - - 7 Whole King Kullen - 2 - - - 2 Whole Wal-Mart Supercenter 3 4 1 2 - 7 Whole Pathmark - 1 - - - 1 Two Stop & Shop 35 7 14 17 4 42 Two Shaw's / Star Market 19 - 9 7 - 19 Two DeMoulas / Market Basket 5 - 5 - - 5 Two Roche Bros 3 - 3 - - 3 Two Big Y 12 - 4 8 - 12 Two A & P / Waldbaums 3 4 - 3 - 7 Two Shop Rite 6 4 - 6 - 10 Two Price Chopper 1 4 1 N/A - 5 Two Ro Jacks 4 - 1 - - 4 Two Hannaford N/A 7 N/A - 7 Two King Kullen - 2 - - 2 Two Wal-Mart Supercenter 3 4 1 2 - 7 Two Pathmark - 1 - - 1 One Stop & Shop 34 7 13 17 4 41 One Shaw's / Star Market 19 - 9 7 3 19 One DeMoulas / Market Basket 4 - 4 - - 4 One Roche Bros 3 - 3 - - 3 One Big Y 12 - 4 8 - 12 One A & P / Waldbaums 3 4 - 3 - 7 One Shop Rite 6 4 - 6 - 10 One Price Chopper 1 4 1 N/A - 5 One Ro Jacks 4 - 1 - 3 4 One Hannaford N/A 7 N/A - - 7 One King Kullen - 2 - - - 2 One Wal-Mart Supercenter 3 4 1 2 - 7 One Pathmark - 1 - - - 1 Skim Stop & Shop 34 7 13 17 4 41 Skim Shaw's / Star Market 19 - 9 7 3 19 Skim DeMoulas / Market Basket 4 - 4 - - 4 Skim Roche Bros 3 - 3 - - 3 Skim Big Y 12 - 4 8 - 12 Skim A & P / Waldbaums 3 4 - 3 - 7 Skim Shop Rite 6 4 - 6 - 10 Skim Price Chopper 1 4 1 N/A - 5 Skim Ro Jacks 4 - 1 - 3 4 Skim Hannaford N/A 7 N/A - - 7 Skim King Kullen - 2 - - - 2 Skim Wal-Mart Supercenter 3 4 1 2 - 7 Skim Pathmark - 1 - - - 1
STATE OF NEW YORKDEPARTMENT OF AGRICULTURE AND MARKETS
I WINNERS CIRCLEALBANY, NEW YORK 12235
DIVISION OF MILK CONTROL AND DAIRY SERVICES 518-457-5731
TO: Retailers of Milk
DATE: May 23, 2003
SUBJECT: Announcement of threshold price relative to milk price gouging law,effective JUNE 2003
THRESHOLD PRICE
Threshold prices are unchanged from the previous month. For JUNE 2003, threshold prices formilk, lowfat milk, or skim milk offered for retail sale in the state are:
Half Gallon Gallon Quart
Metro Region: $2.44 $1.27 $.67 (NYC and Counties of Nassau,
Suffolk, Rockland, Westchester, Orange, Putnam and Dutchess)
Upstate Region: $2.27 $1.19 $.63 (Remaining Counties)
A retailer who sells above the threshold price may be in violation of the law unless such sellingprice is justified as not being unconscionably excessive. Such justification includes net invoiceprice paid for the milk item plus actual costs incurred in handling and selling that milk item.
Please be advised that the threshold price is only changed if there is at least a $0.02 per gallon($0.23/cwt) change in the underlying price for Class 1 (fluid) milk at 3.5% butterfat from theprevious month the threshold was calculated on, March (federal order Class 1 price: $12.96per cwt. at NYC and $12.31 at Syracuse). June marks the third consecutive month that thethreshold has remained the same.
STATE OF NEW YORKDEPARTMENT OF AGRICULTURE AND MARKETS
I WINNERS CIRCLEALBANY, NEW YORK 12235
DIVISION OF MILK CONTROL AND DAIRY SERVICES 518-457-5731
TO: Retailers of Milk
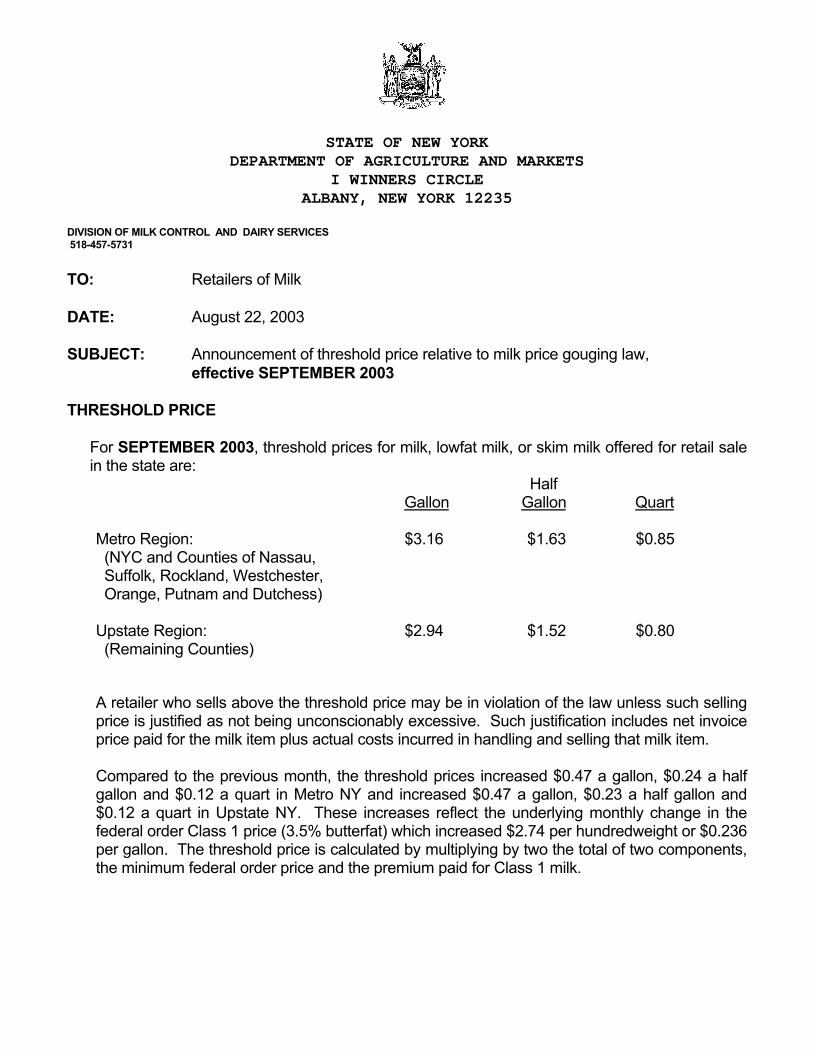
DATE: August 22, 2003
SUBJECT: Announcement of threshold price relative to milk price gouging law,effective SEPTEMBER 2003
THRESHOLD PRICE
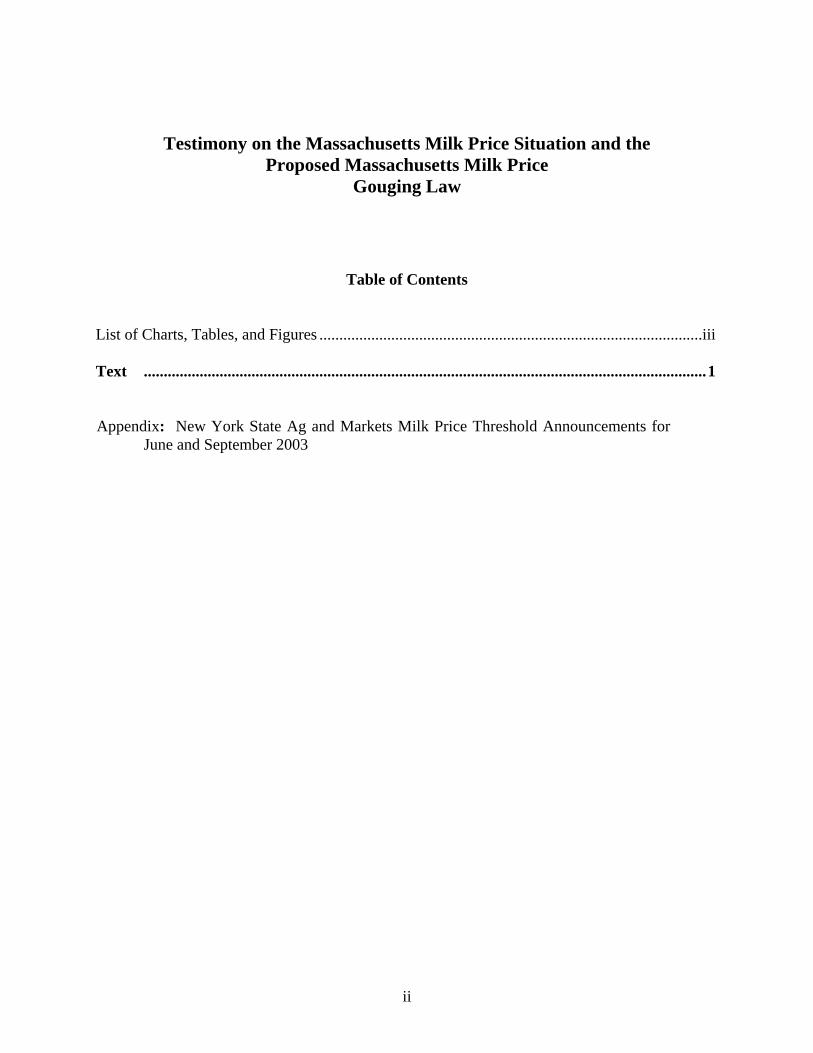
For SEPTEMBER 2003, threshold prices for milk, lowfat milk, or skim milk offered for retail salein the state are:
Half Gallon Gallon Quart
Metro Region: $3.16 $1.63 $0.85 (NYC and Counties of Nassau,
Suffolk, Rockland, Westchester, Orange, Putnam and Dutchess)
Upstate Region: $2.94 $1.52 $0.80 (Remaining Counties)
A retailer who sells above the threshold price may be in violation of the law unless such sellingprice is justified as not being unconscionably excessive. Such justification includes net invoiceprice paid for the milk item plus actual costs incurred in handling and selling that milk item.
Compared to the previous month, the threshold prices increased $0.47 a gallon, $0.24 a halfgallon and $0.12 a quart in Metro NY and increased $0.47 a gallon, $0.23 a half gallon and$0.12 a quart in Upstate NY. These increases reflect the underlying monthly change in thefederal order Class 1 price (3.5% butterfat) which increased $2.74 per hundredweight or $0.236per gallon. The threshold price is calculated by multiplying by two the total of two components,the minimum federal order price and the premium paid for Class 1 milk.