Embed Size (px)
Citation preview
Journal of Personality and Social Psychology1994, Vol. 66, No. 4, 762-775 Copyright 1994 by the American Psychological Association, Inc.
0022-3514/94/$3.00
Testing a Model for the Genetic Structure of Personality: A Comparisonof the Personality Systems of Cloninger and Eysenck
A. C. Heath, C. R. Cloninger, and N. G. Martin
Genetic analysis of data from 2,680 adult Australian twin pairs demonstrated significant geneticcontributions to variation in scores on the Harm Avoidance, Novelty Seeking, and Reward Depen-dence scales of Cloninger's Tridimensional Personality Questionnaire (TPQ), accounting for be-tween 54% and 61 % of the stable variation in these traits. Multivariate genetic triangular decompo-sition models were fitted to determine the extent to which the TPQ assesses the same dimensions ofheritable variation as the revised Eysenck Personality Questionnaire. These analyses demonstratedthat the personality systems of Eysenck and Cloninger are not simply alternative descriptions of thesame dimensions of personality, but rather each provide incomplete descriptions of the structure ofheritable personality differences.
Much research has been published on the factorial structureof personality, and many theories of personality structure havebeen propounded (e.g., Eysenck & Eysenck, 1969, 1976; Gray,1982; McCrae & Costa, 1989; Tellegen, 1985). Much of thiswork has used samples of unrelated individuals. However, agrowing body of data indicates an important contribution ofgenetic factors to personality differences (Eaves, Eysenck, &Martin, 1989; Loehlin, 1992). Support for the role of geneticfactors comes from studies using a variety of personality assess-ments, including studies of separated twins (Bouchard, Lykken,McGue, Segal, & Tellegen, 1990; Pedersen, Plomin, McClearn,& Friberg, 1988; Shields, 1962; Tellegen et al., 1988), of adopt-ees and their families (Loehlin, 1981; Loehlin, Willerman, &Horn, 1985; Scarr, Webber, Weinberg, & Wittig, 1981), of twinpairs reared together (Eaves et al., 1989; Rose & Kaprio, 1988;Rose, Koskenvuo, Kaprio, Sarna, & Langinvainio, 1988), andof twin pairs and their parents, siblings, and adult children(Eaves, Heath, Neale, Hewitt, & Martin, 1993), and using rat-ings by informants (Heath, Neale, Kessler, Eaves, & Kendler,1993) as well as self-report data. Although a genetic influenceon personality has been demonstrated for a wide range of per-sonality scales, attempts to formulate a parsimonious model for
A. C. Heath, Department of Psychiatry, Department of Psychology,and Department of Genetics, Washington University School of Medi-cine, C. R. Cloninger, Department of Psychiatry and Department ofGenetics, Washington University School of Medicine; N. G. Martin,Queensland Institute of Medical Research, Brisbane, Queensland, Aus-tralia.
Data collection was supported by Alcohol, Drug Abuse, and MentalHealth Administration (ADAMHA) Grant AA07728 and by a grantfrom the Australian National Health and Medical Research Council.Data analysis was also supported by ADAMHA Grants AA03539,AA07535, DA05588, MH31302, and MH40828.
We acknowledge the assistance of Sue Mason, Ann Eldridge, OliviaZhang, and the late Ulrich Kehren and the helpful comments of Greg-ory Carey and Kay Phillips.
Correspondence concerning this article should be addressed to A. C.Heath, Department of Psychiatry, Washington University School ofMedicine, 4940 Children's Place, St. Louis, Missouri 63110.
the underlying genetic structure of personality have been muchrarer than descriptions of the phenotypic structure. Becausequite different genetic and environmental factor structures mayunderlie the observed phenotypic structure of personality (e.g.,Heath & Martin, 1990; Kendler, Heath, Martin, & Eaves,1987), performing separate genetic analyses of personality fac-tors defined by phenotypic, that is, within-person, correlationsmay be quite misleading about the underlying genetic structureof personality (Heath & Martin, 1990; Heath, Neale, Hewitt,Eaves, & Fulker, 1989).
Cloninger (1986,1987,1988,1991) has proposed a three-fac-tor model for the structure of personality, which is hypothesizedto have a close correspondence with the underlying geneticstructure, and has developed a self-report questionnaire, theTridimensional Personality Questionnaire (TPQ; Cloninger,Przybeck, & Svrakic, 1991), to assess three postulated dimen-sions of personality: Harm Avoidance (HA), Novelty Seeking(NS), and Reward Dependence (RD). In this article, we use datafrom a mailed questionnaire survey of a large Australian twinsample to test whether scores on these personality dimensionsare indeed substantially influenced by genetic factors. We alsofit genetic models to self-report responses to the revised EysenckPersonality Questionnaire (EPQ-R; Eysenck, Eysenck, & Bar-rett, 1985) obtained from the same subjects in the same ques-tionnaire. The Eysenckian personality dimensions have beenextensively studied in genetic studies using twins and their fam-ily members (Eaves et al., 1989; Eaves et al., 1993), separatedtwin pairs (Pedersen et al., 1988), and adoptees (Scarr et al.,1981) and thus provide a basis for comparing the results fromthis study with results of other behavioral genetic surveys usinga variety of different research designs. We fit multivariate ge-netic models (Heath, Neale, et al., 1989; Martin & Eaves, 1977;Neale & Cardon, 1992) to determine the extent to which theTPQ assesses the same dimensions of genetic variation as theEPQ-R (Eysenck & Eysenck, 1976; Eysenck et al., 1985) andthe extent to which it assesses new dimensions of genetic vari-ability (cf. Martin, Eaves, & Fulker, 1979). The methods that weuse have broad applicability in research aimed at simplifyingour understanding of the structure of personality from an etio-logic perspective.
762
TESTING A MODEL OF GENETIC STRUCTURE 763
Method
Sample
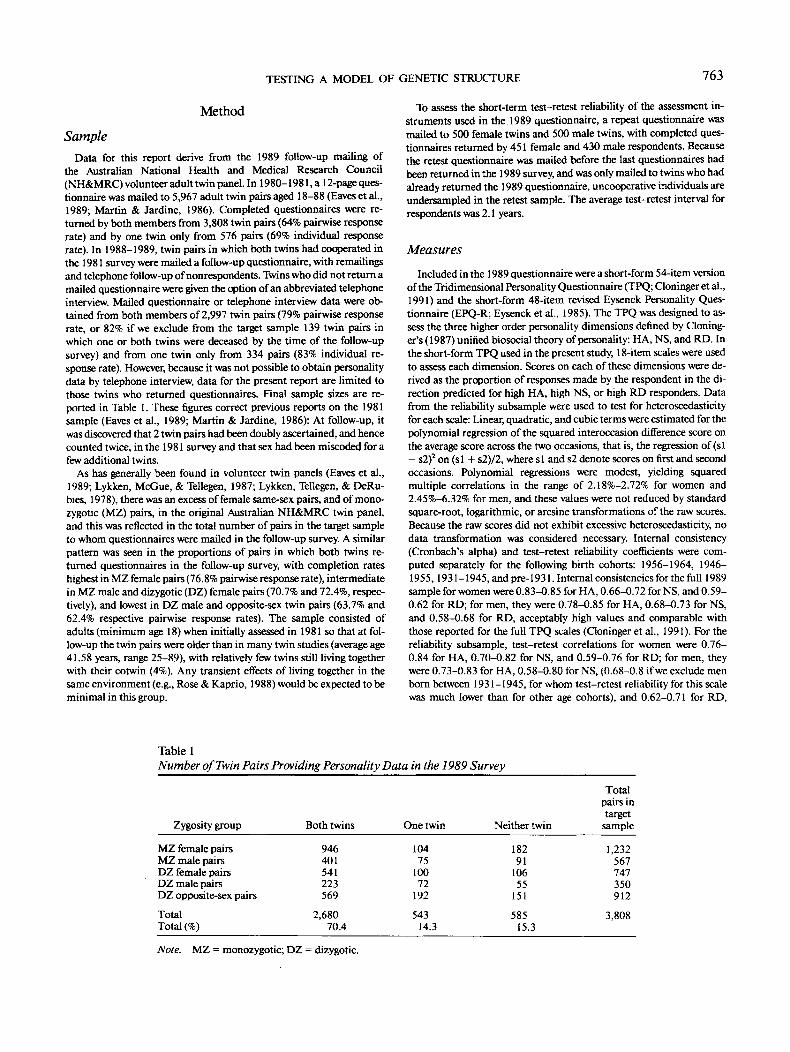
Data for this report derive from the 1989 follow-up mailing ofthe Australian National Health and Medical Research Council(NH&MRC) volunteer adult twin panel. In 1980-1981, a 12-page ques-tionnaire was mailed to 5,967 adult twin pairs aged 18-88 (Eaves et al.,1989; Martin & Jardine, 1986). Completed questionnaires were re-turned by both members from 3,808 twin pairs (64% pairwise responserate) and by one twin only from 576 pairs (69% individual responserate). In 1988-1989, twin pairs in which both twins had cooperated inthe 1981 survey were mailed a follow-up questionnaire, with remailingsand telephone follow-up of nonrespondents. Twins who did not return amailed questionnaire were given the option of an abbreviated telephoneinterview. Mailed questionnaire or telephone interview data were ob-tained from both members of 2,997 twin pairs (79% pairwise responserate, or 82% if we exclude from the target sample 139 twin pairs inwhich one or both twins were deceased by the time of the follow-upsurvey) and from one twin only from 334 pairs (83% individual re-sponse rate). However, because it was not possible to obtain personalitydata by telephone interview, data for the present report are limited tothose twins who returned questionnaires. Final sample sizes are re-ported in Table 1. These figures correct previous reports on the 1981sample (Eaves et al., 1989; Martin & Jardine, 1986): At follow-up, itwas discovered that 2 twin pairs had been doubly ascertained, and hencecounted twice, in the 1981 survey and that sex had been miscoded for afew additional twins.
As has generally been found in volunteer twin panels (Eaves et al.,1989; Lykken, McGue, & Tellegen, 1987; Lykken, Tellegen, & DeRu-bies, 1978), there was an excess of female same-sex pairs, and of mono-zygotic (MZ) pairs, in the original Australian NH&MRC twin panel,and this was reflected in the total number of pairs in the target sampleto whom questionnaires were mailed in the follow-up survey. A similarpattern was seen in the proportions of pairs in which both twins re-turned questionnaires in the follow-up survey, with completion rateshighest in MZ female pairs (76.8% pairwise response rate), intermediatein MZ male and dizygotic (DZ) female pairs (70.7% and 72.4%, respec-tively), and lowest in DZ male and opposite-sex twin pairs (63.7% and62.4% respective pairwise response rates). The sample consisted ofadults (minimum age 18) when initially assessed in 1981 so that at fol-low-up the twin pairs were older than in many twin studies (average age41.58 years, range 25-89), with relatively few twins still living togetherwith their cotwin (4%). Any transient effects of living together in thesame environment (e.g., Rose & Kaprio, 1988) would be expected to beminimal in this group.
To assess the short-term test-retest reliability of the assessment in-struments used in the 1989 questionnaire, a repeat questionnaire wasmailed to 500 female twins and 500 male twins, with completed ques-tionnaires returned by 451 female and 430 male respondents. Becausethe retest questionnaire was mailed before the last questionnaires hadbeen returned in the 1989 survey, and was only mailed to twins who hadalready returned the 1989 questionnaire, uncooperative individuals areundersampled in the retest sample. The average test-retest interval forrespondents was 2.1 years.
Measures
Included in the 1989 questionnaire were a short-form 54-item versionof the Tridimensional Personality Questionnaire (TPQ; Cloninger et al.,1991) and the short-form 48-item revised Eysenck Personality Ques-tionnaire (EPQ-R; Eysenck et al., 1985). The TPQ was designed to as-sess the three higher order personality dimensions denned by Cloning-er's(1987) unified biosocial theory of personality: HA, NS, and RD. Inthe short-form TPQ used in the present study, 18-item scales were usedto assess each dimension. Scores on each of these dimensions were de-rived as the proportion of responses made by the respondent in the di-rection predicted for high HA, high NS, or high RD responders. Datafrom the reliability subsample were used to test for heteroscedasticityfor each scale: Linear, quadratic, and cubic terms were estimated for thepolynomial regression of the squared interoccasion difference score onthe average score across the two occasions, that is, the regression of (si— s2)2 on (si + s2)/2, where si and s2 denote scores on first and secondoccasions. Polynomial regressions were modest, yielding squaredmultiple correlations in the range of 2.18%-2.72% for women and2.45%-6.32% for men, and these values were not reduced by standardsquare-root, logarithmic, or arcsine transformations of the raw scores.Because the raw scores did not exhibit excessive heteroscedasticity, nodata transformation was considered necessary. Internal consistency(Cronbach's alpha) and test-retest reliability coefficients were com-puted separately for the following birth cohorts: 1956-1964, 1946-1955,1931-1945,and pre-1931. Internal consistencies forthe full 1989sample for women were 0.83-0.85 for HA, 0.66-0.72 for NS, and 0.59-0.62 for RD; for men, they were 0.78-0.85 for HA, 0.68-0.73 for NS,and 0.58-0.68 for RD, acceptably high values and comparable withthose reported for the full TPQ scales (Cloninger et al., 1991). For thereliability subsample, test-retest correlations for women were 0.76-0.84 for HA, 0.70-0.82 for NS, and 0.59-0.76 for RD; for men, theywere 0.73-0.83 for HA, 0.58-0.80 for NS, (0.68-0.8 if we exclude menborn between 1931-1945, for whom test-retest reliability for this scalewas much lower than for other age cohorts), and 0.62-0.71 for RD,
Table 1Number of Twin Pairs Providing Personality Data in the 1989 Survey
Zygosity group
MZ female pairsMZ male pairsDZ female pairsDZ male pairsDZ opposite-sex pairs
TotalTotal (%)
Both twins
946401541223569
2,68070.4
One twin
10475
10072
192
54314.3
Neither twin
18291
10655
151
58515.3
Totalpairs intargetsample
1,232567747350912
3,808
Note. MZ = monozygotic; DZ = dizygotic.
764 A. HEATH, C. CLONINGER, AND N. MARTIN
indicating good short-term stability of these variables. These reliabilitycoefficients were a little smaller than 6-month test-retest reliability co-efficients reported for a U.S. national probability sample (Cloninger etal., 1991), which was to be expected because we used shorter scales anda longer 2-year follow-up interval. No sex difference was observed forNS (mean scores of 0.4 for women and 0.41 for men), but women scoredhigher than men on both HA (0.44 vs. 0.33) and RD (0.64 vs. 0.55);these findings are consistent with U.S. normative data for Whites (Clo-ninger etal., 1991).
The short-form EPQ-R (Eysenck et al., 1985) assesses the Eysenckianpersonality dimensions of Extraversion (E); Neuroticism (N); SocialConformity, or Lie (L) and Toughmindedness, or Psychoticism (P)(Eysenck & Eysenck, 1985). The E and N items and most L items are asubset of the items of the original EPQ (Eysenck & Eysenck, 1975), butthe P scale has changed markedly from the EPQ (Eysenck & Eysenck,1976; Eysenck et al., 1985). Raw scores were computed in the samemanner as for the TPQ. Tests for heteroscedasticity using the reliabilitysubsample indicated modest heteroscedasticity for E, N, and L (R2 =3.97%-6.52% for women and 3.82%-7.92% for men), which was notreduced by standard data transformations. Heteroscedasticity for P wasmore pronounced (R2 = 13.3% for women and 9.75% for men), proba-bly reflecting the very low endorsement frequencies of the items of theP scale, even in its revised version, but again was not reduced by stan-dard data transformations. Internal consistency coefficients for the full1989 sample for women were 0.85-0.87 for E, 0.81-0.84 for N, 0.70-0.74 for L, and 0.31-0.44 for P; for men, they were 0.85-0.87 for E,0.82-0.83 for N, 0.71-0.78 for L, and 0.36-0.46 for P. Correspondingtest-retest reliability coefficients for the reliability subsample forwomen were 0.75-0.86 for E, 0.72-0.86 for N, 0.69-0.83 for L, and0.37-0.71 for P (with test-retest correlations for P in the range of 0.62-0.71 for those born after 1930); for men, they were 0.83-0.87 for E,0.76-0.82 for N, 0.72-0.81 for L, and 0.41 -0.72 for P (again with test-retest correlations for P falling in the more acceptable range of 0.61-0.72, for those born after 1930). We note that the revised P scale per-forms poorly in this general population sample, having low internal con-sistency and low test-retest reliability, particularly in older respondents.Mean scores of female respondents were higher than for male respon-dents for N (0.41 vs. 0.32) and L (0.54 vs. 0.47); no sex difference wasobserved for E (0.57 in both sexes), and men obtained higher scores forP (0.13 for women vs. 0.19 for men).
Representativeness of Sample
Estimates of genetic and environmental parameters from twin datacan be seriously biased if sampling is nonrandom with respect to thetraits under study (e.g., Lykken, McGue, & Tellegen, 1987; Martin &Wilson, 1982; Neale, Eaves, Kendler, & Hewitt, 1989). In the presentstudy, the original twin panel was a volunteer panel, and the only twinpairs included in the 1989 mailing were those pairs in which both twinshad responded to the original 1981 survey. Thus, nonrepresentativesampling could arise because (a) the distribution of personality scoresfor twins who volunteered for the NH&MRC twin panel was unrepre-sentative of personality scores for the general population, (b) there wasan association between personality and nonresponse to the 1981 ques-tionnaire mailing, or (c) there was an association between personalityand nonresponse to the 1989 questionnaire mailing.
There are no Australian norms for the TPQ or EPQ-R with whichour data can be compared, but normative data were available for the1981 survey using the EPQ and did not indicate any deviation fromrandom sampling with respect to personality traits in the original survey(Martin & Jardine, 1986). In contrast with studies of samples of unre-lated individuals, data on twin pairs can provide important informationabout representativeness of sampling (e.g., Heath, Neale, et al., 1989;Neale & Cardon, 1992), even where no normative population data are
available. Most plausible forms of nonrandom sampling will lead todifferences in mean and variance of personality scores between MZ andDZ pairs, differences that are not predicted under most genetic models(Heath, Neale, et al., 1989; Neale & Cardon, 1992). In testing for suchdifferences, we ignored the nonindependence of observations frommembers of a twin pair. Our tests are therefore conservative, tending tofind significant differences when none are present. In female respon-dents from same-sex pairs, no zygosity differences in mean or variancewere found for any of the TPQ or EPQ-R scales. In male same-sex pairs,MZ twins obtained lower NS scores (0.39 vs. 0.43 for DZ twins), t( 1384)= 3.94, p < .001; lower P scores (0.18 vs. 0.20), t( 1392) = 2.72, p < .001;and higher L scores (0.49 vs. 0.46), /(1390) = 2.51, p = .01; however,no significant differences in variance were found. Female twins fromopposite-sex pairs had lower L scores than female same-sex twins (0.52vs. 0.55), f(3855) = 3.50, p < .001, but did not differ on any of the otherscales. Male twins who were reared with a female cotwin had signifi-cantly higher scores on both HA (0.36 vs. 0.32), /(2024) = 3.66, p <.001, and N (0.35 vs. 0.31), r(2027) = 3.69, p < .001, and a slightly lowerL score (0.45 vs. 0.48), f(2026) = 2.04, p < .04.
A more direct check on the representativeness of our sample was pro-vided by the comparison of twins whose cotwin did not cooperate inthe study with twins from pairs concordant for study participation. Ifpersonality differences on a given dimension are associated with differ-ences in cooperativeness, we would expect to observe significantlyhigher (or lower) scores on that dimension of the twins from the pairsdiscordant for cooperation (Heath, Neale, et al., 1989; Neale & Cardon,1992). In the 1989 data, no significant mean differences were found foreither TPQ or EPQ-R scores in women, and in men a significant differ-ence was found only for the EPQ-R P scale (M = 0.19 in twins fromconcordant cooperative pairs and M = 0.21 in twins with uncooperativecotwins). This difference was only of marginal significance, £(2029) =2.00, p = .05, but in the expected direction, with twins with uncooper-ative cotwins being more Toughminded. There was also an elevatedvariance in N scores in male twins from discordant pairs (s2 = 0.30)compared with twins from concordant cooperative pairs (s2 = 0.26),.F( 1911, 116) = 1.31, p = .04, raising the possibility that extremely sta-ble men and extremely unstable men were underrepresented in the sam-ple; however, this difference was again of marginal significance. No othervariance differences were found for any other scale for men, nor wereany variance differences found for women.
These sampling checks indicate that we may have good confidence inthe representativeness of our sample of female twins. The most directtest, comparing twins from pairs concordant versus discordant for studyparticipation, suggests that the male twins are representative of the gen-eral population for all scales except the P scale, and here the meandifference is probably too slight to lead to a substantial bias in estimatesof genetic and environmental parameters. However, the significant zy-gosity differences in mean for the male twins from like-sex and opposite-sex pairs indicates the possibility of nonrepresentative sampling or otherprocesses not captured by our simple genetic models. These meandifferences were small, however.
Data Summary
Because members of a twin pair share the same age, age effects willinflate the correlations between MZ and between DZ twin pairs equallyand thus will mimic the effects of shared environment (Eaves et al.,1989). To test for such effects, linear, quadratic, and cubic terms of thepolynomial regression of respondents' scores on age were computed foreach scale, separately for each sex. With the exception of NS, L, and, inmen only, P, all regressions were either nonsignificant or yielded squaredmultiple correlations of less than 2%, values too small to bias estimatesof genetic and environmental parameters. Age regressions for NS, L,and P were highly significant, with squared multiple correlations in the
TESTING A MODEL OF GENETIC STRUCTURE 765
range of 4.0%-8.3%, and so for these scales we used age-corrected scores(i.e., residual scores from the polynomial regression on age).
For univariate genetic analyses of each personality scale, 2X2 covar-iance matrices were computed for each zygosity group, giving the vari-ance and covariance of first and second twins from pairs with completedata for that scale. Twins were assigned as first or second twins randomlyin the case of same-sex pairs, but opposite-sex pairs were reordered sothat the first twin was always the female twin (Heath, Neale, et al., 1989).For multivariate genetic analyses, 14 X 14 covariance matrices werecomputed for each zygosity group, giving the variances and covariancesof the scores of first and second twins on the three TPQ and four EPQ-R scales, using listwise deletion of missing data.
Univariate Genetic Analyses
Univariate genetic models were fitted to twin pair covariance matri-ces by the method of maximum likelihood using LISREL 7.20 (Jore-skog & Sorbom, 1988; Heath, Neale, et al., 1989; Neale & Cardon,1992; Neale, Heath, Hewitt, Eaves, & Fulker, 1989). In brief, followingbiometrical genetic theory (e.g., Bulmer, 1980; Fisher, 1918; Mather &Jinks, 1971), we can decompose the observed variance in a trait intoproportions due to the additive effects of multiple genetic loci (A), tononadditive genetic effects (genetic dominance or epistatic, i.e. multi-plicative, interactions between loci; D), to shared environmental effects(C), and to within-family environmental effects (E), which make evenan identical twin differ from his or her cotwin. In terms of structuralequations, we have
Pi = eEj + j + dDi;
and
VP = e2 + c2 + h2 + d2,
where P; is the phenotype (e.g., personality score, scaled as a deviationfrom zero) of the rth twin (i = 1,2), and genetic and environmentaldeviations A, D, C, and E are assumed to be standardized with zeromean and unit variance; VP is the phenotypic variance. Path coeffi-cients e, c, h, and d were constrained to be equal in first and secondtwins, and in MZ and DZ twins of the same sex, but in some models wedid allow values of these parameters to vary as a function of sex. Frombiometric genetic theory, the covariances of the additive genetic devia-tions (Ai) and nonadditive genetic deviations (Ds) will be unity in MZtwin pairs and, assuming random mating for personality traits (i.e., notendency for the genetic deviations of spouse pairs to be correlated withrespect to personality traits), will be 0.5 and 0.25, respectively, in DZtwin pairs. The covariance of additive and dominance effects Ai and D,,both within individuals and between pairs, will be zero. By definition,the covariance of shared environmental effects (Q) will be unity, andthat of within-family environmental effects (E;) zero, in both MZ andDZ pairs. Thus, our model implies the assumption that the environ-ments of MZ pairs are no more highly correlated than the environmentsof DZ pairs, at least as far as concerns those environmental influencesthat determine personality variation in the age group and populationunder study (Heath, Neale, et al., 1989). In cross-sectional data, within-family environmental effects will include measurement error effectsthat are uncorrelated between members of a twin pair. Shared andwithin-family environmental effects are assumed to be mutually uncor-related and to be uncorrelated with either additive or nonadditive ge-netic effects. This latter assumption implies no genotype-environmentcorrelation (Eaves, Last, Martin, & Jinks, 1977; Plomin, DeFries, &Loehlin, 1977), for example, no tendency for individuals with a geneticpredisposition to high HA to be especially likely to experience anxio-genic (i.e., HA inducing) environments. For those personality traits thathave been extensively studied, E and N, the assumptions of randommating and no genotype-environment correlation appear to be well
supported by the data from twin family studies and adoption studies(Eaves etal., 1989; Eaves etal., 1993; Scarr etal., 1981), and we antici-pate that this will also prove to be the case for the personality dimen-sions of the TPQ.
In model fitting, we compared the fit of three basic models: a nonge-netic model (e, c), an additive genetic model (e, h), and a full geneticmodel allowing for both additive and nonadditive genetic effects (e, h,d). These three models assumed no heterogeneity of parameters as afunction of sex. In addition, each model was elaborated by allowingfor (a) an overall sex difference in variance, estimating sex-dependentparameters with the constraint em = k ef, c™ = k Cf, hm = k hr and dm =k df) where k2 gives the ratio of the phenotypic variance in men to thatin women; (b) estimating separate genetic and environmental parame-ters for each sex (implying a Genotype X Sex interaction), or (c) allow-ing also either the covariance of additive genetic effects in opposite-sexpairs (rG) or the covariance of shared environmental effects (rc) to beestimated as a free parameter (Eaves, 1977; Heath, Neale, et al., 1989;Neale & Cardon, 1992). Model c allows for the possibility that, in addi-tion to sex differences in the magnitude of genetic and environmentaleffects, some gene effects, or some shared environmental effects, are sexspecific. We did not attempt to fit a model that constrained all geneticeffects to be nonadditive because this would have no sensible biologicalinterpretation (Mather & Jinks, 1971). In data on twin pairs reared to-gether, if there is genetic variation, the effects of genetic nonadditivityand shared environment are confounded, the former tending to produceDZ twin correlations less than one half the MZ correlations and thelatter to inflate the DZ correlation to be greater than one half the MZcorrelation (Martin, Eaves, Kearsey, & Davies, 1978). Thus, we couldnot include both shared environmental effects and nonadditive geneticeffects in the same model. However, the absence of evidence for sharedenvironmental influences on personality variation from separated twinand adoption studies (Bouchard et al., 1990; Loehlin et al., 1985; Ped-ersen et al., 1988; Tellegen et al., 1988; Scarr et al., 1981) suggests thatthis confounding will not be an important problem.
Models were fitted to twin pair covariance matrices by the method ofmaximum likelihood, using LISREL (Jdreskog & Sorbom, 1988). Thegoodness of fit of models was compared by chi-square test, and nestedmodels were compared by likelihood ratio chi-square test (Neale & Car-don, 1992; Neale, Heath, et al., 1989). Parameter estimates under thebest-fitting model or models for each personality trait are reported instandardized form, restandardizing the total expected variance in eachsex to unity, for example, in the case of male parameters, as h'm = (h2,^VPm)°5, etc., where VPm = e2
m + c2m + h2
m+ d2m. In some cases we
report the proportion of stable variation accounted for by additive andnonadditive genetic factors (h'2 + d'2)/( 1 - R), where if is the test-retestreliability coefficient for a scale, estimated separately for each sex.
Multivariate Genetic Triangular Decomposition
Although univariate genetic analysis provides estimates of the contri-butions of additive and nonadditive genetic and within-family environ-mental effects to variation in each of our personality constructs, it tellsus nothing about the extent to which different measures of personalityare assessing the same dimensions of genetic or environmental varia-tion. The recent proliferation of personality instruments in genetic stud-ies (e.g., Bouchard et al., 1990; Pedersen et al., 1991; Tellegen et al.,1988) has not been accompanied by an attempt to determine whetherthese instruments assess new dimensions of genetic variability. Merelyexamining within-person correlations between personality traits maytell us little about this question: the observed "phenotypic" structureof personality may be quite different from the underlying genetic andenvironmental structures (Cloninger, 1987; Heath & Martin, 1990). In-stead, we have used methods of multivariate genetic analysis (e.g.,Heath, Neale, et al., 1989; Martin & Eaves, 1977; Neale & Cardon,
766 A. HEATH, C. CLONINGER, AND N. MARTIN
1992) to address this question. Whereas a conventional univariate ge-netic analysis utilizes only correlations between relatives within traits,and a conventional factor analysis only correlations within persons be-tween traits, in a multivariate genetic analysis the additional informa-tion contained in the cross-correlations between relatives for differenttraits allows us to determine the extent to which genetic influences areshared in common by several traits, or are trait specific.
The inheritance of the Eysenckian personality dimensions of E, N,and L has been extensively investigated (e.g., Eaves et al., 1989; Eaves etal., 1993; Heath, Eaves, & Martin, 1989; Heath, Jardine, & Martin,1989; Heath & Martin, 1990; Heath, Jardine, Eaves, & Martin, 1988;Pedersenetal., 1988; Rose etal., 1988;Scarretal., 1981). Although theselection of items that define operationally the P construct has changedmarkedly over time (e.g., Eysenck & Eysenck, 1975, 1976; Eysenck etal., 1985), twin studies of versions of the P scale prior to the EPQ-R havealso confirmed significant genetic influence for P (Eaves & Eysenck,1977; Eaves et al., 1989). (However, the precise interpretation of thedimensions of genetic variability underlying responses to the P scaleremains a matter of some dispute; Heath & Martin, 1990). In the pres-ent paper, therefore, we wished to consider not only the heritability ofthe personality constructs of the TPQ, but also the extent to which theseconstructs are assessing new dimensions of genetic variability (cf. Mar-tin, Eaves, & Fulker, 1979). To address these questions, we have fittedtriangular decomposition genetic models (Neale & Cardon, 1992) tothe 14 X 14 twin pair covariance matrices for the EPQ-R and TPQpersonality dimensions. As in the univariate genetic analyses, modelswere fitted to the covariance matrices for the five zygosity groups, allow-ing for sex-dependent parameters.
Under the most general triangular decomposition model, with sevenpersonality variables, we would estimate seven sets of orthogonal addi-tive genetic factors (A! • • • A7), dominance genetic factors (D, etc.),shared environmental factors ( d etc.), and within-family environmen-tal factors (E[ etc.). Variances and covariances of latent genetic and en-vironmental factors between twin pairs will be the same as in the uni-variate genetic case. Our structural equations now will be
P,i = e,,El + c,,C, + h,,A, + duD,,
P2i = e2,E, + c21C, + h21A, + d21D, + e22E2 + c22Q> + h22A2 + d21D2,
P3i = e3IE, + c3|C, + h31A, + d31Di + e32E2 + c32C2 + h32A2 + d31D2
+ e33E3 + C33C3 + h33A3 + d33D3,
and so on. Here Pn denotes the first personality variable of Twin / (1 = 1or 2), P2i denotes the second personality variable, and so on, with thefirst within-family environmental, first shared environmental, first ad-ditive genetic, and first nonadditive genetic factors allowed to have non-zero loadings on all seven personality variables; the second set of factorshaving nonzero loadings on all except the first personality variable; thethird set of factors having nonzero loadings on all except the first twopersonality variables and so on. Thus, our matrices of factor loadingswill be triangular in form. In the most general model, matrices of ge-netic and environmental loadings are unconstrained; that is, there is norequirement that the pattern of genetic factor loadings should mirrorthe pattern of en vironmental factor loadings, nor indeed that the patternof nonadditive genetic loadings should be the same as the pattern ofadditive genetic loadings. In some analyses, however, we constrainednonadditive genetic loadings on some factors to be a multiple of corre-sponding additive genetic loadings on that factor (i.e., di_i = k, hi,,,;' =1,7; dj?2 = k2 h j2, j = 2, • • • 7, and so on), that is, constrained the patternof additive and nonadditive genetic loadings on a factor to be similar. Asin univariate genetic analyses, genetic and environmental factor load-ings were constrained to be equal in first and second twins, and in MZand DZ twins, but were allowed to differ between sexes.
When a full seven-factor model is fitted, and all parameters of the
model are identified, the ordering of the personality variables will bearbitrary, with different orderings giving the same goodness of fit by chi-square test; but in submodels estimating fewer than seven factors for oneor more sources of variability (i.e., counting within-family environmen-tal effects, additive genetic effects, nonadditive genetic effects, andshared environmental effects each as one source of variability) this willno longer be the case. Furthermore, as in the univariate genetic case,with data on only twin pairs reared together, we cannot estimate simul-taneously seven nonadditive genetic and seven shared environmentalfactors; as a consequence of this, seven-factor solutions with differentorderings of personality variables will not necessarily give identical fitsto the data. Likewise, as a consequence of the inclusion of opposite-sextwin pairs in these analyses, sex differences in genetic or environmentalfactor loadings may lead to different fits for seven-factor solutions withdifferent orderings of variables (K. Phillips, 1993, personal communi-cation). Because we were interested in determining the extent to whichthe TPQ assesses new dimensions of genetic (or environmental) vari-ability, we ordered the personality variables so that the EPQ-R traits (E,N, L, and P) preceded the TPQ traits (HA, NS, and RD). Thus, our firstadditive genetic factor would assess the extent to which additive geneticinfluences on E also affected responses to the remaining six personalityvariables; the second genetic factor would assess how much additive ge-netic influences on N also determined responses to the remaining fivepersonality variables, after allowing for the first dimension of geneticvariability associated with E, and so on, with similar interpretations forthe nonadditive genetic and within-family environmental factors. Wedescribe this analysis as predicting scales of the TPQ from scales (orgenetic and environmental factors) of the EPQ-R. For each of the TPQscales, the sum of the squared loadings on genetic or EnvironmentalFactors 1 -4 gives the total genetic variance (or environmental variance)in the scale that is accounted for by genetic factors (or by environmentalfactors) that also influence the EPQ-R scales, and the sum of the squaredloadings on the remaining factors gives the residual genetic or environ-mental variance for the scale that is not accounted for by the EPQ-R.We also repeated the analysis reordering the data so that the TPQ scalespreceded the EPQ-R scales to determine the proportion of the total ge-netic or environmental variance in each EPQ scale that was accountedfor by genetic or environmental factors assessed by the TPQ (i.e., pre-dicting the scales of the EPQ-R from the scales of the TPQ). We notethat in cross-sectional data, as in the univariate genetic case, the within-family environmental loadings E n and so forth will also be inflated bymeasurement error effects. In contrast with the conventional commonfactor and genetic factor models (e.g., Heath, Neale, et al., 1989; Martin& Eaves, 1977; Neale & Cardon, 1992), the full seven-factor triangulardecomposition model does not distinguish between common factor andspecific factor variance and does not estimate specific factor effects forany variable except the final (seventh) personality variable. In this re-gard fitting a multivariate genetic triangular decomposition model ismore closely related to principal-components analysis (Morrison, 1976)than to factor analysis. We therefore adjusted our estimate of the resid-ual within-family environmental variance for a scale by subtracting anestimate of the error variance for that scale, obtained as (1 - R), whereR is the test-retest correlation for that scale.
In addition to assessing the parameter estimates and goodness-of-fitchi-square under the full unconstrained seven-factor triangular decom-position model, we also fitted submodels in which loadings on the firstthree nonadditive genetic factors (predicting the EPQ-R from the TPQ)or first two or four factors (predicting the TPQ from the EPQ-R) wereconstrained to be multiples of the loadings on the corresponding addi-tive genetic factors. No constraints were imposed on additive and non-additive genetic loadings on the remaining four (or three) residual fac-tors. This is the pattern of genetic loadings that we would expect if thereare heritable dimensions of personality influenced by both additive andnonadditive genetic effects and closely related to the dimensions of the
TESTING A MODEL OF GENETIC STRUCTURE 767
personality system of Cloninger (or Eysenck) that, together with otherheritable dimensions, influence responses to the EPQ-R (or TPQ). Fi-nally, nonsignificant loadings on the residual factors were also droppedto further simplify the model. In analyses predicting the TPQ from theEPQ-R, we examined the improvement in fit when nonadditive geneticloadings on Factors 3 and 4 (corresponding to the L and P scales) werefixed to zero, and shared environmental factors were estimated instead.In analyses predicting the EPQ-R from the TPQ, shared environmentaleffects (rather than nonadditive genetic effects) were likewise estimatedfor Factors 6 and 7. Estimates of genetic and environmental variancesexplained by genetic and environmental factors of the TPQ (or EPQ-R), and residual genetic and environmental variances, are reported un-der the simplified model, where nonadditive genetic factor loadings onFactors 1-3 (or 1-4) were constrained and nonsignificant parameterswere removed from the model but were extremely close to those ob-tained under the full seven-factor decomposition.
Results
Univariate Genetic Analyses
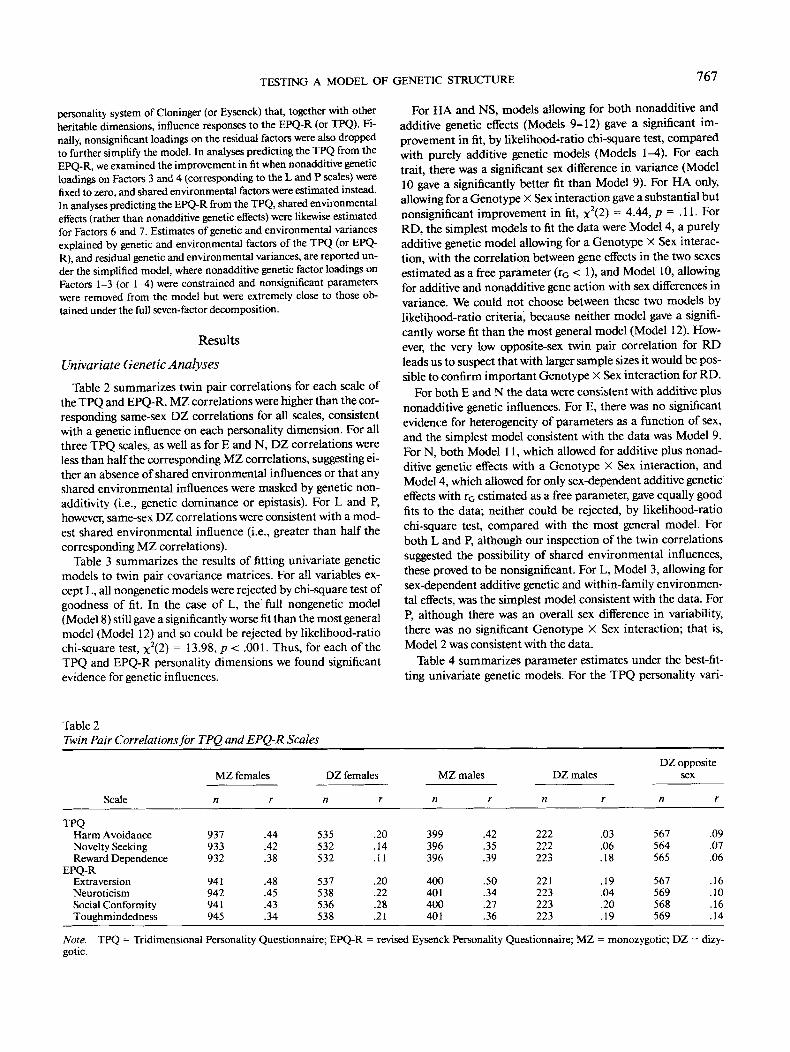
Table 2 summarizes twin pair correlations for each scale ofthe TPQ and EPQ-R. MZ correlations were higher than the cor-responding same-sex DZ correlations for all scales, consistentwith a genetic influence on each personality dimension. For allthree TPQ scales, as well as for E and N, DZ correlations wereless than half the corresponding MZ correlations, suggesting ei-ther an absence of shared environmental influences or that anyshared environmental influences were masked by genetic non-additivity (i.e., genetic dominance or epistasis). For L and P,however, same-sex DZ correlations were consistent with a mod-est shared environmental influence (i.e., greater than half thecorresponding MZ correlations).
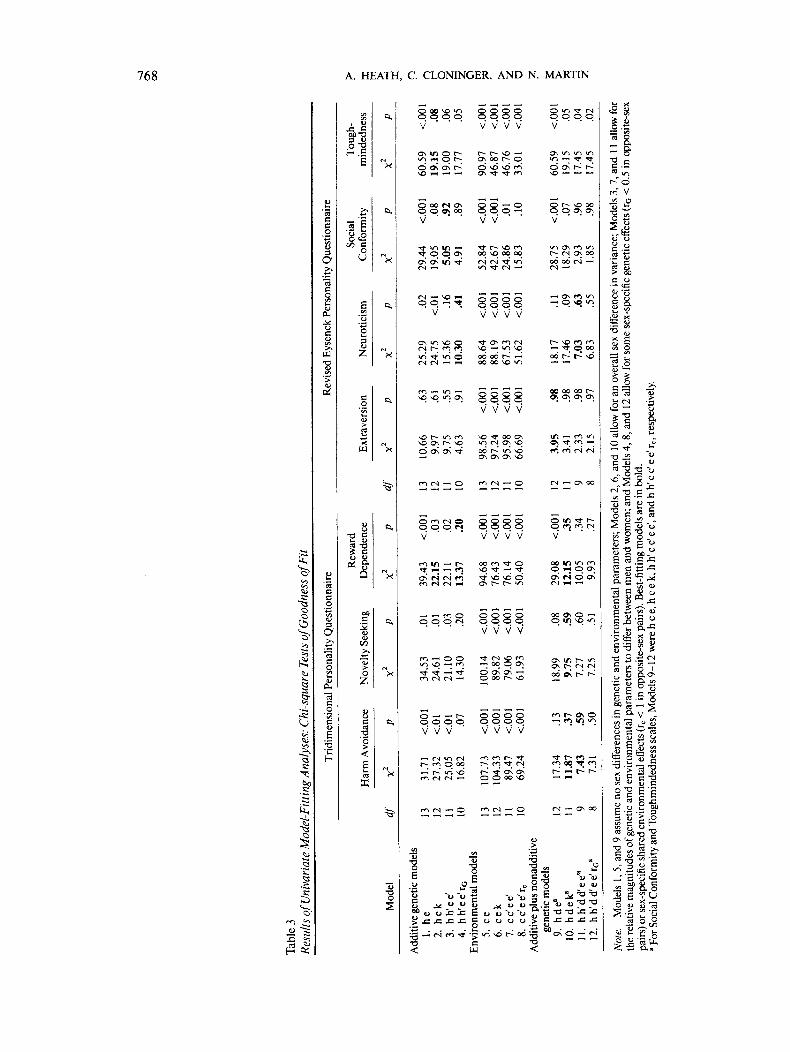
Table 3 summarizes the results of fitting univariate geneticmodels to twin pair covariance matrices. For all variables ex-cept L, all nongenetic models were rejected by chi-square test ofgoodness of fit. In the case of L, the full nongenetic model(Model 8) still gave a significantly worse fit than the most generalmodel (Model 12) and so could be rejected by likelihood-ratiochi-square test, x2(2) = 13.98, p < .001. Thus, for each of theTPQ and EPQ-R personality dimensions we found significantevidence for genetic influences.
For HA and NS, models allowing for both nonadditive andadditive genetic effects (Models 9-12) gave a significant im-provement in fit, by likelihood-ratio chi-square test, comparedwith purely additive genetic models (Models 1-4). For eachtrait, there was a significant sex difference in variance (Model10 gave a significantly better fit than Model 9). For HA only,allowing for a Genotype X Sex interaction gave a substantial butnonsignificant improvement in fit, x2(2) = 4.44, p = .11. ForRD, the simplest models to fit the data were Model 4, a purelyadditive genetic model allowing for a Genotype X Sex interac-tion, with the correlation between gene effects in the two sexesestimated as a free parameter (rG < 1), and Model 10, allowingfor additive and nonadditive gene action with sex differences invariance. We could not choose between these two models bylikelihood-ratio criteria, because neither model gave a signifi-cantly worse fit than the most general model (Model 12). How-ever, the very low opposite-sex twin pair correlation for RDleads us to suspect that with larger sample sizes it would be pos-sible to confirm important Genotype X Sex interaction for RD.
For both E and N the data were consistent with additive plusnonadditive genetic influences. For E, there was no significantevidence for heterogeneity of parameters as a function of sex,and the simplest model consistent with the data was Model 9.For N, both Model 11, which allowed for additive plus nonad-ditive genetic effects with a Genotype X Sex interaction, andModel 4, which allowed for only sex-dependent additive geneticeffects with rG estimated as a free parameter, gave equally goodfits to the data; neither could be rejected, by likelihood-ratiochi-square test, compared with the most general model. Forboth L and P, although our inspection of the twin correlationssuggested the possibility of shared environmental influences,these proved to be nonsignificant. For L, Model 3, allowing forsex-dependent additive genetic and within-family environmen-tal effects, was the simplest model consistent with the data. ForP, although there was an overall sex difference in variability,there was no significant Genotype X Sex interaction; that is,Model 2 was consistent with the data.
Table 4 summarizes parameter estimates under the best-fit-ting univariate genetic models. For the TPQ personality vari-
Table 2Twin Pair Correlations for TPQ and EPQ-R Scales
Scale
TPQHarm AvoidanceNovelty SeekingReward Dependence
EPQ-RExtra versionNeuroticismSocial ConformityToughmindedness
MZ females
n
937933932
941942941945
r
.44
.42
.38
.48
.45
.43
.34
DZ females
n
535532532
537538536538
r
.20
.14
.11
.20
.22
.28
.21
MZ males
n
399396396
400401400401
r
.42
.35
.39
.50
.34
.27
.36
DZ males
n
222222223
221223223223
r
-.03.06.18
.19
.04
.20
.19
DZ oppositesex
n
567564565
567569568569
r
.09
.07
.06
.16
.10
.16
.14
Note.gotic.
TPQ = Tridimensional Personality Questionnaire; EPQ-R = revised Eysenck Personality Questionnaire; MZ = monozygotic; DZ = dizy-
768 A. HEATH, C. CLONINGER, AND N. MARTIN
1
o
1I?
I
©•
"3
|o
1aco
I
a
fl1 2 1
1
I
"8
8PSS 8888V V V V V
os m Q r- r- r- so -~vi ?•« O r- os oo r~ oO Os os r-* o so so co
V V
• v i if^ -—i ^- [--- \© rO• O O ON OO O OO OO
V V V V
S^s; 8888V V V V
n in « h coro^-oTf ^ -H fO >O Tf - • TfONfSfSfO ^^0*0 0mfmNrt a t̂ r*- <n
o o o rs 8888V V V V
•* fN « 1—• oo O <
V V V8888V V V V
-O« '
r-- so co co—• TT o oo
£!
^o r— in co \© TT OO a\ m *"̂ co in*o ON r~~ ^o *n cs O\ ^o ^^ ^ co «̂O O N O N T } - OOt^invo f)cOfN<N— ON ON ON ̂
CO (N —' O CO (N — O ( N ^ O N O O
OcofNO OQQO O»/)^r-oootN poop q fjrnoiV V V V V V
ON fS O ON(N *** *-*
O N IT) tO N t^ (OO ON 1
CO r- OS O-- to in »n
Tf r- ro —
r— ^^ I"- t--
1
: J: -C JZ
•g
IgI
• -^ wi so r-" oo
§•I u 3 •O T3
3i0ON O •
TESTING A MODEL OF GENETIC STRUCTURE 769
Table 4stimates of Standardized Genetic and Environmental Variance Components Under Best-Fitting Univariate Genetic Models
Women Men
Scale
Additive Nonadditive Shared Nonshared Additive Nonadditive Shared Nonsharedgenetic genetic environment environment genetic genetic environment environment rc k
Harm AvoidanceModel 11 31 13Model 10 0 44
Novelty Seeking 0 41Reward Dependence
Model 10 37 0Model 4 2 36
TPQ
565659
6263
000
392
424441
036
000
00
585659
6162
1.001.001.00
.341.00
.951.06
1.09
ExtraversionNeuroticism
Model 11Model 4
Social ConformityToughmindedness
21
38454435
28
7000
0
0000
EPQ-R
51
55555665
21
3322735
28
32000
0
0000
51
656873 .65
1.00 —
1.00 —.5 —
1.00 —1.00 —
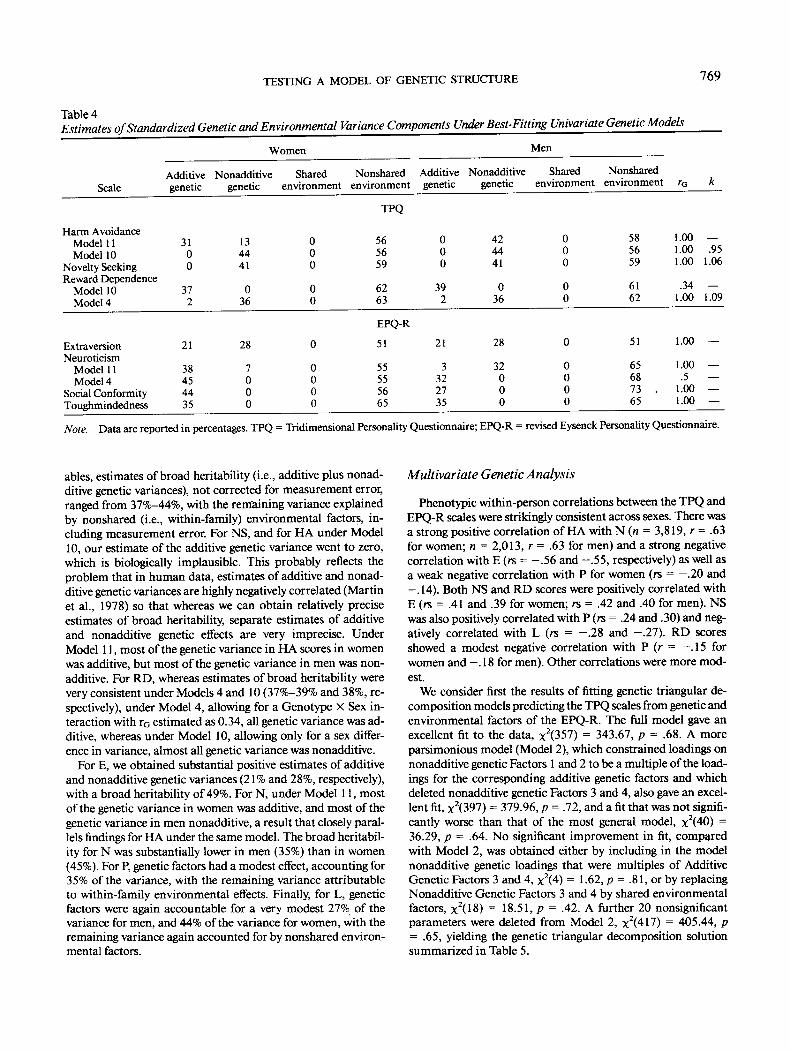
Note. Data are reported in percentages. TPQ = Tridimensional Personality Questionnaire; EPQ-R = revised Eysenck Personality Questionnaire.
ables, estimates of broad heritability (i.e., additive plus nonad-ditive genetic variances), not corrected for measurement error,ranged from 37%-44%, with the remaining variance explainedby nonshared (i.e., within-family) environmental factors, in-cluding measurement error. For NS, and for HA under Model10, our estimate of the additive genetic variance went to zero,which is biologically implausible. This probably reflects theproblem that in human data, estimates of additive and nonad-ditive genetic variances are highly negatively correlated (Martinet al., 1978) so that whereas we can obtain relatively preciseestimates of broad heritability, separate estimates of additiveand nonadditive genetic effects are very imprecise. UnderModel 11, most of the genetic variance in HA scores in womenwas additive, but most of the genetic variance in men was non-additive. For RD, whereas estimates of broad heritability werevery consistent under Models 4 and 10 (37%-39% and 38%, re-spectively), under Model 4, allowing for a Genotype X Sex in-teraction with rG estimated as 0.34, all genetic variance was ad-ditive, whereas under Model 10, allowing only for a sex differ-ence in variance, almost all genetic variance was nonadditive.
For E, we obtained substantial positive estimates of additiveand nonadditive genetic variances (21% and 28%, respectively),with a broad heritability of 49%. For N, under Model 11, mostof the genetic variance in women was additive, and most of thegenetic variance in men nonadditive, a result that closely paral-lels findings for HA under the same model. The broad heritabil-ity for N was substantially lower in men (35%) than in women(45%). For P, genetic factors had a modest effect, accounting for35% of the variance, with the remaining variance attributableto within-family environmental effects. Finally, for L, geneticfactors were again accountable for a very modest 27% of thevariance for men, and 44% of the variance for women, with theremaining variance again accounted for by nonshared environ-mental factors.
Multivariate Genetic Analysis
Phenotypic within-person correlations between the TPQ andEPQ-R scales were strikingly consistent across sexes. There wasa strong positive correlation of HA with N (« = 3,819, r = .63for women; n = 2,013, r = .63 for men) and a strong negativecorrelation with E (rs = -.56 and -.55, respectively) as well asa weak negative correlation with P for women (rs = —.20 and-.14). Both NS and RD scores were positively correlated withE (rs = .41 and .39 for women; rs = .42 and .40 for men). NSwas also positively correlated with P (rs = .24 and .30) and neg-atively correlated with L (rs = -.28 and -.27). RD scoresshowed a modest negative correlation with P (r = -.15 forwomen and —. 18 for men). Other correlations were more mod-est.
We consider first the results of fitting genetic triangular de-composition models predicting the TPQ scales from genetic andenvironmental factors of the EPQ-R. The full model gave anexcellent fit to the data, x2(357) = 343.67, p = .68. A moreparsimonious model (Model 2), which constrained loadings onnonadditive genetic Factors 1 and 2 to be a multiple of the load-ings for the corresponding additive genetic factors and whichdeleted nonadditive genetic Factors 3 and 4, also gave an excel-lent fit, x2(397) = 379.96, p = .72, and a fit that was not signifi-cantly worse than that of the most general model, x2(40) =36.29, p = .64. No significant improvement in fit, comparedwith Model 2, was obtained either by including in the modelnonadditive genetic loadings that were multiples of AdditiveGenetic Factors 3 and 4, x2(4) = 1.62, p = .81, or by replacingNonadditive Genetic Factors 3 and 4 by shared environmentalfactors, x2(18) = 18.51, p = .42. A further 20 nonsignificantparameters were deleted from Model 2, x2(417) = 405.44, p= .65, yielding the genetic triangular decomposition solutionsummarized in Table 5.
770 A. HEATH, C. CLONINGER, AND N. MARTIN
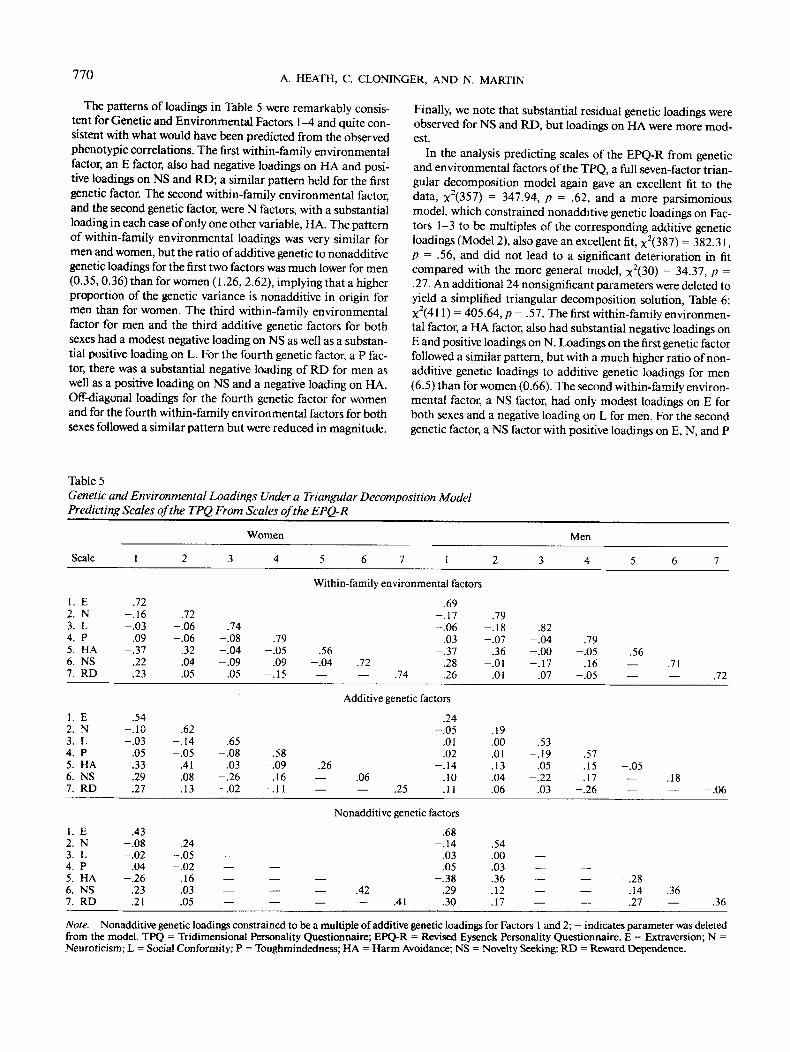
The patterns of loadings in Table 5 were remarkably consis-tent for Genetic and Environmental Factors 1-4 and quite con-sistent with what would have been predicted from the observedphenotypic correlations. The first within-family environmentalfactor, an E factor, also had negative loadings on HA and posi-tive loadings on NS and RD; a similar pattern held for the firstgenetic factor. The second within-family environmental factor,and the second genetic factor, were N factors, with a substantialloading in each case of only one other variable, HA. The patternof within-family environmental loadings was very similar formen and women, but the ratio of additive genetic to nonadditivegenetic loadings for the first two factors was much lower for men(0.35,0.36) than for women (1.26, 2.62), implying that a higherproportion of the genetic variance is nonadditive in origin formen than for women. The third within-family environmentalfactor for men and the third additive genetic factors for bothsexes had a modest negative loading on NS as well as a substan-tial positive loading on L. For the fourth genetic factor, a P fac-tor, there was a substantial negative loading of RD for men aswell as a positive loading on NS and a negative loading on HA.Off-diagonal loadings for the fourth genetic factor for womenand for the fourth within-family environmental factors for bothsexes followed a similar pattern but were reduced in magnitude.
Finally, we note that substantial residual genetic loadings wereobserved for NS and RD, but loadings on HA were more mod-est.
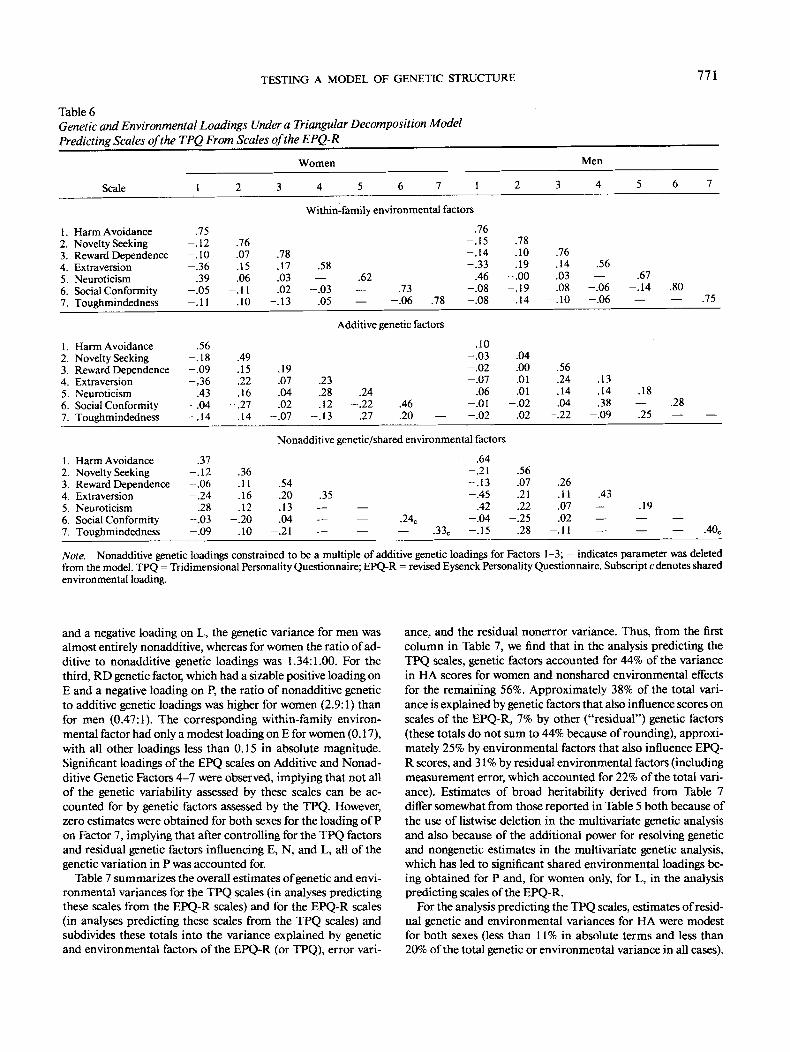
In the analysis predicting scales of the EPQ-R from geneticand environmental factors of the TPQ, a full seven-factor trian-gular decomposition model again gave an excellent fit to thedata, x2(357) = 347.94, p = .62, and a more parsimoniousmodel, which constrained nonadditive genetic loadings on Fac-tors 1 -3 to be multiples of the corresponding additive geneticloadings (Model 2), also gave an excellent fit, x2(387) = 382.31,p = .56, and did not lead to a significant deterioration in fitcompared with the more general model, x2(30) = 34.37, p =.27. An additional 24 nonsignificant parameters were deleted toyield a simplified triangular decomposition solution, Table 6:X2(411) = 405.64, p = .57. The first within-family environmen-tal factor, a HA factor, also had substantial negative loadings onE and positive loadings on N. Loadings on the first genetic factorfollowed a similar pattern, but with a much higher ratio of non-additive genetic loadings to additive genetic loadings for men(6.5) than for women (0.66). The second within-family environ-mental factor, a NS factor, had only modest loadings on E forboth sexes and a negative loading on L for men. For the secondgenetic factor, a NS factor with positive loadings on E, N, and P
Table 5Genetic and Environmental Loadings Under a Triangular Decomposition ModelPredicting Scales of the TPQ From Scales of the EPQ-R
Scale
1. E2. N3. L4. P5. HA6. NS7. RD
1. E2. N3. L4. P5. HA6. NS7. RD
1. E2. N3. L4. P5. HA6. NS7. RD
1
.72-.16-.03
.09-.37
.22
.23
.54-.10-.03
.05-.33
.29
.27
.43-.08-.02
.04-.26
.23
.21
2
.72-.06-.06
.32
.04
.05
.62-.14-.05
.41
.08
.13
.24-.05-.02
.16
.03
.05
3
.74-.08-.04-.09
.05
.65-.08
.03-.26-.02
—_
—
Women
4
.79-.05
.09-.15
.58-.09
.16-.11
——
—
5 6 7 1
Within-family environmental factors
.69-.17-.06
.03.56 -.37
-.04 .72 .28— — .74 .26
Additive genetic factors
.24-.05
.01
.02.26 -.14— .06 .10— — .25 .11
Nonadditive genetic factors
.68-.14
.03
.05— -.38— .42 .29— — .41 .30
2
.79-.18-.07
.36-.01
.01
.19
.00
.01
.13
.04
.06
.54
.00
.03
.36
.12
.17
3
.82-.04-.00-.17
.07
.53-.19-.05-.22
.03
—
—
Men
4
.79-.05
.16-.05
.57-.15
.17-.26
—
—
5
.56
—
-.05
—
-.28.14.27
6
.71—
.18—
.36—
7
.72
-.06
.36
Note. Nonadditive genetic loadings constrained to be a multiple of additive genetic loadings for Factors 1 and 2; - indicates parameter was deletedfrom the model. TPQ = Tridimensional Personality Questionnaire; EPQ-R = Revised Eysenck Personality Questionnaire. E = Extraversion; N =Neuroticism; L = Social Conformity; P = Toughmindedness; HA = Harm Avoidance; NS = Novelty Seeking; RD = Reward Dependence.
TESTING A MODEL OF GENETIC STRUCTURE 771
Table 6Genetic and Environmental Loadings Under a Triangular Decomposition ModelPredicting Scales of the TPQ From Scales of the EPQ-R
Women Men
Scale
1. Harm Avoidance2. Novelty Seeking3. Reward Dependence4. Extraversion5. Neuroticism6. Social Conformity7. Toughmindedness
1. Harm Avoidance2. Novelty Seeking3. Reward Dependence4. Extraversion5. Neuroticism6. Social Conformity7. Toughmindedness
1. Harm Avoidance2. Novelty Seeking3. Reward Dependence4. Extraversion5. Neuroticism6. Social Conformity7. Toughmindedness
1
.75-.12-.10-.36
.39-.05-.11
.56-.18-.09- 3 6
.43-.04-.14
.37-.12-.06-.24
.28-.03-.09
2
.76
.07
.15
.06-.11
.10
.49
.15
.22
.16-.27
.14
.36
.11
.16
.12-.20
.10
3
.78
.17
.03
.02- .13
.19
.07
.04
.02- .07
4 5 6 7 1
Within-family environmental factors
.58
- .03.05
.23
.28
.12- .13
.62——
.73- .06 .78
Additive genetic factors
.24- .22
.27.46.20 —
.76-.15-.14-.33
.46-.08-.08
.10-.03-.02-.07
.06-.01-.02
2
.78
.10
.19-.00-.19
.14
.04
.00
.01
.01-.02
.02
Nonadditive genetic/shared environmental factors
.54
.20
.13
.04- .21
.35———
———
.24C
— •33 C
.64-.21-.13-.45
.42-.04-.15
.56
.07
.21
.22-.25
.28
3
.76
.14
.03
.08-.10
.56
.24
.14
.04-.22
.26
.11
.07
.02-.11
4
.56—
-.06-.06
.13
.14
.38-.09
.43———
5
.67-.14—
.18—.25
.19——
6
.80—
.28—
——
7
.75
—
.40c
Note. Nonadditive genetic loadings constrained to be a multiple of additive genetic loadings for Factors 1-3; - indicates parameter was deletedfrom the model. TPQ = Tridimensional Personality Questionnaire; EPQ-R = revised Eysenck Personality Questionnaire. Subscript cdenotes sharedenvironmental loading.
and a negative loading on L, the genetic variance for men wasalmost entirely nonadditive, whereas for women the ratio of ad-ditive to nonadditive genetic loadings was 1.34:1.00. For thethird, RD genetic factor, which had a sizable positive loading onE and a negative loading on P, the ratio of nonadditive geneticto additive genetic loadings was higher for women (2.9:1) thanfor men (0.47:1). The corresponding within-family environ-mental factor had only a modest loading on E for women (0.17),with all other loadings less than 0.15 in absolute magnitude.Significant loadings of the EPQ scales on Additive and Nonad-ditive Genetic Factors 4-7 were observed, implying that not allof the genetic variability assessed by these scales can be ac-counted for by genetic factors assessed by the TPQ. However,zero estimates were obtained for both sexes for the loading of Pon Factor 7, implying that after controlling for the TPQ factorsand residual genetic factors influencing E, N, and L, all of thegenetic variation in P was accounted for.
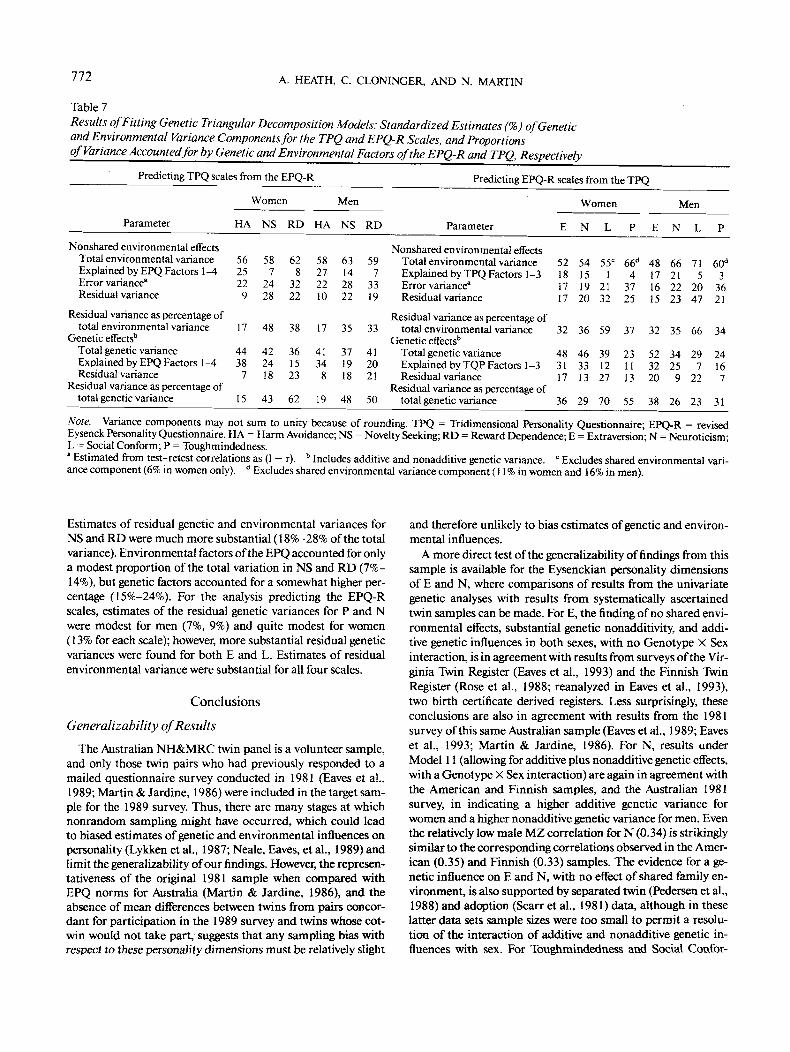
Table 7 summarizes the overall estimates of genetic and envi-ronmental variances for the TPQ scales (in analyses predictingthese scales from the EPQ-R scales) and for the EPQ-R scales(in analyses predicting these scales from the TPQ scales) andsubdivides these totals into the variance explained by geneticand environmental factors of the EPQ-R (or TPQ), error vari-
ance, and the residual nonerror variance. Thus, from the firstcolumn in Table 7, we find that in the analysis predicting theTPQ scales, genetic factors accounted for 44% of the variancein HA scores for women and nonshared environmental effectsfor the remaining 56%. Approximately 38% of the total vari-ance is explained by genetic factors that also influence scores onscales of the EPQ-R, 7% by other ("residual") genetic factors(these totals do not sum to 44% because of rounding), approxi-mately 25% by environmental factors that also influence EPQ-R scores, and 31% by residual environmental factors (includingmeasurement error, which accounted for 22% of the total vari-ance). Estimates of broad heritability derived from Table 7differ somewhat from those reported in Table 5 both because ofthe use of listwise deletion in the multivariate genetic analysisand also because of the additional power for resolving geneticand nongenetic estimates in the multivariate genetic analysis,which has led to significant shared environmental loadings be-ing obtained for P and, for women only, for L, in the analysispredicting scales of the EPQ-R.
For the analysis predicting the TPQ scales, estimates of resid-ual genetic and environmental variances for HA were modestfor both sexes (less than 11% in absolute terms and less than20% of the total genetic or environmental variance in all cases).
772 A. HEATH, C. CLONINGER, AND N. MARTIN
Table 7
Results of Fitting Genetic Triangular Decomposition Models: Standardized Estimates (%) of Geneticand Environmental Variance Components for the TPQandEPQ-R Scales, and Proportionsof Variance Accounted for by Genetic and Environmental Factors of the EPQ-R and TPQ, Respectively
Predicting TPQ scales from the EPQ-R
Parameter
Nonshared environmental effectsTotal environmental varianceExplained by EPQ Factors 1-4Error variance8
Residual variance
Residual variance as percentage oftotal environmental variance
Genetic effects'1
Total genetic varianceExplained by EPQ Factors 1-4Residual variance
Residual variance as percentage oftotal genetic variance
HA
562522
9
17
4438
7
l i
Women
NS
587
2428
48
422418
43
RD
628
3222
38
361523
62
HA
58272210
17
4134
8
19
Men
NS
63142822
35
371918
48
RD
597
3319
33
412021
50
Predicting EPQ-R scales from the TPQ
Parameter
Nonshared environmental effectsTotal environmental varianceExplained by TPQ Factors 1-3Error variance8
Residual variance
Residual variance as percentage oftotal environmental variance
Genetic effects6
Total genetic varianceExplained by TQP Factors 1-3Residual variance
Residual variance as percentage oftotal genetic variance
E
5?181717
3?
483117
36
Women
N
54151920
36
463313
29
L
55C
17132
59
391227
70
P
66d
43725
37
2311
n55
E
48171615
3?
5?3270
38
Men
N
6671??
23
35
3475
9
26
I.
715
7047
66
797
77
23
P
60d
33621
34
74167
31
Note. Variance components may not sum to unity because of rounding. TPQ = Tridimensional Personality Questionnaire; EPQ-R = revisedEysenck Personality Questionnaire. HA = Harm Avoidance; NS = Novelty Seeking; RD = Reward Dependence; E = Extraversion; N = Neuroticism;L = Social Conform; P = Toughmindedness.8 Estimated from test-retest correlations as (1 - r). b Includes additive and nonadditive genetic variance. c Excludes shared environmental vari-ance component (6% in women only). " Excludes shared environmental variance component (11 % in women and 16% in men).
Estimates of residual genetic and environmental variances forNS and RD were much more substantial (18%-28% of the totalvariance). Environmental factors of the EPQ accounted for onlya modest proportion of the total variation in NS and RD (7%-14%), but genetic factors accounted for a somewhat higher per-centage (15%-24%). For the analysis predicting the EPQ-Rscales, estimates of the residual genetic variances for P and Nwere modest for men (7%, 9%) and quite modest for women(13% for each scale); however, more substantial residual geneticvariances were found for both E and L. Estimates of residualenvironmental variance were substantial for all four scales.
Conclusions
Generalizability of Results
The Australian NH&MRC twin panel is a volunteer sample,and only those twin pairs who had previously responded to amailed questionnaire survey conducted in 1981 (Eaves et al.,1989; Martin & Jardine, 1986) were included in the target sam-ple for the 1989 survey. Thus, there are many stages at whichnonrandom sampling might have occurred, which could leadto biased estimates of genetic and environmental influences onpersonality (Lykken et al., 1987; Neale, Eaves, et al., 1989) andlimit the generalizability of our findings. However, the represen-tativeness of the original 1981 sample when compared withEPQ norms for Australia (Martin & Jardine, 1986), and theabsence of mean differences between twins from pairs concor-dant for participation in the 1989 survey and twins whose cot-win would not take part, suggests that any sampling bias withrespect to these personality dimensions must be relatively slight
and therefore unlikely to bias estimates of genetic and environ-mental influences.
A more direct test of the generalizability of findings from thissample is available for the Eysenckian personality dimensionsof E and N, where comparisons of results from the univariategenetic analyses with results from systematically ascertainedtwin samples can be made. For E, the finding of no shared envi-ronmental effects, substantial genetic nonadditivity, and addi-tive genetic influences in both sexes, with no Genotype X Sexinteraction, is in agreement with results from surveys of the Vir-ginia Twin Register (Eaves et al., 1993) and the Finnish TwinRegister (Rose et al., 1988; reanalyzed in Eaves et al., 1993),two birth certificate derived registers. Less surprisingly, theseconclusions are also in agreement with results from the 1981survey of this same Australian sample (Eaves et al., 1989; Eaveset al., 1993; Martin & Jardine, 1986). For N, results underModel 11 (allowing for additive plus nonadditive genetic effects,with a Genotype X Sex interaction) are again in agreement withthe American and Finnish samples, and the Australian 1981survey, in indicating a higher additive genetic variance forwomen and a higher nonadditive genetic variance for men. Eventhe relatively low male MZ correlation for N (0.34) is strikinglysimilar to the corresponding correlations observed in the Amer-ican (0.35) and Finnish (0.33) samples. The evidence for a ge-netic influence on E and N, with no effect of shared family en-vironment, is also supported by separated twin (Pedersen et al.,1988) and adoption (Scarr et al., 1981) data, although in theselatter data sets sample sizes were too small to permit a resolu-tion of the interaction of additive and nonadditive genetic in-fluences with sex. For Toughmindedness and Social Confer-
TESTING A MODEL OF GENETIC STRUCTURE 773
mity, although the twin correlations suggested shared environ-mental as well as genetic influences on responding, consistentwith findings from previous twin surveys (Eaves et al., 1989),the shared environmental effects were not significant in the uni-variate genetic analyses.
The Inheritance of the TPQ Personality Dimensions
Results of fitting univariate genetic models to the TPQ per-sonality data confirmed the hypothesized significant genetic in-fluence on each of the personality dimensions of HA, NS, andRD. For each personality dimension, nongenetic models wererejected by chi-square test of goodness of fit. Findings for NSwere very similar to those for E, with substantial genetic nonad-ditivity in both sexes and no Genotype X Sex interaction. Find-ings for HA, under Model 11, were strikingly similar to thosefor N, with much higher additive genetic variance for womenand much higher nonadditive genetic variance for men. For RD,a simple additive genetic model, allowing for a Genotype X Sexinteraction, including sex-dependent genetic effects (with a cor-relation between genetic effects in the two sexes of only 0.34),gave a good fit to the data.
From the 2-year test-retest correlations, we can estimate thatas much as 22% of the variance in HA scores, 24% (for women)to 28% (for men) of the variance in NS scores, and 32%-33% ofthe variance in RD scores is attributable to measurement errorand other relatively short-term state effects. Thus, if unreliabil-ity of measurement is entirely environmental in origin (aswould be the case if it is solely determined by measurementerror), approximately 54%-56% of the stable variation in HAfor men and women, and 58%-61% of the stable variation inNS, is determined by additive and nonadditive genetic influ-ences, and approximately 54%-58% of the stable variation inRD is determined by genetic influences that are purely additive,with the remaining variation in each trait determined bywithin-family environmental effects, that is, by the stable in-fluences of within-pair differences in environmental experience(Plomin & Daniels, 1987). In comparison, additive and nonad-ditive genetic factors accounted for approximately 60% of thestable variation in E for men and 59% for women and between41 % and 48% of the stable variation in N for men but 56% forwomen. The reduced impact of genetic factors on N for men,although consistent with the Finnish and American studies(Eaves et al., 1989; Rose et al., 1988), is not consistent withfindings using previous versions of the EPQ, including the 1981survey of this same sample (Eaves et al., 1989), and we suspectmay reflect largely differences between short-form measures ofN and the full 23-item scale used in the 1981 survey. Additivegenetic factors accounted for approximately 34% of the stablevariance in L scores for men but 56% for women and for 56% ofthe stable variance in P for women and 54% for men. Howeverit should be noted that because of the 2-year test-retest interval,we cannot exclude the possibility that inconsistency of subjects'responses across occasions is in part genetically determined andnot solely the consequence of measurement error, in which casethese estimates of the proportion of stable variation accountedfor by genetic factors may be overestimates (Eaves & Eysenck,1976; Eaves etal., 1989).
Underlying Genetic Structure
By fitting a multivariate genetic triangular decompositionmodel (Neale & Cardon, 1992), we explored the extent to whichthe TPQ and EPQ-R assess the same versus different dimen-sions of genetic and environmental variability. From the envi-ronmental perspective, it appears that the TPQ NS and RD di-mensions, in particular, are substantially influenced by environ-mental factors whose influence is specific to the TPQ as well asby factors that also influence responding to the EPQ-R. For HA,in contrast, most of the residual environmental variance thatwas not explained by environmental factors of the EPQ (i.e., byenvironmental factors that also influence responding to EPQscales) could be explained as error variance. In analyses predict-ing the scales of the EPQ-R from the TPQ, L and P scales assessenvironmental variability that is not assessed by the TPQ. ForE and N, although sizable proportions of the nonerror environ-mental variance can be explained by environmental factors ofthe TPQ (43%-53%), substantial residual environmental vari-ability remains. Thus, from an environmental perspective, itappears that the seven higher order scales of the TPQ and EPQ-R assess six dimensions of variability, with the HA scale addinglittle to the assessments provided by the E and N scales.
From a genetic perspective there was also a substantial over-lap between the dimensions of genetic variation assessed by theTPQ HA and EPQ-R E and N scales. In the analysis predictingscales of the TPQ, less than 10% of the total variance in HAscores was residual genetic variance that was not accounted forby the genetic factors of the EPQ-R. However, the higher broadheritability of HA, compared with N, for men leads us to sus-pect that the short-form TPQ provides a better assessment ofthis heritable variation than the short-form EPQ-R. For theTPQ, substantial residual genetic variance was observed bothfor RD and for NS. For the EPQ-R, although substantial resid-ual genetic variance was found for both E and L, residual vari-ance for the N and P scales was much more modest, particularlyfor men. This suggests that the TPQ personality dimensions ofHA, NS, and RD, together with E and L, may provide a moreparsimonious, five-dimensional description of the genetic struc-ture of personality than the six-dimensional description pro-vided by the EPQ-R dimensions plus NS and RD.
Factor loadings obtained under the multivariate genetic tri-angular decomposition models allow us to consider the underly-ing genetic and environmental structures of personality fromthe alternative frameworks provided by the theories of Eysenck(Eysenck & Eysenck, 1985) and those ofCloninger( 1986,1987,1988), Gray (1982), and others. In the Eysenckian framework(Table 5), we found orthogonal environmental factors deter-mining E (associated with a modest decrease in HA and in-creases in RD and NS), N (and HA), L (with decreased NS formen), and P (with increased NS for men and decreased RD forwomen). In the framework of Cloninger, Gray, and others (Table6), we obtained orthogonal environmental factors determiningHA (associated with increased N and decreased E, consistentwith Gray's Anxiety construct), NS (with a slight increase in Eand a decrease in L for men), and RD (with a slight increase inE). In the Eysenckian framework, we found orthogonal geneticfactors determining E (and associated with decreased HA scoresand increased NS and increased RD), N and HA, L (with de-
774 A. HEATH, C. CLONINGER, AND N. MARTIN
creased NS), and P (associated with decreased RD, decreasedHA, and increased NS). Substantial genetic nonadditivity wasfound for the first two E and N genetic factors but not for the Lor P factors. In the Cloninger-Gray framework, we found or-thogonal additive and nonadditive genetic HA/Anxiety, NS,and RD factors in both sexes, with the pattern of loadings of theEPQ scales on these factors closely paralleling those observedfor the environmental factors of the TPQ.
Perhaps the most striking conclusion from these analyses,however, is that two personality systems that purport to describethe structure of personality in terms of three major dimensions(or four if we include the L scale of the EPQ-R as a Social Con-formity measure) appear instead to jointly assess five or six di-mensions of genetic variability and at least six dimensions ofenvironmental variability. The relatively high proportion of re-sidual genetic variance found for NS may in part be a conse-quence of changes in the operationalization of E in the EPQ,which have led to deletion of impulsivity items from earlier ver-sions of that scale (see Gray, 1981). The RD construct of theTPQ appears to be conceptually quite different from the Ey-senckian personality dimensions, so that the finding of substan-tial residual genetic and environmental variance for this scale isless surprising. Conversely, whereas the failure of the TPQ toaccount for genetic variability in Social Conformity, as assessedby the L scale, was anticipated, the substantial residual geneticvariance found for E suggests that the TPQ only partially ac-counts for genetic influences on sociability, the predominanttrait assessed by the EPQ E scale. It remains to be seen whetherthe recent extension of Cloninger's personality system to sevenhigher order dimensions of "temperament and character"(Cloninger, Svrakic, & Przybeck, 1993; Svrakic, Whitehead,Pryzbeck, & Cloninger, 1993) will change these conclusions.
The simple triangular decomposition models that we havefitted in this article have allowed us to determine the extent towhich the personality instruments of Eysenck and Cloninger as-sess the same or different dimensions of underlying genetic vari-ability. However, they provide merely a starting point for ad-dressing the question of whether the personality theories ofCloninger or Eysenck provide a better description of the un-derlying genetic structure of personality. By fitting multivariategenetic factor models (Heath, Eaves, & Martin, 1989; Heath,Jardine, & Martin, 1989; Heath, Neale, et al., 1989; Martin &Eaves, 1977; Neale & Cardon, 1992), it may be possible to showthat one model provides a more parsimonious description, re-quiring, for example, fewer dimensions of nonadditive geneticvariation than the other. This question, which may be betteraddressed at the level of the primary rather than higher orderfactors or by multivariate genetic item analysis (Heath, Eaves,& Martin, 1989; Heath, Jardine, & Martin, 1989; Heath &Martin, 1990) will be addressed in the future.
References
Bouchard, T. J., Lykken, D. T., McGue, M., Segal, N. L., & Tellegen, A.(1990). Sources of human psychological differences: The MinnesotaStudy of Twins Reared Apart. Science, 250, 223-228.
Bulmer, M. G. (1980). The mathematical theory of quantitative genetics.Oxford, England: Clarendon Press.
Cloninger, C. R. (1986). A unified biosocial theory of personality and its
role in the development of anxiety states. Psychiatric Developments3, 167-226.
Cloninger, C. R. (1987). A systematic method for clinical descriptionand classification of personality variants: A proposal. Archives of Gen-eral Psychiatry, 44, 573-588.
Cloninger, C. R. (1988). Anxiety and theories of emotions. In R. Noyes,M. Roth, & G. D. Burrows (Eds.), Handbook of anxiety (Vol. 2, pp.1-29). Amsterdam: Elsevier.
Cloninger, C. R. (1991). Brain networks underlying personality develop-ment. In B. J. Carroll & J. E. Barrett (Eds.), Psychopathology and thebrain (pp. 183-208). New York: Raven Press.
Cloninger, C. R., Przybeck, T. R., & Svrakic, D. M. (1991). The Tridi-mensional Personality Questionnaire: U.S. normative data. Psycho-logical Reports, 69, 1047-1057.
Cloninger, C. R., Svrakic, D. M., & Przybeck, T. R. (1993). A psycho-biological model of temperament and character. Archives of GeneralPsychiatry, 50, 975-990.
Eaves, L. J. (1977). Inferring the causes of human variation. Journal ofthe Royal Statistical Society, 140, 324-355.
Eaves, L. J., & Eysenck, H. J. (1976). Genetic and environmental com-ponents of inconsistency and unrepeatability in twins' responses to aneuroticism questionnaire. Behavior Genetics, 6, 145-160.
Eaves, L. J., & Eysenck, H. J. (1977). A genotype-environmental modelfor psychoticism. Advances in Behavior Research and Therapy, I, 5-26.
Eaves, L. J., Eysenck, H. J., & Martin, N. G. (1989). Genes, culture andpersonality: An empirical approach. San Diego, CA: Academic Press.
Eaves, L. J., Heath, A. C, Neale, M. C, Hewitt, J. K., & Martin, N. G.(1993). Sex differences and non-additivity in the effects of genes onpersonality. Unpublished manuscript, Virginia Commonwealth Uni-versity.
Eaves, L. J., Last, K. A., Martin, N. G., & Jinks, J. L. (1977). A pro-gressive approach to non-additivity and genotype-environmental co-variance in the analysis of human differences. British Journal ofMathematical and Statistical Psychology, 30, 1-42.
Eysenck, H. J., & Eysenck, S. B. G. (1969). Personality structure andmeasurement. New \ork: Routledge, Chapman & Hall.
Eysenck, H. J., & Eysenck, S. B. G. (1975). Manual of the Eysenck Per-sonality Questionnaire. London: Hodder & Stoughton.
Eysenck, H. J., & Eysenck, S. B. G. (1976). Psychoticism as a dimensionof personality. London: Hodder & Stoughton.
Eysenck, H. J., & Eysenck, M. W. (1985). Personality and individualdifferences. New \brk: Plenum.
Eysenck, H. J., Eysenck, S. B. G., & Barrett, P. (1985). A revised versionof the Psychoticism scale. Personality and Individual Differences, 6,21-29.
Fisher, R. A. (1918). The correlation between relatives on the supposi-tion of Mendelian inheritance. Transactions of the Royal Society ofEdinburgh, 52, 399-433.
Gray, J. A. (1981). A critique of Eysenck's theory of personality. InH. J. Eysenck (Ed.), A model for personality {pp. 246-276). New \brk:Springer-Verlag.
Gray, J. A. (1982). The neuropsychology of anxiety. New \brk: OxfordUniversity Press.
Heath, A. C, Eaves, L. J., & Martin, N. G. (1989). The genetic structureof personality III. Multivariate genetic item analysis of the EPQscales. Personality and Individual Differences, 10, 877-888.
Heath, A. C, Jardine, R., Eaves, L. J., & Martin, N. G. (1988). Thegenetic structure of personality I. Phenotypic factor structure of theEPQ in an Australian sample. Personality and Individual Differences,9, 59-67.
Heath, A. C, Jardine, R., & Martin, N. G. (1989). The genetic structureof personality II. Genetic item analysis of the EPQ. Personality andIndividual Differences, 10, 615-624.
TESTING A MODEL OF GENETIC STRUCTURE 775
Heath, A. G, & Martin, N. G. (1990). Psychoticism as a dimensionof personality: A multivariate genetic test of Eysenck and Eysenck'spsychoticism construct. Journal of Personality and Social Psychology,58, 1-11.
Heath, A. C, Neale, M. C, Hewitt, J. K., Eaves, L. J., & Fulker, D. W.(1989). Testing structural equation models for twin data using LIS-REL. Behavior Genetics, 19, 9-35.
Heath, A. C, Neale, M. C, Kessler, R. C, Eaves, L. J., & Kendler, K. S.(1993). Evidence for genetic influences on personality from self-re-ports and informant ratings. Journal of Personality and Social Psy-chology, 63, 85-96.
Joreskog, K., & Sorbom, D. (1988). L1SREL VII: Analysis of linearstructural relationships. Mooresville, IN: Scientific Software.
Kendler, K. S, Heath, A. C , Martin, N. G., & Eaves, L. J. (1987). Symp-toms of anxiety and symptoms of depression: Same genes, differentenvironments? A rchives of General Psychiatry, 122, 451-457.
Loehlin, J. C. (1981). Personality resemblances in adoptive families.Behavior Genetics, 11, 309-330.
Loehlin, J. C. (1992). Genes and environment in personality develop-ment: Individual differences and development series (Vol. 2). NewburyPark, CA: Sage.
Loehlin, J. C, Willerman, L., & Horn, J. (1985). Personality resem-blances in adoptive families when the children are late-adolescent oradult. Journal of Personality and Social Psychology, 48, 376-392.
Lykken, D. X, McGue, M., & Tellegen, A. (1987). Recruitment bias intwin research: The rule of two-thirds reconsidered. Behavior Genet-ics, 17, 343-362.
Lykken, D. X, Tellegen, A., & DeRubies, R. (1978). Volunteer bias intwin research: The rule of two-thirds. Social Biology, 25, 1-9.
Martin, N. G., & Eaves, L. J. (1977). The genetical analysis of covari-ance structure. Heredity, 28, 79-95.
Martin, N. G., Eaves, L. J., & Fulker, D. W. (1979). The genetical rela-tionship of impulsiveness and sensation-seeking to Eysenck's person-ality dimensions. Ada Geneticae Medicae et Gemellologiae, 28, 197-210.
Martin, N. G., Eaves, L. J., Kearsey, M. J., & Davies, P. (1978). Thepower of the classical twin study. Heredity, 40, 97-116.
Martin, N. G., & Jardine, R. (1986). Eysenck's contribution to behaviorgenetics. In S. Modgil & C. Modgil (Eds.), Hans Eysenck: Consensusand controversy (pp. 213-218). Sussex, England: Falmer Press.
Martin, N. G., & Wilson, S. R. (1982). Bias in the estimation of herita-bility from truncated samples of twins. Behavior Genetics, 12, 467-472.
Mather, K., & Jinks, J. L. (1971). Biometrical genetics: The study ofcontinuous variation. London: Chapman & Hall.
McCrae, R. R., & Costa, P. T. (1989). The structure of interpersonaltraits: Wiggins's circumplex and the five-factor model. Journal of Per-sonality and Social Psychology, 56, 586-595.
Morrison, D. F. (1976). Multivariate statistical methods. New Ybrk:McGraw-Hill.
Neale, M. C, &Cardon, L. R. (1992). Methodology for genetic studiesof twins and families, NATO ASI Series D: Behavioral and social sci-ences (Vol. 67). Norwell, MA: Kluwer Academic.
Neale, M. C, Eaves, L. J., Kendler, K. S., & Hewitt, J. K. (1989). Biasin correlations from selected samples of relatives: The effects of softselection. Behavior Genetics, 19, 163-169.
Neale, M. C, Heath, A. C, Hewitt, J. K., Eaves, L. J., & Fulker,D. W. (1989). Fitting genetic models with LISREL: Hypothesis-test-ing. Behavior Genetics, 19, 37-49.
Pedersen, N. L., Plomin, R., McClearn, G. E., & Friberg, L. (1988).Neuroticism, extraversion, and related traits in adult twins rearedapart and reared together. Journal of Personality and Social Psychol-ogy, 55, 950-957.
Pedersen, N. L., McClearn, G. E., Plomin, R., Nesselroade, J. R., Berg,S., & de Faire, U. (1991). The Swedish Adoption/Twin Study ofAging: An update. Acta Geneticae Medicae et Gemellologiae, 40, 7-20.
Plomin, R., & Daniels, D. (1987). Why are children in the same familyso different from one another? Behavioral Brain Science, 10, 1-60.
Plomin, R., DeFries, J. C, & Loehlin, J. L. (1977). Genotype-environ-ment interaction and correlation in the analysis of human variation.Psychological Bulletin, 84, 309-322.
Rose, R. J., & Kaprio, J. (1988). Frequency of social contact and resem-blance of adult monozygotic cotwins—Or does shared experience in-fluence personality after all? Behavior Genetics, 18, 309-328.
Rose, R. J., Koskenvuo, M., Kaprio, J., Sarna, S., & Langinvainio, H.(1988). Shared genes, shared experiences, and similarity of personal-ity: Data from 14,228 Finnish co-twins. Journal of Personality andSocial Psychology, 5-̂ , 161-171.
Scarr, S., Webber, P. L., Weinberg, R. A., & Wittig, M. A. (1981). Per-sonality resemblance among adolescents and their parents in biologi-cally related and adoptive families. Journal of Personality and SocialPsychology, 40, 885-898.
Shields, J. (1962). Monozygotic twins: Brought up apart and brought uptogether. Oxford: Oxford University Press.
Svrakic, D, Whitehead, C, Pryzbeck, T. R., & Cloninger, C. R. (1993).Differential diagnosis of personality disorders by the seven factormodel of temperament and character. Archives of General Psychiatry,50,991-999.
Tellegen, A. (1985). Structure of mood and personality and their rele-vance to assessing anxiety, with an emphasis on self-report. In A. H.Tuma & J. D. Maser (Eds.), Anxiety and the anxiety disorders (pp.681-706). Hillsdale, NJ: Erlbaum.
Tellegen, A., Lykken, D. X, Bouchard, T. J., Wilcox, K. J., Segal, N.,& Rich, S. (1988). Personality similarity in twins reared apart andtogether. Journal of Personality and Social Psychology, 54, 1031-1039.
Received March 10, 1992Revision received October 21,1993
Accepted October 28, 1993 •