Embed Size (px)
Citation preview
Testing for Placebo Effects using Data from Medical Trials
Anup Malani∗
October 7, 2003
Abstract
This paper criticizes the methodology of existing studies that purport to find ev-idence of placebo effects in medical trials. Because these studies fail to define andproperly model placebo effects, it is hard to interpret and determine the strength oftheir results. The paper addresses this problem by proposing a model of health out-comes that formalizes the dominant medical theory of how placebo effects operate.This theory posits that health outcomes rise in individuals’ expectations about theirbeliefs about the probability that they are getting a beneficial treatment and theirbeliefs about the efficacy of that treatment. The paper then specifies the conditions un-der which placebo effects change outcomes in randomized, double-blind, parallel-arm,controlled trials. A blinded trial is a perfect environment to test for placebo effectsbecause it offers an objective and controlled manipulation of subjects’ beliefs about theprobability and efficacy of treatment. A simple yet accurate method of testing forthe existence of placebo effects is to check whether outcomes in trials where a higherfraction of subjects are randomized into active treatment are superior to outcomes intrials with a lower fraction given active treatment. The paper applies this test to datafrom 150 trials of anti-ulcer medications and finds robust evidence of placebo effects intrials of H2-blockers (e.g., Zantac, Tagamet and Pepcid) and of proton-pump inhibitors(e.g., Prilosec, Nexium, and Prevacid).
1 Introduction
Placebo effects can roughly be defined as that component of health outcomes that cannotbe attributed to the physiological effects of treatment or to the natural progression ofdisease. There is a lively debate in the medical literature about whether placebo effectsactually exist. On one side of the debate there is, e.g., a recent New England Journal ofMedicine article by Hrobjartsson and Gotzsche [1] that examines 114 studies with both ablinded placebo-control group and an unblinded no-treatment group. The authors find fewsystematic differences in outcomes between these groups across their sample. Althoughwidely publicized, this result does not disprove the existence of placebo effects. It isconsistent with the plausible theory that members of unblinded no-treatment groups seekout alternative medication, which elevates their health outcomes.
On the other side of the debate are, e.g., studies by Kirsch and Sapirstein [2] and Kirschet al. [3] that point to evidence that members of the placebo-control group in a given
∗Associate Professor, University of Virginia Law School. I would like to thank Scott Baker, GaryBecker, Albert Choi, Feifang Hu, Darius Lakdawalla, Ron Michener, Willard Manning, Charles Mullin,Tomas Philipson, Andrew Sellgren and participants in the Public Workshop at the University of VirginiaDepartment of Economics for helpful comments. I am grateful to David Greene for excellent researchassistance. All errors are my own.
1
double-blinded trial manifested substantially improved health outcomes. These findingsare weak support for placebo effects because the improvements could be due to the naturalprogression of disease [4]. Better studies employ a balanced-placebo design wherein subjectsare first randomized across treatments and then across instructions about treatment, withone group given each treatment being told they were administered active treatment andthe other being told they were administered placebo.1 Such studies generally find evidencein support of placebo effects [7], although in more recent studies the results are mixed [8].More importantly, these studies are ethically questionable and perhaps even illegal.
A common weakness of studies on both sides of the debate is that they do not begin witha formal model of placebo effects that can be clearly falsified. It is unclear, therefore, howpowerful their evidence on the existence of placebo effects actually is. This paper addressesthis shortcoming by proposing a formal model of the dominant medical theory [9] for howplacebo effects operate. This so-called expectancy theory posits that the more optimistica patient is about the efficacy of a treatment, the more positive will be her health responseto that treatment. Moreover, if the patient is told she is being administered a treatmentshe thinks will prove helpful, she will manifest an improved health outcome even if she isnever in fact given treatment [10, 11]. This theory is formalized by assuming that healthoutcomes are a function not just of the treatment, but also the expected value of treatmentin the eyes of the patient.
The paper proposes to test this theory in the context of medical trials, which, if blinded,provide an objective and controlled manipulation of beliefs that permits a relatively cleantest of the effect of beliefs about treatment on health responses to treatment. The focusis on parallel-group, randomized, controlled trials (RCT). These are modeled as lotteriesover a treatment and control. Although informed consent procedures reveal the ex anteprobability of obtaining treatment, blinding ensures that subjects do not learn their ultimateassignment. This probability, along with subjects’ assessments of the relative efficacy ofthe treatment, affects subjects’ beliefs about the expected value of the trial. If these beliefsaffect outcomes, the probability of obtaining treatment will affect trial outcomes.
More specifically, if trial subjects believe that the treatment is superior to the control,the models predict that subjects in the treatment (control) arm of trials with a higher sharetreated would manifest better health outcomes than subjects in the treatment (control)arm of trials with a lower share treated. If the antecedent condition holds, this predictionprovides a clean test of the existence of placebo effects as defined by the expectancy theory.Fortunately, the antecedent condition holds. Because enrollment is trials is voluntary, onlythose who are more optimistic about treatment than control enroll.
The paper applies this test for placebo effects to data from over 150 RCTs of anti-ulcermedications. The advantage of ulcer trials is that outcomes are objectively measured:ulcer healing is verified by endoscopy. In trials where patients were asked for informedconsent and thus had some indication of their odds of obtaining active treatment, a positivecorrelation is found between the share treated and outcomes in each arm of trials of H2-blockers (e.g., Zantac, Tagamet, and Pepcid) and of proton-pump inhibitors (e.g., Prilosec,Nexium, and Prevacid) controlling for available group-level clinical covariates and study-level design covariates. This positive correlation is significant and robust to covariatespecification. In trials without informed consent, this correlation vanishes. This resultprovides strong evidence for the existence of placebo effects.
1Moreover, Penick & Hinckle [5] and Penick & Fisher [6] have performed related experiments that ran-domize across treatment and instruction about treatment efficacy (as opposed to about treatment state).These trials yielded mixed results and, like the balanced-placebo design, are ethically questionable.
2
Section 2 presents a model of treatment strategies, one of which is the clinical trial.Section 3 formalizes the expectancy theory of placebo effects. Section 4 derives testablepredictions regarding trial outcomes with and without placebo effects. Section 5 tests thesepredictions against data from ulcer trials.
2 Treatment Strategies
This section presents a model of treatment strategies for individuals who are currentlyill. There are two possible, future health states: continued illness y and recovery y, wherey > y.2 Treatments are lotteries over these two states. For now, assume there exist only twotreatments, indexed by subscript k: no treatment (k = 0) and an experimental treatment(k = 1). Let yki be the random variable that describes individual i’s health outcome giventreatment k. Define pki = Pr {yki = y|no placebo effects}. In the case of no treatment, thisprobability is simply a function of the natural progression of an individual’s ailment. Forthe experimental treatment, this probability is also a function of the physiological effects ofthe experimental treatment. Although a slight abuse of medical terminology, the sum ofnatural progression and the physiological effects of a given treatment will be referred to asthe specific effects of that treatment.3
Treatments are to be distinguished from treatment strategies. The latter are indexed bys and defined to be lotteries over treatments. Because treatments are themselves lotteriesover health states, treatment strategies are really compound lotteries over health states.This paper focuses on individuals for whom there are only two feasible treatment strategies:certain consumption of no treatment (s = 0) or enrollment in a randomized, placebo-controlled trial (RPCT) that is blinded (s = BT ). The latter strategy entails a probabilityd of receiving the experimental treatment and (1−d) of receiving no treatment. This narrowset of feasible treatment strategies is appropriate under two conditions. First, individualscannot consume the experimental treatment for sure because, e.g, the government has notapproved the experimental treatment for widespread prescription by doctors.4 In this case,the only way to obtain the experimental treatment is by enrolling in a trial.5 Second,individuals are only offered one lottery that includes the experimental treatment and thislottery is blinded, i.e., subjects do not learn which treatment they actually consume. Thatindividuals are offered only one lottery is a common constraint because medical trials arecostly to operate. Moreover, investigators prefer blinded trials to unblinded trials because,inter alia, the former are less vulnerable to subject attrition from the control group.
Blinded RPCTs are conducted as follows. First, individuals are recruited. Enrollmentis voluntary and subject to informed consent. As part of this disclosure, subjects are as-sumed to be given information about the probability that they will receive the experimentaltreatment.6 Individuals who choose to participate are called enrollees or subjects. Second,
2The analysis can easily be extended to the case of continuous outcome variables.3Traditionally the specific effect of treatment excludes the natural progression of disease, which, along
with placebo effects, are called the non-specific effects of treatment.4This also implies that subjects cannot create their own lotteries over no treatment and the experimental
treatment.5Many of the studies in the data set of anti-ulcer studies in Section 5 take place after the specific anti-
ulcer medication investigated has been approved in the country of the study. This does not imply that thedata set does not satisfy the assumption in the text. The reason is that, while certain medication-dosagecombinations have been approved in the country of a candidate study, the medication-dosage combinationinvestigated in the candidate study may not have been approved.
6This assumption is reasonable. U.S. law requires informed consent before enrollment in experiments,
3
Blinded RCT
ExperimentalTreatment
No Treatment
Sickness
Recovery
Sickness
Recovery
d
π0i1-d
π1i
1-π1i
1-π0i
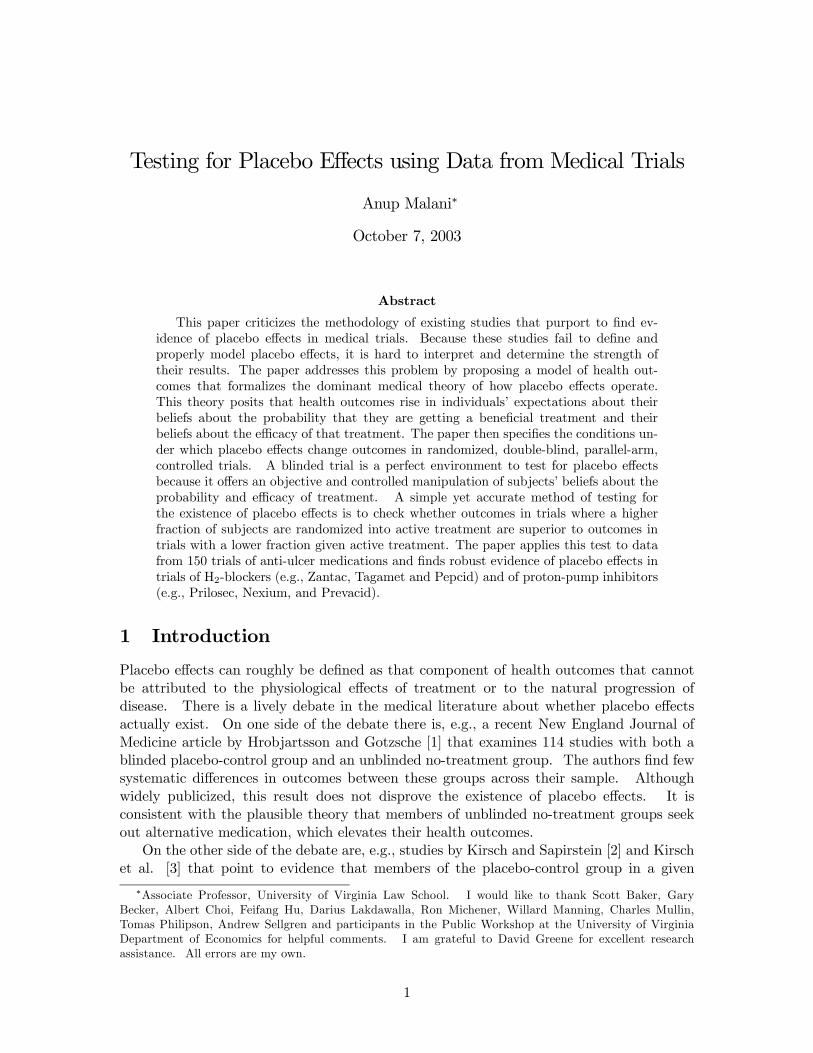
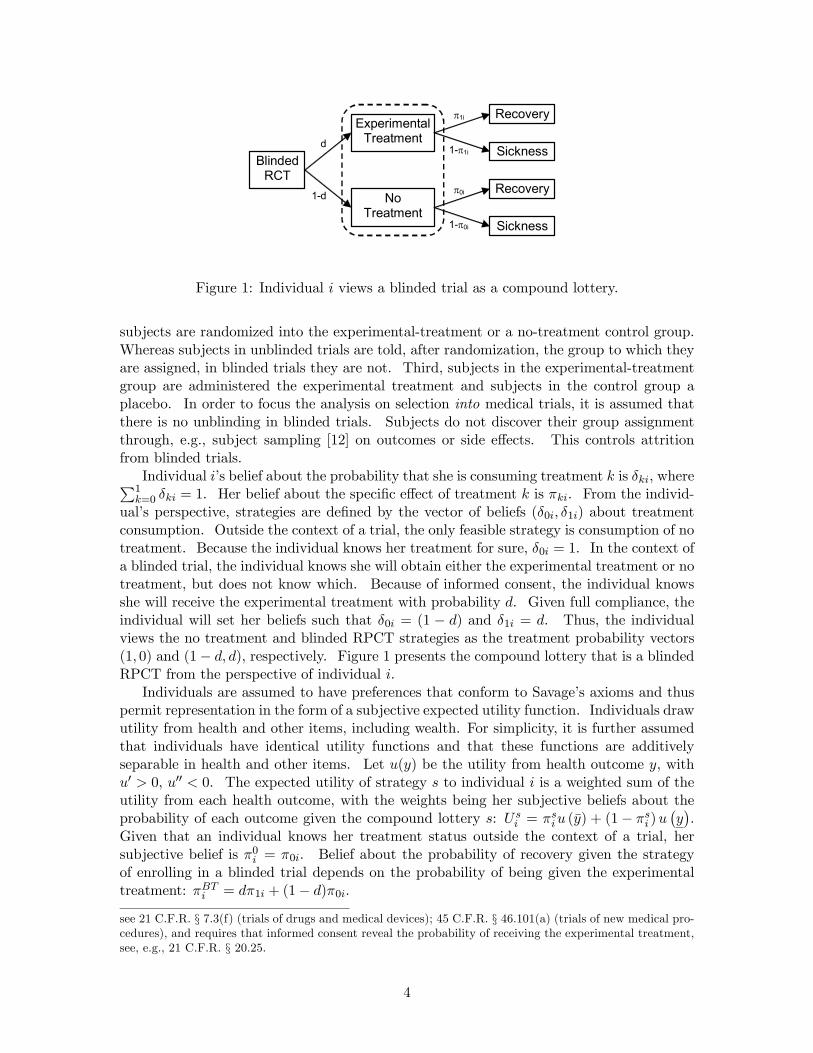
Figure 1: Individual i views a blinded trial as a compound lottery.
subjects are randomized into the experimental-treatment or a no-treatment control group.Whereas subjects in unblinded trials are told, after randomization, the group to which theyare assigned, in blinded trials they are not. Third, subjects in the experimental-treatmentgroup are administered the experimental treatment and subjects in the control group aplacebo. In order to focus the analysis on selection into medical trials, it is assumed thatthere is no unblinding in blinded trials. Subjects do not discover their group assignmentthrough, e.g., subject sampling [12] on outcomes or side effects. This controls attritionfrom blinded trials.
Individual i’s belief about the probability that she is consuming treatment k is δki, whereP1k=0 δki = 1. Her belief about the specific effect of treatment k is πki. From the individ-
ual’s perspective, strategies are defined by the vector of beliefs (δ0i, δ1i) about treatmentconsumption. Outside the context of a trial, the only feasible strategy is consumption of notreatment. Because the individual knows her treatment for sure, δ0i = 1. In the context ofa blinded trial, the individual knows she will obtain either the experimental treatment or notreatment, but does not know which. Because of informed consent, the individual knowsshe will receive the experimental treatment with probability d. Given full compliance, theindividual will set her beliefs such that δ0i = (1 − d) and δ1i = d. Thus, the individualviews the no treatment and blinded RPCT strategies as the treatment probability vectors(1, 0) and (1− d, d), respectively. Figure 1 presents the compound lottery that is a blindedRPCT from the perspective of individual i.
Individuals are assumed to have preferences that conform to Savage’s axioms and thuspermit representation in the form of a subjective expected utility function. Individuals drawutility from health and other items, including wealth. For simplicity, it is further assumedthat individuals have identical utility functions and that these functions are additivelyseparable in health and other items. Let u(y) be the utility from health outcome y, withu0 > 0, u00 < 0. The expected utility of strategy s to individual i is a weighted sum of theutility from each health outcome, with the weights being her subjective beliefs about theprobability of each outcome given the compound lottery s: Us
i = πsiu (y) + (1− πsi )u¡y¢.
Given that an individual knows her treatment status outside the context of a trial, hersubjective belief is π0i = π0i. Belief about the probability of recovery given the strategyof enrolling in a blinded trial depends on the probability of being given the experimentaltreatment: πBTi = dπ1i + (1− d)π0i.
see 21 C.F.R. § 7.3(f) (trials of drugs and medical devices); 45 C.F.R. § 46.101(a) (trials of new medical pro-cedures), and requires that informed consent reveal the probability of receiving the experimental treatment,see, e.g., 21 C.F.R. § 20.25.
4
In order to determine the sorting of individuals to strategies, one must know the dis-tribution of beliefs about the efficacy of each treatment among the population. Since theobject of these beliefs is the actual efficacy of each treatment, let gp give the probabilitydistribution function of pi = (p0i, p1i) across the population. Let gπ give the probabilitydistribution for πi = (π0i, π1i). All distributions discussed are assumed to be well-defined.The expectations operator Eg (·) will be employed when expectations are taken over thejoint distribution of (pi,πi), .
3 Expectancy Theory of Placebo Effects
According to the expectancy theory of placebo effects, patients manifest changed healthoutcomes in response to expectations regarding treatment. In particular, the more effectivea patient expects a treatment to be, the better her response to it. Moreover, the morelikely a patient thinks she is to get a beneficial treatment the better is her health outcomeholding constant whether or not she receives treatment.7
While a significant number of studies claim to find evidence of these responses, thestudies in Table 1 are among the better representatives of this class. These studies, andothers like them, provide important insights into the nature of placebo effects. They do not,however, provide compelling evidence to support the existence of placebo effects. First,the studies have small sample sizes, as measured by the number of trials in which placeboeffects are observed. Second, many of the trials examine subjective rather than objectivecriteria. For example, the studies cited by Skovlund and the Pollo et al. study relied uponpatient self-reports of pain levels. In contrast, this paper tests for the existence of placeboeffects using a large number of trials with an objective measure of outcomes.
3.1 Definition of placebo effects
This section formalizes the expectancy theory of placebo effects, first, with a definition ofthese effects and, second, with a model of health outcomes that complies with the definitionand thus can be said to incorporate placebo effects.
Definition 1 Individual i experiences a positive placebo effect if πsi > qki and E [yki] > πki,where expectations are taken over individual i’s outcomes. She experiences a negativeplacebo effect if πsi < qki and E [yki] < πki.
Treatment k is said to be associated with a positive placebo effect if two conditions hold.First, conditional on information the individual has about the probability of consuming eachtreatment and the efficacy of these treatments, the individual’s expectation πsi about theprobability of recovery given strategy s, including only the specific effects of that strategy,are greater than some arbitrary cut-off qki in state k. Second, the individual experiences a
7There are two alternative theories of placebo effects that have received substantial attention in themedical literature. The first — the so-called conditioning theory — suggests that, if the body has previouslyexperienced a specific health response after consumption of a medication, consumption of a substance closein appearance or smell to that medication will trigger a similar non-specific health response [13, 14]. Thereaction is at the sub-conscious level. No well-formed beliefs about efficacy are involved. However, thistheory has been criticized as merely a specific case of the expectancy theory where beliefs are formed basedon prior experience and menifested only at the subconscious level. See Rescorla, 1988. The second theory— the so-called motivation theory — posits that individuals with a stronger desire to respond to treatmentexperience placebo effects when treated [9].
5

probability of recovery after consumption of treatment that is greater than the probabilityof recovery given only the specific effects of that treatment. A negative placebo (or theso-called “nocebo”) effect is defined to exist under opposite conditions.
Note that the existence of placebo effects depends on beliefs about only the specificeffects of a treatment strategy. It does not depend on beliefs about placebo effects. If itwere otherwise, placebo effects would exist only if people believed they existed. If beliefsabout placebo effects were endogenous, there would be no way to predict which peoplewould believe in placebo effects and thus experienced placebo effects. Indeed, if individualshad full control over beliefs, it would be in each individual’s interest to believe not justin placebo effects, but in fully curative placebo effects. One does not, however, observesuch beliefs in the real world, let alone complete recovery by each individual due to powerfulplacebo effects.8 Placebo effects could be defined to depend on beliefs about placebo effectsif such beliefs were exogenous. This is not incompatible with the definition of placebo effectsabove. Surely beliefs about the specific effects of treatment are not immaterial to whethersubjects experience placebo effects. In that case, the cutoff qki, which can vary acrossindividuals, can be defined to include beliefs about the placebo effects given treatment k.
The purpose of requiring expectations to exceed a certain tipping point qki before placeboeffects are said to exist is to permit the existence of nocebo effects and to relate such effectsin a simple manner to positive placebo effects. Without a tipping point, it is unclear howone would define nocebo effects to exist. An obvious candidate for the cut-off is the actualspecific effects of treatment k, pki. It seems reasonable to suppose that a positive placeboeffect exists if a patient expects more from a treatment strategy than the specific effectsof the treatment k that she consumes (πsi > pki) and experiences a lottery over healthoutcomes given consumption of treatment k that is better than that implied by solely thespecific effects of that treatment (E [yki] > pki).9
3.2 Model of health outcomes
Suppose that the probability of recovery by individual i given treatment k is
Pr {yki = y|a, pki, πsi} = pki + a (πsi − pki) , (1)
where a ∈ [0, 1], for all s, k. This parameterization posits that health outcomes giventreatment k are the sum of the specific effects of treatment k plus a placebo effect drivenby expectations given strategy s and weighted by the parameter a. Consistent with thedefinition of placebo effects under the expectancy theory, there is a positive or negativeplacebo effect if the individual’s beliefs given her treatment strategy are greater or less,respectively, than the specific effects of her actual treatment.
8Berthelot et al. [15], e.g., interviewed 300 rheumatology patients and found that that three-quarters didnot know about placebo effects.
9The difficulty with this cut-off is that pki may not be known to the patient. Moreover, there is no provenpsycho-physiological reason for why positive placebo effects would only exist when beliefs are greater thanspecific effects. Nevertheless, the next section presents a model of health outcomes that uses the specificeffect of a treatment as the cut-off between positive and negative placebo effects for two reasons. First, thetest for the existence of placebo effects recommended in this paper is valid even with an arbitrary cutoff, solong as the correlation between the cutoff and beliefs is not too negative [16]. Second, using specific effectsas cutoffs permits modelling observable health outcomes as a weighted sum of the actual and believed specificeffects of treatment. This is simple and intuitive assumption about the relationship between treatment,beliefs, and outcomes.
6
The simple linear formulation of expectancy theory in (1) implies that health outcomesare a weighted average of the specific effects of a treatment and beliefs about treatmentstrategy: Pr {yki = y|a, pki, πsi} = (1− a) pki+aπsi . The parameter a indicates the relativeimportance of beliefs in determining the health outcome given consumption of treatment k.If a = 0, beliefs have no effects on outcomes. If a = 1, outcomes are completely determinedby beliefs.10 The influence of placebo effects is is assumed to be invariant across treatmentstates and across individuals. The former assumption permits that the influence of beliefsmay vary across ailments, but requires that, for a given ailment, the influence of beliefs doesnot vary across treatments. The purpose of the latter assumption is to facilitate applicationof the test for the existence of placebo effects in section 4 to data from ulcer trials. Thosedata are aggregated to the level of treatment groups so estimation of a random effects modelis not feasible.11
4 Tests for the Existence of Placebo Effects
This section employs the models of treatment strategy and health outcomes to generatepredictions regarding outcomes observed in clinical trials with and without placebo effects.Any difference in predictions can be used to test for the existence of placebo effects.
Assume, for the moment, that all individuals who believe that the experimental treat-ment is superior to no treatment (π1i > π0i) are sorted into the trial. The remaining aresorted out of the trial. The next section demonstrates that this assumption is a naturalresult of the process of individual self-selection into blinded RPCTs. Define πki = πki−π0i,the relative benefit of treatment k over no treatment, so that π1i > π0i can conveniently bewritten π1i > 0.
In the absence of placebo effects, the mean outcome observed in the group that receivestreatment k in a blinded RPCT is
Eg [yk|π1 > 0] = Eg [pk|π1 > 0] .
(Henceforth, i subscripts are dropped to simplify notation whenever their use does not addto the exposition.) In the presence of placebo effects, the mean outcome is
Eg [yk|π1 > 0, d] = (1− a)Eg [pk|π1 > 0] +a{dEg [π1|π1 > 0] + (1− d)Eg [π0|π1 > 0]}.
Without placebo effects, outcomes are solely a function of the specific effects of treatment.With placebo effects, outcomes are a weighted average of specific effects of treatment k andbeliefs about specific effects. In a blinded RPCT, the relevant beliefs are those about the
10 It is assumed that ak < 0 is not possible. Such a parameterization would be consistent with a modelof health outcomes where individuals manifest nocebo effects if a drug does not live up to expectations.There does not appear to be any direct empirical support for this sort of regret-based model of outcomes inthe literature on placebo effects. However, the literature on the motivation theory of placebo effects mayultimately shed light on this issue.11One implication of this assumption is that the influence of placebo effects is independent of individuals’
beliefs about the efficacy of different treatment states (though not of treatment state per se). There seemsto be no medical basis for thinking that individuals who are more or less responsive to treatment, who aremore less likely to recover naturally from an ailment, or who are more or less optimistic about the efficacyof treatment, manifest outcomes that are more or less driven by placebo effects. Nor is there any obvious,logical reason why individuals whose outcomes are more or less driven by expectations would believe thattreatment is–from a physiological perspective–more or less effective.
7
specific effects not of treatment k but of the trial. The reason is that subjects are blindedand therefore do not know that they consume treatment k. Subjects know only that thereis a probability d of obtaining the experimental treatment. This implies an expected valueof dπ1i + (1− d)π0i for the trial for individual i.
In the absence of placebo effects, outcomes do not depend on the share treated. Inthe presence of placebo effects, because beliefs about the trial depend on the share treated,outcomes depend on the share treated. More specifically, given the assumed sorting ofindividuals into trials, an increase in d lifts mean outcomes:
∂Eg [yk|π1 > 0, d]∂d
= aEg [π1|π1 > 0] > 0.
As the share treated rises, individuals in the trial become more optimistic because there isa better chance of getting the experimental treatment, which is thought to be better thanno treatment. This optimism translates into better average outcomes when there existplacebo effects. This yields the following test for placebo effects:
Proposition 2 Suppose all and only individuals for whom π1i > 0 enroll in a blindedRPCT. If trials that have higher treatment shares but are otherwise identical yield highermean outcomes conditional on treatment, then there exist placebo effects as defined in section3.
This is the central theoretical result of this paper. It is robust to the functional form ofthe relationship between observed outcomes, specific effects of treatment, and beliefs aboutspecific effects.
4.1 Self-selection
This section justifies the assumption in Proposition 2 that only and all individuals whobelieve that the specific effects of the experimental treatment are superior to those of notreatment enroll in a blinded RPCT. This sorting is a direct implication of individualself-selection into the type of trial described in section 2. In that context, expected utilitymaximization implies that individual i will enroll in a trial if and only if the probability ofrecovery given enrollment in a blinded RCT is greater than the probability of recovery givenno treatment. If subjects do not take placebo effects into account when deciding whetherto enroll, this condition can be written πBTi = dπ1i + (1− d)π0i > π0i and is satisfied solong as π1i > π0i ⇔ π1i > 0. Therefore, the trial will attract only and all individualswho believe the specific effects of the experimental treatment are superior to no treatment,regardless of the share treated. This yields the following result.
Proposition 3 In the model of treatment strategies in section 2, self-selection implies thatindividuals will enroll in a blinded RPCT if and only if π1i > 0. Therefore, the test forplacebo effects in Proposition 2 is valid for this model.
The test generally remains valid even if subjects take placebo effects into account whendeciding whether to enroll in trials.12 In this case, the individual assesses the value ofthe blinded trial to be πBTi = d[αiπ1i + (1− αi) {dπ1i + (1− d)π0i}] + (1− d) [αiπ0i +(1− αi) {dπ1i + (1− d)π0i}], where αi is the individual’s belief regarding the influence a12Malani [16] justifies the assumption of an expected utility representation for preferences in this case.
8

of beliefs on outcomes. Implicit in this formulation is the assumption that beliefs aboutthe influence of beliefs are independent of beliefs about the specific effects of treatments.A little algebra reveals that the condition πBTi > π0i again collapses to π1i > 0. Thereason is that blinding ensures that placebo effects have the same impact whether one israndomized into the experimental or no treatment group. That leaves the specific effects oftreatment as the only basis upon which to choose between foregoing treatment altogetherand enrollment in a blinded RPCT, which is a lottery over experimental treatment and notreatment. A critical assumption behind the conclusion that an individual’s knowledge ofplacebo effects does not change the sorting of individuals to trials is that the influence ofplacebo effects is identical in regardless of treatment consumed. If this is not the case,proposition 3 is invalid.
Proposition 3 is not valid if investigators offer individuals incentives such as cash orin-kind benefits to participate in a blinded RPCT. Such payments may induce individualswho believe that no treatment is superior to experimental treatment, i.e., π1i < 0, toenroll. In this case, one effect of an increase in the share treated is to lower expectationsand thus outcomes of individuals who believe that π1i < 0 yet enroll in a blinded RPCT:∂Eg [yk|π1 < 0, d] /∂d = aEg [π1|π1 < 0] < 0. The overall effect of an increase in theshare treated will be ambiguous.13 This is a more serious problem where the experimentaltreatment is available outside the trial. In this case, participation incentives are necessaryto induce participation even by individuals who believe π1i > 0.
4.2 Conventional treatment
Thus far it has been assumed that there are only two treatments: the experimental treat-ment and no treatment. If individuals have available to them a conventional treatmentoutside the context of a trial, there is the possibility of self-selection based on the sharetreated.14 If there is also a correlation between beliefs — which drive self-selection — andoutcomes, then it is not obvious that the test for placebo effects set forth in Proposition2 will work. Without placebo effects, the share treated may affect outcomes throughself-selection. With placebo effects, share treated will continue to affect outcomes due toa direct relationship between beliefs and outcomes, but will also have an effect throughself-selection. In the presence of a conventional alternative, self-selection is in effect noise
13Fortunately, there is an alternative test for placebo effects when investigators employ participationincentives. If placebo effects exist, an increase in the share treated should have an increasingly positive ordecreasingly negative effect on mean outcomes conditional on treatment. To see this, divide the populationinto two groups: one with individuals who believe π1i > 0 and another with those who believe π1i < 0.Everyone in the former group will participate in a blinded RPCT regardless of the share treated. Moreover,an increase in the share treated will proportionally raise this groups mean outcomes if there exist placeboeffects. Members of the latter group will participate only if the utility of the participation incentive isgreater than the disutility from having to risk consumption of the experimental treatment. This risk, andthus the cost of participation, rises with the share treated. So an increase in the share treated will causesome individuals in the second group to not enroll in the trial. Even if those who choose not to enroll arethe least pessimistic individuals in the second group, the change in mean outcomes with the share treated, aweighted average of the change in outcomes of participants from the π1i > 0 and the π1i < 0 groups, will bemore positive or less negative. The reason is that everytime the share treated rises some of the individualsthat would place negative pressure on the relationship between share treated and mean outcomes no longerparticipate.14 In the presence of a conventional alternative, it is assumed that, although subjects are free to exit a
trial at any time, if they remain, they do not consume any treatment other than that which they have beenassigned. This stops subjects from obtaining conventional treatment in addition to their assigned treatment.
9
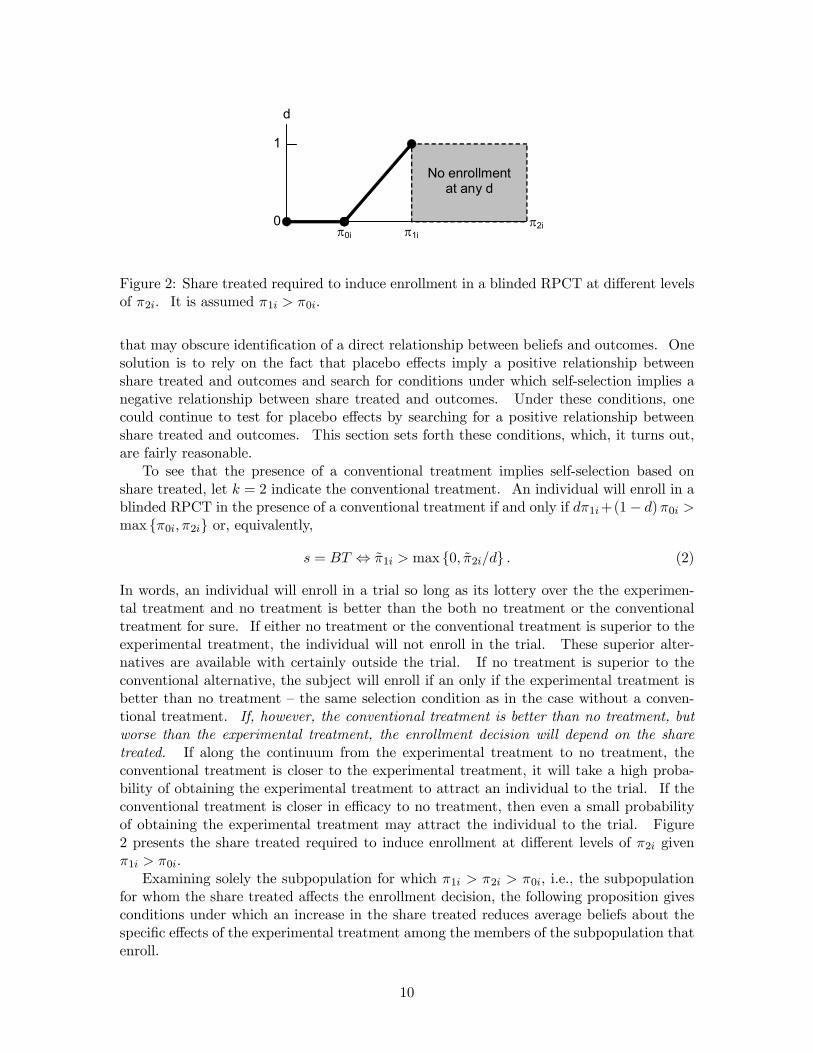
π2i π0i π1i
d
1
0
No enrollment
at any d
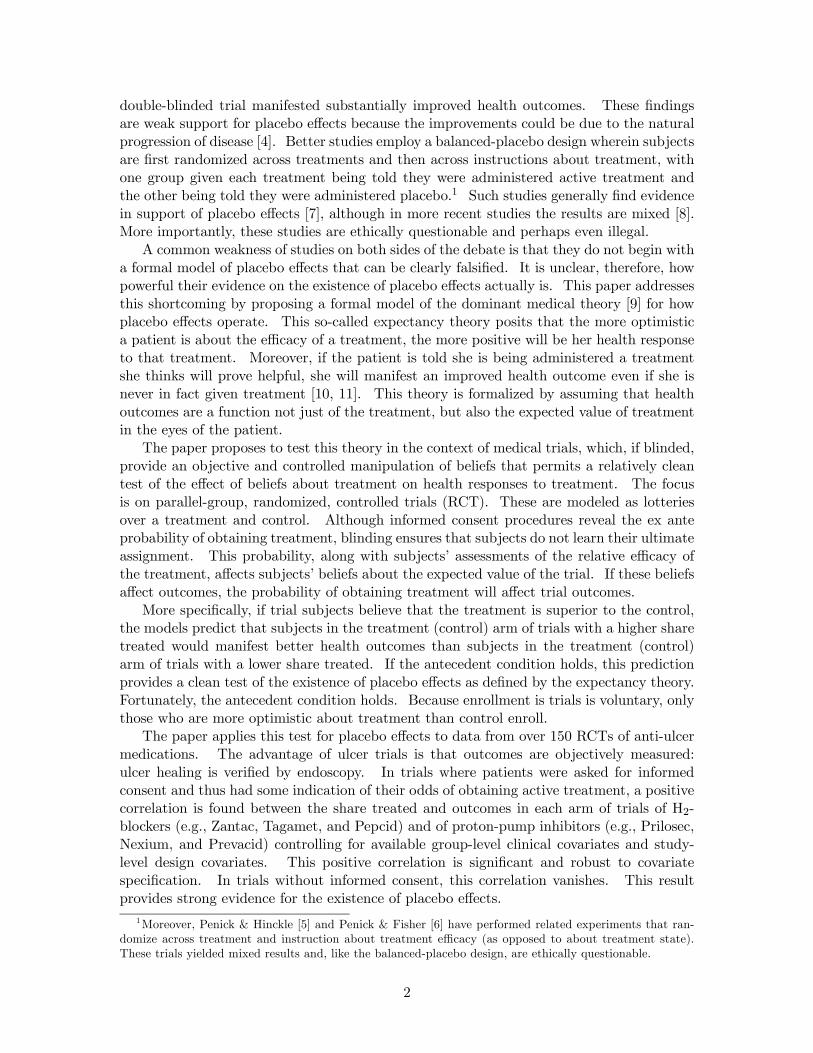
Figure 2: Share treated required to induce enrollment in a blinded RPCT at different levelsof π2i. It is assumed π1i > π0i.
that may obscure identification of a direct relationship between beliefs and outcomes. Onesolution is to rely on the fact that placebo effects imply a positive relationship betweenshare treated and outcomes and search for conditions under which self-selection implies anegative relationship between share treated and outcomes. Under these conditions, onecould continue to test for placebo effects by searching for a positive relationship betweenshare treated and outcomes. This section sets forth these conditions, which, it turns out,are fairly reasonable.
To see that the presence of a conventional treatment implies self-selection based onshare treated, let k = 2 indicate the conventional treatment. An individual will enroll in ablinded RPCT in the presence of a conventional treatment if and only if dπ1i+(1− d)π0i >max {π0i, π2i} or, equivalently,
s = BT ⇔ π1i > max {0, π2i/d} . (2)
In words, an individual will enroll in a trial so long as its lottery over the the experimen-tal treatment and no treatment is better than the both no treatment or the conventionaltreatment for sure. If either no treatment or the conventional treatment is superior to theexperimental treatment, the individual will not enroll in the trial. These superior alter-natives are available with certainly outside the trial. If no treatment is superior to theconventional alternative, the subject will enroll if an only if the experimental treatment isbetter than no treatment — the same selection condition as in the case without a conven-tional treatment. If, however, the conventional treatment is better than no treatment, butworse than the experimental treatment, the enrollment decision will depend on the sharetreated. If along the continuum from the experimental treatment to no treatment, theconventional treatment is closer to the experimental treatment, it will take a high proba-bility of obtaining the experimental treatment to attract an individual to the trial. If theconventional treatment is closer in efficacy to no treatment, then even a small probabilityof obtaining the experimental treatment may attract the individual to the trial. Figure2 presents the share treated required to induce enrollment at different levels of π2i givenπ1i > π0i.
Examining solely the subpopulation for which π1i > π2i > π0i, i.e., the subpopulationfor whom the share treated affects the enrollment decision, the following proposition givesconditions under which an increase in the share treated reduces average beliefs about thespecific effects of the experimental treatment among the members of the subpopulation thatenroll.
10
Proposition 4 Suppose that Eg [πki|π0i] = Eg [πki]; that πki > 0 for k = 1, 2; and that(ln π1i, ln π2i) have a non-degenerate log-concave or log-convex joint density with mean(µ1, µ2) and variance Σ. Define uki = ln πki − µi, Wi = u1i − u2i, σ = σ11 + σ22 − 2σ12,a1 = (σ11 − σ12) /σ, a2 = a1 − 1, and Vi = a1u2i − a2u1i. By construction ui = aiWi + Vi,where Wi and Vi are uncorrelated. Suppose further that Wi and Vi are actually indepen-dent. Define ρ12 = corr (ln π1i, ln π2i). If σ11 > σ12 or, equivalently, ρ12 < σ1/σ2, then∂Eg [π1i|π1i > π2i/d] /∂d ≤ 0 and ∂Eg [π0i|π1i > π2i/d] /∂d = 0.
Proof. See Appendix.Note that one can write πki = π0i + πki, for k = 1, 2. Because natural progression
is defined as the probability of recovery without treatment, this equation says that πkiis individual i’s beliefs about the physiological effects of treatment k. The assumptionthat πki and π0i are independent implies that the physiological effects of treatment k areindependent of the natural progression of disease. The purpose of this assumption isto ensure that selection pressures due to changes in treatment share do not affect thedistribution of beliefs about no treatment among enrollees.
The assumption that (ln π1i, ln π2i) is log-concave is not very restrictive. The class oflog-concave or log-convex densities is quite large. It includes, e.g., the bivariate normaldistribution. In that case, the fact that Wi and Vi are (by construction) uncorrelatedimplies they are also independent. Importantly, truncation of the range of πki at, e.g., onedoes not alter the result in Proposition 4. See Proposition 6 in An [17].
Proposition 4 says that, so long as the covariance between (log) beliefs about the phys-iological effects of the experimental and conventional treatments is less than the varianceof (log) beliefs about the experimental treatment, changes in the share treated, if anything,reduce enrollees’ expectations regarding the experimental treatment. From the definitionof the correlation coefficient, it is obvious that the condition on the covariance is satisfiedwhenever the variance of beliefs about the physiological effects of the experimental treat-ment is greater than the variance of beliefs about the conventional treatment. In this light,the condition on the covariance does not appear at all unreasonable. The experimentaltreatment, by virtue of being new, will be associated with greater uncertainty in beliefsamong the patient population than the conventional treatment.15
The intuition behind this result begins with the observation that an RPCT only attractsindividuals who believe that the experimental treatment is so much better than conventionaltreatment that, even with the risk of obtaining no treatment at all, enrolling in the trial isa superior strategy to opting for conventional treatment. If one alters a trial to increasethe probability of obtaining the experimental treatment, a patient who is marginally notoptimistic enough about the experimental treatment to have risked randomization into theplacebo-control group before may now be willing to take that risk because it is smaller.Moreover, because trials only attract subjects who believe that the experimental treatmentis superior to no treatment, altering a trial to increase the probability of obtaining theexperimental treatment also means that the trial will be attractive to individuals who werepreviously just marginally too pessimistic about no treatment to enroll because there is nowless risk of obtaining a placebo.
15Using a Taylor-series approximation, one can approximate the condition that ρ12 < σ1/σ2 for(ln π1, ln π2) with the condition that ρ12∗ < (µ2∗/µ1∗) (σ1∗/σ2∗), where (µ∗,Σ∗) are the mean and vari-ance of (π1i, π2i). Where the mean belief about the physiological effect of experimental treatment is greaterthan the mean belief about that of the conventional treatment, the condition on the correlation betweenthose beliefs is more constraining.
11
This logic is valid only if individuals who are optimistic about the experimental treat-ment aren’t too optimistic about conventional treatment as well. If individuals who aremore optimistic about the experimental treatment are also (sufficiently) more optimisticabout conventional treatment, individuals who are more optimistic about the experimentaltreatment are not more likely to join a trial at any given level of share treated. Although thevalue of trial is higher given these individuals’ optimism about the experimental treatment,so is their optimism about the conventional alternative. If these individuals are sufficientlyoptimistic about the alternative, they may prefer it to enrollment in the trial despite theirhigh expectations for the experimental treatment.16
Self-selection implies that trials with different treatment shares may have enrollee pop-ulations with different beliefs about each treatment. If there is no correlation betweenindividual beliefs and individual outcomes, share treated will not affect outcomes in theabsence of placebo effects. Although share treated may affect outcomes in the presenceof placebo effects, the direction of the relationship is not obvious. Nevertheless, one cantest for placebo effect by checking for any sort of correlation between treatment shares andoutcomes.
If, however, individual beliefs and individual outcomes are correlated, treatment shareswill affect outcomes even in the absence of placebo effects. It is reasonable to suppose thiscorrelation is positive. If it were negative, that would imply individuals who respond towell to treatment estimate that they do not, and those that do not respond well estimatethat they do. Although one might suppose individuals over- or under-estimate treatmentresponse, surely individuals do not guess their personal response in the manner suggestedby a negative correlation. Therefore, it is assumed that treatment efficacy and beliefs aboutefficacy are related according to the function
pki = f (πki) + vki, (3)
where f is everywhere continuously differentiable, f 0 > 0, and vki is independent of πk0i0 forall (k0, i0) and of vk0i0 for all (k0, i0) except (k0 = k, i0 = i). The error term vki reflects errorin predictions of specific efficacy by individual i.
This assumption implies the following proposition.
Proposition 5 Suppose ∂Eg [π1i|π1i > π2i/d] /∂d ≤ 0 but ∂Eg [π0i|π1i > π2i/d] /∂d = 0.If trials that have higher treatment shares but otherwise are identical yield higher meanoutcomes in the experimental treatment or yield different mean outcomes in no treatmentgroups, then there exist placebo effects as defined in section 3.
Proof. See Appendix.The change in trial outcomes given self-selection due to a change in share treated are a
weighted sum of the change in specific effects due to self-selection, the change in beliefs aboutspecific effects due to self-selection, and beliefs about the advantage of the experimental
16Consider the following numerical example. Suppose that one-half the population has beliefs(π0i, π1i, π2i) = (0.5, 0.5, 0.5) and one-half has beliefs (0.75− 1.5ε, 0.75 + ε, 0.75). A trial with d = 0.5will attract only the first group of individuals. A trial with d = 0.6, however, will attract both groups.Yet the average subject in the second trial would be more optimistic than the average person in the firsttrial with respect to the efficacy of both the experimental treatment and no treatment. The reason is thatcorrelation of π1i and π2i in the population is very high (specifically, greater than d = 0.5).
12
treatment over no treatment:
∂Eg [yk|s = BT ]
∂d= (1− a)
∂Eg [pk|s = BT ]
∂d(4)
+a∂Eg
£πBT |s = BT
¤∂d
(5)
+aπ1 (6)
The last term is a product of placebo effects.The presence of a conventional treatment means that the change in beliefs about specific
effects of the trial (5) may be non-zero. Proposition 4 gives the conditions under which thethis term is negative in the experimental treatment group and zero in the control group.The fact that beliefs and specific effects are correlated — where the direction of causationruns from specific effects to beliefs — means that the change in specific effects (4) is alsonon-zero in the experimental treatment group. Proposition 5 says the assumptions thatf 0 > 0 and that vki is independent of πk0i0 for all (k0, i0) mean the direction of changes inspecific effects of a treatment are the same the direction of changes in beliefs about thattreatment, i.e., are negative and zero in the case of the experimental treatment group andno treatment group, respectively.
If there are no placebo effects, changes in specific effects are all that drive outcomes. Achange in the share treated will lower outcomes in the experimental group and not affectoutcomes in the control group. If, however, there are placebo effects, the weight assigned tothe second (5) and (6) third terms is positive. The second term is negative for reasons justgiven. Moreover, it is a direct implication of the selection equation (2) that the term itselfis positive. The net effect is that the share treated can raise or lower outcomes in eithergroup. Therefore, if one finds evidence of a positive relationship between share treated andoutcomes in the experimental treatment or any non-zero relationship between share treatedand outcomes in the control group, there must exist placebo effects.
Note that the test for the experimental group is subject to significant Type II error.It is possible that placebo effects exist but that the self-selection, which tends to loweroutcomes, overwhelms it. If one could estimate the relationship between share treated andoutcomes while controlling for the effects of self-selection embodied in (4) and (5), the riskof Type II error would be diminished. This may be possible, e.g., if one has individuallevel data on enrollees and non-enrollees.
Finally, it should be noted that the results from this section apply to conventional controltrials. All that is required is that one switch the subscripts k = 0 and k = 2.
5 Application to Ulcer Trials
This section tests for the existence of placebo effects in clinical trials of anti-ulcer medica-tions that promise to heal ulcers.17 Ulcer trials are chosen because they offer objective
17de Craen et al. [18] and Moerman [19] claim to find evidence of placebo effects in ulcer trials. However,their findings do not warrant such a conclusion. The de Craen study finds that outcomes in the placebogroup of trials with a four-times-a-day (q.i.d.) regimen of placebo treatment are 6 - 8 percent higher thanin placebo groups of trials with a twice-a-day (b.i.d.) regimen. This is highly suggestive of placebo effects.However, the result does not differentiate between types of ulcer medication. When the authors examinedonly trials of H2-receptor antagonists, the difference dropped to 3 percent. (There was no indication whetherthis estimate is statistically significant.) Moreover, the authors do not relate their results to any specificmodels of placebo effects. Nor do they formally consider the interaction between the structure of the
13
measures of health outcomes. Ulcers are erosion of the mucous lining in the stomach orsmall intestine due to acid buildup. Ulcers can objectively be judged healed via endoscopy,which examines the stomach lining for evidence of damage. Moreover, because ulcers aresuch a common problem throughout the world, a large number of trials have been conducted.
The majority of ulcer trials examine three types of medication. The first type, H2-blocker, was introduced in 1977. The most popular brands are Tagamet (cimetidine),Zantac (ranitidine), and Pepcid (famotidine). H2-blockers prevent the production of acidin the stomach.18 The second type of medication, prostaglandin, was introduced in 1987.The most common prostaglandins are misoprostil and enprostil. These drugs build up andthus repair the mucous lining of the stomach and intestine. The third class, proton-pumpinhibitor, and were introduced after prostaglandins. The most popular brands are Prilosec(omeprazole), Nexium (esomeprazole) and Prevacid (lansoprazole). Like H2-blockers, thesemedications prevent the production of acid in the stomach.
5.1 Data
The data set includes the published results from over 150 clinical trials studying treatmentfor pyloric, pre-pyloric and duodenal ulcers.19 Each of the trials is randomized, parallel-armed, and double-blind, and employs either a placebo, antacid, bismuth subcitrate orconventional control. If conventional controls are employed, they are from either the sameor a previous class of medication as the experimental treatment. Importantly, subjects in110 of the trials were asked for informed consent prior to enrollment. Hence it is reasonableto suppose that subjects in those trials had some indication of their chance of obtaining theexperimental treatment.
Data were gathered on the characteristics of trials and of subjects. Data on subjectsare aggregated to the arm- or group-level. For example, there are data on the average ageof subjects assigned to any given treatment group, but not the age of each subject assignedto that group. Although there are data on subjects in a group as of the date that they arerandomized into the group, precise information on how the group changes due to attritionare not available. Table 2 provides summary statistics for the data, which are analyzed atthe treatment-group level. Data from groups examining H2-blockers, prostaglandins, andproton-pump inhibitors are presented separately.20
randomized, double-blind, placebo-controlled trials they examine and any theory of placebo effects theypurport to test. This is particularly important if, e.g., patients in q.i.d. trials receive the same total dosageas or different treatment than those in b.i.d. trials. (In the sample of ulcer trials I consider, all 12 of theb.i.d. trials examined ranitidine while 29 of 30 q.i.d. trials examined cimetidine. Both are H2-blockers, butrequire substantially different dosages. Moreover, the one q.i.d. trial of ranitidine involved the same totaldaily dosage as the 12 b.i.d. trials of the drug.) In that case, the result would be difficult to explain evenwith the model of health outcomes in Section 2.2. Nevertheless, the de Craen study’s findings are veryinteresting, and ought to be subject to the type of analysis in this paper.Moerman examines the same set of ulcer trials and finds a significant positive correlation (0.49) between
outcomes in the placebo group and the treatment group. Unfortunately, Moerman’s finding is not veryinformative: the positive correlation can be explained by self-selection alone. Such pressures tend to depressoutcomes in both the new treatment and placebo groups. Moreover, Moerman does not confine his sampleto trials with informed consent. It is unclear what information he thinks subjects had or why they respondedas they did.18 In contrast, antacids are alkali that absorb acid in the stomach. They reduce the amount of acid
available to damage the stomach lining, but not enough to permit the healing of damage to that lining.19These are ulcers that arise just before the pyloric tract, in that tract, or in the duodenum, respectively.
All are located just before the start of the small intestine.20There are several things to note about the data and Table 2. First, there are more groups given the
14
5.2 Empirical model
The specific effects of treatment k on individual i enrolled in trial j are assumed to bea deterministic, linear function of the vector xij , which includes a constant, clinical anddemographic variables on individual i, and structural features of trial j: pkij = β0kxij . Thisis a strong assumption, but because the ulcer trial data are rather course there is littlebenefit from a more nimble parameterization of pkij . Beliefs regarding specific effects areassumed to be given by πkij = γ0kxij + εkij ,21 where εkij is independent of xij and is i.i.d.mean-zero across individuals, trials, and treatment states, with mean zero and varianceσε. This condition on εkij implies that individual errors in estimating specific treatmentresponse do not depend on the treatment.
Because trials often take multiple measurements on each individual, a treatment’s effectis cast as a hazard rate.22 Assuming it is constant over time, (1) and the assumed parame-terization of (pkij , πij) imply − lnSijk (t) /t = θ(x)kxij + θ(xd)kdjxij + ηijk,
23 where Sijk (t)gives the probability of still having an unhealed ulcer on date t, θ(x)k = (1− ak)βk + akγ0,θ(xd)k = ak (γ1 − γ0), and ηijk = akdjε1ij + ak(1− dj)ε0ij . Summing over individuals anddividing by njk, the number of subjects enrolled in treatment arm k of trial j, yields theregression equation − lnSjk (t)/t = θ(x)kxjk + θ(xd)kdjxjk + ηjk. The left-hand side is afirst-order Taylor approximation around Sjk (t), the average probability of remaining ill at t.lnSjk (t) = ln (
Pi Sijk(t)/njk) is approximated by ln(Sjk (t)), the log of the observed group
survival rate. Approximating Sjk (t) is difficult because data on subjects who attrite out ofthe trials are not available. Therefore, Sjk (t) is calculated under three different assump-tions: individuals who attrite out heal at the same rate as those who remain, individualswho attrite out do not heal, and these individuals all heal.
experimental treatment than given the control. The reason is that each trial typically involves one controlarm but multiple experimental treatment arms. Typically these arms will vary the total daily dosage orthe daily frequency of medication. Second, the probability of active treatment is estimated by one minusthe probability of randomization into the placebo, antacid or bismith subcitrate group. The reason isthat, while individuals may have detectably different beliefs about the efficacy of some active treatmentversus no treatment, it is deemed unlikely that individuals have sufficiently refined beliefs about differentdosages of a given active treatment that one can identify the responsiveness of outcomes to changes in theprobability of randomization into each dosage arm. Thus variation in the number of new-treatment armsacross trials generates variation in the share treated in my data. Importantly, trials with same-class controlsare assumed to have a probability of new treatment equal to one. Third, 33, 40, and 80 percent of H2-blocker, prostaglandin, and proton-pump inhibitor trials, respectively, have lower-class drug conventionalcontrols. Fourth, the antacid-permitted variable is coded from 1 to 5. One indicates that subjects wereprohibited from taking antacids, two that subjects were discouraged from taking antacids, three that subjectswere permitted to take antacids (or the study did not counsel subjects on antacids), four that antacids wereprovided, and five that antacids were required. Fifth, the difference in total dosage and dosage frequencybetween different classes of anti-ulcer medications has little significance. Because the classes have differentchemistries and modalities, their recommended dosages are not comparable. Moreover, the total dosageof placebo, antacid or bismuth subcitrate controls is omitted because it has little meaning given that thecontrol is either inert or subjects are typically permitted to take antacid.21 If γk = βk, then the assumption implies rational expectations. The assumption of linearity limits the
scope of cognitive errors that may plague individual projections, but should not otherwise be controversial.The error term measures mistakes in prediction by an individual.22Survival analysis is better able to employ information on the timing of treatment response than, say, a
simple qualitative dependent-variable framework. Viewing (1) as a hazard function does not affect selectioninto the trial so long as the hazard function is time-invariant.23Division by t should not be problematic because ulcer trials are fairly short (maximum 12 weeks for
trials in the data set and 12-18 months in long-term ulcer trials) so t is small.
15
The regression equation that is ultimately estimated is
−1tln¡Sjkt
¢= θ(x)kxj + θ(xd)kdjxj + ωjk, (7)
for k = 0, 1, where Sjkt is approximated in one of the three methods discussed in the lastparagraph, xj = (1/njk)
Pi xij , ωjk = ηjk + ujkt + vjkt, and ujkt is the error from approxi-
matingP
i Sijk (t) with some function of yjkt. The Lagrange remainder from approximatingPi lnSijk (t) with njk ln
Pi Sijk (t) is absorbed into the coefficient on the constant.
24 Forsimplicity this is left out of the definition of θ(x)k. The error term vjkt captures the variationin the remainder across arms and trials.25
Under the conditions set forth in Section 4, a test for placebo effects is whether thereis a positive relationship between dj and survival. In the presence of a conventional alter-native, this test may be complicated by self-selection based on share treated, which impliesthat E (εkijdj |s = BT ) 6= 0. This problem is addressed in three different ways. The firstmethod, which is labeled the “no-conventional-alternative” approach, involves estimating(7) on a subsample of H2-blockers for which it is reasonable to believe there was no conven-tional alternative and thus no self-selection based on share treated. It is hypothesized thatthis includes all H2-blocker trials before 1987, when prostaglandins are first introduced.26
Because there is no obvious conventional alternative-free subsample for the other class ofdrugs, one cannot test for placebo effects employing this first approach to selection. Thesecond method, which is labeled “x-captures-selection” approach, is to employ the entiresample of trials for each class of anti-ulcer drug but assume that selection pressures arefully captured by observable variables. With the first two approaches, placebo effects aretested for by counting the number of treatment arms for which the predicted θ(xd)kxj issignificantly greater than zero. A third method, which is labeled “additional-d” approach, isto assume E (εkijdj |s = BT ) = 0 but partition xj = (xoj , x
uj ), where x
oj is observable but x
uj
may not be. xoj is chosen such that, as a theoretical matter, it ought to be θo(xd)kdjx
1j > 0.
Given that selection pressures depend on dj , it is assumed that θu(xd)kdjxuj = φ(xd)kd
2j + ejk,
where ejk is independent of dj and xoj . If selection is a problem but there are no placeboeffects, θu(xd)k and thus φ(xd)k should be zero. Thus, if the estimate of φ(xd)k is significantlydifferent from zero, then there must exist placebo effects or selection is not a problem.
5.3 Results
Table 3 presents results employing the x-captures-selection method of testing for placeboeffects in H2-blocker trials.27 The first four columns present coefficient estimates for treat-ment arms and different specifications of xj ; the last four do the same for control arms.24This approach bears some resemblence to Amemiya and Nold’s [20] adaptation of the logit model to
grouped data.25Because the hazard rate is Pr {yki = y|s} ∈ [0, 1], the parameterization in this paper requires estimation
of a linear probability model. While that model has been criticized for, e.g., potentionally generatingpredicted values outside the 0-1 range, it is not wholly inappropriate for the application in this paper. Asa theoretical matter, the dependent variable in (7) can range from (0,∞). Moreover, because individualsin an arm are aggregated, the error term is more likely to resemble a normal distribution [21]. Finally, (7)was modified and estimated as a generalized linear model with the dependent variable obeying the binomialdistribution and a logistic link function. However, nearly every specification performs worse on Pregibon’s[22] link test than the linear probability model.26Antacids are a poor substitute because they cannot heal an ulcer. Moreover, most trials permit subjects
to consume antacids as well as assigned treatment.27Estimation was by feasible GLS. Each measurement on an arm of a trial counts as an observation.
Some trials offer multiple measurements on the same arm. Observations were weighted such that each
16

Below the coefficient estimates for each specification are a panel of F-tests of the joint sig-nificance of certain subsets of regressors interacted with dj . Their purpose is to test whetherplacebo effects operate through any of these subsets of variables. Below the F-tests are fourfurther panels. The first gives the mean (and standard deviation of) estimated marginaleffect of share treated on outcomes:
∂[− ln ¡Sjkt¢ /t]/∂dj = θ(xd)kxj ≈ ∂yj/∂dj
The estimate of ∂yj/∂dj for each observation — a measurement on a particular arm of aparticular study — depends on the value of covariates for that observation and thereforehas its own standard error. The second panel gives the mean t-statistic for each estimateand the standard deviation of the t-statistic across all the measurements. To complete thepicture that these panels paint about the distribution of the estimated ∂yj/∂dj within andacross measurements, the third panel counts the number of measurements where the sharetreated is estimated to have raised outcomes at different levels of confidence (employing aone-sided test). The fourth counts of the number of measurements where the share treatedeither raised or depressed outcomes (employing a two-sided test).
For reference purposes, the theory in section 4 can be summarized as follows. Assum-ing (1) is a correct model of health outcomes, if there is no self-selection, either becausethere is no conventional alternative or selection is controlled by inclusion of appropriatecovariates, then a positive relationship between share treated and outcomes is evidence ofplacebo effects. If there is self-selection, but beliefs about specific effects and specific ef-fects themselves are not correlated, then any non-zero relationship between share treatedand outcomes is evidence of placebo effects. Finally, if there is self-selection and beliefsand specific effects are positively correlated, but the physiological effects of treatments areindependent of the natural progression of disease, then a positive relationship and non-zerorelationship between share treated and outcomes in the experimental treatment and controlgroups, respectively, are evidence of placebo effects. The experimental group test, how-ever, is subject to type II error: there may exist placebo effects, but it is drowned out by aself-selection effect.
The mean estimated marginal effect of share treated on outcomes in treatment armsis positive across all specifications. All measurements in the first specification manifest apositive relationship at the 95 percent confidence level. Around three-quarters of measure-ments in other specifications manifest a positive relationship at the 90 percent confidencelevel; over one-half do so at the 95 percent level. This last finding is illustrated graphically
arm makes a contribution to estimates in proportion to the number of subjects in the arm, regardless ofthe number of measurements made on each subject. The regression model suggests that the variance oferror terms depends on the share randomized into each arm. However, only one randomization share pertrial — namely the share not given a lower class or non-healing control — is measured. Therefore group-wise heteroskedasticity is permitted at the trial-level, but not at the arm-level. Only estimates where thedependent variable is calculated assuming subjects who attrite out heal at the same rate as those who areevaluated are reported. Results from regressions which assume that those who attrite out either all heal orall do not heal are not materially different.Four specifications of xj are estimated. Specification (1) includes a constant and dj ; (2) adds trial-level
variables (antacid usage, daily frequency of medication, total daily dosage of medication, total daily dosageof the more common drugs in the relevant class of medications) as well as interactions of these trial-levelvariables with dj ; (3) adds subject-level variables (sex, smoker, and age) and their interactions with dj ; and(4) removes the trial-level variables and interactions from (3). When the x-captures-selection method isemployed to control for selection, d2j is added to each specification. Each specification is checked againstPregibon’s link test [22]. Those that fail are marked with a dagger (†). The residuals were checked for butdid not reveal non-sawtooth patterns.
17
in Figures 3 and 4. The former plots the estimated ∂yj/∂dj from specification two inascending order, along with the 95 percent confidence interval for each estimated ∂yj/∂dj .The latter plots how estimated marginal effect of share treated varies with one covariate, forspecification two and an arbitrary subsample of the data. The covariate is the number oftimes per day medication was administered in arm j. The subsample is measurements thattake place two weeks after enrollment in a trial. In contrast, the mean estimated marginaleffect of share treated on outcomes in control arms is negative. Although, no arms that passPregibon’s link (specification) test manifest a positive relationship, significant or otherwise,between one-half and all measurements manifest a negative relationship significant at the95 percent confidence level.
If the covariates of a specification are able to control for selection, these findings suggestthat the treatment arms of H2-blocker trials manifest significant evidence of placebo effects,but the treatment arms do not. If the covariates do not fully control for selection, then botharms of these trials manifest significant evidence of placebo effects. The treatment armsdo so because they manifest a positive relationship between share treated and outcomes;the control arms do so because they manifest a non-zero relationship. The results of the F-tests do not permit one to conclude that placebo effects fail to operate through any naturalsubset of variables.
Table 4 presents further results for treatment arms, but for all three classes of anti-ulcerdrug, by specification and approach to selection. Table 5 does the same for control armsof trials. The tables present only the mean estimated marginal effect of share treated;counts of arms that manifest a significant positive relationship between share treated andoutcomes; and counts of arms that manifest a significant non-zero relationship betweenshare treated and outcomes. Coefficient estimates for the entire model and F-tests areomitted.
Arms treated with H2-blockers manifest strong evidence of placebo effects. With the no-conventional-alternative approach approximately one-third of measurements on these armsmanifest evidence of a positive relationship at the 95 percent confidence level in specifica-tions one and two. The additional-d approach supports an inference of placebo effects inthe first, third and fourth specifications, which return a coefficient on d2j that is significantlydifferent from zero. Arms treated with prostaglandins manifest weak evidence of placeboeffects. While no arms manifest evidence of a positive relationship using the x-captures-selection approach, nearly all manifest a non-zero relationship at the 95 percent confidencelevel under specifications one and two. The additional-d approach reveals significant ev-idence of placebo effects in the first two specifications. Arms treated with proton-pumpinhibitors manifest moderate evidence of placebo effects. Around a quarter of measure-ments manifest a significant positive relationship under the x-captures-selection approach inspecifications two to four. At least a quarter, and often nearly all, measurements manifestevidence of a non-zero relationship. However, under the additional-d method, only thesecond specification manifests placebo effects.
Turning to the control arms of these trials, while virtually no H2-blocker trials revealevidence of a positive relationship under the no-conventional-alternative approach, nearly alltrials reveal a non-zero relationship in specifications one and two. Moreover, the additional-d approach reveals evidence of placebo effects in specifications two through four. Thereis not enough evidence to conclude that there are placebo effects in the control arms ofprostaglandin trials using the x-captures-selection approach. This is likely a result of thesmall number of observations on prostaglandin trials. Nevertheless, there is evidence ofplacebo effects in specifications one and two employing the additional-d method. Finally,
18
around a third of measurements on control arms of proton-pump inhibitor trials manifestevidence of a positive relationship under specifications three and four when the x-captures-selection method is employed. At least two-third of measurements manifest evidence of asignificant non-zero relationship in specifications two through four. Moreover, specificationone manifests evidence of placebo effects when the additional-d approach is employed.28
Only trials where published reports confirm that subjects were asked for informed con-sent were included in these regression. The sample also contains, however, 20 trials ofH2-blockers where it cannot be confirmed that informed consent was requested. Regres-sions employing only these trials reveal significantly diminished evidence of placebo effects,except in the first specification employing x-captures-selection approach.29 (These resultsare omitted.) This finding is consistent with the assumption that individuals learn theprobability of receiving the experimental treatment via informed consent. Without thisdisclosure, an individual’s beliefs about the probability of treatment are unrelated to the ac-tual share treated. Therefore, outcomes, even if they depend on beliefs, should be invariantto the share treated in a trial.
6 Conclusion
This paper provides evidence of placebo effects in blinded, parallel-arm RCTs of H2-blockersand proton-pump inhibitors. The findings are summarized in Table 6. The results arenotable because they are derived from a model with clear assumptions and falsifiable pre-dictions. These features make interpretation of findings easier and lend credibility to theconclusion that placebo effects affect ulcer healing.
Further investigation is required, however, before placebo effects can be labeled a seriousmedical phenomenon. These effects may be ailment, drug and context specific. Futureresearch ought to proceed in two directions. One is theoretical. This paper assumes healthoutcomes follow a simple linear model and placebo effects have the same influence regardlessof treatment taken. It would be useful to have a more general test for placebo effects thatrelaxes these assumptions. This paper also examines only one type of trial. Many otherdesigns are employed in the medical literature. Malani [16] examines how robust the testfor placebo effects proposed in this paper is, e.g., to a multiplicative model of outcomes,and proposes tests for placebo effects in unblinded and cross-over trials. However, thiswork is just a beginning. A second avenue for research is application to other medicalcontexts, such as trials for other ulcer drugs, especially antibiotics, and trials of drugs forother ailments. Such research would also dispel concern that the findings of placebo effectsare an artifact of data from particular ulcer trials.
If placebo effect are found to be a widespread phenomenon, two questions will naturallyfollow. First, why do beliefs affect outcomes? Are placebo effects a behavioral or physio-logical phenomenon? Does a higher probability of treatment cause enrollees to take greater
28The proportional hazard model
ln − ln Sjkt = θ(t)kt+ θ(x)kxj + θ(xd)kdj xj + ωjk
was also estimated and produced similar results. The main difference is that there is somewhat strongerevidence of placebo effects. The coefficient on time is positive and significant, suggesting the risk ofhealing rises over time. The results from the proportional hazard model are not reported because far fewerspecifications pass the link test.29A subsample that also included trials conducted outside the U.S., Canada, Western Europe, Australia
or New Zealand yield similar results.
19
care of themselves in a way that improves their outcomes? Or does knowledge of higherprobability of treatment trigger a heightened immune response in enrollees? The answermay change our understanding of the connection between cognition and physiology.
A second question is: what are the implications of placebo effects for clinical practice?Malani [23] demonstrates that placebo effects undermine the internal validity of clinicaltrials. In particular, they cause investigators to underestimate the effect of treatment onthe treated. Outside the context of trials, enrollees would know whether they are takingmedication. Inside a blinded trial, they do not. Those randomized into the experimen-tal treatment group underperform — relative to knowing consumption of the experimentaltreatment outside the trial — because they think there is a chance they are getting the lessvaluable control treatment. Conversely, those randomized into the control group over per-form — relative to knowing consumption of no treatment outside a trial — because there ischance they may be getting the more valuable experimental treatment. The difference be-tween mean outcomes in the experimental and no treatment groups of a trial will thereforebe less than the difference between outcomes if enrollees consumed experimental treatmentand no treatment outside the trial. This negative bias may not only skew prescriptionpractice, but also cause the U.S. FDA not to approve valuable drugs.
An even more intriguing question is whether placebo effects can be used for therapeuticpurposes? For example, can a doctor cure a patient by suggesting that a drug is moreeffective than it really is or by falsely telling the patient that she is receiving treatment? Ifso, and if fooling patients is less costly than producing drugs, then placebo effects may beable to reduce the costs of health care. The existence of rational expectations may limit theproductivity of placebo effects as a long-term cost-cutting measure. It is an open question,however, how substantial the short-run cost savings might be.
A Proofs
Proposition 4. All expectations are taken with respect to gπ. Independence of πkiand π0i for k = 1, 2 implies that∂E[π1i|π1i > π2i/d]/∂d = 0 and ∂E[π1i|π1i > π2i/d]/∂d = ∂E[π1i|π1i > π2i/d]/∂d. Givenπki > 0, for k = 1, 2,E[π1i|π1i > π2i/d] = E[π1i| ln π1i − ln π2i > − ln d]. Because lnx is monotone increas-ing in x,
signµ∂E [π1i| ln π1i − ln π2i > − ln d]
∂d
¶= sign
µ∂E [ln π1i| ln π1i − ln π2i > − ln d]
∂d
¶.
Because Wi and Vi are independent,
E [ln π1i| ln π1i − ln π2i > − ln d] = µ1 + a1E (Wi|Wi > c (d, µ)) ,
where c (d, µ) = − (µ1 − µ2)− ln d.Log-concavity or log-convexity of (ln π1i, ln π2i) implies log-concavity or log-convexity,
respectively, of Wi, by theorem 5 in Bagnoli and Bergstrom [24] and [what], respectively.Propositions 1 and 2 in Heckman and Honore [25] demonstrate that log-concavity or log-convexity of Wi implies ∂E[Wi|Wi ≥ c]/∂c ≥ 0. Therefore,
∂E [ln π1i| ln π1i − ln π2i > − ln d]∂d
=σ11 − σ12
σ
∂E [Wi|Wi ≥ c]
∂c
∂c (d, µ)
∂d.
Because ∂c (d, µ) /∂d < 0, ∂E[ln π1i| ln π1i − ln π2i > − ln d]/∂d ≤ 0 so long as σ11 > σ12.This condition is the same as ρ12 < σ1/σ2.
20
Proposition 5. All expectations are taken with respect to gπ. By (1)
∂E [yki|π1i > π2i/d]
∂d= (1− a)
∂E [pki|π1i > π2i/d]
∂d
+a
·d∂E [π1i|π1i > π2i/d]
∂d+
∂E [π0i|π1i > π2i/d]
∂d
¸+ aπ1i.
Working backwards, the selection equation (2) implies π1i > 0. By assumption, ∂E[π0i|π1i >π2i/d]/∂d = 0. The proof to Proposition 4 demonstrates that
sign(∂E [π1i|π1i > π2i/d] /∂d) = sign(∂E [π1i|π1i > π2i/d] /∂d),
so ∂E[π1i|π1i > π2i/d]/∂d ≤ 0. By (3),∂E [pki|π1i > π2i/d]
∂d=
∂E [f (πki) |π1i > π2i/d]
∂d+
∂E [vki|π1i > π2i/d]
∂d.
The last term is zero because vki is assumed independent of πk0i0 for all (k0, i0) and of vk0i0for all (k0, i0) except (k0 = k, i0 = i). Since f 0 > 0,
sign(∂E [f (πki) |π1i > π2i/d]) = sign(∂E [πki|π1i > π2i/d]).
So ∂E[p1i|π1i > π2i/d]/∂d ≤ 0 and ∂E[p0i|π1i > π2i/d]/∂d = 0.If there are no placebo effects, i.e., a = 0, then ∂E[y1i|π1i > π2i/d]/∂d ≤ 0 and
∂E[y0i|π1i > π2i/d]/∂d = 0. If, however, there exist placebo effects, the sign of ∂E[yki|π1i >π2i/d]/∂d is ambiguous. If one finds that outcomes rise with share treated in the exper-imental treatment group or are at all correlated with share treated in the control groupand the model of health outcomes in (1) is accurate, then it must be that a > 0, i.e., thatplacebo effects exist.
References
[1] A. Hrobjartsson and P. C. Gotzsche, “Is the placebo powerless? an analysis of clinicaltrials comparing placebo with no treatment,” New England Journal of Medicine, vol.344, no. 21, pp. 1594—1602, 2001.
[2] I. Kirsch and G. Sapirstein, “Listening to prozac but hearing placebo: A meta-analysis of antidepressant medication,” Prevention and Treatment, vol. 1, no. 0002a,p. http://www.journals.apa.org/prevention/ volume1/pre0010002a.html, 1998.
[3] T. J. M. A. S. Kirsch, Irving and S. S. Nicholls, “The emperor’s newdrugs: An analysis of antidepressant medication data submitted to the u.s.food and drug administration,” Prevention and Treatment, vol. 5, no. 0023a, p.http://www.journals.apa.org/prevention/ volume5/pre0050023a.html, 2002.
[4] A. Hrobjartsson, “The uncontrollable placebo effect,” European Journal of ClinicalPharmacology, vol. 50, pp. 345—348, 1996.
[5] S. Penick and L. E. Hinkle, “The effect of expectation on response to phenmetrazine,”Psychosomatic Medicine, vol. 26, no. 4, pp. 369—374, 1964.
21
[6] S. B. Penick and S. Fisher, “Drug-set interaction: Psychological and physiologicaleffects of epiephrine under differential expectations,” Psychosomatic Medicine, vol. 27,no. 2, pp. 177—182, 1965.
[7] G. A. Marlatt and D. J. Rohsenow, “Cognitive processes in alcohol use: expectancyand the balanced placebo design,” in Advances in Substance Abuse, N. Mello, Ed.Greenwich, Conn.: JAI Press, 1980.
[8] I. Kirsch and L. J. Weixel, “Deouble-blind versus deceptive administration of aplacebo,” Behavioral Neuroscience, vol. 102, no. 2, pp. 319—323, April 1988.
[9] M. P. Jensen and P. Karoly, “Motivation and expectancy factors in symptom percep-tion: A laboratory study of the placebo effect,” Psychosomatic Medicine, vol. 53, pp.144—152, 1991.
[10] M. A. A. A. C. C. G. M. Pollo, Antonella and F. Benedetti, “Response expectanciesin placebo analgesia and their clinical relevance,” Pain, vol. 93, pp. 77—84, 2001.
[11] L. S. M. I. K. A. D. G. H. M. Price, Donald D. and S. S. Nicholls, “An analysis of factorsthat contribute to the magnitude of placebo analgesia in an experimental paradigm,”Pain, vol. 83, pp. 147—156, 1999.
[12] T. Philipson and J. DeSimone, “Experiments and subject sampling,” Biometrika,vol. 84, pp. 221—234, 1997.
[13] C. L. P. Voudouris, Nicholas J. and G. Coleman, “The role of conditioning and verbalexpectancy in the placebo response,” Pain, vol. 43, pp. 121—128, 1990.
[14] ––, “Conditioned response models of placebo phenomena: further support,” Pain,vol. 38, pp. 109—116, 1989.
[15] Y. M. M. A. Berthelot, Jean-Marie and A. Prost, “Interindividual variations in beliefsabout the placebo effect: a study in 300 rheumatology inpatients and 100 nurses,”Joint Bone Spine, vol. 68, pp. 65—70, 2001.
[16] A. Malani, “Placebo effects, self-selection and the external validity of clinical trials,”Ph.D. dissertation, University of Chicago, Department of Economics, Sept. 2003.
[17] M. Y. An, “Log-concave probability distributions: Theory and statistical testing,” June1996, centre for Labour Market and Social Research, University of Aarhus, WorkingPaper 96-01.
[18] D. E. M. S. H. H. G. N. T. J. G. T. de Craen, Anton J. M. and J. Kleijnen, “Placeboeffect in the treatment of duodenal ulcer,” British Journal of Clinical Pharmacology,vol. 48, pp. 853—860, 1999.
[19] D. E. Moerman, “Cultural variations in the placebo effect: ulcers, anxiety, and bloodpressure,” Medical Anthropology Quarterly, vol. 14, pp. 51—72, 2000.
[20] T. Amemiya and F. Nold, “A modified logit model,” Review of Economics and Statis-tics, vol. 57, no. 2, pp. 255—257, May 1975.
[21] G. Maddala, Limited Dependent and Qualitative Variables in Econometrics, ser. Econo-metric Society Monographs. New York: Cambridge University Press, 1983.
22
[22] D. Pregibon, “Goodness of link tests for generalized linear models,” Applied Statistics,vol. 29, pp. 15—24, 1980.
[23] A. Malani, “The internal and external validity of clinical trials in the presence ofplacebo effects,” 2003, university of Virginia.
[24] M. Bagnoli and T. Bergstrom, “Log-concave probability and its applications,” 1989,university of Michigan.
[25] J. Heckman and B. E. Honore, “The empirical content of the roy model,” Econometrica,vol. 58, no. 5, pp. 1121—1149, September 1990.
[26] E. Skovlund, “Should we tell trial patients that they might receive placebo?” Lancet,vol. 337, p. 1041, 1991.
[27] G. F. H. L. Skovlund, E. and B.-I. Nesheim, “Comparison of postpartum pain treat-ments using a sequential trial design i: paracetamol versus placebo,” European Journalof Clinical Pharmacology, vol. 40, no. 4, pp. 343—347, 1991.
[28] ––, “Comparison of postpartum pain treatments using a sequential trial design ii:naproxen versus paracetamol,” European Journal of Clinical Pharmacology, vol. 40,no. 6, pp. 539—542, 1991.
23
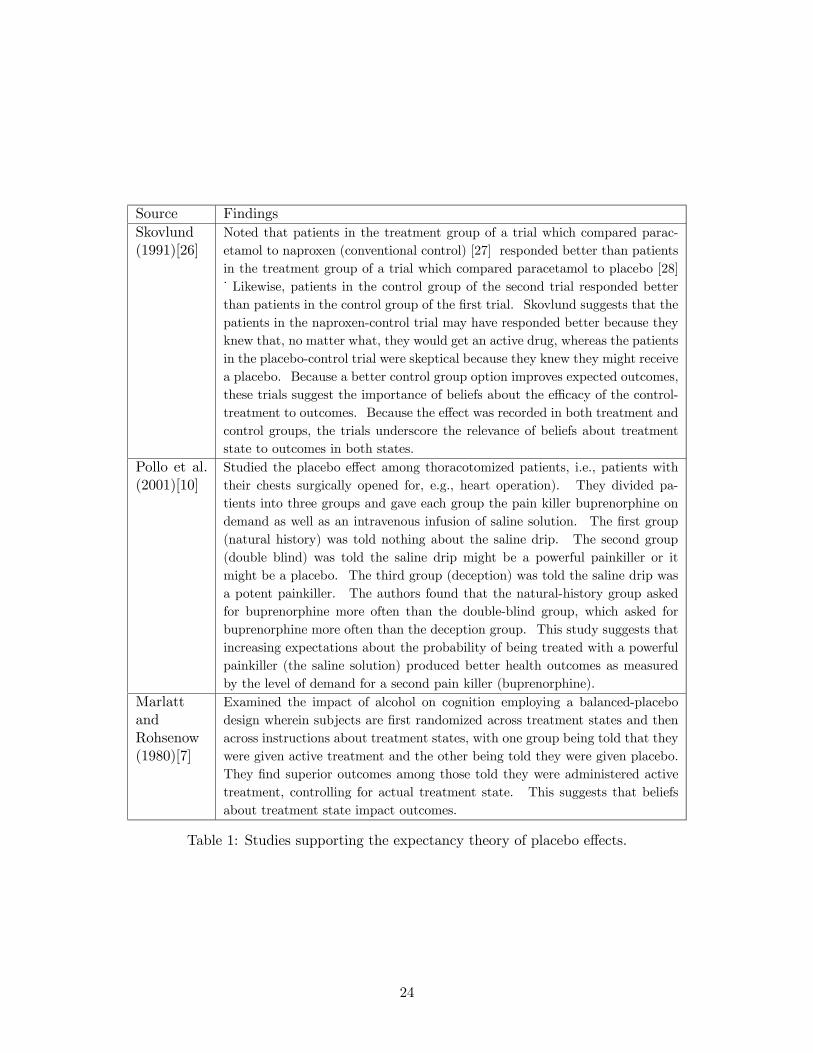
Source FindingsSkovlund(1991)[26]
Noted that patients in the treatment group of a trial which compared parac-etamol to naproxen (conventional control) [27] responded better than patientsin the treatment group of a trial which compared paracetamol to placebo [28]˙ Likewise, patients in the control group of the second trial responded betterthan patients in the control group of the first trial. Skovlund suggests that thepatients in the naproxen-control trial may have responded better because theyknew that, no matter what, they would get an active drug, whereas the patientsin the placebo-control trial were skeptical because they knew they might receivea placebo. Because a better control group option improves expected outcomes,these trials suggest the importance of beliefs about the efficacy of the control-treatment to outcomes. Because the effect was recorded in both treatment andcontrol groups, the trials underscore the relevance of beliefs about treatmentstate to outcomes in both states.
Pollo et al.(2001)[10]
Studied the placebo effect among thoracotomized patients, i.e., patients withtheir chests surgically opened for, e.g., heart operation). They divided pa-tients into three groups and gave each group the pain killer buprenorphine ondemand as well as an intravenous infusion of saline solution. The first group(natural history) was told nothing about the saline drip. The second group(double blind) was told the saline drip might be a powerful painkiller or itmight be a placebo. The third group (deception) was told the saline drip wasa potent painkiller. The authors found that the natural-history group askedfor buprenorphine more often than the double-blind group, which asked forbuprenorphine more often than the deception group. This study suggests thatincreasing expectations about the probability of being treated with a powerfulpainkiller (the saline solution) produced better health outcomes as measuredby the level of demand for a second pain killer (buprenorphine).
MarlattandRohsenow(1980)[7]
Examined the impact of alcohol on cognition employing a balanced-placebodesign wherein subjects are first randomized across treatment states and thenacross instructions about treatment states, with one group being told that theywere given active treatment and the other being told they were given placebo.They find superior outcomes among those told they were administered activetreatment, controlling for actual treatment state. This suggests that beliefsabout treatment state impact outcomes.
Table 1: Studies supporting the expectancy theory of placebo effects.
24
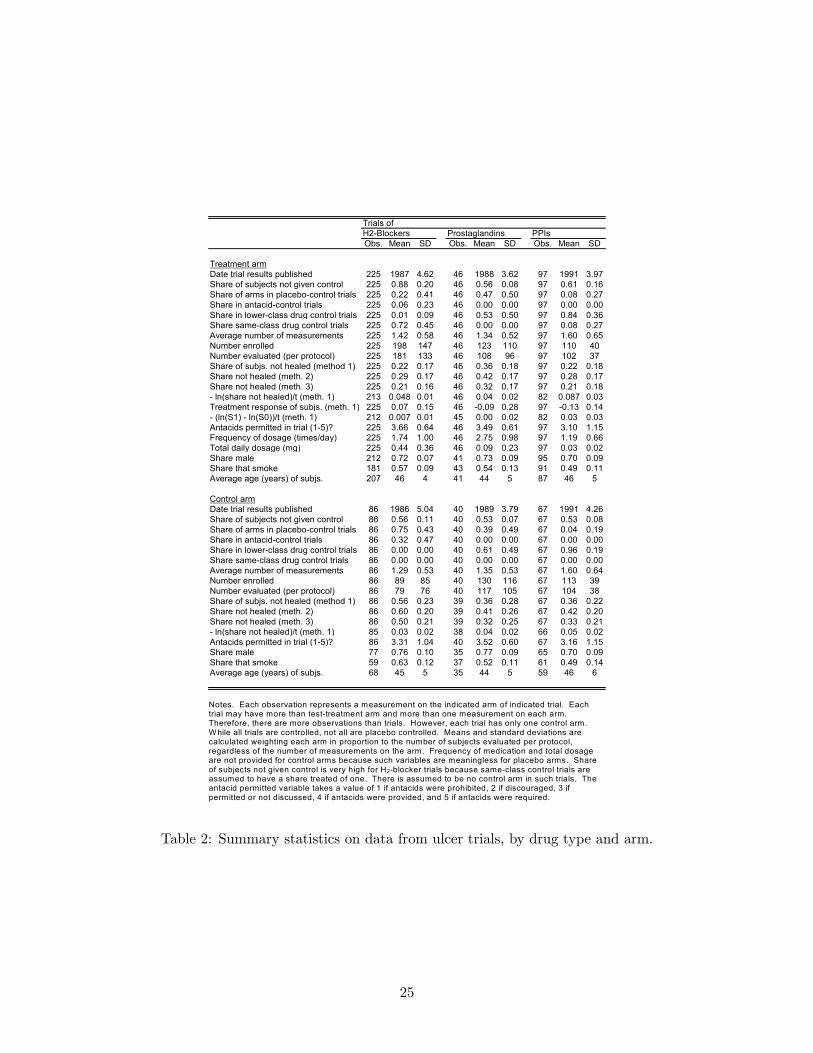
Trials of H2-Blockers Prostaglandins PPIsObs. Mean SD Obs. Mean SD Obs. Mean SD
Treatment armDate trial results published 225 1987 4.62 46 1988 3.62 97 1991 3.97Share of subjects not given control 225 0.88 0.20 46 0.56 0.08 97 0.61 0.16Share of arms in placebo-control trials 225 0.22 0.41 46 0.47 0.50 97 0.08 0.27Share in antacid-control trials 225 0.06 0.23 46 0.00 0.00 97 0.00 0.00Share in lower-class drug control trials 225 0.01 0.09 46 0.53 0.50 97 0.84 0.36Share same-class drug control trials 225 0.72 0.45 46 0.00 0.00 97 0.08 0.27Average number of measurements 225 1.42 0.58 46 1.34 0.52 97 1.60 0.65Number enrolled 225 198 147 46 123 110 97 110 40Number evaluated (per protocol) 225 181 133 46 108 96 97 102 37Share of subjs. not healed (method 1) 225 0.22 0.17 46 0.36 0.18 97 0.22 0.18Share not healed (meth. 2) 225 0.29 0.17 46 0.42 0.17 97 0.28 0.17Share not healed (meth. 3) 225 0.21 0.16 46 0.32 0.17 97 0.21 0.18- ln(share not healed)/t (meth. 1) 213 0.048 0.01 46 0.04 0.02 82 0.087 0.03Treatment response of subjs. (meth. 1) 225 0.07 0.15 46 -0.09 0.28 97 -0.13 0.14- (ln(S1) - ln(S0))/t (meth. 1) 212 0.007 0.01 45 0.00 0.02 82 0.03 0.03Antacids permitted in trial (1-5)? 225 3.66 0.64 46 3.49 0.61 97 3.10 1.15Frequency of dosage (times/day) 225 1.74 1.00 46 2.75 0.98 97 1.19 0.66Total daily dosage (mg) 225 0.44 0.36 46 0.09 0.23 97 0.03 0.02Share male 212 0.72 0.07 41 0.73 0.09 95 0.70 0.09Share that smoke 181 0.57 0.09 43 0.54 0.13 91 0.49 0.11Average age (years) of subjs. 207 46 4 41 44 5 87 46 5
Control armDate trial results published 86 1986 5.04 40 1989 3.79 67 1991 4.26Share of subjects not given control 86 0.56 0.11 40 0.53 0.07 67 0.53 0.08Share of arms in placebo-control trials 86 0.75 0.43 40 0.39 0.49 67 0.04 0.19Share in antacid-control trials 86 0.32 0.47 40 0.00 0.00 67 0.00 0.00Share in lower-class drug control trials 86 0.00 0.00 40 0.61 0.49 67 0.96 0.19Share same-class drug control trials 86 0.00 0.00 40 0.00 0.00 67 0.00 0.00Average number of measurements 86 1.29 0.53 40 1.35 0.53 67 1.60 0.64Number enrolled 86 89 85 40 130 116 67 113 39Number evaluated (per protocol) 86 79 76 40 117 105 67 104 38Share of subjs. not healed (method 1) 86 0.56 0.23 39 0.36 0.28 67 0.36 0.22Share not healed (meth. 2) 86 0.60 0.20 39 0.41 0.26 67 0.42 0.20Share not healed (meth. 3) 86 0.50 0.21 39 0.32 0.25 67 0.33 0.21- ln(share not healed)/t (meth. 1) 85 0.03 0.02 38 0.04 0.02 66 0.05 0.02Antacids permitted in trial (1-5)? 86 3.31 1.04 40 3.52 0.60 67 3.16 1.15Share male 77 0.76 0.10 35 0.77 0.09 65 0.70 0.09Share that smoke 59 0.63 0.12 37 0.52 0.11 61 0.49 0.14Average age (years) of subjs. 68 45 5 35 44 5 59 46 6
Notes. Each observation represents a measurement on the indicated arm of indicated trial. Each trial may have more than test-treatment arm and more than one measurement on each arm. Therefore, there are more observations than trials. However, each trial has only one control arm. While all trials are controlled, not all are placebo controlled. Means and standard deviations are calculated weighting each arm in proportion to the number of subjects evaluated per protocol, regardless of the number of measurements on the arm. Frequency of medication and total dosage are not provided for control arms because such variables are meaningless for placebo arms. Share of subjects not given control is very high for H2-blocker trials because same-class control trials are assumed to have a share treated of one. There is assumed to be no control arm in such trials. The antacid permitted variable takes a value of 1 if antacids were prohibited, 2 if discouraged, 3 if permitted or not discussed, 4 if antacids were provided, and 5 if antacids were required.
Table 2: Summary statistics on data from ulcer trials, by drug type and arm.
25
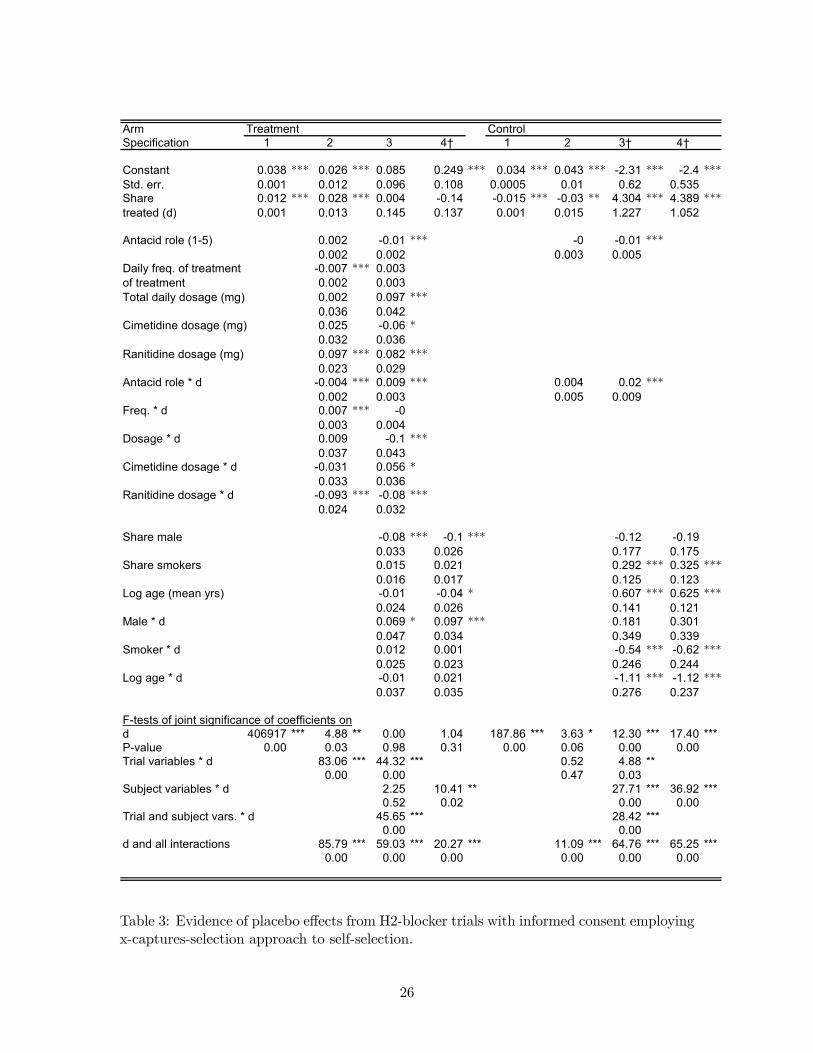
Arm Treatment ControlSpecification 1 2 3 4† 1 2 3† 4†
Constant 0.038 *** 0.026 *** 0.085 0.249 *** 0.034 *** 0.043 *** -2.31 *** -2.4 ***Std. err. 0.001 0.012 0.096 0.108 0.0005 0.01 0.62 0.535Share 0.012 *** 0.028 *** 0.004 -0.14 -0.015 *** -0.03 ** 4.304 *** 4.389 ***treated (d) 0.001 0.013 0.145 0.137 0.001 0.015 1.227 1.052
Antacid role (1-5) 0.002 -0.01 *** -0 -0.01 ***0.002 0.002 0.003 0.005
Daily freq. of treatment -0.007 *** 0.003of treatment 0.002 0.003Total daily dosage (mg) 0.002 0.097 ***
0.036 0.042Cimetidine dosage (mg) 0.025 -0.06 *
0.032 0.036Ranitidine dosage (mg) 0.097 *** 0.082 ***
0.023 0.029Antacid role * d -0.004 *** 0.009 *** 0.004 0.02 ***
0.002 0.003 0.005 0.009Freq. * d 0.007 *** -0
0.003 0.004Dosage * d 0.009 -0.1 ***
0.037 0.043Cimetidine dosage * d -0.031 0.056 *
0.033 0.036Ranitidine dosage * d -0.093 *** -0.08 ***
0.024 0.032
Share male -0.08 *** -0.1 *** -0.12 -0.190.033 0.026 0.177 0.175
Share smokers 0.015 0.021 0.292 *** 0.325 ***0.016 0.017 0.125 0.123
Log age (mean yrs) -0.01 -0.04 * 0.607 *** 0.625 ***0.024 0.026 0.141 0.121
Male * d 0.069 * 0.097 *** 0.181 0.3010.047 0.034 0.349 0.339
Smoker * d 0.012 0.001 -0.54 *** -0.62 ***0.025 0.023 0.246 0.244
Log age * d -0.01 0.021 -1.11 *** -1.12 ***0.037 0.035 0.276 0.237
F-tests of joint significance of coefficients ond 406917 *** 4.88 ** 0.00 1.04 187.86 *** 3.63 * 12.30 *** 17.40 ***P-value 0.00 0.03 0.98 0.31 0.00 0.06 0.00 0.00Trial variables * d 83.06 *** 44.32 *** 0.52 4.88 **
0.00 0.00 0.47 0.03Subject variables * d 2.25 10.41 ** 27.71 *** 36.92 ***
0.52 0.02 0.00 0.00Trial and subject vars. * d 45.65 *** 28.42 ***
0.00 0.00d and all interactions 85.79 *** 59.03 *** 20.27 *** 11.09 *** 64.76 *** 65.25 ***
0.00 0.00 0.00 0.00 0.00 0.00
Table 3: Evidence of placebo effects from H2-blocker trials with informed consent employingx-captures-selection approach to self-selection.
26
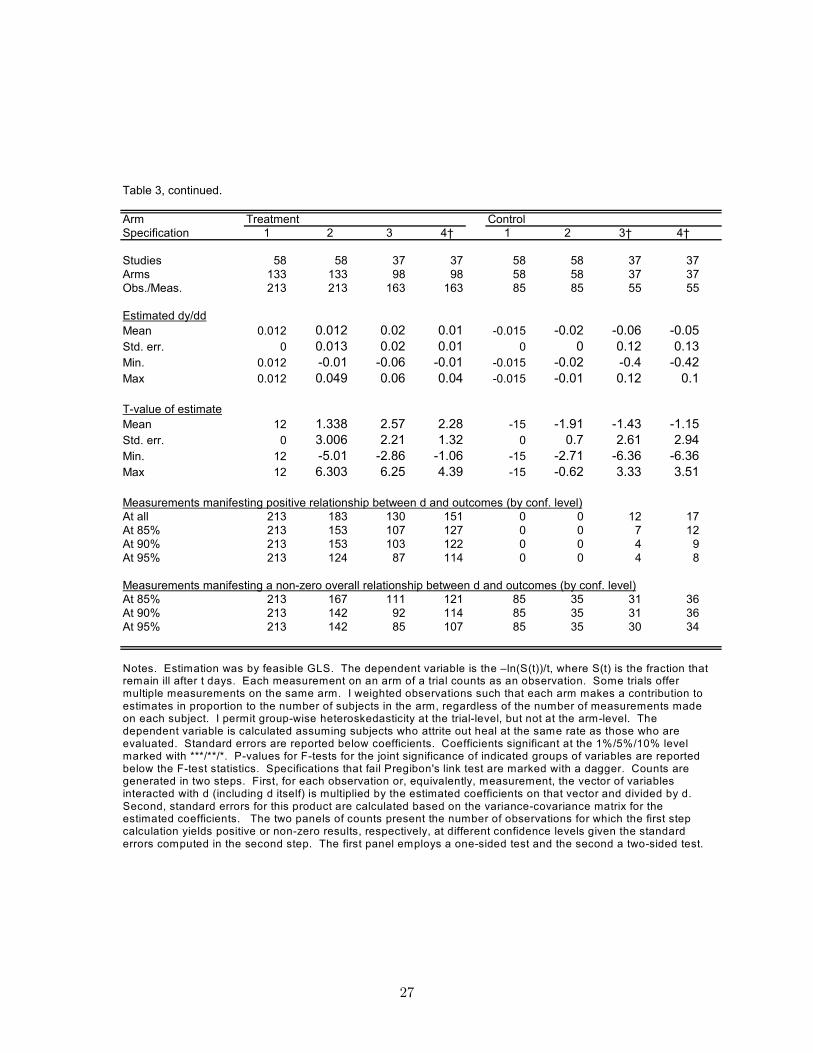
Table 3, continued.
Arm Treatment ControlSpecification 1 2 3 4† 1 2 3† 4†
Studies 58 58 37 37 58 58 37 37Arms 133 133 98 98 58 58 37 37Obs./Meas. 213 213 163 163 85 85 55 55
Estimated dy/ddMean 0.012 0.012 0.02 0.01 -0.015 -0.02 -0.06 -0.05Std. err. 0 0.013 0.02 0.01 0 0 0.12 0.13Min. 0.012 -0.01 -0.06 -0.01 -0.015 -0.02 -0.4 -0.42Max 0.012 0.049 0.06 0.04 -0.015 -0.01 0.12 0.1
T-value of estimateMean 12 1.338 2.57 2.28 -15 -1.91 -1.43 -1.15Std. err. 0 3.006 2.21 1.32 0 0.7 2.61 2.94Min. 12 -5.01 -2.86 -1.06 -15 -2.71 -6.36 -6.36Max 12 6.303 6.25 4.39 -15 -0.62 3.33 3.51
Measurements manifesting positive relationship between d and outcomes (by conf. level)At all 213 183 130 151 0 0 12 17At 85% 213 153 107 127 0 0 7 12At 90% 213 153 103 122 0 0 4 9At 95% 213 124 87 114 0 0 4 8
Measurements manifesting a non-zero overall relationship between d and outcomes (by conf. level)At 85% 213 167 111 121 85 35 31 36At 90% 213 142 92 114 85 35 31 36At 95% 213 142 85 107 85 35 30 34
Notes. Estimation was by feasible GLS. The dependent variable is the –ln(S(t))/t, where S(t) is the fraction that remain ill after t days. Each measurement on an arm of a trial counts as an observation. Some trials offer multiple measurements on the same arm. I weighted observations such that each arm makes a contribution to estimates in proportion to the number of subjects in the arm, regardless of the number of measurements made on each subject. I permit group-wise heteroskedasticity at the trial-level, but not at the arm-level. The dependent variable is calculated assuming subjects who attrite out heal at the same rate as those who are evaluated. Standard errors are reported below coefficients. Coefficients significant at the 1%/5%/10% level marked with ***/**/*. P-values for F-tests for the joint significance of indicated groups of variables are reported below the F-test statistics. Specifications that fail Pregibon's link test are marked with a dagger. Counts are generated in two steps. First, for each observation or, equivalently, measurement, the vector of variables interacted with d (including d itself) is multiplied by the estimated coefficients on that vector and divided by d. Second, standard errors for this product are calculated based on the variance-covariance matrix for the estimated coefficients. The two panels of counts present the number of observations for which the first step calculation yields positive or non-zero results, respectively, at different confidence levels given the standard errors computed in the second step. The first panel employs a one-sided test and the second a two-sided test.
27
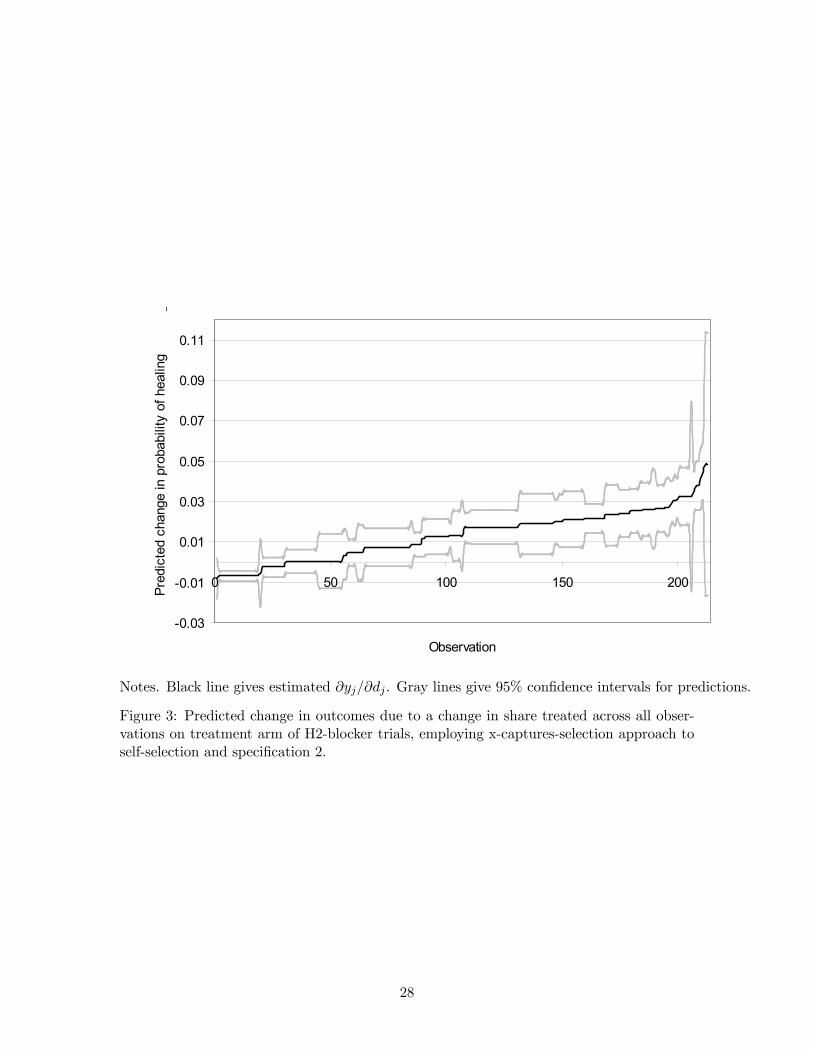
-0.03
-0.01
0.01
0.03
0.05
0.07
0.09
0.11
0 50 100 150 200
Observation
Pred
icte
d ch
ange
in p
roba
bilit
y of
hea
ling
_
Notes. Black line gives estimated ∂yj/∂dj . Gray lines give 95% confidence intervals for predictions.
Figure 3: Predicted change in outcomes due to a change in share treated across all obser-vations on treatment arm of H2-blocker trials, employing x-captures-selection approach toself-selection and specification 2.
28
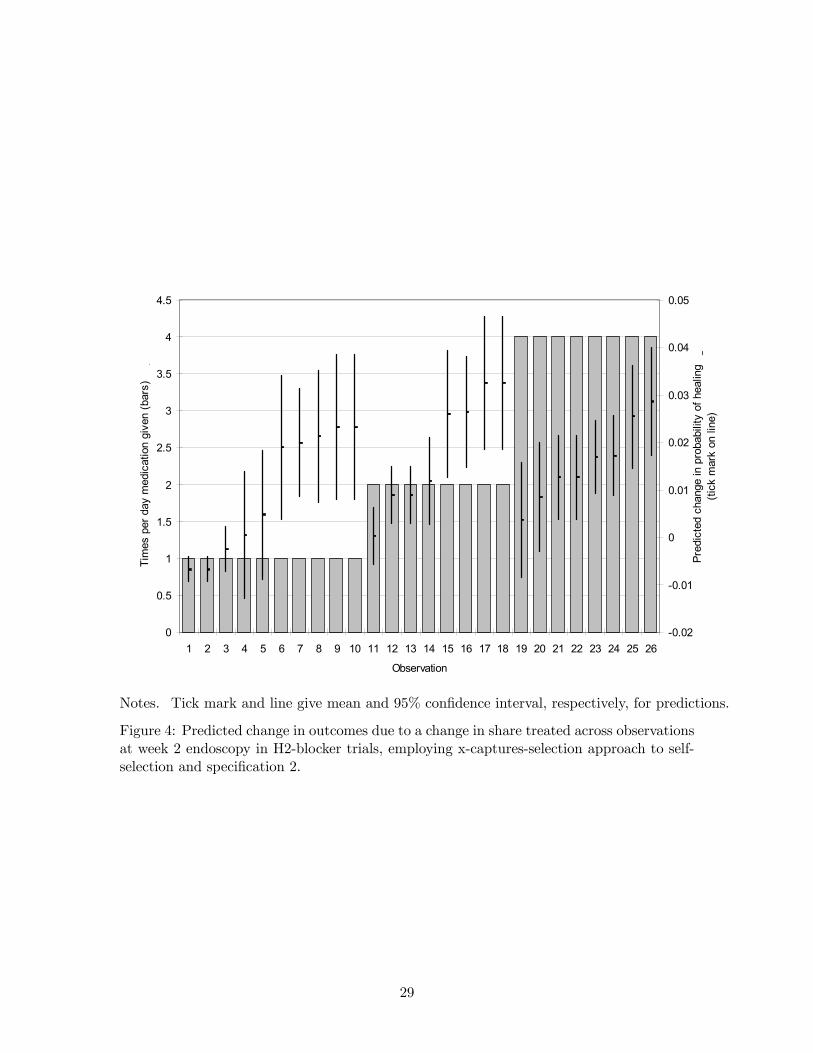
0
0.5
1
1.5
2
2.5
3
3.5
4
4.5
1 2 3 4 5 6 7 8 9 10 11 12 13 14 15 16 17 18 19 20 21 22 23 24 25 26
Observation
Tim
es p
er d
ay m
edic
atio
n gi
ven
(bar
s)
_
-0.02
-0.01
0
0.01
0.02
0.03
0.04
0.05
Pred
icte
d ch
ange
in p
roba
bilit
y of
hea
ling
_(ti
ck m
ark
on li
ne)
Notes. Tick mark and line give mean and 95% confidence interval, respectively, for predictions.
Figure 4: Predicted change in outcomes due to a change in share treated across observationsat week 2 endoscopy in H2-blocker trials, employing x-captures-selection approach to self-selection and specification 2.
29
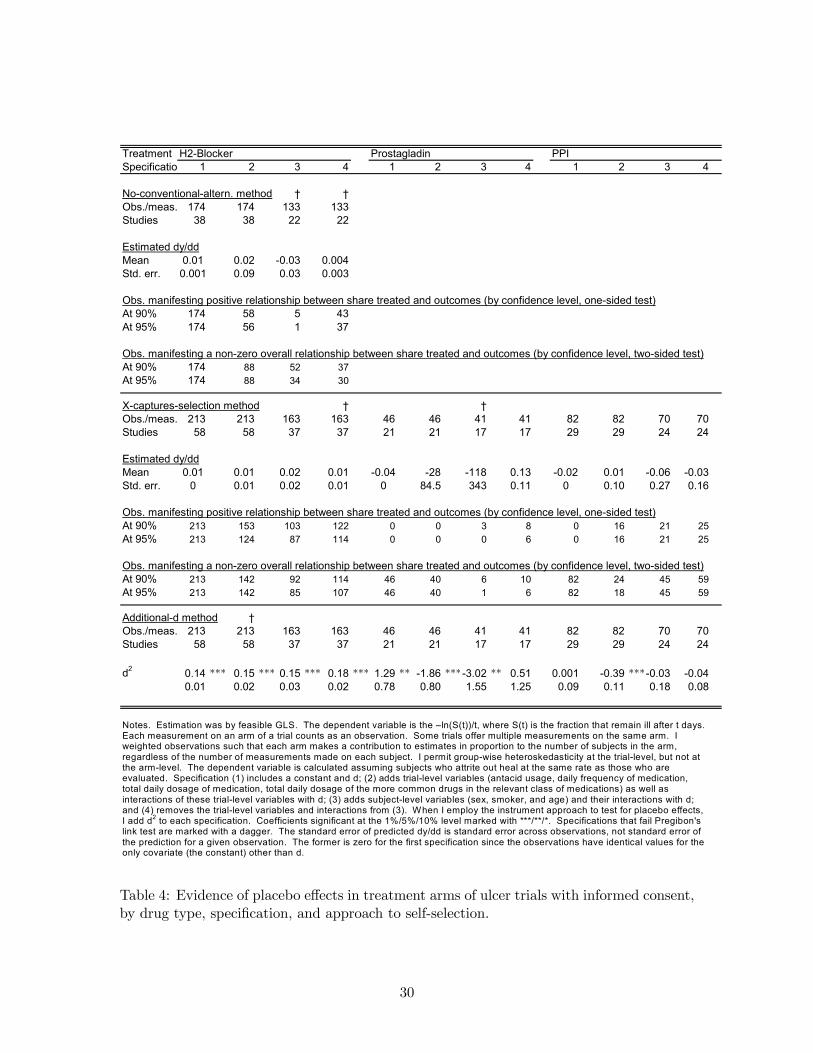
Treatment H2-Blocker Prostagladin PPISpecificatio 1 2 3 4 1 2 3 4 1 2 3 4
No-conventional-altern. method † †Obs./meas. 174 174 133 133Studies 38 38 22 22
Estimated dy/ddMean 0.01 0.02 -0.03 0.004Std. err. 0.001 0.09 0.03 0.003
Obs. manifesting positive relationship between share treated and outcomes (by confidence level, one-sided test)At 90% 174 58 5 43At 95% 174 56 1 37
Obs. manifesting a non-zero overall relationship between share treated and outcomes (by confidence level, two-sided test)At 90% 174 88 52 37At 95% 174 88 34 30
X-captures-selection method † †Obs./meas. 213 213 163 163 46 46 41 41 82 82 70 70Studies 58 58 37 37 21 21 17 17 29 29 24 24
Estimated dy/ddMean 0.01 0.01 0.02 0.01 -0.04 -28 -118 0.13 -0.02 0.01 -0.06 -0.03Std. err. 0 0.01 0.02 0.01 0 84.5 343 0.11 0 0.10 0.27 0.16
Obs. manifesting positive relationship between share treated and outcomes (by confidence level, one-sided test)At 90% 213 153 103 122 0 0 3 8 0 16 21 25At 95% 213 124 87 114 0 0 0 6 0 16 21 25
Obs. manifesting a non-zero overall relationship between share treated and outcomes (by confidence level, two-sided test)At 90% 213 142 92 114 46 40 6 10 82 24 45 59At 95% 213 142 85 107 46 40 1 6 82 18 45 59
Additional-d method †Obs./meas. 213 213 163 163 46 46 41 41 82 82 70 70Studies 58 58 37 37 21 21 17 17 29 29 24 24
d2 0.14 *** 0.15 *** 0.15 *** 0.18 *** 1.29 ** -1.86 ***-3.02 ** 0.51 0.001 -0.39 ***-0.03 -0.040.01 0.02 0.03 0.02 0.78 0.80 1.55 1.25 0.09 0.11 0.18 0.08
Notes. Estimation was by feasible GLS. The dependent variable is the –ln(S(t))/t, where S(t) is the fraction that remain ill after t days. Each measurement on an arm of a trial counts as an observation. Some trials offer multiple measurements on the same arm. I weighted observations such that each arm makes a contribution to estimates in proportion to the number of subjects in the arm, regardless of the number of measurements made on each subject. I permit group-wise heteroskedasticity at the trial-level, but not at the arm-level. The dependent variable is calculated assuming subjects who attrite out heal at the same rate as those who are evaluated. Specification (1) includes a constant and d; (2) adds trial-level variables (antacid usage, daily frequency of medication, total daily dosage of medication, total daily dosage of the more common drugs in the relevant class of medications) as well as interactions of these trial-level variables with d; (3) adds subject-level variables (sex, smoker, and age) and their interactions with d; and (4) removes the trial-level variables and interactions from (3). When I employ the instrument approach to test for placebo effects, I add d2 to each specification. Coefficients significant at the 1%/5%/10% level marked with ***/**/*. Specifications that fail Pregibon's link test are marked with a dagger. The standard error of predicted dy/dd is standard error across observations, not standard error of the prediction for a given observation. The former is zero for the first specification since the observations have identical values for the only covariate (the constant) other than d.
Table 4: Evidence of placebo effects in treatment arms of ulcer trials with informed consent,by drug type, specification, and approach to self-selection.
30
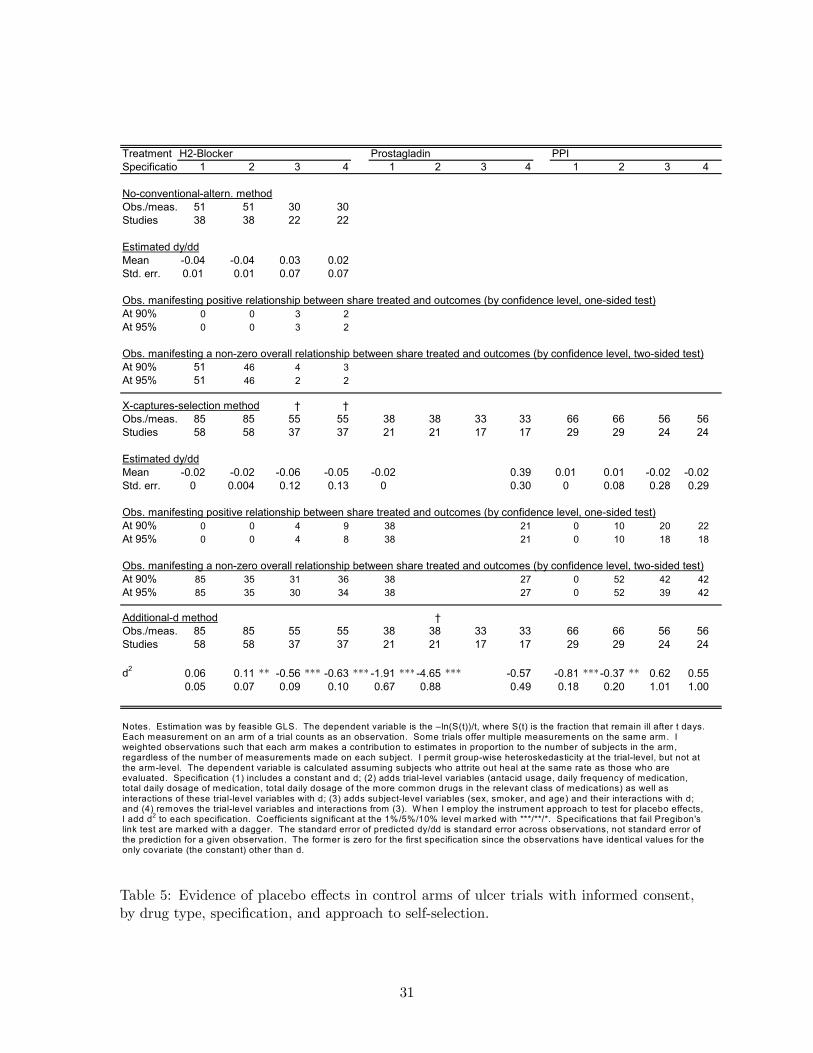
Treatment H2-Blocker Prostagladin PPISpecificatio 1 2 3 4 1 2 3 4 1 2 3 4
No-conventional-altern. methodObs./meas. 51 51 30 30Studies 38 38 22 22
Estimated dy/ddMean -0.04 -0.04 0.03 0.02Std. err. 0.01 0.01 0.07 0.07
Obs. manifesting positive relationship between share treated and outcomes (by confidence level, one-sided test)At 90% 0 0 3 2At 95% 0 0 3 2
Obs. manifesting a non-zero overall relationship between share treated and outcomes (by confidence level, two-sided test)At 90% 51 46 4 3At 95% 51 46 2 2
X-captures-selection method † †Obs./meas. 85 85 55 55 38 38 33 33 66 66 56 56Studies 58 58 37 37 21 21 17 17 29 29 24 24
Estimated dy/ddMean -0.02 -0.02 -0.06 -0.05 -0.02 0.39 0.01 0.01 -0.02 -0.02Std. err. 0 0.004 0.12 0.13 0 0.30 0 0.08 0.28 0.29
Obs. manifesting positive relationship between share treated and outcomes (by confidence level, one-sided test)At 90% 0 0 4 9 38 21 0 10 20 22At 95% 0 0 4 8 38 21 0 10 18 18
Obs. manifesting a non-zero overall relationship between share treated and outcomes (by confidence level, two-sided test)At 90% 85 35 31 36 38 27 0 52 42 42At 95% 85 35 30 34 38 27 0 52 39 42
Additional-d method †Obs./meas. 85 85 55 55 38 38 33 33 66 66 56 56Studies 58 58 37 37 21 21 17 17 29 29 24 24
d2 0.06 0.11 ** -0.56 *** -0.63 *** -1.91 ***-4.65 *** -0.57 -0.81 ***-0.37 ** 0.62 0.550.05 0.07 0.09 0.10 0.67 0.88 0.49 0.18 0.20 1.01 1.00
Notes. Estimation was by feasible GLS. The dependent variable is the –ln(S(t))/t, where S(t) is the fraction that remain ill after t days. Each measurement on an arm of a trial counts as an observation. Some trials offer multiple measurements on the same arm. I weighted observations such that each arm makes a contribution to estimates in proportion to the number of subjects in the arm, regardless of the number of measurements made on each subject. I permit group-wise heteroskedasticity at the trial-level, but not at the arm-level. The dependent variable is calculated assuming subjects who attrite out heal at the same rate as those who are evaluated. Specification (1) includes a constant and d; (2) adds trial-level variables (antacid usage, daily frequency of medication, total daily dosage of medication, total daily dosage of the more common drugs in the relevant class of medications) as well as interactions of these trial-level variables with d; (3) adds subject-level variables (sex, smoker, and age) and their interactions with d; and (4) removes the trial-level variables and interactions from (3). W hen I employ the instrument approach to test for placebo effects, I add d2 to each specification. Coefficients significant at the 1%/5%/10% level marked with ***/**/*. Specifications that fail Pregibon's link test are marked with a dagger. The standard error of predicted dy/dd is standard error across observations, not standard error of the prediction for a given observation. The former is zero for the first specification since the observations have identical values for the only covariate (the constant) other than d.
Table 5: Evidence of placebo effects in control arms of ulcer trials with informed consent,by drug type, specification, and approach to self-selection.
31
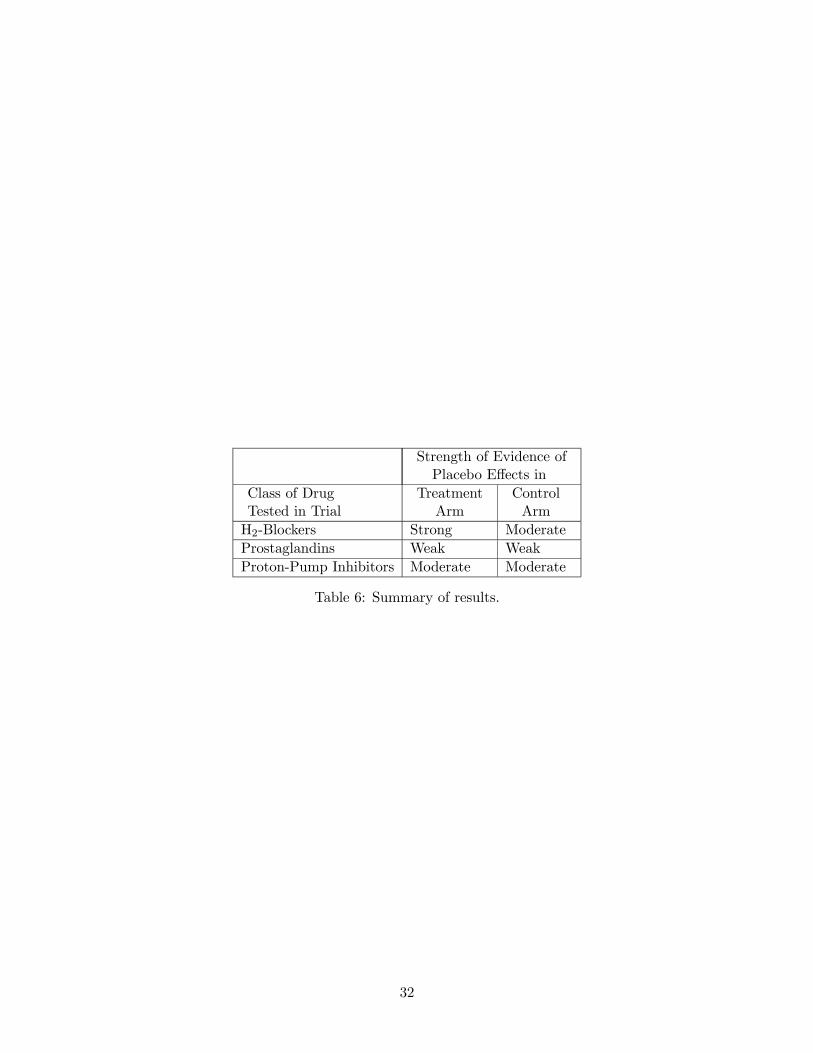
Strength of Evidence ofPlacebo Effects in
Class of DrugTested in Trial
TreatmentArm
ControlArm
H2-Blockers Strong ModerateProstaglandins Weak WeakProton-Pump Inhibitors Moderate Moderate
Table 6: Summary of results.
32