Embed Size (px)
Citation preview

Testing Macroprudential Stress Tests:The Risk of Regulatory Risk Weights
Viral Acharya, Robert Engle and Diane Pierret
NYU Stern School of Business - The Volatility Institute
Board of Governors of the Federal Reserve, July 19, 2013

Recent Concerns on Macro Stress Tests
Macroprudential stress tests: part of the macroprudential toolkit (Greenlawet al. (2012))
Concerns on macro stress tests:Stress tests remain microprudential (Greenlaw et al. (2012))Basel risk regulation (capital ratios)
Capital ratios are not a binding constraint (Hanson et al. (2011))
Regulatory risk weights are inconsistent (Basel Committee on BankingSupervision (2013); Haldane (2011, 2012))
1 / 47
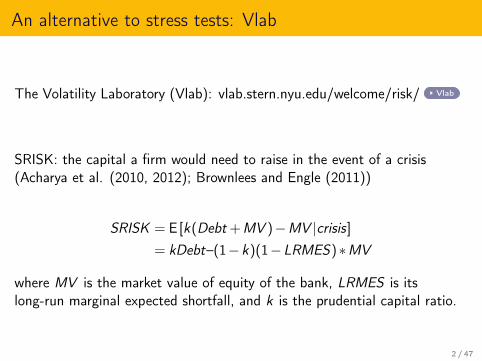
An alternative to stress tests: Vlab
The Volatility Laboratory (Vlab): vlab.stern.nyu.edu/welcome/risk/ Vlab
SRISK: the capital a firm would need to raise in the event of a crisis(Acharya et al. (2010, 2012); Brownlees and Engle (2011))
SRISK = E [k(Debt +MV )−MV |crisis]= kDebt–(1−k)(1−LRMES)∗MV
where MV is the market value of equity of the bank, LRMES is itslong-run marginal expected shortfall, and k is the prudential capital ratio.
2 / 47

Testing Macro Stress Tests against Vlab
We provide a test of regulatory macro stress tests by comparing theiroutcomes to those from a simple methodology (Vlab) that relies on publiclyavailable market data.
1 Vlab and stress tests projected losses are well correlated & bothpredict well the actual realized losses during the European sovereigndebt crisis.
2 The required capitalization in stress tests is found to be rather low,and inadequate ex post, compared to that implied by market data(Vlab).
3 This discrepancy arises due to the reliance on regulatory risk weights.
3 / 47

The Risk of Regulatory Risk Weights
Static regulatory risk weights are flawed
Actual and stressed regulatory risk weights have no link with therealized risk of banks during a crisis
Regulatory risk weights are informative only when we control for othermore important risk factors (leverage ratio, market risk)
Provide perverse incentives to build exposures to low-risk weight assetcategories (see Acharya and Steffen (2013) for empirical evidence).
4 / 47

Outline
1 Macro stress tests sample
2 Testing stressed losses
3 Testing stressed capital shortfallsTesting thresholds and projected revenues
4 Testing stressed capital ratios
5 Testing the efficacy of regulatory risk weights
5 / 47

Outline
1 Macro stress tests sample
2 Testing stressed losses
3 Testing stressed capital shortfallsTesting thresholds and projected revenues
4 Testing stressed capital ratios
5 Testing the efficacy of regulatory risk weights
6 / 47
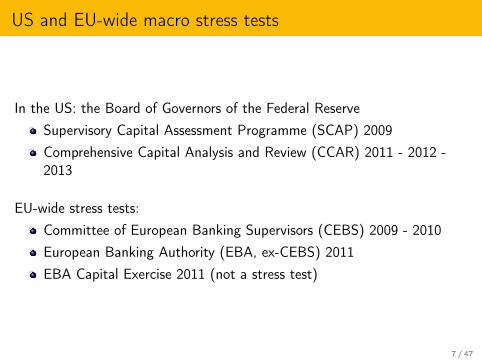
US and EU-wide macro stress tests
In the US: the Board of Governors of the Federal ReserveSupervisory Capital Assessment Programme (SCAP) 2009Comprehensive Capital Analysis and Review (CCAR) 2011 - 2012 -2013
EU-wide stress tests:Committee of European Banking Supervisors (CEBS) 2009 - 2010European Banking Authority (EBA, ex-CEBS) 2011EBA Capital Exercise 2011 (not a stress test)
7 / 47
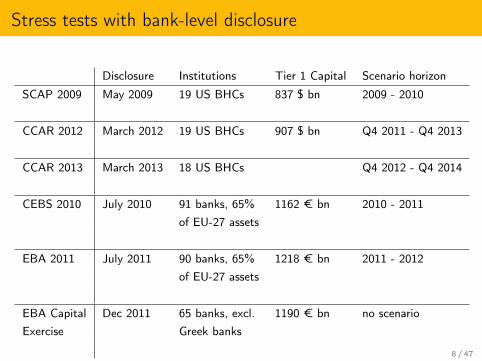
Stress tests with bank-level disclosure
Disclosure Institutions Tier 1 Capital Scenario horizon
SCAP 2009 May 2009 19 US BHCs 837 $ bn 2009 - 2010
CCAR 2012 March 2012 19 US BHCs 907 $ bn Q4 2011 - Q4 2013
CCAR 2013 March 2013 18 US BHCs Q4 2012 - Q4 2014
CEBS 2010 July 2010 91 banks, 65% 1162 € bn 2010 - 2011of EU-27 assets
EBA 2011 July 2011 90 banks, 65% 1218 € bn 2011 - 2012of EU-27 assets
EBA Capital Dec 2011 65 banks, excl. 1190 € bn no scenarioExercise Greek banks
8 / 47

The context of stress tests disclosure
2 stress tests are followed by an economic recession: CCAR 2011 (US) and EBA2011 (EU). Only EBA 2011 discloses bank-level output of the stress test.
6-month realized return after disclosure of EBA 2011: S&P500 -4.89%;EUROSTOXX50 -20.67%; ACWI World -13.47%
S&P500 6MFORWARD RETURN
ACWI World 6MFORWARD RETURN
EUROSTOXX50 6MFORWARD RETURN
2007 2008 2009 2010 2011 2012
60
40
20
0
20
40
SCAP 2009
CEBS 2009
CEBS 2010
CCAR 2011
EBA 2011
EBA
Capital
Exercise
CCAR 2012
S&P500 6MFORWARD RETURN
ACWI World 6MFORWARD RETURN
EUROSTOXX50 6MFORWARD RETURN
Source: Datastream
9 / 47

CCAR 2012 scenario
CCAR 2012: Supervisory Stress Scenario (25 variables) over 13 quarters
Macro variables: real and nominal GDP, unemployment rate, personalincome, CPIFinancial variables: house price index, commercial real estate price index, DJindex, VIXInterest rates: 3-month T-bill, 10-year Treasury bond yield, 10-year BBBcorporate security yield, 30-year mortgage interest rateNon-US: 4 blocs of countries (EUR, UK, dev. Asia, Japan) * 3 variables(GDP growth, inflation, FX rate)
+ Global financial market shock for the 6 BHCs with large trading activities
See Schuermann (2012) for a comparison of macro stress scenarios (SCAP 2009,CCAR 2011, CCAR 2012)
10 / 47
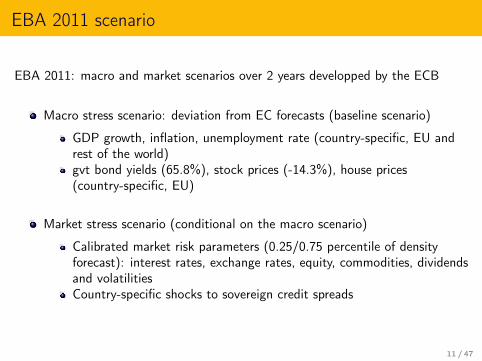
EBA 2011 scenario
EBA 2011: macro and market scenarios over 2 years developped by the ECB
Macro stress scenario: deviation from EC forecasts (baseline scenario)
GDP growth, inflation, unemployment rate (country-specific, EU andrest of the world)gvt bond yields (65.8%), stock prices (-14.3%), house prices(country-specific, EU)
Market stress scenario (conditional on the macro scenario)
Calibrated market risk parameters (0.25/0.75 percentile of densityforecast): interest rates, exchange rates, equity, commodities, dividendsand volatilitiesCountry-specific shocks to sovereign credit spreads
11 / 47

Outline
1 Macro stress tests sample
2 Testing stressed losses
3 Testing stressed capital shortfallsTesting thresholds and projected revenues
4 Testing stressed capital ratios
5 Testing the efficacy of regulatory risk weights
12 / 47

Stress tests vs. Vlab losses
Vlab MV loss = LRMES ∗MVStress test “Loss” is the projected loss over the stress scenario horizonStress test “Net Loss” = max(0,Projected Loss−Projected Revenue)
Stress tests estimates Vlab estimates
US Sample Loss Net loss MV loss
SCAP 2009 18 US BHCs 590 $ bn 229 $ bn 438 $ bn
CCAR 2012 18 US BHCs 529 $ bn 226 $ bn 447 $ bn
CCAR 2013 17 US BHCs 457 $ bn 197 $ bn 525 $ bn
EU Sample Loss Net loss MV loss
CEBS 2010 50 EU banks 425 € bn 39 € bn 399 € bn
EBA 2011 53 EU banks 381 € bn 70 € bn 402 € bn
13 / 47
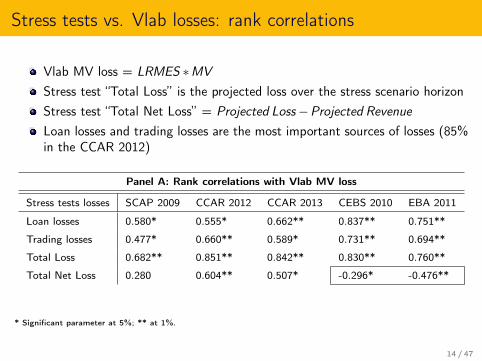
Stress tests vs. Vlab losses: rank correlations
Vlab MV loss = LRMES ∗MVStress test “Total Loss” is the projected loss over the stress scenario horizonStress test “Total Net Loss” = Projected Loss−Projected RevenueLoan losses and trading losses are the most important sources of losses (85%in the CCAR 2012)
Panel A: Rank correlations with Vlab MV loss
Stress tests losses SCAP 2009 CCAR 2012 CCAR 2013 CEBS 2010 EBA 2011
Loan losses 0.580* 0.555* 0.662** 0.837** 0.751**
Trading losses 0.477* 0.660** 0.589* 0.731** 0.694**
Total Loss 0.682** 0.851** 0.842** 0.830** 0.760**
Total Net Loss 0.280 0.604** 0.507* -0.296* -0.476**
* Significant parameter at 5%; ** at 1%.
14 / 47

Forecasting losses during the European sovereign debt crisis(EBA 2011)
Realized lossi ,t,W =−MVit ∗t+1+W
∑t+1
ln(pit/pit−1)
where t = 06/30/2011 and W = 130 (six months).
Panel A: Rank correlations with the 6-month realized EUR loss
Estimated losses Large Small All RMSE
Vlab MV loss 0.293 0.610 0.832 5086
(0.289) (0.000) (0.000)
EBA Total Loss 0.557 0.527 0.803 4945
(0.000) (0.000) (0.000)
EBA Total Net Loss 0.329 -0.100 -0.272 11202
(0.232) (0.549) (0.048)
P-values in parentheses.
15 / 47

EBA capital increase under stress (EBA 2011)
The projected profits under the EBA stress scenario lead to increasing Tier 1capital levels for many SRISK top banks
!"#$$$% !#$$$% #$$$% "#$$$% &#$$$% '#$$$% (#$$$% ##$$$%
)*+,-%.,/0%*1%23*4-,/5%67*89%:;<%%%%%%%%%%%%%%%%%%%%%%%%%%%%%%%%%%%%%%%;-*+5=%.,/0>/?%67*89%:;<%%%%%%%%%%%%%%%%%%%%%%%%%%%%%%%%%%%%%
<*@@A7BC,/0%D6%%%%%%%%%%%%%%%%%%%%%%%%%%%%%%%%%%%%%.,/0%*1%E7A-,/5%%%%%%%%%%%%%%%%%%%%%%%%%%%%%%%%%%%%
F,G*/,-%.,/0%H1%67AA3A%%%%%%%%%%%%%%%%%%%%%%%%%%%%%%%%%%%%%IJ6%I87*C,/0%I7?,=>,=%2D%%%%%%%%%%%%%%%%%%%%%%%%%%%%%%%%%%%%%
KAL>,%2D%%%%%%%%%%%%%%%%%%%%%%%%%%%%%%%%%%%%%.,/3*%:*98-,7%I=9,/*-%%%%%%%%%%%%%%%%%%%%%%%%%%%%%%%%%%%%%
D-9M,%.,/0%DI%%%%%%%%%%%%%%%%%%%%%%%%%%%%%%%%%%%%%:>7,A8=%.,/0%2D%%%%%%%%%%%%%%%%%%%%%%%%%%%%%%%%%%%%%
D?7>38-487,-%.,/0%*1%67AA3A%%%%%%%%%%%%%%%%%%%%%%%%%%%%%%%%%%%%%NN%OA--A/>3%:*=4C,/0%2D%%%%%%%%%%%%%%%%%%%%%%%%%%%%%%%%%%%%%
.,/3*%:,=4*7%2D%%%%%%%%%%%%%%%%%%%%%%%%%%%%%%%%%%%%%I=9>7>4*%2,/4*%J>/,/3>,-%67*89%2D%%%%%%%%%%%%%%%%%%%%%%%%%%%%%%%%%%%%%
.,/0%*1%<+978=%:-3%%%%%%%%%%%%%%%%%%%%%%%%%%%%%%%%%%%%%P,7Q/%:*98-,7%.,/0%:<;%R<+978=S%%%%%%%%%%%%%%%%%%%%%%%%%%%%%%%%%%%%%
T/><7A5>4%29D%%%%%%%%%%%%%%%%%%%%%%%%%%%%%%%%%%%%%2F2%)IDD;%FU%%%%%%%%%%%%%%%%%%%%%%%%%%%%%%%%%%%%%.,/3*%.:E%2D%%%%%%%%%%%%%%%%%%%%%%%%%%%%%%%%%%%%%
.,/3*%5A%2,C,5A--%2D%%%%%%%%%%%%%%%%%%%%%%%%%%%%%%%%%%%%%HA=4A77A>3M>=3MA%U*-0=C,/0A/%D6%%%%%%%%%%%%%%%%%%%%%%%%%%%%%%%%%%%%%
.,/0>/4A7%2D%%%%%%%%%%%%%%%%%%%%%%%%%%%%%%%%%%%%%;,/5A=C,/0%.A7->/%O*-5>/?%D6%%%%%%%%%%%%%%%%%%%%%%%%%%%%%%%%%%%%%
.,/0%*1%U,--AV,%:;<%%%%%%%%%%%%%%%%%%%%%%%%%%%%%%%%%%%%%.,/3*%:*9*-,7A%2<%%%%%%%%%%%%%%%%%%%%%%%%%%%%%%%%%%%%%:*MW*-,%.,/0%:;<%%%%%%%%%%%%%%%%%%%%%%%%%%%%%%%%%%%%%
),>XA>=A/%.,/0%E/4A7/,G*/,-%D6%%%%%%%%%%%%%%%%%%%%%%%%%%%%%%%%%%%%%2+5C,/0%DY2%%%%%%%%%%%%%%%%%%%%%%%%%%%%%%%%%%%%%
Z+=0A%.,/0%DY2%%%%%%%%%%%%%%%%%%%%%%%%%%%%%%%%%%%%%.,/3*%<*@A73>,-%:*748?8A=%2D%%%%%%%%%%%%%%%%%%%%%%%%%%%%%%%%%%%%%
I7=4A%67*89%.,/0%D6%%%%%%%%%%%%%%%%%%%%%%%%%%%%%%%%%%%%%20,/5>/,[>=0,%I/=0>-5,%.,/0A/%D.%%%%%%%%%%%%%%%%%%%%%%%%%%%%%%%%%%%%%
HN:%.,/0%:;<%%%%%%%%%%%%%%%%%%%%%%%%%%%%%%%%%%%%%2\A5C,/0%D.%%%%%%%%%%%%%%%%%%%%%%%%%%%%%%%%%%%%%
<7A5>4%D?7>3*-A%2D%%%%%%%%%%%%%%%%%%%%%%%%%%%%%%%%%%%%%T/>*/A%5>%.,/3MA%E4,->,/A%2<:D%%%%%%%%%%%%%%%%%%%%%%%%%%%%%%%%%%%%%
KF.%FH)%D2D%%%%%%%%%%%%%%%%%%%%%%%%%%%%%%%%%%%%%.,/3,%P*/4A%5A>%:,=3M>%5>%2>A/,%29D%%%%%%%%%%%%%%%%%%%%%%%%%%%%%%%%%%%%%
2[A/=0,%O,/5A-=C,/0A/!D.%%%%%%%%%%%%%%%%%%%%%%%%%%%%%%%%%%%%%F*75A,%.,/0%D.%%%%%%%%%%%%%%%%%%%%%%%%%%%%%%%%%%%%%].<%67*A9%FU%%%%%%%%%%%%%%%%%%%%%%%%%%%%%%%%%%%%%
E7>=M%;>1A%^%:A7@,/A/4%67*89%O*-5>/?=%:;<%%%%%%%%%%%%%%%%%%%%%%%%%%%%%%%%%%%%%2*3>A4A%6A/A7,-A%%%%%%%%%%%%%%%%%%%%%%%%%%%%%%%%%%%%%
.F:%:,7>C,=%%%%%%%%%%%%%%%%%%%%%%%%%%%%%%%%%%%%%
.,73-,+=%:;<%%%%%%%%%%%%%%%%%%%%%%%%%%%%%%%%%%%%%KA84=3MA%.,/0%D6%%%%%%%%%%%%%%%%%%%%%%%%%%%%%%%%%%%%%O2.<%O*-5>/?=%:;<%%%%%%%%%%%%%%%%%%%%%%%%%%%%%%%%%%%%%
EF6%67*A9%FU%%%%%%%%%%%%%%%%%%%%%%%%%%%%%%%%%%%%%K,/=0A%.,/0%DY2%%%%%%%%%%%%%%%%%%%%%%%%%%%%%%%%%%%%%
D-->A5%E7>=M%.,/0=%:;<%%%%%%%%%%%%%%%%%%%%%%%%%%%%%%%%%%%%%.,/3*%.>-C,*%U>B3,+,%D7?A/4,7>%%%%%%%%%%%%%%%%%%%%%%%%%%%%%%%%%%%%%
E/4A=,%2,/9,*-*%29D%%%%%%%%%%%%%%%%%%%%%%%%%%%%%%%%%%%%%.,/3*%2,/4,/5A7%2D%%%%%%%%%%%%%%%%%%%%%%%%%%%%%%%%%%%%%
KA-4,%N"<%8/5A7%I.D%=47A==%=3A/,7>*% KA-4,%PU%16 / 47

Stress tests assumptions on revenues (EBA vs. CCAR)
Some banks are making profits during the EBA stress scenario
EBA stress scenario is a deviation of the baseline scenarioThe net interest income is increasing for some banks due to higher interestratesDirectional market risk stress test: “depending upon the size and direction oftheir exposures, banks may make gains on certain portfolios”
Different assumptions on the projected PPNR (Pre-Provision Net Revenue) in theCCAR
low net interest income due to low interest rate, flat yield curve environmentlow non-interest income due to falling asset prices and sharply contractingeconomic activityhigher operational losses included in the PPNR
17 / 47
Outline
1 Macro stress tests sample
2 Testing stressed losses
3 Testing stressed capital shortfallsTesting thresholds and projected revenues
4 Testing stressed capital ratios
5 Testing the efficacy of regulatory risk weights
18 / 47

Stress tests capital shortfalls vs. SRISK
Vlab SRISK = kDebt–(1−k)(1−LRMES)∗MV
Stress test disclosed capital shortfall = max(0, [k ′ ∗RWAS −CapitalS ])
Stress tests estimates Vlab estimates
US Sample Threshold k ′ Shortfall SRISK (k=8%)
SCAP 2009 18 US BHCs 4% T1CR 63.1 $ bn (9) 674 $ bn (18)
EU Sample Shortfall Shortfall SRISK (k=5.5%)
CEBS 2010 50 EU banks 6% T1R 0.2 EUR bn (1) 796 EUR bn (48)
EBA 2011 53 EU banks 5% T1CR 1.2 EUR bn (4) 886 EUR bn (51)
EBA Capital 44 EU banks 9% T1CR 72 EUR bn (22) 1059 EUR bn (42)
Exercise
In parentheses: number of banks with capital shortfall > 0 under stress. T1R = Tier 1 Capital ratio, T1CR = Tier 1Common Capital ratio (US), Core Tier 1 Capital ratio (EU).
19 / 47

SCAP capital buffer vs. SRISK (SCAP 2009)
Vlab SRISK = kDebt–(1−k)(1−LRMES)∗MV
SCAP capital buffer = max(0, [k ′ ∗RWAS −CapitalS ])(k=0.08, k ′=0.04, rank correlation: 0.507)
20 / 47

EBA capital shortfall vs. SRISK (EBA 2011)
Vlab SRISK = kDebt–(1−k)(1−LRMES)∗MV
EBA disclosed capital shortfall = max(0, [k ′ ∗RWAS −CapitalS ])(k=0.055, k ′=0.05, rank correlation: -0.273)
21 / 47

EBA capital excess vs. SRISK (EBA 2011)
Vlab SRISK = kDebt–(1−k)(1−LRMES)∗MV
EBA ’absolute’ capital shortfall (RWA) = k ′ ∗RWAS −CapitalS(k=0.055, k ′=0.05, rank correlation: -0.790)
22 / 47

Evidence of the EBA failure
EBA stress test disclosed in July 2011
Dexia’s bail-out in Oct 2011: EBA capital excess of Dexia was 7.9 EUR bnvs. 26 EUR bn SRISK.
In Dec 2011, the EBA discloses a new capital shortfall estimate
EBA Overall Shortfall = max(0, [0.09∗RWA−T1C ])+BuffSOV ,
3 main drivers of the overall shortfall:moving k ′ from 5% to 9%,RWA derived under Basel 2.5 (higher capital requirement for marketrisk),the sovereign buffer BuffSOV on EEA sovereign debt exposures
23 / 47

EBA Overall shortfall, still too low? (EBA Capital Exercise)
Vlab SRISK = kDebt–(1−k)(1−LRMES)∗MV
EBA Overall capital shortfall = max(0, [k ′ ∗RWA−T1C ])+BuffSOV(k=0.055, k ′=0.09, rank correlation: 0.163)
24 / 47
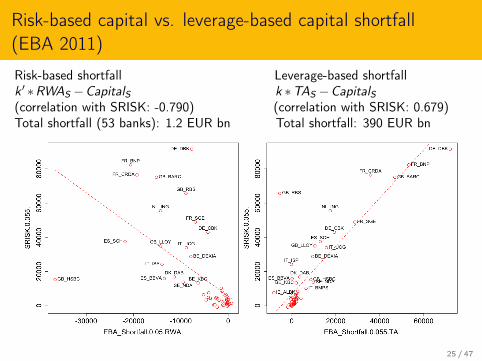
Risk-based capital vs. leverage-based capital shortfall(EBA 2011)
Risk-based shortfall Leverage-based shortfallk ′ ∗RWAS −CapitalS k ∗TAS −CapitalS(correlation with SRISK: -0.790) (correlation with SRISK: 0.679)Total shortfall (53 banks): 1.2 EUR bn Total shortfall: 390 EUR bn
25 / 47

Outline
1 Macro stress tests sample
2 Testing stressed losses
3 Testing stressed capital shortfallsTesting thresholds and projected revenues
4 Testing stressed capital ratios
5 Testing the efficacy of regulatory risk weights
26 / 47

Threshold severity
Vlab SRISK = kDebt–(1−k)(1−LRMES)∗MV
Leverage-based capital shortfall (TA) = k ∗TAS −CapitalSRisk-based capital shortfall (RWA) = k ′ ∗RWAS −CapitalSBy definition: RWA ≤ TA, so k ≤ k ′ for comparable severity levels
Values for k :
Vlab uses k = 5.5% (of quasi-mkt assets)CCAR uses k = 3−4%Basel III: k = 3%Dodd-Frank Act: k = 4% (’adequately’ capitalized), k = 5% (’well’capitalized)
Values for k ′:
EBA and CCAR: k ′ = 5% when CapitalS = Tier 1 Common Capitalunder stress (US) or Core Tier 1 Capital under stress (EU).EBA Capital Exercise used k ′ = 9%
In the next slides, we vary k and k ′ for the EBA stress test shortfalls and comparethem with SRISK where an adequate threshold for SRISK is 5.5%.
27 / 47

Higher threshold for the risk-based capital shortfall(EBA 2011)
Risk-based shortfall Risk-based shortfall5%∗RWAS −CapitalS 9%∗RWAS −CapitalS(correlation with SRISK: -0.790) (correlation with SRISK: 0.418)Total shortfall (53 banks): 1.2 EUR bn Total shortfall: 139 EUR bn
28 / 47

Lower threshold for the leverage-based capital shortfall(EBA 2011)
Leverage-based shortfall Leverage-based shortfall5.5%∗TAS −CapitalS 3%∗TAS −CapitalS(correlation with SRISK: 0.679) (correlation with SRISK: -0.218)Total shortfall (53 banks): 390 EUR bn Total shortfall: 38 EUR bn
29 / 47
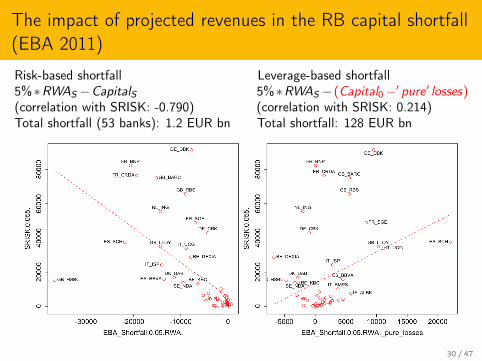
The impact of projected revenues in the RB capital shortfall(EBA 2011)
Risk-based shortfall Leverage-based shortfall5%∗RWAS −CapitalS 5%∗RWAS − (Capital0−′ pure ′ losses)(correlation with SRISK: -0.790) (correlation with SRISK: 0.214)Total shortfall (53 banks): 1.2 EUR bn Total shortfall: 128 EUR bn
30 / 47

Highest correlations with SRISK(EBA 2011)
Risk-based shortfall Leverage-based shortfall9%∗RWAS − (Capital0−′ pure ′ losses) 5.5%∗TAS − (Capital0−′ pure ′ losses)(correlation with SRISK: 0.710) (correlation with SRISK: 0.901)Total shortfall (53 banks): 506 EUR bn Total shortfall: 757 EUR bn
31 / 47

Outline
1 Macro stress tests sample
2 Testing stressed losses
3 Testing stressed capital shortfallsTesting thresholds and projected revenues
4 Testing stressed capital ratios
5 Testing the efficacy of regulatory risk weights
32 / 47

Regulatory capital ratios
Numerator: different qualities of capital based on Basel requirements
Tier 1 Common (Core) Capital (T1C)Tier 1 Capital (T1)Total Capital = T1 + T2 + (additional T3 for market risk)
Denominator: Total Assets or Risk-Weighted Assets (RWA)
Regulatory ratios in the US:
Tier 1 Common Capital ratio = T1C/RWA (5%)Tier 1 Capital ratio = T1/RWA (4%)Total risk-based capital ratio = Total Capital/RWA (8%)Tier 1 Leverage ratio = T1/Total assets (3-4%)
Regulatory ratio in the EU: Core Tier 1 capital ratio = T1C/RWA (5%)
33 / 47

Stress tests vs. Vlab ratio
Vlab market leverage ratio under stress
M−LVGRs =MV (1−LRMES)
MV (1−LRMES)+D
Cross-sectional average ratios (average change with the stress scenario inparentheses):
Stress tests estimates Vlab estimates
US Sample Ratio M-LVGRs
CCAR 2012 18 US BHCs 7.55% T1CR 3.54%
(-3.34%) (-4.54%)
CCAR 2013 17 US BHCs 8.37% T1CR 5.48%
(-2.68%) (-5.36%)
EU Sample Ratio M-LVGRs
CEBS 2010 50 EU banks 8.98% T1R 2.6%
(-1.38%) (-2.01%)
EBA 2011 53 EU banks 7.98% T1CR 2.26%
(-1.02%) (-1.73%)34 / 47

Risk-based vs. leverage ratio
Tier 1 Leverage ratio (T1 LVGR = T1 Capital/Total Assets) recommended underBasel III to supplement the risk-based regime.
Rank correlations with Vlab market leverage ratio (M−LVGRs) increaseconsiderably when RWA are replaced by Total Assets.
Vlab market leverage ratio under stress
M−LVGRs =MV (1−LRMES)
MV (1−LRMES)+D
Panel C: Rank correlations with Vlab M-LVGRs
Stress tests projected ratios CCAR 2012 CCAR 2013 EBA 2011
T1CR, scenario end 0.242 0.282*T1 LVGR, scenario end 0.576* 0.570**min T1CR 0.797** 0.581*min T1 LVGR 0.846** 0.877**
* Significant parameters at 5%; ** at 1%.
35 / 47

Risk-based vs. leverage ratio (CCAR 2012)
T1 Risk-based ratio: T1 Leverage ratio:T1CapitalS/RWAS T1CapitalS/TAS(correlation with M-LVGRs : 0.648) (correlation with M-LVGRs : 0.846)
36 / 47

Risk-based vs. leverage ratio (CCAR 2012 w/o AmEx)
T1 Risk-based ratio: T1 Leverage ratio:T1CapitalS/RWAS T1CapitalS/TAS(correlation with M-LVGRs : 0.607) (correlation with M-LVGRs : 0.816)
37 / 47
Risk-based vs. leverage ratio (CCAR 2013)
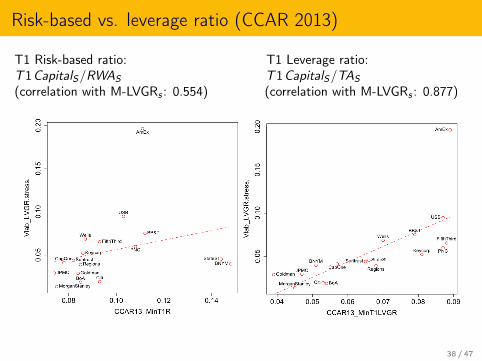
T1 Risk-based ratio: T1 Leverage ratio:T1CapitalS/RWAS T1CapitalS/TAS(correlation with M-LVGRs : 0.554) (correlation with M-LVGRs : 0.877)
38 / 47
Risk-based vs. leverage ratio (CCAR 2013 w/o AmEx)
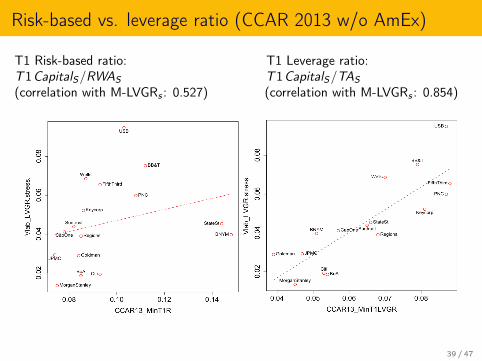
T1 Risk-based ratio: T1 Leverage ratio:T1CapitalS/RWAS T1CapitalS/TAS(correlation with M-LVGRs : 0.527) (correlation with M-LVGRs : 0.854)
39 / 47
Outline
1 Macro stress tests sample
2 Testing stressed losses
3 Testing stressed capital shortfallsTesting thresholds and projected revenues
4 Testing stressed capital ratios
5 Testing the efficacy of regulatory risk weights
40 / 47

Impact of the stress scenario
Impact of the stress scenario: lower ratiosUS: capital decrease due to stressed lossesEU: RWA increase due to stressed risk weights
Measure Before scenario After scenario
CCAR 2012 T1CR 10.1% 6.6% minT1C 741 $ bn 438 $ bnRWA 7356 $ bn 6904 $ bn
EBA 2011 T1CR 8.9% 7.7%T1C 1006 EUR bn 1001 EUR bnRWA 11.37 EUR tn 13 EUR tn
41 / 47

Risk-weighted assets (RWA)
RWA under Basel I (US, before 2013)
RWA = ∑jwjAj
with wj = 0%,20%,50%,100%.
RWA under Basel II (EU)
RWA =1k
[Ccdt +Cop +Cmkt ]
where k is the prudential capital ratio (8%) and Ccdt , Cop, Cmkt are thecapital requirements to respectively support credit, operational, and marketrisks.
42 / 47

Basel II risk weights: IRB approach
Credit component (' 80% of RWA): Ccdt = ∑j wj ∗EADj
The weight wj is a function of risk parameters: probability of default (PD)and loss given default (LGD).
Banks derive the stressed PDs, LGDs using their own risk models under theIRB (Internal-Rating-Based) approach.
Lower capital requirementsInconsistency (Basel Committe on Banking Supervision RCAP (2013))
Opacity: Internal models are black boxes that investors do not understand ortrust (Haldane (2012))
EBA stress test: 59 of the 90 participating banks are IRB banks.
43 / 47

Regulatory risk weight vs. market risk weight (EBA 2011)
Stressed regulatory risk weight = RWAS/TAS
Vlab RWA: SRISK ≤ 0⇔MV ≥ k1−(1−k)LRMESTA (Acharya, Engle and
Richardson (2012))
Vlab risk weight = (1− (1−k)LRMES)−1 (rank correlation: -0.238)
Dexia and Crédit Agricole: below 25% quantile of RWAS/TAS , above the 75%quantile of Vlab risk weight distribution
44 / 47

Stress to sovereign exposures (EBA 2011): impact on RWA?
Sovereign exposures in the banking book → higher provisions
No market risk haircut but fundamental credit analysis based on movementsin PDs and LGDsConsistent approach:
downgrades applied to sovereign credit ratings“For simplicity this approach could focus purely on determiningappropriate provisions (EL) for both IRB and TSA banks. No changeswould be made to RWA from the existing submission.” (EBAadditional guidance to the methodological note, June 2011)
Sovereign exposures in the trading book → lower net trading income
2 main factors influencing valuation haircuts:
widening of sovereign credit spreadshigher risk-free rate
Updated haircuts on June 9, 2011 to “more fully reflect the impact of thecurrent conjuncture”
45 / 47

Forecasting risk: realized volatility regression (EBA 2011)
Regression # 1 2 3 4 5 6 7
Constant 4.39** -0.44 6.25** 5.02** 5.95** 3.35** 1.46
(0.27) (1.84) (0.83) (0.47) (0.94) (1.41) (1.52)
Book-to-market 0.03** 0.031** 0.04**
(0.001) (0.001) (0.002)
Vlab risk weight 2.76** 2.901** 3.45**
(0.99) (0.68) (0.71)
EBA T1 LVGR -34.47* -134.98** -177.7**
(16.26) (24.24) (16.38)
EBA T1 LVGR2 -167.78 867.27** 997.99**
(126.03) (172.2) (108.3)
EBA risk weight -2.58 4.84**
(1.59) (1.37)
F-test 11.48** 7.63** 5.92* 1.76 2.5 15.77** 17.47**
Adj. R2 (%) 16.78 11.31 8.65 1.45 2.8 53.18 61.29
* Significant parameters at 5%; ** at 1%. Standard errors in parentheses. Sample size: 53 46 / 47

Conclusion
Vlab and stress tests projected losses are well correlated & bothpredict well the actual realized losses during the European sovereigndebt crisis.
The required capitalization in stress tests is found to be rather low,and inadequate ex post (especially in Europe), compared to SRISK.
This discrepancy arises due to the reliance on regulatory risk weights.
Static regulatory risk weights are flawed and provide perverse incentives tobuild exposures to low-risk weight asset categories (Acharya and Steffen(2013)).
Recommendations:complement the assessment of banks and system risks with marketmeasures of riskif not, a capital requirement based on the size and leverage of banksdelivers more consistent results (Basel III T1 leverage ratio)
47 / 47

Portfolio choice under regulatory risk weights (1/2)
The total assets TA are allocated between cash C , and other risky assets
N risky assets with conditional expected returns m, and conditionalcovariance matrix H
Each of these assets has a risk weight wj ∈ [0,1]
The solution is a (N×1) vector of dollars to be invested in each asset, q
The risk budget requires that C ≥ kw ′q, where k is the prudential capitalratio and C = TA− ι ′q, where ι is a (N×1) vector of ones.
To maximize assets returns subject to these constraints the firm must solve
maxq
q′m
s.t. TA− ι ′q ≥ kw ′q, q ≥ 0
Portfolio choice under regulatory risk weights (2/2)
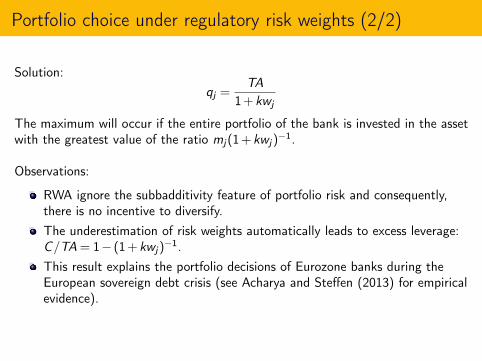
Solution:qj =
TA1+kwj
The maximum will occur if the entire portfolio of the bank is invested in the assetwith the greatest value of the ratio mj(1+kwj)
−1.
Observations:
RWA ignore the subbadditivity feature of portfolio risk and consequently,there is no incentive to diversify.The underestimation of risk weights automatically leads to excess leverage:C/TA = 1− (1+kwj)
−1.This result explains the portfolio decisions of Eurozone banks during theEuropean sovereign debt crisis (see Acharya and Steffen (2013) for empiricalevidence).