Embed Size (px)
Citation preview
w w w.environment-agency.gov.uk
Testing of residues fromincineration of municipal solidwaste
Science Report P1-494/SR2

Science Report Testing of residues from incineration of municipal solid waste2
The Environment Agency is the leading public body protecting andimproving the environment in England and Wales.
It’s our job to make sure that air, land and water are looked after byeveryone in today’s society, so that tomorrow’s generations inherit acleaner, healthier world.
Our work includes tackling flooding and pollution incidents, reducingindustry’s impacts on the environment, cleaning up rivers, coastalwaters and contaminated land, and improving wildlife habitats.
This report is the result of research commissioned and funded by theEnvironment Agency’s Science Programme.
Published byEnvironment Agency, Rio House, Waterside Drive, Aztec West,Almondsbury, Bristol, BS32 4UDTel: 01454 624400 Fax: 01454 624409www.environment-agency.gov.uk
ISBN: 184 432 3382 November 2004
© Environment Agency
All rights reserved. This document may be reproduced with priorpermission of the Environment Agency.
The views expressed in this document are not necessarily
those of the Environment Agency.
This report is printed on Cyclus Print, a 100% recycled stock,which is 100% post consumer waste and is totally chlorine free.Water used is treated and in most cases returned to source inbetter condition than removed.
Further copies of this report are available from:The Environment Agency’s National Customer Contact Centrebyemailing [email protected] or bytelephoning 08708 506506.
Author(s)Robinson, H.D., Knox, K., Formby, R. and Bone, B.D.
Dissemination StatusPublicly available
Keywordsleachate, landfill, incinerator residues,bottom ash, APC residues, carbonation
Research ContractorEnviros Consulting Ltd Knox Associates (UK) Ltd.Enviros House Barnston LodgeShrewsbury Business Park, 50 Lucknow AvenueSitka Drive, Mapperley ParkSHREWSBURY, NOTTINGHAMSY2 6LG. NG3 5BB.Tel: 01743 284877 Tel: 0115 962 0866
Environment Agency’s Project ManagerBrian Bone, Olton Court
Science Project referenceSC000025
Product CodeSCHO0105BIJB-E-P

Science Report Testing of residues from incineration of municipal solid waste 3
Science at the Environment Agency
Science underpins the work of the Environment Agency, by providing an up to dateunderstanding of the world about us, and helping us to develop monitoring toolsand techniques to manage our environment as efficiently as possible.
The work of the Science Group is a key ingredient in the partnership betweenresearch, policy and operations that enables the Agency to protect and restore ourenvironment.
The Environment Agency’s Science Group focuses on five main areas of activity:
• Setting the agenda: To identify the strategic science needs of the Agency toinform its advisory and regulatory roles.
• Sponsoring science: To fund people and projects in response to the needsidentified by the agenda setting.
• Managing science: To ensure that each project we fund is fit for purpose andthat it is executed according to international scientific standards.
• Carrying out science: To undertake the research itself, by those best placed todo it - either by in-house Agency scientists, or by contracting it out touniversities, research institutes or consultancies.
• Providing advice: To ensure that the knowledge, tools and techniquesgenerated by the science programme are taken up by relevant decision-makers,policy makers and operational staff.
Professor Mike Depledge Head of Science
Science Report Testing of residues from incineration of municipal solid waste4
Executive Summary
The Environment Agency for England and Wales (EA) started a project in 2001 to consider thepotential impact of the Council Directive on the Landfill of Waste 1999/31/EEC (LFD) on the qualityof leachate produced in future UK landfills. As part of this project a review of leachate quality fromEuropean ash landfills was carried out (Environment Agency, 2004a). A scoping study was alsocommissioned to examine the significance of trace organic compounds in incinerator residues andthe impact of treatment methods - carbonation and acid neutralisation - on the leachingcharacteristics.
A significant amount of research has been carried out on the characteristics and treatment ofincinerator residues, the effect of weathering on leaching performance, and the treatment ofincinerator residues. A number of researchers are interested in accelerated weathering to predictthe long-term leaching behaviour of incinerator bottom ash and APC residues in landfill scenarios.
Samples of both bottom ash and fly ash/APC residues were taken from three UK incinerators andsubjected to batch and column leach tests and analysis of major and trace components. It wasfound that the major ion and heavy metal concentrations from samples tested in this scoping studyare reasonably representative of bottom ash and APC solid residues and LS 10 leach testcompositions previously published in the UK and mainland Europe.
Trace organics show greater diversity and significantly higher concentrations in bottom ash thanAPC residues. In addition, the solvent-extracted organics from the solid residues are dominated bychlorinated aliphatics and aromatics, including trichloroethene, trichloroethane, tetrachloroethaneand chlorobenzenes. The corresponding eluates are dominated by aromatic carboxylic acids,ketones, aldehydes, alcohols and esters.
Dioxins and furans, although present in significant quantities in the APC solid residues, are notdetected in the eluates, even from the 9-11 day column tests.
Two treatment methods, accelerated carbonation and acid neutralisation, were carried out to assesstheir impact on eluate chemistry. This report concludes that the hazardous properties of incineratorresidues can be reduced by carbonation due to consumption of lime and precipitation of calcite.This results in a pH reduction, although not by as much as expected under the conditions of thescoping study. However, other researchers have achieved consistent results below pH 9.
Heavy metal concentrations in eluates can also be significantly reduced, in particular Pb and Zn, Ba(bottom ash), Cu and Se (both APC). However, further work is required to evaluate the effect ofcarbonation on leaching Cd from APC residues. Notwithstanding this, carbonation shows promiseas a treatment technology as pH reduction is achieved without significant loss of acid neutralisationcapacity.
Acid neutralisation yielded far more variable replicate data than both the untreated and carbonatedeluates. Heavy metal concentrations were also significantly reduced, particularly Pb and Zn.However, some metals were released in significant concentrations, in particular Cd, Sb and Mo. Cuconcentrations in bottom ash eluates were also elevated, possibly due to complexation with DOCreleased from bottom ash samples.
Preliminary source term data are presented for both bottom ash and APC residues. Their derivationhas necessarily involved a degree of subjective judgement, and they are recommended for use notas default source term values but to inform professional judgement on the selection of source termdata for landfills likely to accept significant proportions of bottom ash or APC residues.
Science Report Testing of residues from incineration of municipal solid waste 5
ContentsExecutive Summary 4
Contents 5
1 Introduction 7
1.1 Introduction 7
1.2 Objectives of this report 7
1.3 Background information 8
1.3.1 Implications of the LFD for the landfilling of incinerator residues 81.4 Incinerator residues - summary of results from the Phase 1 study 9
1.4.1 Bottom ash 91.4.2 APC residues 10
1.5 The impact of carbonation on leachate quality 10
2 Experimental programme 12
2.1 Overview 12
2.2 Sampling programme and sampling methodology 13
2.2.1 Bottom ash (BA) 132.2.2 Fly ash and air pollution control residues (APC) 15
2.3 Carbonation 16
2.4 Leaching tests at LS 10 16
2.4.1 Aqueous leaching tests 172.4.2 Acid neutralisation leaching tests 18
2.5 Column leaching tests 21
2.6 Chemical analysis 23
3 Results 24
3.1 General observations 24
3.2 Results of analysis of solid residues 24
3.2.1 Bottom ash 283.2.2 APC residues 29
3.3 Results of leaching tests on bottom ash 30
3.3.1 Results for bottom ash at LS 10: conventional parameters 303.3.2 Results for bottom ash column leaching studies 383.3.3 Leaching of trace organics from bottom ash 39
3.4 Results of leaching tests on APC residues 40
3.4.1 Results for APC residue at LS 10: conventional parameters 403.4.2 Results of column leaching tests on APC residues 473.4.3 Leaching of trace organics from APC residues 50
4 Discussion 52
4.1 Suitability of the data obtained 52
4.2 The release of trace organics 52
4.2.1 Bottom ash 524.2.2 APC residues 53
4.3 Effect of the two treatments on leachate quality 54
4.3.1 Impact of treatment on achieving Waste Acceptance Criteria 544.4 Effect of weathering of ash in a landfill 55
Science Report Testing of residues from incineration of municipal solid waste6
4.5 Estimated source term values 56
4.5.1 Bottom ash 574.5.2 APC residues 60
4.6 Conclusions 63
References 65
Appendix A: Details of sampling of MSWI residues 69
Appendix B: Report by Lafarge Envirocem on the carbonation of samples 74
Appendix C: Details of LS 10 leaching tests 77
Appendix D: Details of acid leaching tests at LS 10 81
Appendix E: Stage 3 column tests - conductivity results and graphs 85
Appendix F: Log of laboratory analysis of solids and eluates 87
Appendix G: Results of List 1 trace organic scan on solid MSWI residues 89
Appendix H: Analysis of LS 10 eluates for major ions, sanitary parameters and heavy metals106
Appendix I: Analytical results for dioxins and furans in LS 10 eluates 113
Appendix J: List 1 trace organics in LS 10 eluates 115
Appendix K: List 1 trace organics in LS 10 acid leaching eluates 120
Appendix L: List 1 trace organics in column leaching test eluates 123
Science Report Testing of residues from incineration of municipal solid waste 7
1 Introduction1.1 IntroductionThe European Council Directive on the Landfill of Waste 1999/31/EEC (LFD), requires memberstates to draw up strategies to ensure the amount of biodegradable municipal waste depositedat landfill progressively reduces over a 15 year period to only 35% of the total amount producedin 1995. The LFD also requires member states to landfill only wastes that have been subject totreatment leading to a reduction in their quantity or hazard to human health or the environment.
The LFD requires three classes of landfill for:
• Hazardous waste;
• Non-hazardous waste (including municipal solid waste); and
• Inert waste.
This contrasts with the current UK practice of co-disposal of untreated biodegradable andinorganic, hazardous and non-hazardous wastes. It is anticipated that the currentunderstanding of landfill leachate quality from UK landfills (e.g. Robinson, 1995), used to definegeneric source term data in the Agency's risk assessment model LandSim will not apply tosome of the new classes of landfill.
This report follows on from a study of leachate quality from landfills in Europe known to containtreated MSW (by mechanical and biological pre-treatment and incineration), mixed hazardouswastes and low organic content non-hazardous wastes (Environment Agency, 2004a), that asclose as possible fulfilled the following criteria:
• The site should contain only wastes that meet national criteria similar to anticipated LandfillDirective acceptance criteria;
• The site should have been engineered to modern containment standards, including aleachate collection system;
• There should exist a good length of time series leachate monitoring data, reflectingconsistent waste inputs and consistent pre-treatment processes;
• Monitoring should include comprehensive coverage of leachate parameters, ideally toencompass List I organics and metals;
• There should have been a good record of compliance with the operating permit, particularlyconcerning waste inputs; and
• Information should be available on leachate generation rates and on gas quality andgeneration rates.
1.2 Objectives of this reportIncinerator residues were identified as a significant current and future waste stream in the UKthat presented significant challenges, and uncertainties, to their management by landfilling.Such challenges included the need and options for treatment, compliance with wasteacceptance criteria, long-term leachate quality and implications for the design and managementof ash landfills.
Science Report Testing of residues from incineration of municipal solid waste8
The objectives of this study were to:
• Obtain representative samples of bottom ash and mixed fly ash/air pollution controlresidues from UK incinerators that meet current emissions standards;
• Carry out leaching tests and chemical analysis to compare the characteristics of thesamples with those reported from previous studies on UK and European incineratorresidues;
• Identify the concentration and composition of trace organic compounds present in solidresidues and eluates to supplement data from previous studies;
• Carry out the above tests on samples artificially weathered by accelerated carbonation toassess the impact on contaminant concentrations and predict the impact of such treatmenton leachate quality;
• Carry out the above tests on samples treated by acid neutralisation to assess the impacton contaminant concentrations and predict the impact of such treatment on leachatequality; and
• Prepare sets of generic source term distributions for untreated, carbonated and acidneutralised incinerator residues, in combination with data from previous studies whererelevant, suitable for use in groundwater risk assessments.
1.3 Background information
1.3.1 Implications of the LFD for the landfilling of incineratorresidues
Article 6a of the LFD requires waste to be treated before landfilling unless such treatment doesnot contribute to the objectives of the LFD or where treatment of (inert) waste is not technicallyfeasible. Article 2 defines treatment as:
The physical, thermal, chemical or biological processes, including sorting, that change thecharacteristics of the waste in order to reduce its volume or hazardous nature, facilitate itshandling or enhance recovery.
Incineration is a thermal process commonly used for the treatment of municipal solid waste(MSW), and the treatment residues would not need any further treatment to satisfy Article 6a.However, further treatment may be necessary or desirable if the treatment residues areprohibited from landfill (e.g. corrosive), do not satisfy waste acceptance criteria for a particularclass of landfill, or where further treatment may enhance recovery.
Classification of incinerator residuesResidues from the incineration of MSW appear in the revised European Waste Catalogue aseither absolute or mirror entries under 19 01 (European Commission, 2002). Absolute entries(solid waste from gas treatment and spent activated carbon from flue-gas treatment) are bothhazardous wastes, but the evaluation of bottom ash and fly ash will depend on the presence,above threshold values, of dangerous substances against hazards H1 to H14 inclusive.Environment Agency (2003) suggests that potential hazards from metals such as Ni, Cu, Zn, As,Cd, Sb, Te, Hg, Th and Pb are considered against hazards H5-7, 10-11 and 14.
The alkaline treatment residues may be evaluated as hazardous by H4 (irritant, by risk phraseR41) or H8 (corrosive) where the pH of the leachate from leach tests is 11.5 or greater. Analkali reserve test can also be carried out that, when combined with pH, provides a measure ofcorrosivity (Young et al., 1988). The pH can only be used to evaluate a waste against H8
Science Report Testing of residues from incineration of municipal solid waste 9
where the waste is a complex mixture of substances whose composition is not determined(Environment Agency, 2003).
Corrosive wastes are banned from landfill and it would seem prudent to characterise the wasteto determine whether it contains any substances within the relevant risk phrases (R34& R35).The risk phrase for lime (both CaO and CaOH) is R41 - risk of severe damage to the eyes - andthe threshold concentration associated with this phrase is 10%. Such waste may therefore stillbe hazardous if the threshold concentration is exceeded, but as H4 (an irritant) and not H8(corrosive). Incineration residues are therefore likely to be hazardous by H4, where the high pHcan be attributed to the lime content.
Waste Acceptance Criteria for hazardous and non-hazardous landfillsThe treatment residues may not be disposed of at a landfill site where the waste acceptancecriteria, based on standard batch leach test (British Standards Institution, 2002) or column test(Comité Européen Normalisation, 2002) results, are exceeded for a particular class of landfill.The waste acceptance criteria for granular waste come into force in July 2005 and have beenset for:
• Inert landfill;
• Non-hazardous waste landfilled together with stable, non-reactive hazardous waste in non-hazardous waste sites;
• Stable non-reactive hazardous waste acceptable for disposal in certain cells at landfills fornon-hazardous waste; and
• Hazardous waste landfills (European Commission, 2003).
Further treatment of incinerator residues, particularly fly ash/air pollution control (collectivelyreferred to as APC in this report) residues, may therefore be necessary to meet wasteacceptance criteria for a number of metals and anions.
1.4 Incinerator residues - summary of results from thePhase 1 study
Phase 1 of the project gathered data on leachate quality from bottom ash and APC residuesfrom research studies and commercial landfills in Europe (Environment Agency, 2004a). Thekey findings are summarised below.
1.4.1 Bottom ashSignificant research into the quality of leachate from bottom ash has been carried out at a rangeof laboratory (e.g. Hjelmar, 1996) and pilot scales (e.g. Stegemann et al., 1995) and full-scalelandfill sites (e.g. Johnson et al., 1998, 1999). The long-term monitoring of leachate quality froma mixed bottom ash (85%) and fly ash (15%) landfill cell has also been compiled by Hjelmar(pers. comm.) and partly reproduced as time-series graphs in Environment Agency (2004a).
The quality of leachate from bottom ash can be variable, but a number of key conclusions fromthe Phase 1 study include:
• Leachates have total dissolved solids similar to, or slightly higher than, typical UK MSWlandfills, with dominant ions each typically in the range 1,000 to 10,000 mg/l;
• The dominance of major anions and cations is: Cl > SO4 and Na > K > Ca > Mg;
• pH values are usually elevated, typically in the range 8.5 to 11.5;
• pH values and the leaching of some heavy metals are strongly affected by carbonation,and elevated concentrations (1 to 10 mg/l) of some metals, mainly Mo, W, Cu, Pb and Zn,may occur;
Science Report Testing of residues from incineration of municipal solid waste10
• TOC concentrations may be similar to dilute methanogenic MSW leachate but are ofunknown composition.
• Ammoniacal nitrogen concentrations are typically much lower than in dilute methanogenicMSW leachate.
1.4.2 APC residuesData were collected from a range of laboratory and field scale studies on the chemistry of APCresidues. Hjelmar (1996) reported the typical contaminant concentrations from low LS ratioleach tests on APC residues derived from wet, dry and semi-dry scrubbing processes. Thesedata were combined with leachate monitoring results from three landfills, two mono-fill sites withthe ash delivered and deposited in “big bags” and one landfill with cells receiving separate ashfrom semi-dry and wet processes.
Chemical rather than biological processes dominate fly ash/APC residue leachate chemistry. Inan ash landfill carbonation along preferential flow paths is thought to have a significant role inmodifying leachate chemistry. Key conclusions from the study include:
• High concentrations of dissolved solids, typically 50,000 to 150,000 mg/l, dominated by Naand Cl;
• TOC and NH4-N concentrations may range from several mg/l to 10s of mg/l;
• Concentrations of heavy metals may be high, especially Pb (up to > 1,000 mg/l from dryand semi-dry processes) and Cd (tens to hundreds of µg/l, occasionally mg/l levels);
• Dry/semi-dry APC scrubbing can result in several orders of magnitude difference in theleachate concentration of major ions and metals than wet-scrubbing processes; manycomponents show extreme fluctuations from one sample to the next;
• Leachate pH is typically near neutral but occasional spikes to pH ~11, showing thepersistence of high pH conditions within the waste matrix; and
• Wet scrubbing processes give rise to near-neutral pH leachate, without the high pH spikesevident in landfill leachate from dry and semi-dry processes.
No information was obtained for a number parameters of interest, particularly trace organics.
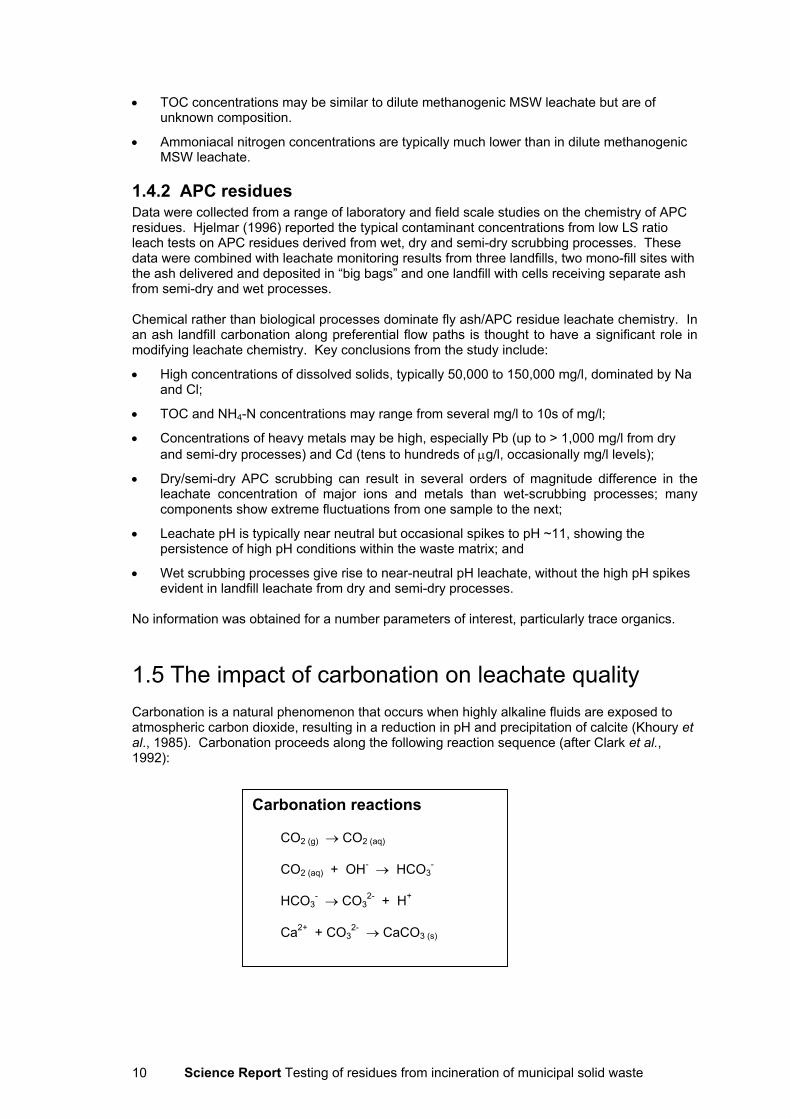
1.5 The impact of carbonation on leachate qualityCarbonation is a natural phenomenon that occurs when highly alkaline fluids are exposed toatmospheric carbon dioxide, resulting in a reduction in pH and precipitation of calcite (Khoury etal., 1985). Carbonation proceeds along the following reaction sequence (after Clark et al.,1992):
Carbonation reactions
CO2 (g) → CO2 (aq)
CO2 (aq) + OH- → HCO3-
HCO3- → CO3
2- + H+
Ca2+ + CO32- → CaCO3 (s)
Science Report Testing of residues from incineration of municipal solid waste 11
Carbonation will ultimately lead to a reduction in pH, to around pH8.3 for a calcite-bufferedsystem. This is usually a slow process, although in the high temperatures in the Middle Eastcarbonation depths of several mm may occur in as many days (Walker, 2002).
In a northern European ash landfill scenario, the matrix/pore water will likely maintain alkalinepH for many thousands of years (Astrup et al., 2001). Astrup et al (op cit.) also suggest thatcarbonation will lead to an initial drop in pH due to conversion of hydroxides to carbonates, butthat alkalinity will not be removed from the system as a result.
Carbonation can be accelerated by exposing alkaline materials to a carbon dioxide-enrichedatmosphere. Researchers claim that accelerated carbonation has significant advantages overconventional hydration (water) based solidification/stabilisation technologies (Lange et al., 1996,1997, Sweeney et al., 1998), namely:
• Reduced leachability of some metal cations as the pH is lower in a fully carbonated system(to around 8.3);
• Conversion of metal cations to metal carbonates (rather than hydroxides) and/or possiblymetal-silanol complexes (M - O - Si);
• Greater stability of the solidified/stabilised material and reduced permeability through theprecipitation of calcite in pore spaces; and
• Absorbs the greenhouse gas, carbon dioxide (the mass of carbon dioxide bound is typically25-50% of the mass of the binder).
Science Report Testing of residues from incineration of municipal solid waste12
2 Experimental programme2.1 OverviewAt the time of this study there were twelve operational incinerators for MSW in the UK. Theirages and throughput vary considerably. Three for this study were nominated by the EA, toprovide a reasonable coverage of different ages, sizes, population catchments and equipmentdesigns.
All three plants were visited in order to assess the logistics of sampling and to provide theoperators with more detailed information about the project prior to their giving approval forsampling to go ahead.
An assurance was given to the operators that the incinerators would not be identified in thepublished results. It is therefore not possible to give full details of the individual plants. Thefollowing summary information can be provided:
• All three meet the current air emissions standards;
• The combined tonnage burnt at the three plants is approximately 1Mt/a;
• At all three plants a minor proportion of the material burnt consists of non-hazardousindustrial waste together with very small tonnages of certain clinical wastes. Theremainder, comprising a high percentage of total inputs, is MSW;
• All three plants used semi-dry scrubbing with lime, for the removal of acid gases, incommon with all other UK incinerators for MSW; and
• All three plants use powered activated carbon, injected into the lime scrubber, for theremoval of dioxins.
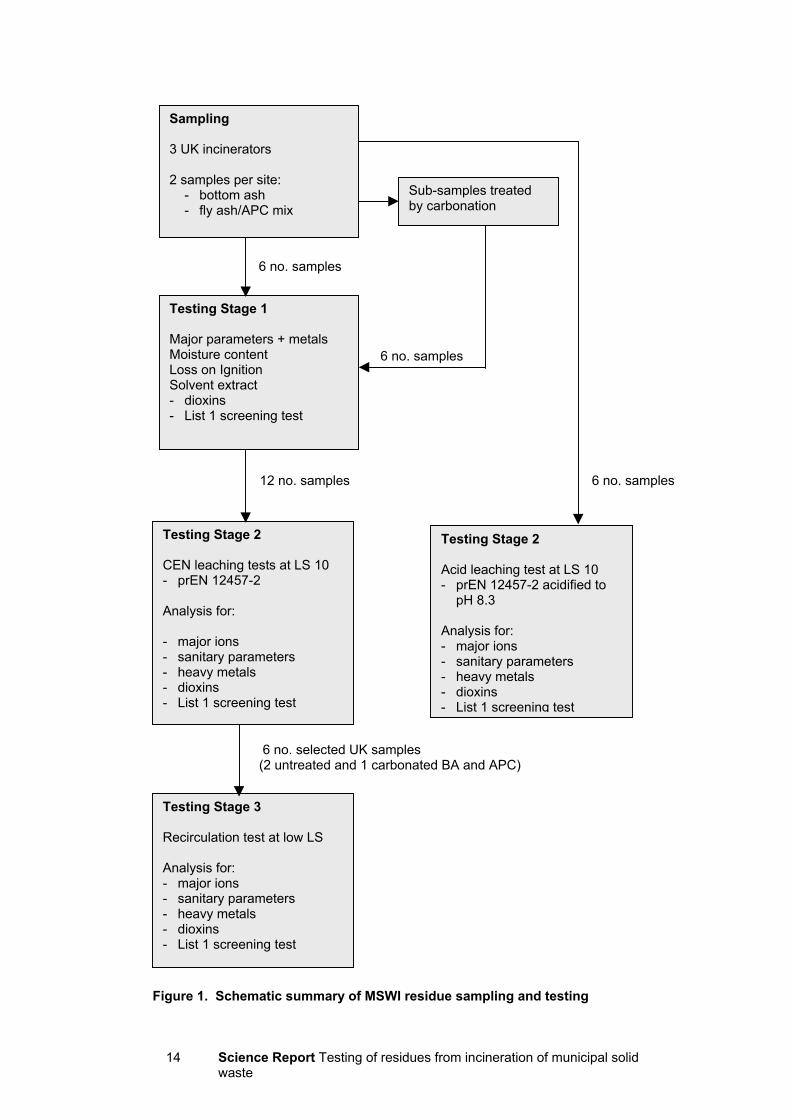
The experimental programme is shown schematically in Figure 1 and is described in detail inlater sub-sections.
The approximate dates of the various stages were as follows:
1. Sampling from the incinerators 27 May 2002 to 24 June 20022. Carbonation late May 2002 to late June 20023. Stage 1: analysis of solids May 2002 onwards4. Stage 2a: aqueous leaching tests at LS 10 Mid-June to mid-July 20025. Stage 2b: acid-neutralised leaching tests at LS 10 mid-Sept. to mid-October 20026. Stage 3: column leaching tests late October to mid-Nov. 2002
All analytical results were received by mid-February 2003.
Science Report Testing of residues from incineration of municipal solid waste 13
2.2 Sampling programme and sampling methodologyDetails of the sampling and quantities sampled at each plant are shown in sampling logs inAppendix A. An overview of the sampling and testing approach is given in Figure 1.
2.2.1 Bottom ash (BA)The sampling protocol given below was used, to provide approximately 100 kg of homogeneousworking stock, stored in polyethylene bins with snap-top lids.
The plant operator provided several sub-samples, of typically 0.2 to 0.5 tonnes each, taken fromdifferent parts of the main bottom ash stockpile. This was typically done using the bucket of aBob-cat, JCB or similar.
The bucketfuls were combined on an area of concrete hard standing at the site. The machinebucket was then used to carry out an initial mixing of the sub-samples.
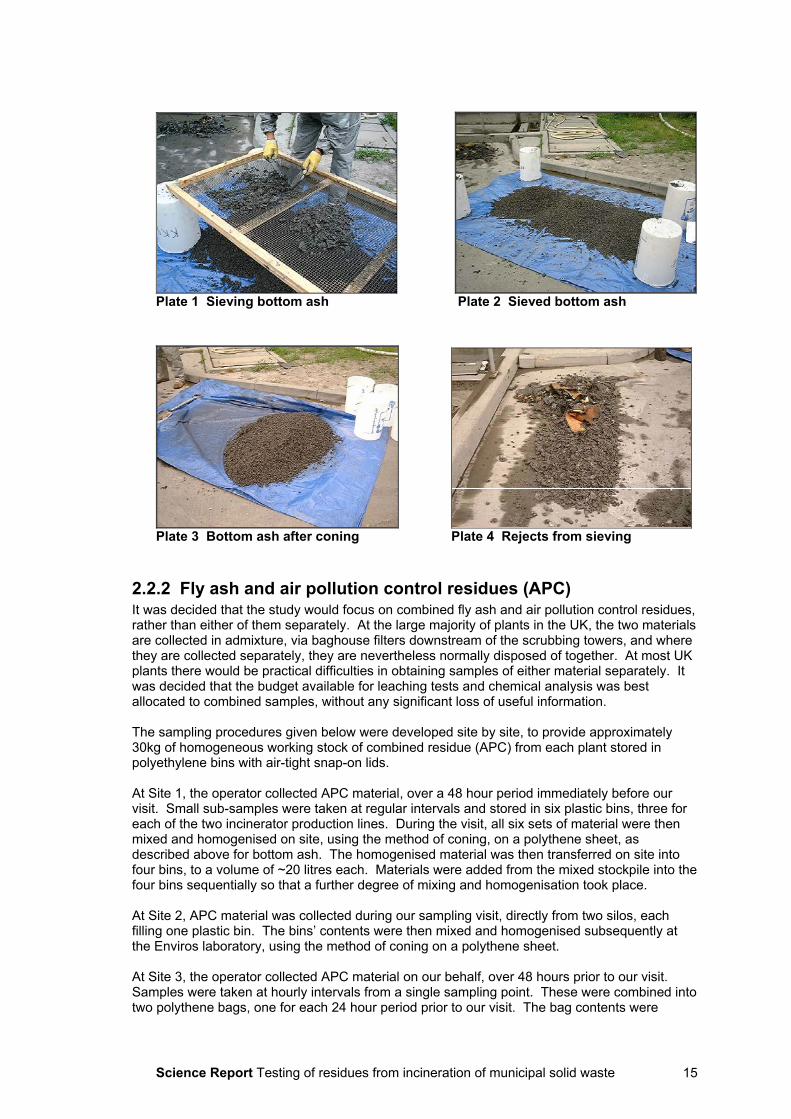
Project staff then took random shovelfuls from the mixed pile, of typically 2–4 kg each, andplaced them onto a steel sieve with a 12 mm mesh size. The hand shovel was stainless steel.The sieve measured approximately 1 m x 2 m and was supported at each corner approximately0.5 m above a new polyethylene sheet laid on the ground.
While one member of the project team shovelled, the other used two mild steel hand trowels tomove the ash back and forth across the sieve, to encourage materials to fall through. Unusuallylarge items (>~100 mm) were removed by hand from the sieve and placed in a separate rejectpile.
Periodically, the sieve was emptied of all oversized materials, to allow efficient sieving of furtherash. Prior to removing the oversized materials, the sieve was banged up and down sharplyseveral times to encourage more fine materials to pass through.
All oversized materials collected from the sieve were retained with the larger items, forweighing.
When enough material had been sieved, the sieved fraction on the polythene sheet washomogenised by the method of coning.
The homogenised material was then placed by hand shovel into five numbered polyethylenebins. Some further homogenisation was achieved during this process by placing consecutiveshovelfuls in each of the bins in turn.
The oversized sieve rejects were also shovelled into bins.
All bins were then weighed. The recorded weights are shown in the sampling logs in AppendixA.
The proportions of rejects (i.e. >12 mm) were:
Site 1 36 % w/w
Site 2 33 % w/w
Site 3 44 % w/w
Science Report Testing of residues from incineration of municipal solidwaste
14
6 no. samples
6 no. samples 6 no. samples
12 no. samples 6 no. samples
6 no. selected UK samples(2 untreated and 1 carbonated BA and APC)
Figure 1. Schematic summary of MSWI residue sampling and testing
Sampling
3 UK incinerators
2 samples per site:- bottom ash- fly ash/APC mix
Testing Stage 1
Major parameters + metalsMoisture contentLoss on IgnitionSolvent extract- dioxins- List 1 screening test
Sub-samples treatedby carbonation
Testing Stage 2
CEN leaching tests at LS 10- prEN 12457-2
Analysis for:
- major ions- sanitary parameters- heavy metals- dioxins- List 1 screening test
Testing Stage 3
Recirculation test at low LS
Analysis for:- major ions- sanitary parameters- heavy metals- dioxins- List 1 screening test
Testing Stage 2
Acid leaching test at LS 10- prEN 12457-2 acidified to
pH 8.3
Analysis for:- major ions- sanitary parameters- heavy metals- dioxins- List 1 screening test
Science Report Testing of residues from incineration of municipal solid waste 15
Plate 1 Sieving bottom ash Plate 2 Sieved bottom ash
Plate 3 Bottom ash after coning Plate 4 Rejects from sieving
2.2.2 Fly ash and air pollution control residues (APC)It was decided that the study would focus on combined fly ash and air pollution control residues,rather than either of them separately. At the large majority of plants in the UK, the two materialsare collected in admixture, via baghouse filters downstream of the scrubbing towers, and wherethey are collected separately, they are nevertheless normally disposed of together. At most UKplants there would be practical difficulties in obtaining samples of either material separately. Itwas decided that the budget available for leaching tests and chemical analysis was bestallocated to combined samples, without any significant loss of useful information.
The sampling procedures given below were developed site by site, to provide approximately30kg of homogeneous working stock of combined residue (APC) from each plant stored inpolyethylene bins with air-tight snap-on lids.
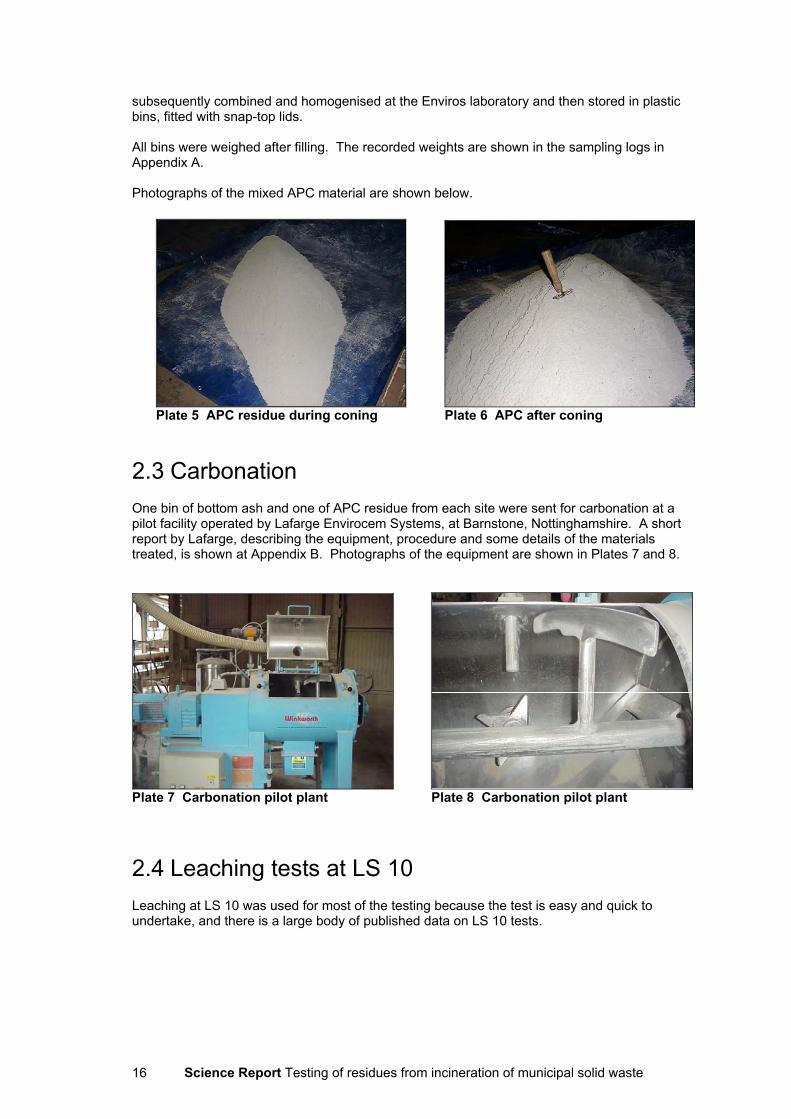
At Site 1, the operator collected APC material, over a 48 hour period immediately before ourvisit. Small sub-samples were taken at regular intervals and stored in six plastic bins, three foreach of the two incinerator production lines. During the visit, all six sets of material were thenmixed and homogenised on site, using the method of coning, on a polythene sheet, asdescribed above for bottom ash. The homogenised material was then transferred on site intofour bins, to a volume of ~20 litres each. Materials were added from the mixed stockpile into thefour bins sequentially so that a further degree of mixing and homogenisation took place.
At Site 2, APC material was collected during our sampling visit, directly from two silos, eachfilling one plastic bin. The bins’ contents were then mixed and homogenised subsequently atthe Enviros laboratory, using the method of coning on a polythene sheet.
At Site 3, the operator collected APC material on our behalf, over 48 hours prior to our visit.Samples were taken at hourly intervals from a single sampling point. These were combined intotwo polythene bags, one for each 24 hour period prior to our visit. The bag contents were
Science Report Testing of residues from incineration of municipal solid waste16
subsequently combined and homogenised at the Enviros laboratory and then stored in plasticbins, fitted with snap-top lids.
All bins were weighed after filling. The recorded weights are shown in the sampling logs inAppendix A.
Photographs of the mixed APC material are shown below.
Plate 5 APC residue during coning Plate 6 APC after coning
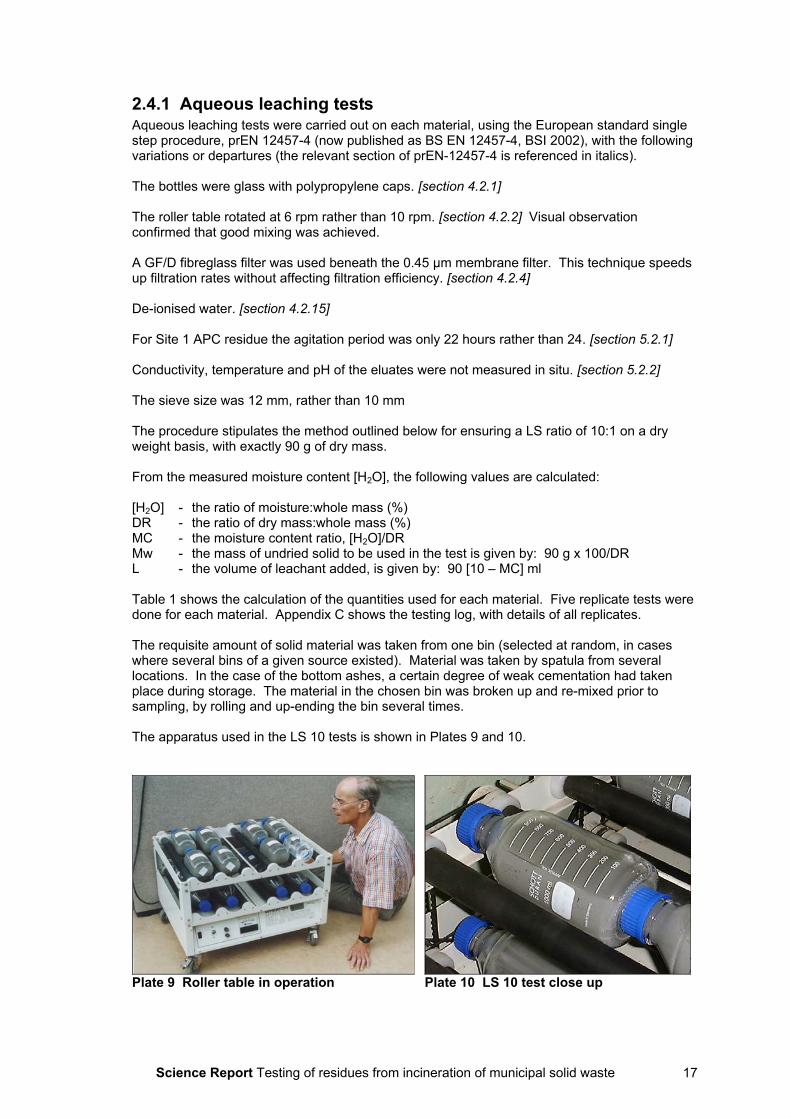
2.3 CarbonationOne bin of bottom ash and one of APC residue from each site were sent for carbonation at apilot facility operated by Lafarge Envirocem Systems, at Barnstone, Nottinghamshire. A shortreport by Lafarge, describing the equipment, procedure and some details of the materialstreated, is shown at Appendix B. Photographs of the equipment are shown in Plates 7 and 8.
Plate 7 Carbonation pilot plant Plate 8 Carbonation pilot plant
2.4 Leaching tests at LS 10Leaching at LS 10 was used for most of the testing because the test is easy and quick toundertake, and there is a large body of published data on LS 10 tests.
Science Report Testing of residues from incineration of municipal solid waste 17
2.4.1 Aqueous leaching testsAqueous leaching tests were carried out on each material, using the European standard singlestep procedure, prEN 12457-4 (now published as BS EN 12457-4, BSI 2002), with the followingvariations or departures (the relevant section of prEN-12457-4 is referenced in italics).
The bottles were glass with polypropylene caps. [section 4.2.1]
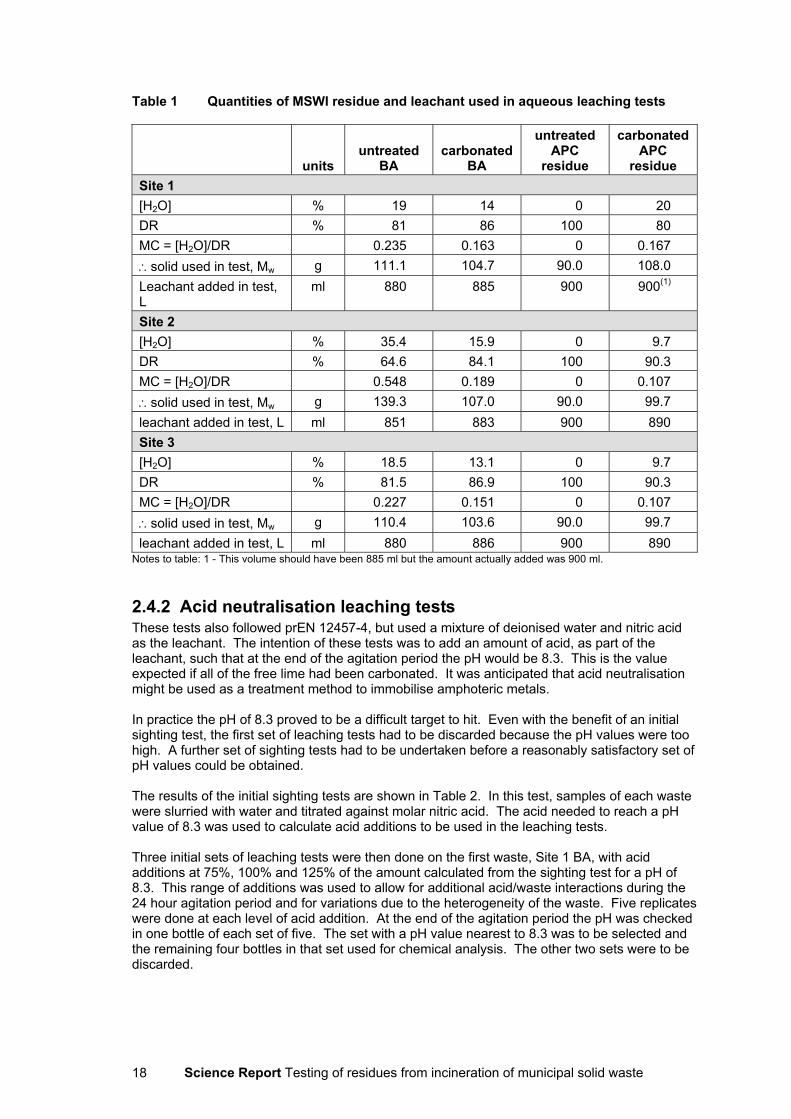
The roller table rotated at 6 rpm rather than 10 rpm. [section 4.2.2] Visual observationconfirmed that good mixing was achieved.
A GF/D fibreglass filter was used beneath the 0.45 µm membrane filter. This technique speedsup filtration rates without affecting filtration efficiency. [section 4.2.4]
De-ionised water. [section 4.2.15]
For Site 1 APC residue the agitation period was only 22 hours rather than 24. [section 5.2.1]
Conductivity, temperature and pH of the eluates were not measured in situ. [section 5.2.2]
The sieve size was 12 mm, rather than 10 mm
The procedure stipulates the method outlined below for ensuring a LS ratio of 10:1 on a dryweight basis, with exactly 90 g of dry mass.
From the measured moisture content [H2O], the following values are calculated:
[H2O] - the ratio of moisture:whole mass (%)DR - the ratio of dry mass:whole mass (%)MC - the moisture content ratio, [H2O]/DRMw - the mass of undried solid to be used in the test is given by: 90 g x 100/DRL - the volume of leachant added, is given by: 90 [10 – MC] ml
Table 1 shows the calculation of the quantities used for each material. Five replicate tests weredone for each material. Appendix C shows the testing log, with details of all replicates.
The requisite amount of solid material was taken from one bin (selected at random, in caseswhere several bins of a given source existed). Material was taken by spatula from severallocations. In the case of the bottom ashes, a certain degree of weak cementation had takenplace during storage. The material in the chosen bin was broken up and re-mixed prior tosampling, by rolling and up-ending the bin several times.
The apparatus used in the LS 10 tests is shown in Plates 9 and 10.
Plate 9 Roller table in operation Plate 10 LS 10 test close up
Science Report Testing of residues from incineration of municipal solid waste18
Table 1 Quantities of MSWI residue and leachant used in aqueous leaching tests
unitsuntreated
BAcarbonated
BA
untreatedAPC
residue
carbonatedAPC
residueSite 1[H2O] % 19 14 0 20DR % 81 86 100 80MC = [H2O]/DR 0.235 0.163 0 0.167∴solid used in test, Mw g 111.1 104.7 90.0 108.0Leachant added in test,L
ml 880 885 900 900(1)
Site 2[H2O] % 35.4 15.9 0 9.7DR % 64.6 84.1 100 90.3MC = [H2O]/DR 0.548 0.189 0 0.107∴solid used in test, Mw g 139.3 107.0 90.0 99.7leachant added in test, L ml 851 883 900 890Site 3[H2O] % 18.5 13.1 0 9.7DR % 81.5 86.9 100 90.3MC = [H2O]/DR 0.227 0.151 0 0.107∴solid used in test, Mw g 110.4 103.6 90.0 99.7leachant added in test, L ml 880 886 900 890
Notes to table: 1 - This volume should have been 885 ml but the amount actually added was 900 ml.
2.4.2 Acid neutralisation leaching testsThese tests also followed prEN 12457-4, but used a mixture of deionised water and nitric acidas the leachant. The intention of these tests was to add an amount of acid, as part of theleachant, such that at the end of the agitation period the pH would be 8.3. This is the valueexpected if all of the free lime had been carbonated. It was anticipated that acid neutralisationmight be used as a treatment method to immobilise amphoteric metals.
In practice the pH of 8.3 proved to be a difficult target to hit. Even with the benefit of an initialsighting test, the first set of leaching tests had to be discarded because the pH values were toohigh. A further set of sighting tests had to be undertaken before a reasonably satisfactory set ofpH values could be obtained.
The results of the initial sighting tests are shown in Table 2. In this test, samples of each wastewere slurried with water and titrated against molar nitric acid. The acid needed to reach a pHvalue of 8.3 was used to calculate acid additions to be used in the leaching tests.
Three initial sets of leaching tests were then done on the first waste, Site 1 BA, with acidadditions at 75%, 100% and 125% of the amount calculated from the sighting test for a pH of8.3. This range of additions was used to allow for additional acid/waste interactions during the24 hour agitation period and for variations due to the heterogeneity of the waste. Five replicateswere done at each level of acid addition. At the end of the agitation period the pH was checkedin one bottle of each set of five. The set with a pH value nearest to 8.3 was to be selected andthe remaining four bottles in that set used for chemical analysis. The other two sets were to bediscarded.
Science Report Testing of residues from incineration of municipal solid waste 19
Table 2 Results of initial acid neutralisation sighting tests on MSWI residues
Sample reference pH at startAcid required
to pH 12Acid required
to pH 8.3Acid required
to pH 4Site 1 BA 12.7 230 410 550
Site 2 BA 12.1 30 190 580
Site 3 BA 12.6 310 625 900
Site 1 APC 12.0 100 3060 6030
Site 2 APC 12.3 1150 5800 8180
Site 3 APC 12.7 3900 6840 9600Weight recorded, water added sufficient to make mobile on magnetic stirrer, titrated vs pH meter with molar nitric acid.Figures are in millilitres of acid per kilogram (= mmole/kg).
In practice, the pH values obtained in this initial test on Site 1 BA were 11.75, 11.25 and 10.75,at the three levels of acid addition. A second set of sighting tests was therefore conducted onall six wastes. These followed the LS 10 leaching test procedure, but used double the amountof acid indicated by the first sighting tests. Based on the pH results from this second sightingtest, revised estimates were made of acid additions needed to reach pH 8.3. For each waste,three sets of five replicates were undertaken, with acid additions at 75%, 100% and 125% of thenew estimated requirement. As before, one bottle from each set was chosen at random for pHmeasurement and the set with a pH value closest to 8.3 was used for chemical analysis.
The pH values obtained in all of the sighting tests and leaching tests on each material areshown in Figure 2. Appendix D shows the testing log for the acid neutralisation leaching tests.The samples selected for chemical analysis are highlighted in Figure 2 and in Appendix D. Thequantities of acid needed to reach a pH value of 8.3 have been estimated from Figure 2 and arepresented in Table 3.
Table 3 Acid neutralisation capacity of MSWI residues estimated from 24-hourleaching tests (to pH 8.3)
Volume of 2M HNO3to pH8.3 (ml)
Dry weight ofresidue (g)
ANC to pH8.3(mol/kg)
Bottom AshSite 1 44 90 0.98Site 2 27 90 0.60Site 3 53 90 1.18
APC residueSite 1 250 90 5.56Site 2 400 90 8.89Site 3 340 90 7.56
Science Report Testing of residues from incineration of municipal solid waste20
BA1 APC1ml pH ml pH
0 12.70 0 12.0017.1 11.75 235 10.1522.8 11.25 250 8.1528.5 10.75 265 7.40
37 10.25 275.4 6.3040 9.9543 9.15
45.6 6.40
BA2 APC2ml pH ml pH
0 12.1 0 12.326.5 8.65 350 11.15
27 8.2 400 8.429 7.95 450 4.5531 7.65 522 4
BA3 APC3ml pH ml pH
0 12.6 0 12.755 6.55 320 10.360 6.15 350 7.765 6 380 5.0569 5.85 615.6 0.85
0
2
4
6
8
10
12
14
0 10 20 30 40 500
2
4
6
8
10
12
14
0 50 100 150 200 250 300
0
2
4
6
8
10
12
14
0 10 20 30 400
2
4
6
8
10
12
14
0 100 200 300 400 500 600
0
2
4
6
8
10
12
14
0 20 40 60 800
2
4
6
8
10
12
14
0 200 400 600 800
Figure 2 pH results obtained during acid neutralisation leaching tests and sightingtests[X-axis shows ml of 2M HNO3 added to 90 g dry weight of residue;Y-axis shows pH value obtained;open square symbol shows values from the two sighting tests;highlighted values are the set used for chemical analysis]
Science Report Testing of residues from incineration of municipal solid waste 21
2.5 Column leaching testsColumn tests were carried out to examine equilibrium leachate quality at low LS ratio, which ismore representative of the first few decades at a landfill. Wastes were placed in perspexcolumns and a fixed amount of water recirculated through the waste until a constant electricalconductivity was reached.
The budget and timescales allowed only six materials to be tested and these were as follows.
Site 1 untreated BASite 2 untreated BASite 2 carbonated BA
Site 1 untreated APCSite 1 carbonated APCSite 2 untreated APC
These were chosen before analytical results were returned form the LS 10 tests and wereselected mainly because these wastes had exhibited pH values closest to the theoreticalcalcite–buffered value of 8.3, in the acid tests at LS 10. They were therefore felt likely toprovide the best basis for comparison with LS 10 results from untreated waste, carbonatedwaste and acid-neutralised waste.
The equipment used is shown schematically in Figure 3 and the filled columns are illustrated inPlates 11–13 (these show the columns filled with bottom ash). The columns were 120 mminternal diameter x 1,000 mm high.
peristaltic pump
eluatereservoir
2 litres
waste
sand layer, 25mm
marbles
perspex column,120mm x 1000mm
peristaltic pump
eluatereservoir
2 litres
waste
sand layer, 25mm
marbles
perspex column,120mm x 1000mm
Plate 11 Columns filled with bottom ash Figure 3 Schematic of the columnleaching test
Science Report Testing of residues from incineration of municipal solid waste22
Plate 12 Column test, detail Plate 13 Column test, detail
The columns were operated in an upflow saturated mode. Liquid overflowed from one of threevalved outlets, to a 2 litre pyrex reservoir, and was pumped back into the base of the column bya peristaltic pump. To assist even recirculation, a layer of glass marbles was placed in the baseof each column before the waste was introduced. To minimise carry over of fines from thewaste, a layer of clean washed sand was placed on top of the waste. The recirculation rate wasset so as to give a hydraulic retention time, per pass, of ~1 day. This was achieved by settingtimers to operate the pumps for 30 minutes per hour at a rate of ~7 ml/minute. Details of thequantities and recirculation rates are shown in Table 4.
Table 4 Details of column leaching tests on MSWI residues
units BA1 BA2 tBA2 APC1 APC2 tAPC1
Mass of waste used kg 16(E) 16(E) 16(E) 4.738 4.547 5.969
Initial volume of waste litres 8 8 8 8 8 8
Recirculation rate l/d 5.04 5.04 5.04 5.04 5.04 5.04
Water added litres 4 5 5 8 8 7
Approximate LS ratio 0.5 0.5 0.5 1.7 1.7 1.7
Duration of test hours 278 278 278 218 218 218
Total volume recirculated litres 58 58 58 46 46 46
Initial moisture content %w/w 19 35.4 15.9 0 0 20
∴Bed Volume of waste litres 3.04 5.66 2.54 0 0 1.19
No. of BV recirculated 19 10 23 - - 39
[Bottom ash was not weighed: estimated weight is based on a bulk density of 2 kg/l]
Electrical conductivity was measured twice daily. The recirculation was continued until it wasclear that a quasi-steady state had been reached. Recirculation was then stopped and thecolumns allowed to drain. All of the leachate was collected and samples sent to the EAlaboratories for analysis. During the tests on untreated APC residue, flammable gas wasevolved, thought to be mainly hydrogen. This led to some lifting of the waste mass, due tobubbles, and a small amount of liquid was lost via an open valve at a higher level than the
Science Report Testing of residues from incineration of municipal solid waste 23
leachate outflow pipe. Additional water was added to make up the estimated losses: 2 litres toAPC 2 and 1 litre to carbonated APC1.
The column tests were carried out in two sets, one for bottom ash and one for APC residue. Ablank (empty column) was run with the APC set. Details of the daily measurement ofconductivity in the two sets of trials are shown at Appendix E.
2.6 Chemical analysisThe Environment Agency's National Laboratory Service carried out all chemical analysis onsolids and eluates. Samples were submitted as they were produced, from June to November2002. A log of the dates of sample submission and receipt of results is shown at Appendix F.
All samples were analysed for a range of sanitary parameters, major ions, heavy metals, anddioxins. In addition a screening technique for List 1 substances (Environment Agency, 1999)was carried out on all samples (solids and eluates).
Science Report Testing of residues from incineration of municipal solid waste24
3 Results
3.1 General observationsSome general observations on the MSWI residues and the leaching tests are given below.
There was a considerable variation in the proportion of unburned material in the bottom ash atthe three incinerators. Paper and card with print still legible occurred to some extent at all threesites. Visually, it was most prevalent at Site 2 and least prevalent at Site 3. However, most ofthis type of material was removed with the other 12 mm rejects during the sieving procedure.The results for Loss on Ignition therefore do not take account of unburnt oversized material.
The bottom ash samples underwent a degree of solidification during storage between samplingand the leaching tests. This period was 2.5–3 weeks for all three sites. The extent ofcementation was slight and the materials were easily broken up again by rolling and up-endingthe sealed plastic container.
Carbonation caused only minor colour changes in the materials and, visually, had little effect ontheir physical form. The carbonated APC residues appeared to become more dense, possiblyas a result of the uptake of moisture.
Considerable gas generation occurred in the two column tests on untreated APC residue. Novisible evidence of gas generation was observed from the carbonated APC residue, and nonefrom any of the bottom ash samples. The gas was flammable and is thought to have beenhydrogen. Evolution of hydrogen following hydration has been observed elsewhere in studieson APC residues (e.g. Chen et al., 2003). It is assumed to be derived from the reaction of finelydivided metal particles (e.g. Al) with water.
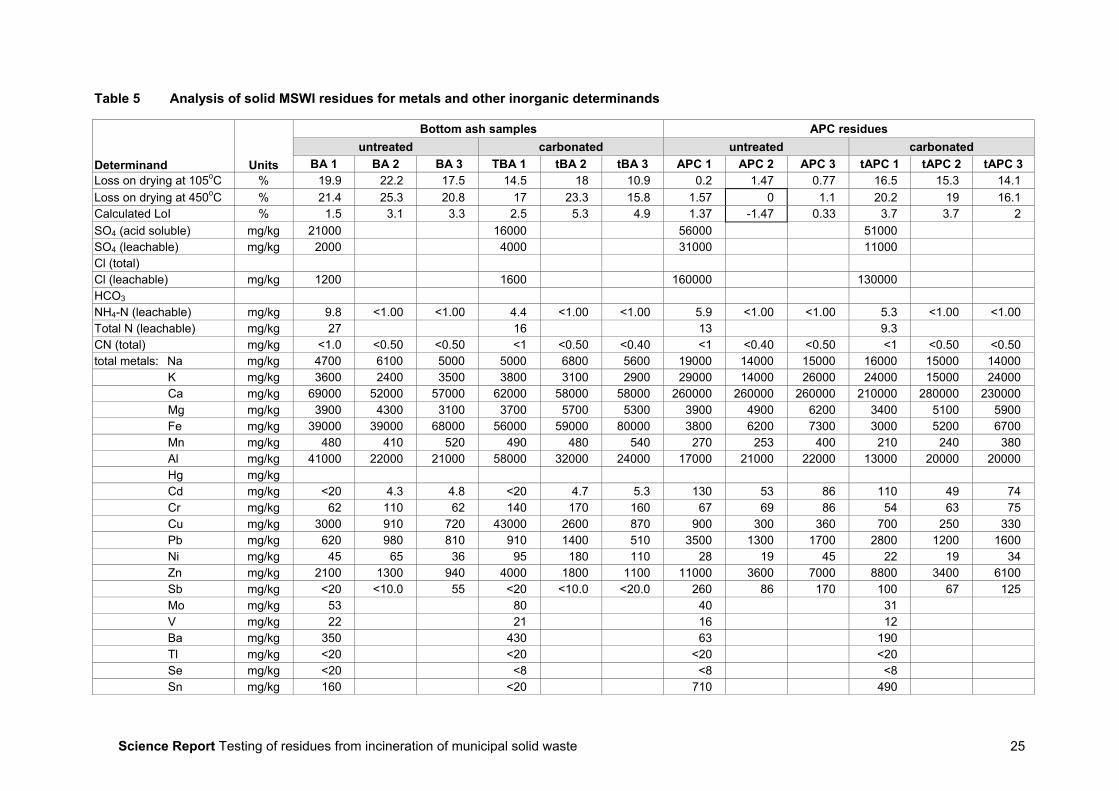
3.2 Results of analysis of solid residuesAnalytical results for conventional inorganic parameters are shown in Table 5.
Results were not received for some parameters on certain samples. This applies mainly to SO4,Cl and total nitrogen. No results were received for Hg on any solid sample.
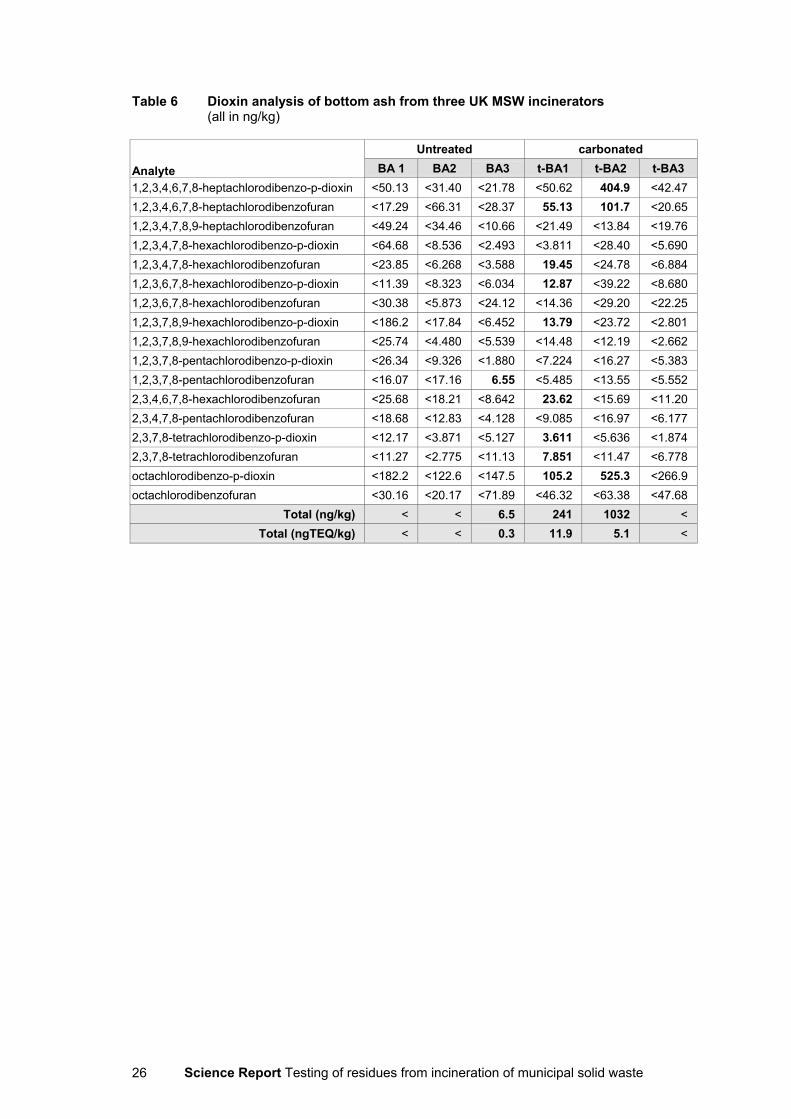
Results for dioxin analysis on solid samples are shown in Table 6 (bottom ash) and Table 7(APC residue).
Science Report Testing of residues from incineration of municipal solid waste 25
Table 5 Analysis of solid MSWI residues for metals and other inorganic determinands
Bottom ash samples APC residuesuntreated carbonated untreated carbonated
Determinand Units BA 1 BA 2 BA 3 TBA 1 tBA 2 tBA 3 APC 1 APC 2 APC 3 tAPC 1 tAPC 2 tAPC 3Loss on drying at 105oC % 19.9 22.2 17.5 14.5 18 10.9 0.2 1.47 0.77 16.5 15.3 14.1Loss on drying at 450oC % 21.4 25.3 20.8 17 23.3 15.8 1.57 0 1.1 20.2 19 16.1Calculated LoI % 1.5 3.1 3.3 2.5 5.3 4.9 1.37 -1.47 0.33 3.7 3.7 2SO4 (acid soluble) mg/kg 21000 16000 56000 51000SO4 (leachable) mg/kg 2000 4000 31000 11000Cl (total)Cl (leachable) mg/kg 1200 1600 160000 130000HCO3
NH4-N (leachable) mg/kg 9.8 <1.00 <1.00 4.4 <1.00 <1.00 5.9 <1.00 <1.00 5.3 <1.00 <1.00Total N (leachable) mg/kg 27 16 13 9.3CN (total) mg/kg <1.0 <0.50 <0.50 <1 <0.50 <0.40 <1 <0.40 <0.50 <1 <0.50 <0.50total metals: Na mg/kg 4700 6100 5000 5000 6800 5600 19000 14000 15000 16000 15000 14000
K mg/kg 3600 2400 3500 3800 3100 2900 29000 14000 26000 24000 15000 24000Ca mg/kg 69000 52000 57000 62000 58000 58000 260000 260000 260000 210000 280000 230000Mg mg/kg 3900 4300 3100 3700 5700 5300 3900 4900 6200 3400 5100 5900Fe mg/kg 39000 39000 68000 56000 59000 80000 3800 6200 7300 3000 5200 6700Mn mg/kg 480 410 520 490 480 540 270 253 400 210 240 380Al mg/kg 41000 22000 21000 58000 32000 24000 17000 21000 22000 13000 20000 20000Hg mg/kgCd mg/kg <20 4.3 4.8 <20 4.7 5.3 130 53 86 110 49 74Cr mg/kg 62 110 62 140 170 160 67 69 86 54 63 75Cu mg/kg 3000 910 720 43000 2600 870 900 300 360 700 250 330Pb mg/kg 620 980 810 910 1400 510 3500 1300 1700 2800 1200 1600Ni mg/kg 45 65 36 95 180 110 28 19 45 22 19 34Zn mg/kg 2100 1300 940 4000 1800 1100 11000 3600 7000 8800 3400 6100Sb mg/kg <20 <10.0 55 <20 <10.0 <20.0 260 86 170 100 67 125Mo mg/kg 53 80 40 31V mg/kg 22 21 16 12Ba mg/kg 350 430 63 190Tl mg/kg <20 <20 <20 <20Se mg/kg <20 <8 <8 <8Sn mg/kg 160 <20 710 490
Science Report Testing of residues from incineration of municipal solid waste26
Table 6 Dioxin analysis of bottom ash from three UK MSW incinerators(all in ng/kg)
Untreated carbonated
Analyte BA 1 BA2 BA3 t-BA1 t-BA2 t-BA31,2,3,4,6,7,8-heptachlorodibenzo-p-dioxin <50.13 <31.40 <21.78 <50.62 404.9 <42.471,2,3,4,6,7,8-heptachlorodibenzofuran <17.29 <66.31 <28.37 55.13 101.7 <20.651,2,3,4,7,8,9-heptachlorodibenzofuran <49.24 <34.46 <10.66 <21.49 <13.84 <19.761,2,3,4,7,8-hexachlorodibenzo-p-dioxin <64.68 <8.536 <2.493 <3.811 <28.40 <5.6901,2,3,4,7,8-hexachlorodibenzofuran <23.85 <6.268 <3.588 19.45 <24.78 <6.8841,2,3,6,7,8-hexachlorodibenzo-p-dioxin <11.39 <8.323 <6.034 12.87 <39.22 <8.6801,2,3,6,7,8-hexachlorodibenzofuran <30.38 <5.873 <24.12 <14.36 <29.20 <22.251,2,3,7,8,9-hexachlorodibenzo-p-dioxin <186.2 <17.84 <6.452 13.79 <23.72 <2.8011,2,3,7,8,9-hexachlorodibenzofuran <25.74 <4.480 <5.539 <14.48 <12.19 <2.6621,2,3,7,8-pentachlorodibenzo-p-dioxin <26.34 <9.326 <1.880 <7.224 <16.27 <5.3831,2,3,7,8-pentachlorodibenzofuran <16.07 <17.16 6.55 <5.485 <13.55 <5.5522,3,4,6,7,8-hexachlorodibenzofuran <25.68 <18.21 <8.642 23.62 <15.69 <11.202,3,4,7,8-pentachlorodibenzofuran <18.68 <12.83 <4.128 <9.085 <16.97 <6.1772,3,7,8-tetrachlorodibenzo-p-dioxin <12.17 <3.871 <5.127 3.611 <5.636 <1.8742,3,7,8-tetrachlorodibenzofuran <11.27 <2.775 <11.13 7.851 <11.47 <6.778octachlorodibenzo-p-dioxin <182.2 <122.6 <147.5 105.2 525.3 <266.9octachlorodibenzofuran <30.16 <20.17 <71.89 <46.32 <63.38 <47.68
Total (ng/kg) < < 6.5 241 1032 <Total (ngTEQ/kg) < < 0.3 11.9 5.1 <
Science Report Testing of residues from incineration of municipal solid waste 27
Table 7 Dioxin analysis of APC residue from three UK MSW incinerators(all in ng/kg and in TEQ/kg)
untreated carbonatedAPC1 APC2 APC3 t-APC1 t-APC2 t- APC3Analyte WHO
TEQfactor ng/kg TEQ/kg ng/kg TEQ/kg ng/kg TEQ/kg ng/kg TEQ/kg ng/kg TEQ/kg ng/kg TEQ/kg
1,2,3,4,6,7,8-heptachlorodibenzo-p-dioxin 0.01 4241 42.4 3847 38.47 1397 13.97 2613 26.13 4037 40.37 1463 14.631,2,3,4,6,7,8-heptachlorodibenzofuran 0.01 4879 48.79 2161 21.61 1304 13.04 3287 32.87 2166 21.66 1045 10.451,2,3,4,7,8,9-heptachlorodibenzofuran 0.01 784.9 7.849 269.3 2.693 116.4 1.164 691 6.91 370.8 3.708 94.16 0.94161,2,3,4,7,8-hexachlorodibenzo-p-dioxin 0.1 289.4 28.94 310.1 31.01 102.4 10.24 183.1 18.31 306.7 30.67 110.2 11.021,2,3,4,7,8-hexachlorodibenzofuran 0.1 1418 141.8 982.8 98.28 575.9 57.59 942.1 94.21 1012 101.2 486.1 48.611,2,3,6,7,8-hexachlorodibenzo-p-dioxin 0.1 563.3 56.33 604.1 60.41 271.4 27.14 318.5 31.85 738.3 73.83 225 22.51,2,3,6,7,8-hexachlorodibenzofuran 0.1 1242 124.2 1193 119.3 666.7 66.67 926.2 92.62 890 89 505.1 50.511,2,3,7,8,9-hexachlorodibenzo-p-dioxin 0.1 498.8 49.88 571.6 57.16 311.8 31.18 318.4 31.84 490 49 181.5 18.151,2,3,7,8,9-hexachlorodibenzofuran 0.1 <283.2 0 425.6 42.56 106.8 10.68 <396.6 0 305.6 30.56 130.2 13.021,2,3,7,8-pentachlorodibenzo-p-dioxin 1 323.3 323.3 474.8 474.8 245.7 245.7 238.9 238.9 382.7 382.7 168.2 168.21,2,3,7,8-pentachlorodibenzofuran 0.05 886.9 44.345 960.4 48.02 706 35.3 36.37 1.8185 378.8 18.94 531.9 26.5952,3,4,6,7,8-hexachlorodibenzofuran 0.1 1816 181.6 1110 111 525 52.5 1151 115.1 925.1 92.51 432.7 43.272,3,4,7,8-pentachlorodibenzofuran 0.5 1245 622.5 1051 525.5 744.1 372.05 54.02 27.01 1130 565 481.7 240.852,3,7,8-tetrachlorodibenzo-p-dioxin 1 <72.46 0 135.5 135.5 103.6 103.6 53.96 53.96 171.6 171.6 85.58 85.582,3,7,8-tetrachlorodibenzofuran 0.1 413 41.3 721.4 72.14 571.4 57.14 285.8 28.58 706.5 70.65 407.7 40.77octachlorodibenzo-p-dioxin 0.0001 8582 0.8582 4359 0.4359 2716 0.2716 7770 0.777 6234 0.6234 2449 0.2449octachlorodibenzofuran 0.0001 247.1 0.02471 699.8 0.06998 186.9 0.01869 1669 0.1669 691.1 0.06911 219.5 0.02195
Total 27,430 19,876 10,651 20,538 20,936 9,016Total TEQ 1714 1839 1098 801 1742 795
TEQ = toxic equivalent derived from World Health Organization(van den Berg et al. 1998)
Science Report Testing of residues from incineration of municipal solid waste28
Results of the List 1 scan technique on the solid samples are shown in Appendix G, and summarisedin Table 8.
Table 8 Summary of List 1 screening technique results for MSWI solid residues
untreated carbonatedBottom Ash
BA 1 BA2 BA3 BA1 BA2 BA3No. of compounds reported 29 56 54 17 44 15
most <1 13>10 many>100 Most<1 most<1Typical range (mg/kg)
all <10 several atseveral 10s 10>500 All<2 all<10
Maximum (mg/kg) 6.8 89 4,000 1.6 1.2 5.4
APC residues APC1 APC2 APC3 APC1 APC2 APC3No. of compounds reported 24 73 45 3 7 2Typical concentrations (mg/kg) most<1 most 1-10 most 1-10 <0.5 <1 <1
5>50 7>10Maximum (mg/kg) 15 144 46 0.4 2.0 0.8
3.2.1 Bottom ashAnalyses for inorganic and conventional parameters in the untreated wastes are similar to thosereported elsewhere for bottom ash. In particular, they are of a similar magnitude to those found in aprevious study of residues from incinerators in England and Wales (Environment Agency, 2002) andin an earlier study for the Energy Technology Support Unit (ETSU, 1996).
Loss on ignition (LoI) was 1.5% to 3.3%. This is typical of the performance expected from modernincinerators. The effect on these LoI results of the removal of unburnt paper during the sievingprocess can not be gauged: sieving also removed other oversize particles and objects, with loworganic content.
The predominant heavy metals were Zn, Cu and Pb.
Moisture content was in the range 18% to 22%.
Carbonation, as might be expected, had no significant effect on the elemental composition. Thecarbonated materials had slightly increased LoI at 2.5% to 5.3%. This may be due to decompositionof carbonate. One metal result (Cu, Site 1) on the carbonated samples is anomalous, showing anincrease to 43,000 mg/kg and is considered likely to be due to an analytical error.
Dioxin levels in the untreated bottom ash were very low (see Table 6): only one congener wasdetected, in only a single sample. Slightly higher levels were reported in the carbonated samples, butwere still only in the range 5 to 12 ngTEQ/kg. These results are comparable to the range 0.64–23ngITEQ/kg found in a previous study of UK bottom ashes (Environment Agency, 2002).
The results of the List 1 screening technique are summarised in Table 8. They revealed the presenceof large numbers of trace organic compounds in some samples, with orders of magnitude differencesin concentration between sites. Individual compounds were detected at more than 1,000 mg/kg atSite 3, and less than 10 mg/kg at Site 1. The majority of the substances detected were chlorinatedaliphatic and aromatic hydrocarbons plus some BTEX, alkenes and PAH (see Appendix G).Carbonation led to a massive fall in concentrations, with all three sites having similarly low levels(most <1 mg/kg; all <10 mg/kg) and fewer compounds detected. This behaviour is in contrast to thedioxin results, which were higher, overall, after carbonation. The reduction in the trace organics islikely to reflect their volatility and hence removal during drying and carbonation.
Science Report Testing of residues from incineration of municipal solid waste 29
3.2.2 APC residuesThe conventional, inorganic and heavy metal results for APC residues (Table 5) were as expected.The high Ca and Cl content (~26% and ~16%) reflect the incorporation of lime used in the semi-dryscrubbing process and its partial conversion to calcium chloride by HCl gas. The heavy metalconcentrations were similar to those found during a previous study of UK incinerators (EnvironmentAgency, 2002), with Zn, Pb and Cu predominant. Cd was also significantly enriched compared withthe bottom ash. Loss on ignition was very low, and, as with the bottom ash, it was higher in thecarbonated samples.
Dioxin concentrations found in this study are compared in Figure 4 with those found in a previousstudy of UK incinerators (Environment Agency, 2002). The totals found at the three plants in thisstudy were within the range found in the larger UK study.
This study0
10,000
20,000
30,000
40,000
50,000
60,000
70,000
EA study of 11 UK plants
Tota
l dio
xins
in n
g/kg
Figure 4 Comparison of total dioxin content of solid APC residues in this study comparedwith earlier EA study of 11 UK incinerators
The relative dominance of individual congeners was very similar at all three plants in this study, withthe same two congeners comprising at least 50% of the TEQ (toxic equivalent), in each case, namely2,3,4,7,8-PCDBF and1,2,3,7,8-PCDD.
Carbonation had no significant effect on total dioxin concentrations. For Site 1, the total (in ngTEQ/kg) was approximately halved after carbonation. This anomaly is due to one congener with ahigh TEQ factor, namely 2,3,4,7,8-PCDBF. Given the absence of any significant decrease in othercongeners, in any of the APC or bottom ash samples following carbonation, it is possible that this isan analytical or transcription error.
Trace organics (Appendix G and Table 8) varied widely in the number of compounds detected and theconcentrations recorded. Numbers and concentrations were broadly similar to the range found in thebottom ash, except that the extreme high values in BA3 did not occur in APC3. The compoundsdetected in the untreated APC residue were mainly chlorinated aliphatic and aromatic hydrocarbons,similar to those in the bottom ash. PCBs and hexachlorobenzene were also detected at lowconcentration in the samples from Site 2. Following carbonation, the number of compounds, and theirconcentrations, fell even more dramatically than they did with the bottom ash. Very few compoundswere detectable and concentrations were extremely low, mostly less than 1 mg/kg.
Science Report Testing of residues from incineration of municipal solid waste30
3.3 Results of leaching tests on bottom ashAll analytical results, for bottom ash and APC residue, are given in appendices as follows:
Appendix H: major ions, sanitary parameters and heavy metalsAppendix I: dioxins and furansAppendix J: List 1 screening method results for aqueous eluatesAppendix K: List 1 screening method results for acid leaching test eluatesAppendix L: List 1 screening method results from column leaching tests.
There was generally very good consistency between replicates, for nearly all parameters. This canbe seen in graphical presentations of data in the following sections of the report.
The few exceptions were:
• A small number of COD, Ca and SO4, results exhibited greater variability;
• Some heavy metals, notably Ba, Mo, Hg and Se, exhibited greater spread, mostly at high pHvalues in the results for untreated APC residue.
No results were received for Fe, Mn or Al in any of the eluates. Results for some other parameterswere not received for certain samples. This applied to TKN, BOD and alkalinity. For otherparameters, namely DOC (dissolved organic carbon), COD, BOD, Cd and some other metals, thedetection limits were often so high as to limit the usefulness of the results.
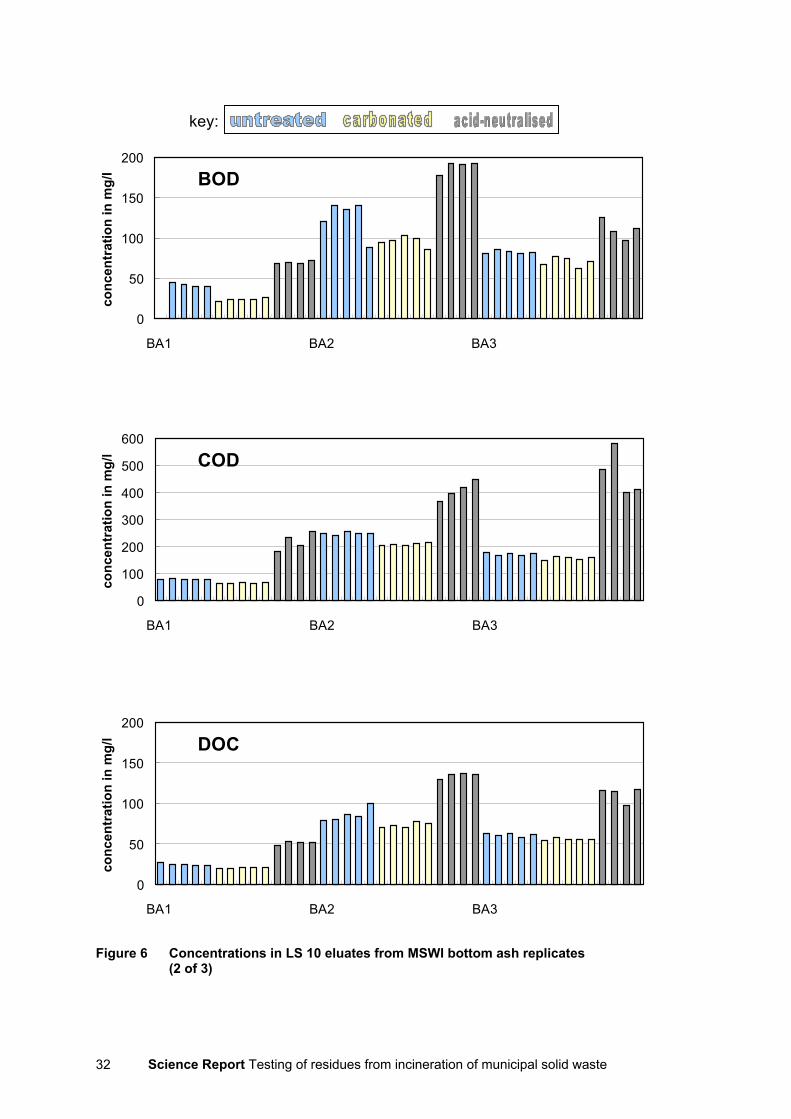
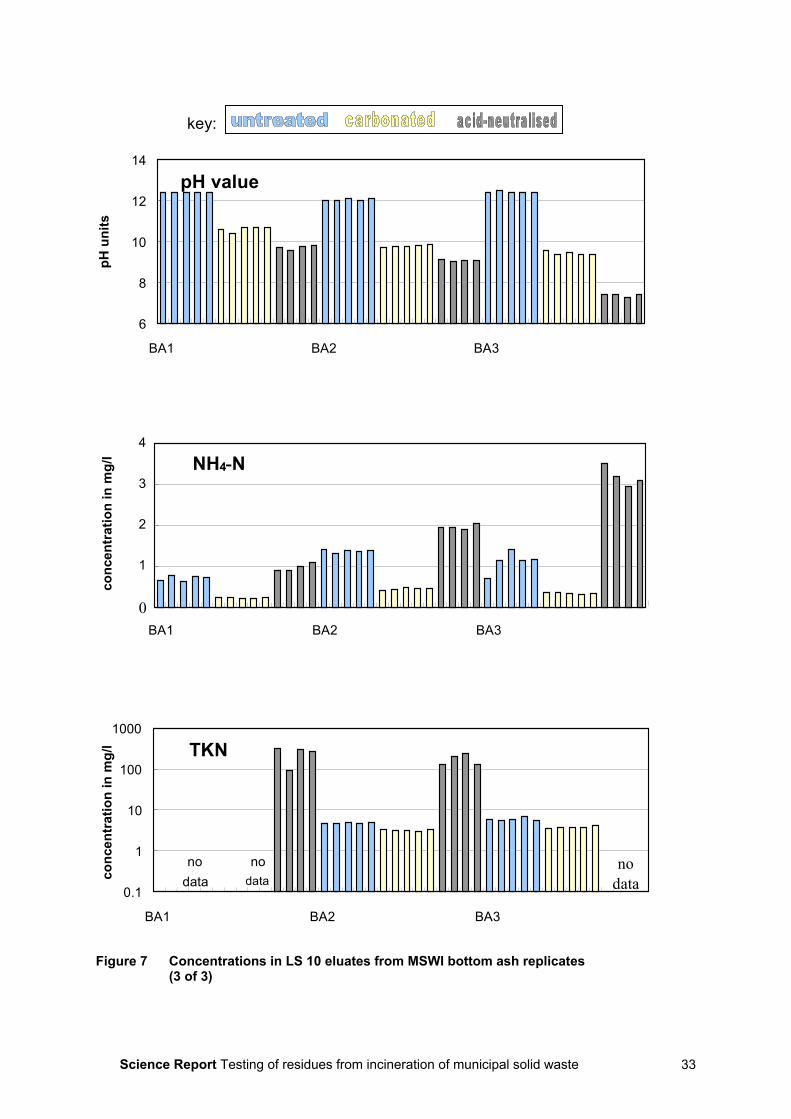
3.3.1 Results for bottom ash at LS 10: conventional parametersEluate concentrations for Cl, SO4, Ca, BOD, COD, DOC, pH, NH4-N and TKN are shown as barcharts in Figures 5 to 7. The charts allow direct comparison between replicates, between treatments(untreated, carbonated, and acid-neutralised) and between sites. Eluate concentrations of heavymetals are shown in Figure 8, graphed against pH value. Note that Figures 5 to 8 showconcentrations in the LS 10 eluates rather than quantity leached per unit weight of ash. This formathas been used because the focus of this study is leachate quality rather than characterisation of thewastes.
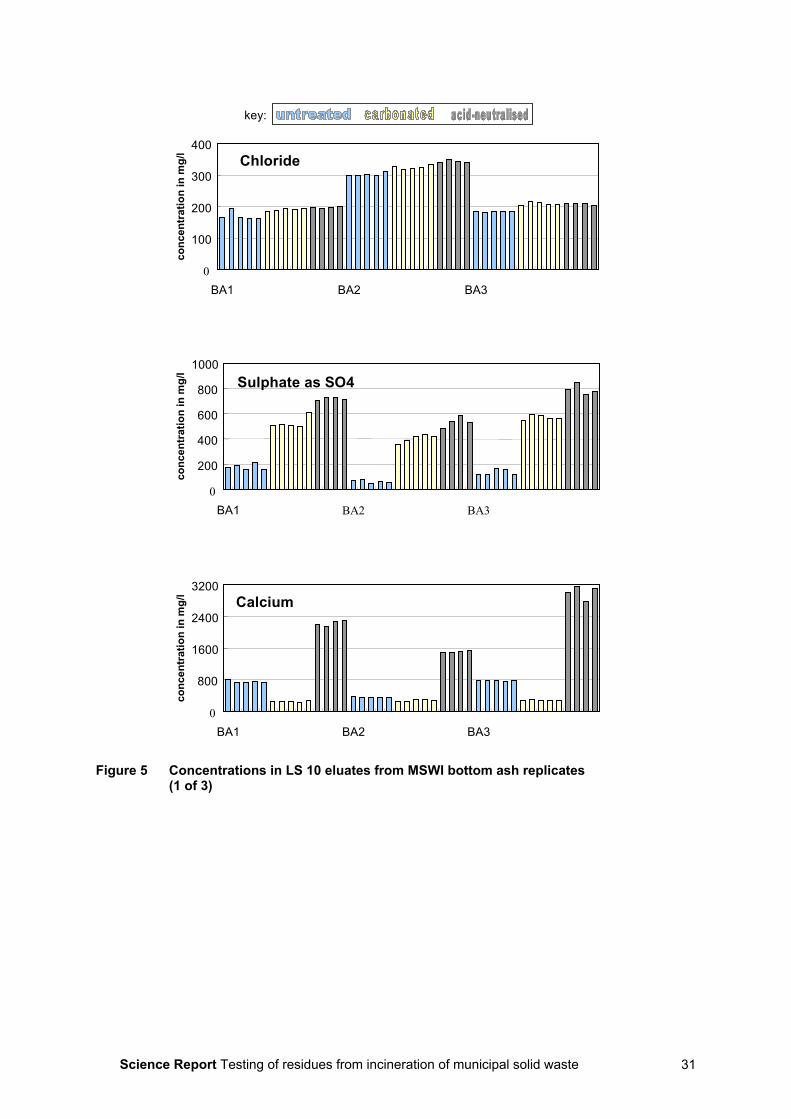
Science Report Testing of residues from incineration of municipal solid waste 31
key:
Chloride
0
100
200
300
400
BA1 BA2 BA3
conc
entr
atio
n in
mg/
l
Sulphate as SO4
0
200
400
600
800
1000
BA1 BA2 BA3
conc
entr
atio
n in
mg/
l
Calcium
0
800
1600
2400
3200
BA1 BA2 BA3
conc
entr
atio
n in
mg/
l
Figure 5 Concentrations in LS 10 eluates from MSWI bottom ash replicates(1 of 3)
Science Report Testing of residues from incineration of municipal solid waste32
key:
BOD
0
50
100
150
200
BA1 BA2 BA3
conc
entr
atio
n in
mg/
l
COD
0
100
200
300
400
500
600
BA1 BA2 BA3
conc
entr
atio
n in
mg/
l
DOC
0
50
100
150
200
BA1 BA2 BA3
conc
entr
atio
n in
mg/
l
Figure 6 Concentrations in LS 10 eluates from MSWI bottom ash replicates(2 of 3)
Science Report Testing of residues from incineration of municipal solid waste 33
key:
pH value
6
8
10
12
14
BA1 BA2 BA3
pH u
nits
NH4-N
0
1
2
3
4
BA1 BA2 BA3
conc
entr
atio
n in
mg/
l
TKN
0.1
1
10
100
1000
BA1 BA2 BA3
conc
entr
atio
n in
mg/
l
nodata
nodata
nodata
Figure 7 Concentrations in LS 10 eluates from MSWI bottom ash replicates(3 of 3)
Science Report Testing of residues from incineration of municipal solid waste34
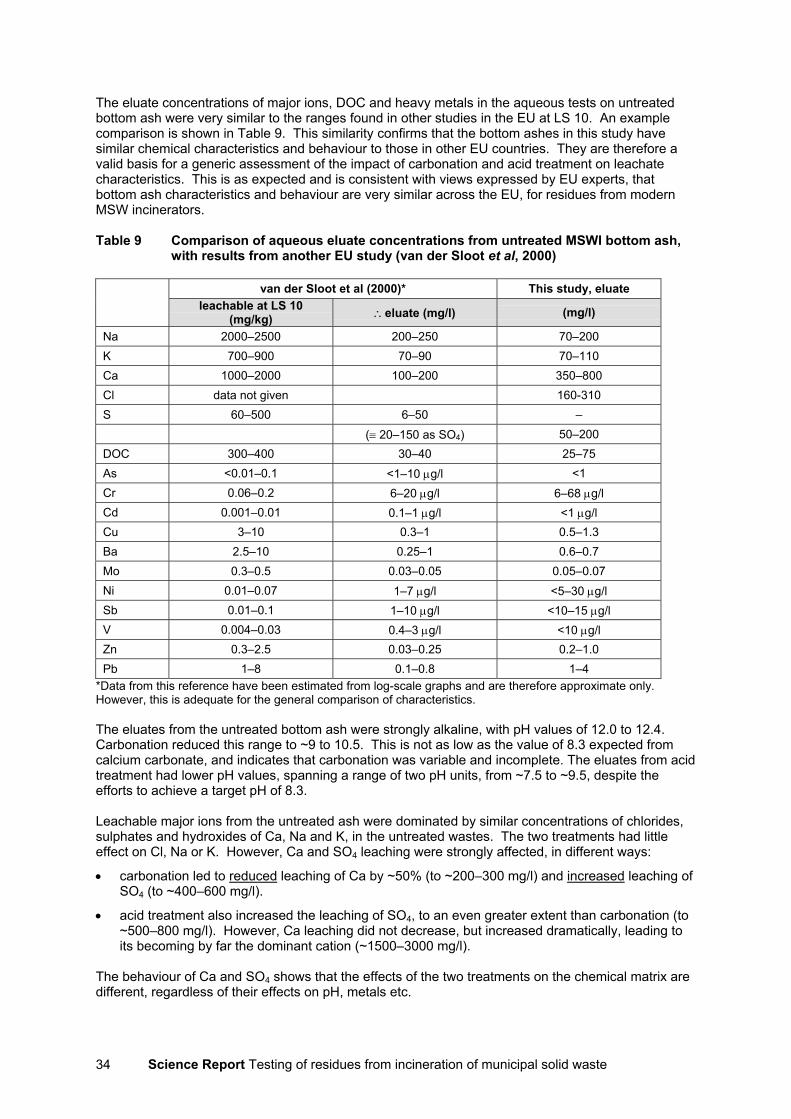
The eluate concentrations of major ions, DOC and heavy metals in the aqueous tests on untreatedbottom ash were very similar to the ranges found in other studies in the EU at LS 10. An examplecomparison is shown in Table 9. This similarity confirms that the bottom ashes in this study havesimilar chemical characteristics and behaviour to those in other EU countries. They are therefore avalid basis for a generic assessment of the impact of carbonation and acid treatment on leachatecharacteristics. This is as expected and is consistent with views expressed by EU experts, thatbottom ash characteristics and behaviour are very similar across the EU, for residues from modernMSW incinerators.
Table 9 Comparison of aqueous eluate concentrations from untreated MSWI bottom ash,with results from another EU study (van der Sloot et al, 2000)
van der Sloot et al (2000)* This study, eluateleachable at LS 10
(mg/kg) ∴eluate (mg/l) (mg/l)
Na 2000–2500 200–250 70–200K 700–900 70–90 70–110Ca 1000–2000 100–200 350–800Cl data not given 160-310S 60–500 6–50 –
(≡ 20–150 as SO4) 50–200DOC 300–400 30–40 25–75As <0.01–0.1 <1–10 µg/l <1Cr 0.06–0.2 6–20 µg/l 6–68 µg/lCd 0.001–0.01 0.1–1 µg/l <1 µg/lCu 3–10 0.3–1 0.5–1.3Ba 2.5–10 0.25–1 0.6–0.7Mo 0.3–0.5 0.03–0.05 0.05–0.07Ni 0.01–0.07 1–7 µg/l <5–30 µg/lSb 0.01–0.1 1–10 µg/l <10–15 µg/lV 0.004–0.03 0.4–3 µg/l <10 µg/lZn 0.3–2.5 0.03–0.25 0.2–1.0Pb 1–8 0.1–0.8 1–4
*Data from this reference have been estimated from log-scale graphs and are therefore approximate only.However, this is adequate for the general comparison of characteristics.
The eluates from the untreated bottom ash were strongly alkaline, with pH values of 12.0 to 12.4.Carbonation reduced this range to ~9 to 10.5. This is not as low as the value of 8.3 expected fromcalcium carbonate, and indicates that carbonation was variable and incomplete. The eluates from acidtreatment had lower pH values, spanning a range of two pH units, from ~7.5 to ~9.5, despite theefforts to achieve a target pH of 8.3.
Leachable major ions from the untreated ash were dominated by similar concentrations of chlorides,sulphates and hydroxides of Ca, Na and K, in the untreated wastes. The two treatments had littleeffect on Cl, Na or K. However, Ca and SO4 leaching were strongly affected, in different ways:
• carbonation led to reduced leaching of Ca by ~50% (to ~200–300 mg/l) and increased leaching ofSO4 (to ~400–600 mg/l).
• acid treatment also increased the leaching of SO4, to an even greater extent than carbonation (to~500–800 mg/l). However, Ca leaching did not decrease, but increased dramatically, leading toits becoming by far the dominant cation (~1500–3000 mg/l).
The behaviour of Ca and SO4 shows that the effects of the two treatments on the chemical matrix aredifferent, regardless of their effects on pH, metals etc.
Science Report Testing of residues from incineration of municipal solid waste 35
Acid treatment, as expected, led to the presence of NO3 as the dominant anion (TON ~750–1200mg/l), compared with virtually none in the untreated waste eluates. These concentrations were asexpected from the volume of 2M HNO3 added. However, the results for Site 3 were much lower (~9mg/l) and are regarded as probably erroneous. The Site 3 samples were submitted in a differentbatch from Sites 1 and 2. They were submitted with APC eluates, which also had inconsistent andimprobable TON results.
DOC concentrations from the untreated bottom ash varied by a factor of around three between sites,(~25 to ~75 mg/l) and correlated roughly with the LoI in the solid waste. The results for BOD (Figure6) and COD indicated BOD/COD ratios of typically ~0.5. This suggests that a high proportion of theDOC may be readily degradable. Carbonation had no significant effect on the DOC concentration.There was a small reduction in the BOD/COD ratio at Site 1 but not at Sites 2 or 3. In contrast, acidtreatment led to a large increase in leaching of DOC: concentrations were approximately doubled, to~50–135 mg/l. This was accompanied by a small decline in BOD/COD ratio (range 0.24 to 0.46).
Acid treatment also led to a large increase in the reported concentrations of organic nitrogen. Theuntreated wastes produced eluate nitrogen concentrations typically of:
NH4-N ~1.5 mg/lTKN ~5 mg/lTON <1 mg/l
Carbonation led to small reductions in the already low eluate concentrations of NH4-N and TKN(Figure 7). However, acid treatment produced reported eluate concentrations of:
NH4-N 1 to 3 mg/lTKN 180 to 250 mg/l
The apparent high level of organic nitrogen in these eluates is difficult to reconcile with the DOCconcentrations. These levels would imply the existence of organic compounds containing a very highproportion of nitrogen, and must be regarded as questionable. This does not appear to be simply aneffect of lower pH values: for example, the Site 2 acid eluates had similar pH values to the Site 3carbonated eluates but had far higher TKN concentrations (see Figure 7).
The heavy metals present at the highest concentrations in the eluates from untreated bottom ashwere:
Pb 1 to 4 mg/lCu 0.5 to 1.3 mg/lZn 0.2 to 1 mg/lBa 0.6 to 0.7 mg/lMo 50 to 70 µg/l
Many of the other metals were at or below their detection limits in most replicates (As, Cd, Tl, Se, Sb,Sn, V, Hg) from untreated bottom ash.
The effect of the two treatments on metals was highly variable. Leaching of some metals wasimproved (i.e. reduced) by both treatments and some worsened by one or both treatments:
improved: Pb, Zn (depending on pH), Ba
worsened: Sb, Cd, V, Mo, Cr, Se, As
The effects of the two treatments on metal leachability was highly variable. The results aresummarised in Table 10 and Figure 8 and are discussed below:
• Leaching of Pb and Zn was generally reduced by more than two orders of magnitude. Bothmetals are amphoteric and this can be seen in the high concentrations leached at high pH values(Figure 8). For Site 3, the lower than intended pH resulting from the acid treatment led to adramatic increase in leaching of Zn.
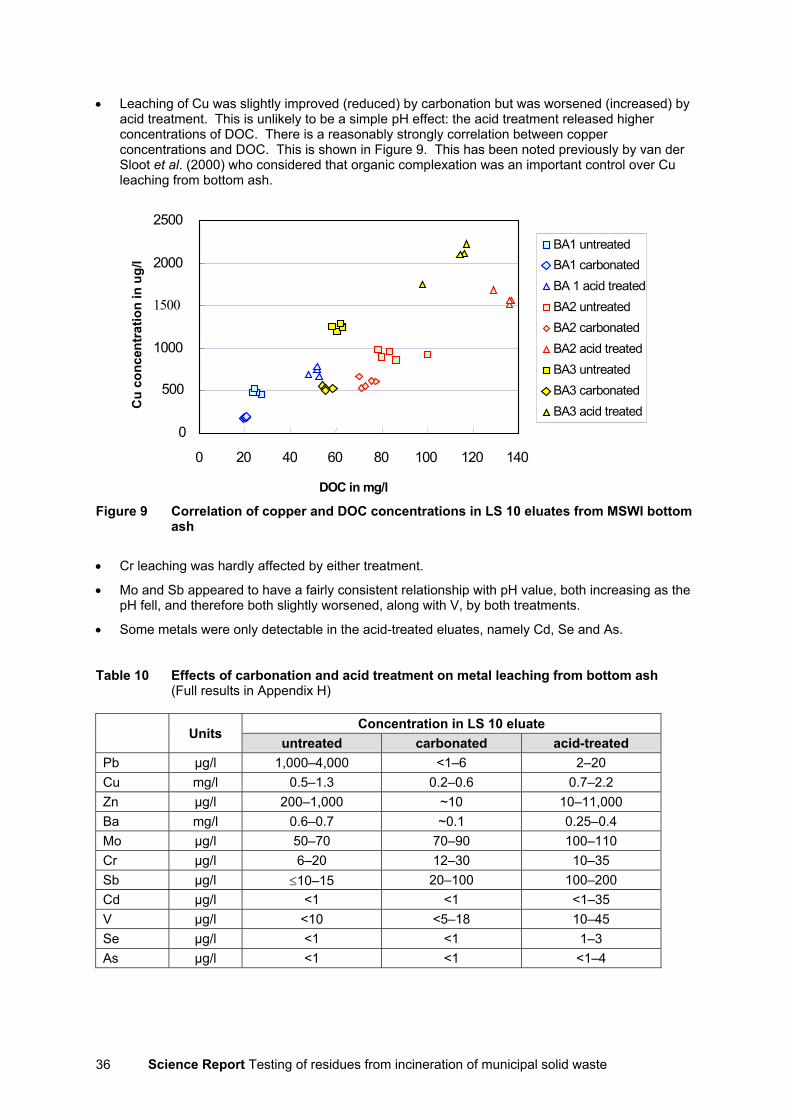
Science Report Testing of residues from incineration of municipal solid waste36
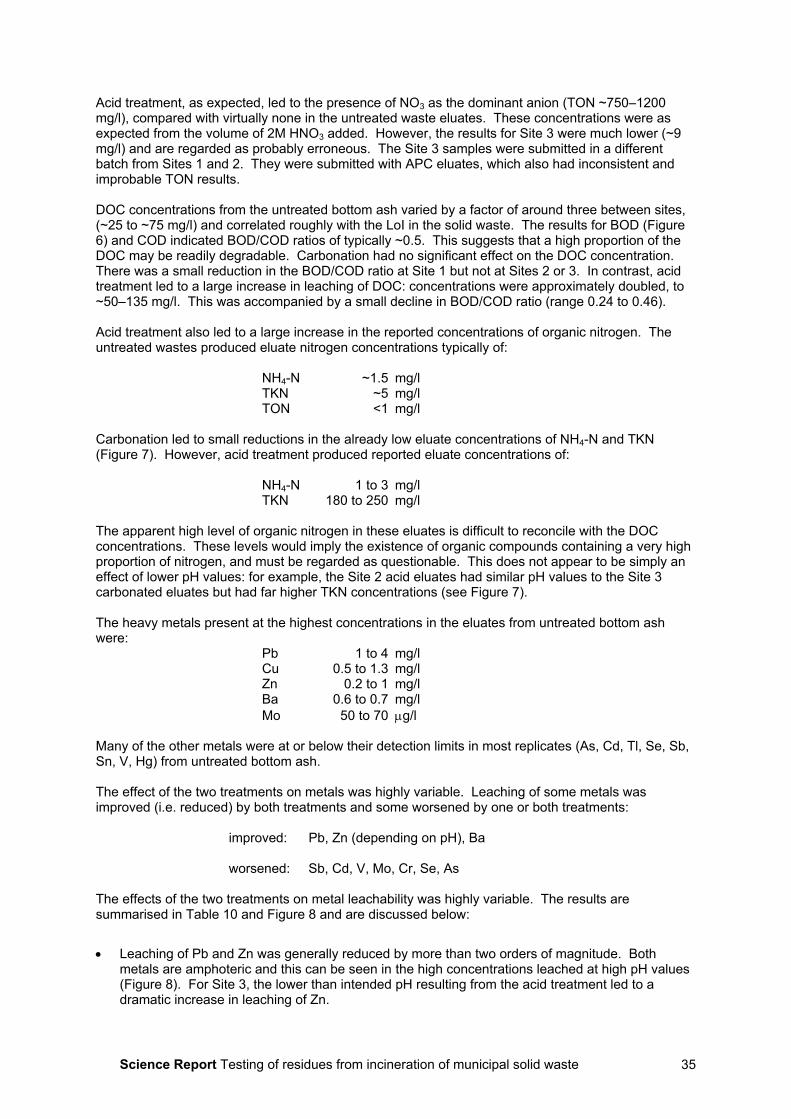
• Leaching of Cu was slightly improved (reduced) by carbonation but was worsened (increased) byacid treatment. This is unlikely to be a simple pH effect: the acid treatment released higherconcentrations of DOC. There is a reasonably strongly correlation between copperconcentrations and DOC. This is shown in Figure 9. This has been noted previously by van derSloot et al. (2000) who considered that organic complexation was an important control over Culeaching from bottom ash.
0
500
1000
1500
2000
2500
0 20 40 60 80 100 120 140
DOC in mg/l
Cu
conc
entr
atio
n in
ug/
l
BA1 untreatedBA1 carbonatedBA 1 acid treatedBA2 untreatedBA2 carbonatedBA2 acid treatedBA3 untreatedBA3 carbonatedBA3 acid treated
Figure 9 Correlation of copper and DOC concentrations in LS 10 eluates from MSWI bottomash
• Cr leaching was hardly affected by either treatment.
• Mo and Sb appeared to have a fairly consistent relationship with pH value, both increasing as thepH fell, and therefore both slightly worsened, along with V, by both treatments.
• Some metals were only detectable in the acid-treated eluates, namely Cd, Se and As.
Table 10 Effects of carbonation and acid treatment on metal leaching from bottom ash(Full results in Appendix H)
Concentration in LS 10 eluateUnits
untreated carbonated acid-treatedPb µg/l 1,000–4,000 <1–6 2–20Cu mg/l 0.5–1.3 0.2–0.6 0.7–2.2Zn µg/l 200–1,000 ~10 10–11,000Ba mg/l 0.6–0.7 ~0.1 0.25–0.4Mo µg/l 50–70 70–90 100–110Cr µg/l 6–20 12–30 10–35Sb µg/l ≤10–15 20–100 100–200Cd µg/l <1 <1 <1–35V µg/l <10 <5–18 10–45Se µg/l <1 <1 1–3As µg/l <1 <1 <1–4
Science Report Testing of residues from incineration of municipal solid waste 37
1
10
100
1000
10000
6 7 8 9 10 11 12 13
pH value
Pb c
once
ntra
tion
in u
g/l
BA1 BA1 carbonated BA 1 acid treated
BA2 BA2 carbonated BA2 acid treated
BA3 BA3 carbonated BA3 acid treated
1
10
100
1000
10000
6 7 8 9 10 11 12 13
pH value
Zn c
once
ntra
tion
in u
g/l
BA1 BA1 carbonated BA 1 acid treatedBA2 BA2 carbonated BA2 acid treatedBA3 BA3 carbonated BA3 acid treated
10
100
1000
6 7 8 9 10 11 12 13pH value
Ba
conc
entr
atio
n in
ug/
l
10
100
1000
10000
6 7 8 9 10 11 12 13pH value
Cu
conc
entr
atio
n in
ug/
l
10
100
1000
6 7 8 9 10 11 12 13
pH value
Sb c
once
ntra
tion
in u
g/l
1
10
100
6 7 8 9 10 11 12 13
pH value
Se c
once
ntra
tion
in u
g/l
10
100
1000
6 7 8 9 10 11 12 13pH value
Mo
conc
entr
atio
n in
ug/
l
1
10
100
6 7 8 9 10 11 12 13pH value
Cr c
once
ntra
tion
in u
g/l
0.1
1
10
100
6 7 8 9 10 11 12 13pH value
Cd
conc
entr
atio
n in
ug/
l
10
100
1000
6 7 8 9 10 11 12 13pH value
Ni c
once
ntra
tion
in u
g/l
Figure 8 Metal concentrations in LS 10 eluates from MSWI bottom ash
Science Report Testing of residues from incineration of municipal solid waste38
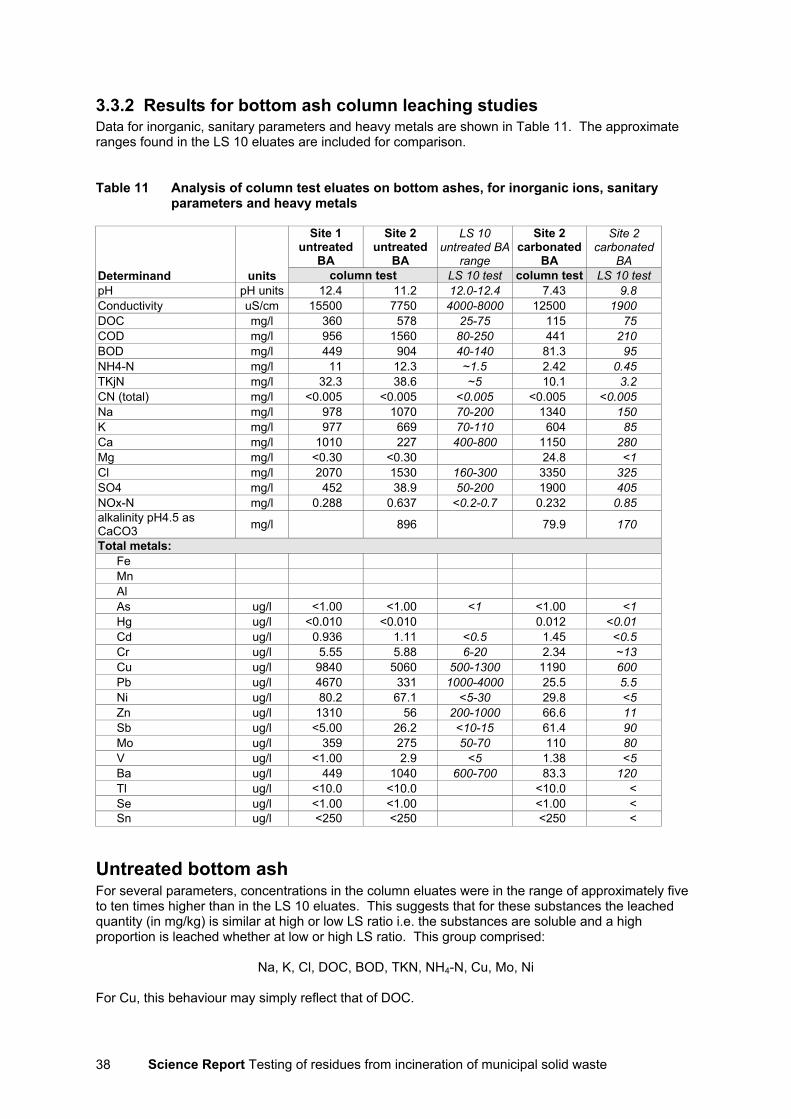
3.3.2 Results for bottom ash column leaching studiesData for inorganic, sanitary parameters and heavy metals are shown in Table 11. The approximateranges found in the LS 10 eluates are included for comparison.
Table 11 Analysis of column test eluates on bottom ashes, for inorganic ions, sanitaryparameters and heavy metals
Site 1untreated
BA
Site 2untreated
BA
LS 10untreated BA
range
Site 2carbonated
BA
Site 2carbonated
BADeterminand units column test LS 10 test column test LS 10 testpH pH units 12.4 11.2 12.0-12.4 7.43 9.8Conductivity uS/cm 15500 7750 4000-8000 12500 1900DOC mg/l 360 578 25-75 115 75COD mg/l 956 1560 80-250 441 210BOD mg/l 449 904 40-140 81.3 95NH4-N mg/l 11 12.3 ~1.5 2.42 0.45TKjN mg/l 32.3 38.6 ~5 10.1 3.2CN (total) mg/l <0.005 <0.005 <0.005 <0.005 <0.005Na mg/l 978 1070 70-200 1340 150K mg/l 977 669 70-110 604 85Ca mg/l 1010 227 400-800 1150 280Mg mg/l <0.30 <0.30 24.8 <1Cl mg/l 2070 1530 160-300 3350 325SO4 mg/l 452 38.9 50-200 1900 405NOx-N mg/l 0.288 0.637 <0.2-0.7 0.232 0.85alkalinity pH4.5 asCaCO3 mg/l 896 79.9 170
Total metals:FeMnAlAs ug/l <1.00 <1.00 <1 <1.00 <1Hg ug/l <0.010 <0.010 0.012 <0.01Cd ug/l 0.936 1.11 <0.5 1.45 <0.5Cr ug/l 5.55 5.88 6-20 2.34 ~13Cu ug/l 9840 5060 500-1300 1190 600Pb ug/l 4670 331 1000-4000 25.5 5.5Ni ug/l 80.2 67.1 <5-30 29.8 <5Zn ug/l 1310 56 200-1000 66.6 11Sb ug/l <5.00 26.2 <10-15 61.4 90Mo ug/l 359 275 50-70 110 80V ug/l <1.00 2.9 <5 1.38 <5Ba ug/l 449 1040 600-700 83.3 120Tl ug/l <10.0 <10.0 <10.0 <Se ug/l <1.00 <1.00 <1.00 <Sn ug/l <250 <250 <250 <
Untreated bottom ashFor several parameters, concentrations in the column eluates were in the range of approximately fiveto ten times higher than in the LS 10 eluates. This suggests that for these substances the leachedquantity (in mg/kg) is similar at high or low LS ratio i.e. the substances are soluble and a highproportion is leached whether at low or high LS ratio. This group comprised:
Na, K, Cl, DOC, BOD, TKN, NH4-N, Cu, Mo, Ni
For Cu, this behaviour may simply reflect that of DOC.
Science Report Testing of residues from incineration of municipal solid waste 39
For other parameters, concentrations in the column eluates were similar to those at LS 10. Thisindicates that their concentrations are equilibrium-controlled.
For Pb and Zn, concentrations are strongly pH-dependent but in the column eluates were similar tothose at LS 10 for similar pH values.
Carbonated bottom ashThe pH value from carbonated BA was only 7.43. This is not only much lower than in the LS 10leachate, but also lower than would be expected from complete carbonation. It raises the question asto whether some additional buffering process developed in the carbonated material during the columntest. Other inconsistencies in behaviour are also apparent, some of which may be related to the lowerpH:
• DOC, COD, BOD, NH4-N and TKN were all much lower than in the eluate from the untreatedSite 2 BA, whereas at LS 10 there had been only a slight difference between untreated andcarbonated wastes.
• Ca, SO4 and Mg concentrations were considerably higher from the carbonated column than fromthe untreated waste. At LS 10, carbonation had reduced leaching of Ca and only slightlyincreased leaching of SO4.
3.3.3 Leaching of trace organics from bottom ashResults for dioxins from the LS 10 tests are shown in Appendix I. Only a single congener wasdetected and only from one sample: Site 1 leached octachlorodibenzodioxin (OCDD) at 12.2 pg/l fromthe untreated ash and 7.2 pg/l from the carbonated ash. The congener OCDD had been detected at105 ng/kg in the solid carbonated BA from Site 1, but was not detected in untreated waste. No otherdioxin or furan was detected in any other sample. None were detected in any of the column eluatesfrom bottom ash, untreated or carbonated.
Results from the List 1 screening method are shown in Appendices J (LS 10 aqueous eluates), K (LS10 acid eluates) and L (column test eluates). Summary information is shown in Table 12. Keyobservations are:
• Fewer compounds were detected in the eluates than in the solid materials.
• Generally, the eluates contained between 5 and 20 compounds, at concentrations between 5 and50 µg/l each.
• The type of compounds detected were also quite different: in the eluates the substances werepredominantly aliphatic (C4 to C12) and aromatic carboxy acids, ketones, aldehydes and alcoholsand esters.
• With one exception, no List 1 compounds were detected and no halogenated compounds.
• The exception was the occurrence of benzene at a high concentration in the LS 10 eluates fromSite 3. It was present at a similar concentration (3–4 mg/l) from both the untreated andcarbonated material. However, it was not detected in the acid eluate. Site 3 had the greatestnumber and highest concentrations extractable from the solid bottom ash. However, benzenehad not been one of the compounds detected.
• Carbonation had no noticeable effect on the number, type or concentration of substancesdetected in the eluates.
• The acid-treated eluates generally had slightly lower concentrations than the untreated wasteeluates, but similar numbers and types of compounds detected.
• The number, type and concentrations of substances in the column test eluates was similar tothose in the LS 10 eluates. This suggests that the concentrations are equilibrium controlled.
Science Report Testing of residues from incineration of municipal solid waste40
Table 12 Summary of trace organic screening test results on eluates from bottom ash
Eluates (µg/l) Leachable (mg/kg)No. ofcompounds
detected typical maximum typical maximumLS 10 eluates
1. Untreated BA1 6 10–100 233 <1 2.3
BA2 11 5–50 44 <0.5 0.4
BA3 4 50–200 3,528* <2 35*
2. Carbonated BA1 12 20–100 234 <1 2.3
BA2 11 20–100 230 <1 2.3
BA3 24 20–100 4,182* <2 42*
3. Acid-treated BA1 6 4–6 26 <0.1 0.2
BA2 18 4–20 48 <0.1 0.5
BA3 12 2–10 52 <0.1 0.5
Column test
Untreated BA1 9 5–50 700 - -
Untreated BA2 25 5–50 800 - -
Carbonated BA2 8 5–50 156 - -*benzene
3.4 Results of leaching tests on APC residuesAll analytical results are included in Appendices H to L as follows:
Appendix H: major ions, sanitary parameters and heavy metalsAppendix I: dioxins and furansAppendix J: trace organics in aqueous eluatesAppendix K: trace organics in acid leaching test eluatesAppendix L: trace organics in column leaching test eluates.
3.4.1 Results for APC residue at LS 10: conventional parametersEluate concentrations for Cl, SO4, Ca, BOD, COD, DOC, pH, NH4-N and TKN are shown as barcharts in Figures 10 to 12. The charts allow direct comparison between replicates, betweentreatments (untreated, carbonated, and acid-neutralised) and between sites. Eluate concentrations ofheavy metals are shown in Figure 13, graphed against pH value. Note that Figures 10 to 13 showconcentrations in the LS 10 eluates rather than quantity leached per unit weight of ash. This formathas been used because the focus of this study is leachate quality rather than characterisation of thewastes.
Science Report Testing of residues from incineration of municipal solid waste 41
key:
Chloride
0
5000
10000
15000
20000
25000
APC1 APC2 APC3
conc
entr
atio
n in
mg/
l
Sulphate as SO4
0
500
1000
1500
2000
APC1 APC2 APC3
conc
entr
atio
n in
mg/
l
Calcium
0
5000
10000
15000
20000
25000
APC1 APC2 APC3
conc
entr
atio
n in
mg/
l
Figure 10 Concentrations in LS 10 eluates from MSWI APC residue replicates(1 of 3)
Science Report Testing of residues from incineration of municipal solid waste42
key:
BOD
0
10
20
30
40
50
APC1 APC2 APC3
conc
entr
atio
n in
mg/
l
nodata
COD
0
30
60
90
120
150
APC1 APC2 APC3
conc
entr
atio
n in
mg/
l
DOC
0
10
20
30
40
50
APC1 APC2 APC3
conc
entr
atio
n in
mg/
l
all<
all<
all<
all<
all<
all<
all< 25
all< 25
all< 25
all< 25
all< 25
all< 4
all< 4
all< 2
Figure 11 Concentrations in LS 10 eluates from MSWI APC residue replicates(2 of 3)
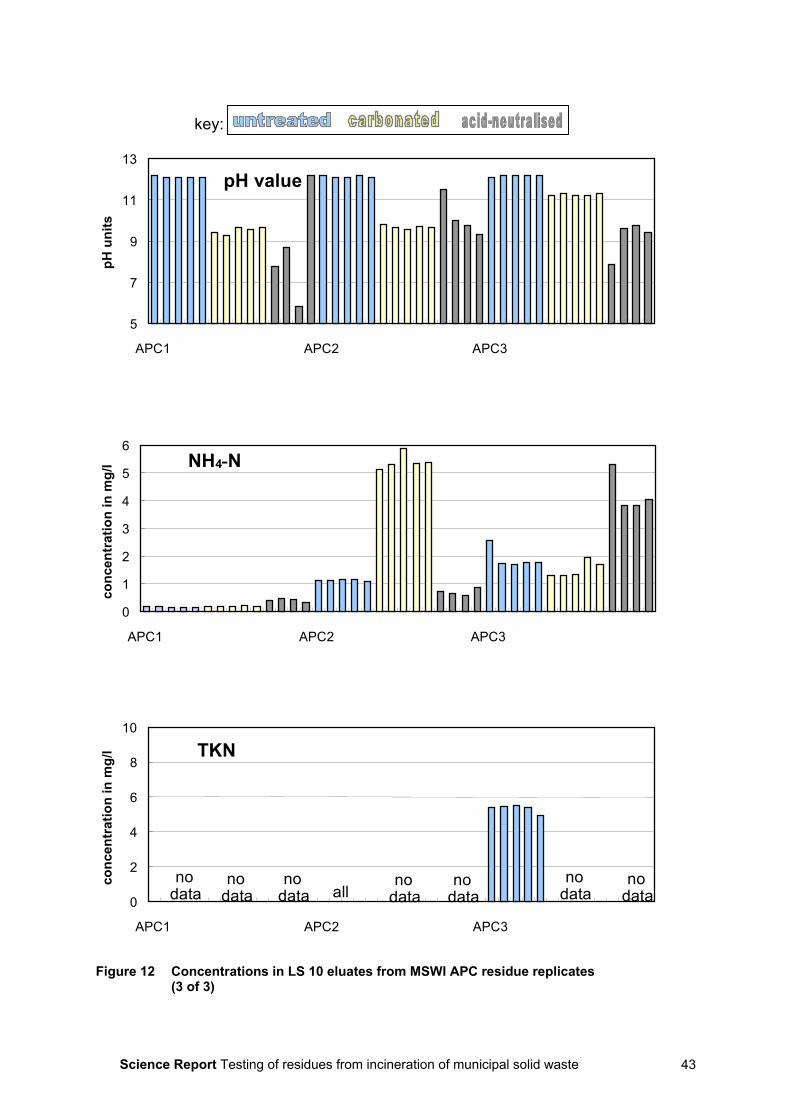
Science Report Testing of residues from incineration of municipal solid waste 43
key:
pH value
5
7
9
11
13
APC1 APC2 APC3
pH u
nits
NH4-N
0
1
2
3
4
5
6
APC1 APC2 APC3
conc
entr
atio
n in
mg/
l
TKN
0
2
4
6
8
10
APC1 APC2 APC3
conc
entr
atio
n in
mg/
l
nodata
nodata
nodata
nodata
nodata
nodata
nodataall
Figure 12 Concentrations in LS 10 eluates from MSWI APC residue replicates(3 of 3)
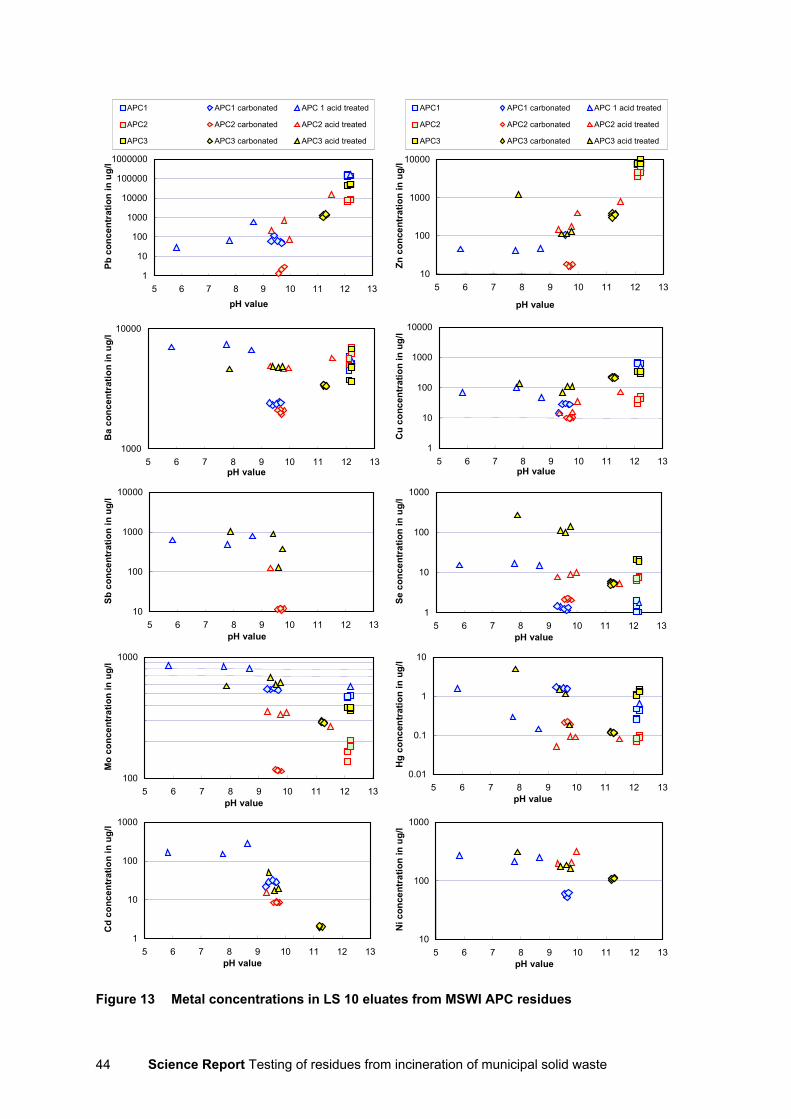
Science Report Testing of residues from incineration of municipal solid waste44
1
10
100
1000
10000
100000
1000000
5 6 7 8 9 10 11 12 13pH value
Pb c
once
ntra
tion
in u
g/l
APC1 APC1 carbonated APC 1 acid treated
APC2 APC2 carbonated APC2 acid treated
APC3 APC3 carbonated APC3 acid treated
10
100
1000
10000
5 6 7 8 9 10 11 12 13
pH value
Zn c
once
ntra
tion
in u
g/l
APC1 APC1 carbonated APC 1 acid treated
APC2 APC2 carbonated APC2 acid treated
APC3 APC3 carbonated APC3 acid treated
1000
10000
5 6 7 8 9 10 11 12 13pH value
Ba
conc
entr
atio
n in
ug/
l
1
10
100
1000
10000
5 6 7 8 9 10 11 12 13pH value
Cu
conc
entr
atio
n in
ug/
l
10
100
1000
10000
5 6 7 8 9 10 11 12 13pH value
Sb c
once
ntra
tion
in u
g/l
1
10
100
1000
5 6 7 8 9 10 11 12 13pH value
Se c
once
ntra
tion
in u
g/l
100
1000
5 6 7 8 9 10 11 12 13pH value
Mo
conc
entr
atio
n in
ug/
l
1
10
100
1000
5 6 7 8 9 10 11 12 13pH value
Cd
conc
entr
atio
n in
ug/
l
10
100
1000
5 6 7 8 9 10 11 12 13pH value
Ni c
once
ntra
tion
in u
g/l
0.01
0.1
1
10
5 6 7 8 9 10 11 12 13pH value
Hg
conc
entr
atio
n in
ug/
l
Figure 13 Metal concentrations in LS 10 eluates from MSWI APC residues
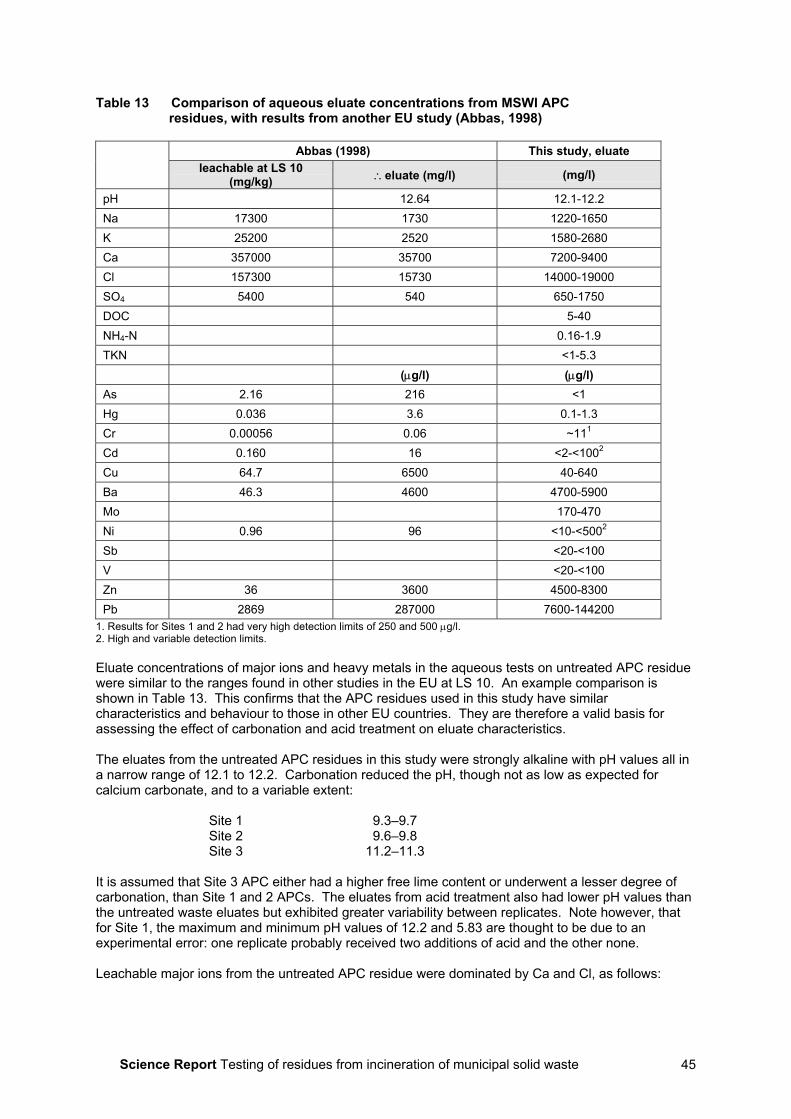
Science Report Testing of residues from incineration of municipal solid waste 45
Table 13 Comparison of aqueous eluate concentrations from MSWI APCresidues, with results from another EU study (Abbas, 1998)
Abbas (1998) This study, eluateleachable at LS 10
(mg/kg) ∴eluate (mg/l) (mg/l)
pH 12.64 12.1-12.2Na 17300 1730 1220-1650K 25200 2520 1580-2680Ca 357000 35700 7200-9400Cl 157300 15730 14000-19000SO4 5400 540 650-1750DOC 5-40NH4-N 0.16-1.9TKN <1-5.3
(µg/l) (µg/l)As 2.16 216 <1Hg 0.036 3.6 0.1-1.3Cr 0.00056 0.06 ~111
Cd 0.160 16 <2-<1002
Cu 64.7 6500 40-640Ba 46.3 4600 4700-5900Mo 170-470Ni 0.96 96 <10-<5002
Sb <20-<100V <20-<100Zn 36 3600 4500-8300Pb 2869 287000 7600-144200
1. Results for Sites 1 and 2 had very high detection limits of 250 and 500 µg/l.2. High and variable detection limits.
Eluate concentrations of major ions and heavy metals in the aqueous tests on untreated APC residuewere similar to the ranges found in other studies in the EU at LS 10. An example comparison isshown in Table 13. This confirms that the APC residues used in this study have similarcharacteristics and behaviour to those in other EU countries. They are therefore a valid basis forassessing the effect of carbonation and acid treatment on eluate characteristics.
The eluates from the untreated APC residues in this study were strongly alkaline with pH values all ina narrow range of 12.1 to 12.2. Carbonation reduced the pH, though not as low as expected forcalcium carbonate, and to a variable extent:
Site 1 9.3–9.7Site 2 9.6–9.8Site 3 11.2–11.3
It is assumed that Site 3 APC either had a higher free lime content or underwent a lesser degree ofcarbonation, than Site 1 and 2 APCs. The eluates from acid treatment also had lower pH values thanthe untreated waste eluates but exhibited greater variability between replicates. Note however, thatfor Site 1, the maximum and minimum pH values of 12.2 and 5.83 are thought to be due to anexperimental error: one replicate probably received two additions of acid and the other none.
Leachable major ions from the untreated APC residue were dominated by Ca and Cl, as follows:
Science Report Testing of residues from incineration of municipal solid waste46
cations: Ca >> K >Namg/l ~8,000 ~2,000 ~1,500anions: Cl > SO4 > OH*
mg/l ~17,000 ~1,000 ~200* OH calculated from pH value.
Carbonation had little effect on the major ion concentrations (see Figure 10). Acid treatment resultedin greatly increased concentrations of Ca, and a slight increase in SO4, as follows (in mg/l):
APC1 APC2 APC3Ca ~18,100 23,200 22,300SO4 1,384 1,154 1,217
It is assumed that most of the additional Ca was released from the neutralisation of lime by nitric acid.
The quantities of 2M HNO3 added (see Appendix D for full details) should have led to TONconcentrations of ~8,000 to ~12,000 mg/l. The reported concentrations of TON were very low, mostlyat mg/l or tens of mg/l levels. These are considered to be erroneous. The possibility of somechemical reduction of NO3 cannot be ruled out, as a partial explanation of the low TON results: areaction of NO3 with Al or Zn in alkaline solution is known to exist, which generates ammonia.(However, no significant elevation in NH4-N was observed.) The possibility of reduction to nitrogengas by nascent hydrogen also exists. However, examination of ion balances on the results shows alarge deficit of anions. This deficit is of a similar magnitude to the TON concentrations expected fromthe amounts of acid added.
DOC was one of a small number of parameters that showed large differences between the sites(others being reduced nitrogen species, Pb and Cu). Averaged concentrations of DOC in eluatesfrom the untreated, carbonated and acid treated wastes were (in mg/l):
APC1 APC2 APC3untreated 5 41 11carbonated <4 ≤2 4.6acid treated <4 7.5 6.8
The DOC was in general much lower than from bottom ash, as might be expected from the nature ofthe source. Only a limited number of BOD results were above the detection limit. These indicatedBOD/COD ratios of ~0.22 in the eluates from untreated APC residue. This is lower than for thebottom ash and indicates that the DOC may be less readily degradable. In contrast to bottom ash,both treatments led to a decrease in leaching of DOC.Concentrations of eluate NH4-N were low and variable. They showed no clear relationship betweensites or response to treatment:
APC1 APC2 APC3untreated 0.16 1.12 1.9carbonated 0.19 5.4 1.5acid treated 0.41 0.71 4.2
TKN analyses were not reported for most of the APC eluates. The tentative inference from the twosets of results obtained (Sites 2 and 3, untreated waste eluates) were that organic nitrogenconcentrations were very low, around 1–3 mg/l.
The heavy metals present at the highest concentrations in eluates from the untreated APC residueswere, in decreasing order:
Pb > Zn ≈ Ba > Mo ~ Cu > Se
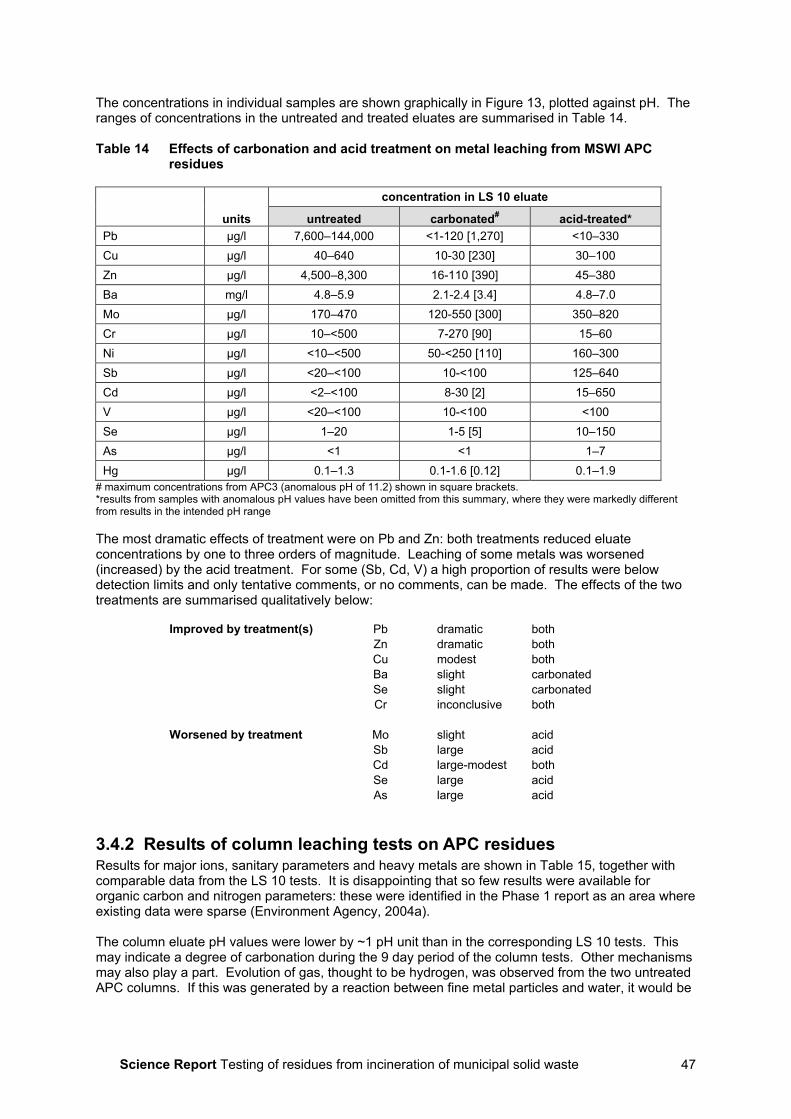
Science Report Testing of residues from incineration of municipal solid waste 47
The concentrations in individual samples are shown graphically in Figure 13, plotted against pH. Theranges of concentrations in the untreated and treated eluates are summarised in Table 14.
Table 14 Effects of carbonation and acid treatment on metal leaching from MSWI APCresidues
concentration in LS 10 eluate
units untreated carbonated# acid-treated*Pb µg/l 7,600–144,000 <1-120 [1,270] <10–330Cu µg/l 40–640 10-30 [230] 30–100Zn µg/l 4,500–8,300 16-110 [390] 45–380Ba mg/l 4.8–5.9 2.1-2.4 [3.4] 4.8–7.0Mo µg/l 170–470 120-550 [300] 350–820Cr µg/l 10–<500 7-270 [90] 15–60Ni µg/l <10–<500 50-<250 [110] 160–300Sb µg/l <20–<100 10-<100 125–640Cd µg/l <2–<100 8-30 [2] 15–650V µg/l <20–<100 10-<100 <100Se µg/l 1–20 1-5 [5] 10–150As µg/l <1 <1 1–7Hg µg/l 0.1–1.3 0.1-1.6 [0.12] 0.1–1.9
# maximum concentrations from APC3 (anomalous pH of 11.2) shown in square brackets.*results from samples with anomalous pH values have been omitted from this summary, where they were markedly differentfrom results in the intended pH range
The most dramatic effects of treatment were on Pb and Zn: both treatments reduced eluateconcentrations by one to three orders of magnitude. Leaching of some metals was worsened(increased) by the acid treatment. For some (Sb, Cd, V) a high proportion of results were belowdetection limits and only tentative comments, or no comments, can be made. The effects of the twotreatments are summarised qualitatively below:
Improved by treatment(s) Pb dramatic bothZn dramatic bothCu modest bothBa slight carbonatedSe slight carbonatedCr inconclusive both
Worsened by treatment Mo slight acidSb large acidCd large-modest bothSe large acidAs large acid
3.4.2 Results of column leaching tests on APC residuesResults for major ions, sanitary parameters and heavy metals are shown in Table 15, together withcomparable data from the LS 10 tests. It is disappointing that so few results were available fororganic carbon and nitrogen parameters: these were identified in the Phase 1 report as an area whereexisting data were sparse (Environment Agency, 2004a).
The column eluate pH values were lower by ~1 pH unit than in the corresponding LS 10 tests. Thismay indicate a degree of carbonation during the 9 day period of the column tests. Other mechanismsmay also play a part. Evolution of gas, thought to be hydrogen, was observed from the two untreatedAPC columns. If this was generated by a reaction between fine metal particles and water, it would be
Science Report Testing of residues from incineration of municipal solid waste48
expected, if anything, to cause a rise in pH, due to the formation of metal hydroxides. No evolution ofgas was observed from the carbonated APC residue.
For most parameters, concentrations in the eluate from the untreated APC2 column were lower thanfrom untreated APC 1. For Ca, Zn and Se the difference was an order of magnitude or more, which isa much greater difference than occurred in the LS 10 tests.
There is no obvious explanation for these anomalies, particularly as results for some majorcomponents were reasonably close (e.g. Na, Cl, Ba, Pb). For NH4-N, the APC2 eluate had a muchhigher concentration than APC1, exactly matching their behaviour at LS 10.
The relationship between the column test and LS 10 eluate results has many similarities and someimportant differences compared with the bottom ash tests.
For the following parameters, concentrations in the column eluates were five to ten times higher thanat LS 10:
Na, K, Cl, NH4-N, (Ca)
For Ca this applied to APC1 but not APC2, whose Ca concentration was actually lower than at LS 10.There are insufficient data for DOC, BOD, COD and TKN, but the limited information availablesuggests they may not have been significantly higher than in the LS 10 leachates. This is in contrastwith the behaviour of bottom ash. Another contrast was the metals Cu, Mo and Ni. For these andmost other components, concentrations in the column eluates were similar to those in the LS 10eluates. This suggests that their concentrations were largely controlled by chemical equilibria ratherthan availability.
The absence of confirmed values for Cd in most of the eluates in this study is unfortunate: in thePhase 1 study, leachates from full-scale APC landfills typically had several tens to several hundredsof µg/l of Cd. The highest concentration in this study was 922 µg/l from the column test oncarbonated APC1. This is comparable with field data and may be due to the lower pH (8.75) in thiseluate. Nevertheless, the difference between this and 28 µg/l at pH 9.5 in the LS 10 eluates suggestseither a very steep pH-solubility curve in this pH region or an additional mechanism affectingsolubility.
Comparison of the column test results for APC1 before and after carbonation shows it had little effecton major ions and some metals (Mo, Se, Ba) but led to massive reductions in Pb and Zn, and asmaller reduction in Cu. This was also observed in the LS 10 tests.
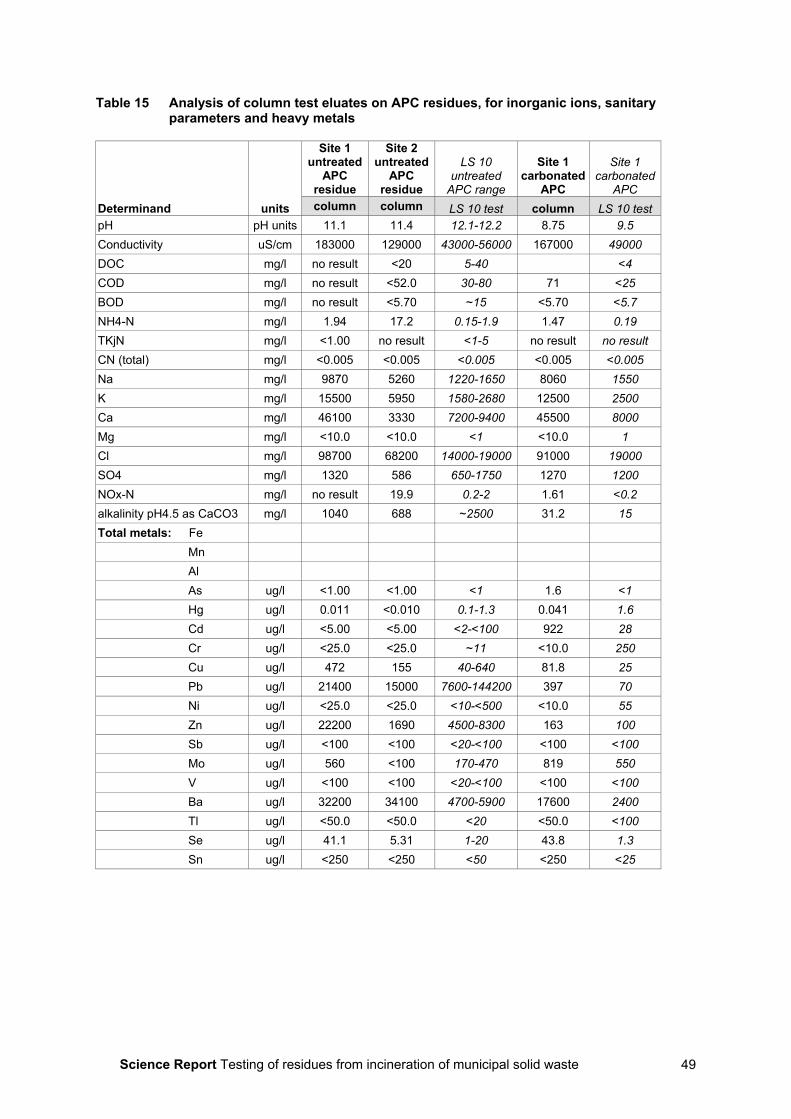
Science Report Testing of residues from incineration of municipal solid waste 49
Table 15 Analysis of column test eluates on APC residues, for inorganic ions, sanitaryparameters and heavy metals
Site 1untreated
APCresidue
Site 2untreated
APCresidue
LS 10untreated
APC range
Site 1carbonated
APC
Site 1carbonated
APCDeterminand units column column LS 10 test column LS 10 testpH pH units 11.1 11.4 12.1-12.2 8.75 9.5Conductivity uS/cm 183000 129000 43000-56000 167000 49000DOC mg/l no result <20 5-40 <4COD mg/l no result <52.0 30-80 71 <25BOD mg/l no result <5.70 ~15 <5.70 <5.7NH4-N mg/l 1.94 17.2 0.15-1.9 1.47 0.19TKjN mg/l <1.00 no result <1-5 no result no resultCN (total) mg/l <0.005 <0.005 <0.005 <0.005 <0.005Na mg/l 9870 5260 1220-1650 8060 1550K mg/l 15500 5950 1580-2680 12500 2500Ca mg/l 46100 3330 7200-9400 45500 8000Mg mg/l <10.0 <10.0 <1 <10.0 1Cl mg/l 98700 68200 14000-19000 91000 19000SO4 mg/l 1320 586 650-1750 1270 1200NOx-N mg/l no result 19.9 0.2-2 1.61 <0.2alkalinity pH4.5 as CaCO3 mg/l 1040 688 ~2500 31.2 15Total metals: Fe
MnAlAs ug/l <1.00 <1.00 <1 1.6 <1Hg ug/l 0.011 <0.010 0.1-1.3 0.041 1.6Cd ug/l <5.00 <5.00 <2-<100 922 28Cr ug/l <25.0 <25.0 ~11 <10.0 250Cu ug/l 472 155 40-640 81.8 25Pb ug/l 21400 15000 7600-144200 397 70Ni ug/l <25.0 <25.0 <10-<500 <10.0 55Zn ug/l 22200 1690 4500-8300 163 100Sb ug/l <100 <100 <20-<100 <100 <100Mo ug/l 560 <100 170-470 819 550V ug/l <100 <100 <20-<100 <100 <100Ba ug/l 32200 34100 4700-5900 17600 2400Tl ug/l <50.0 <50.0 <20 <50.0 <100Se ug/l 41.1 5.31 1-20 43.8 1.3Sn ug/l <250 <250 <50 <250 <25
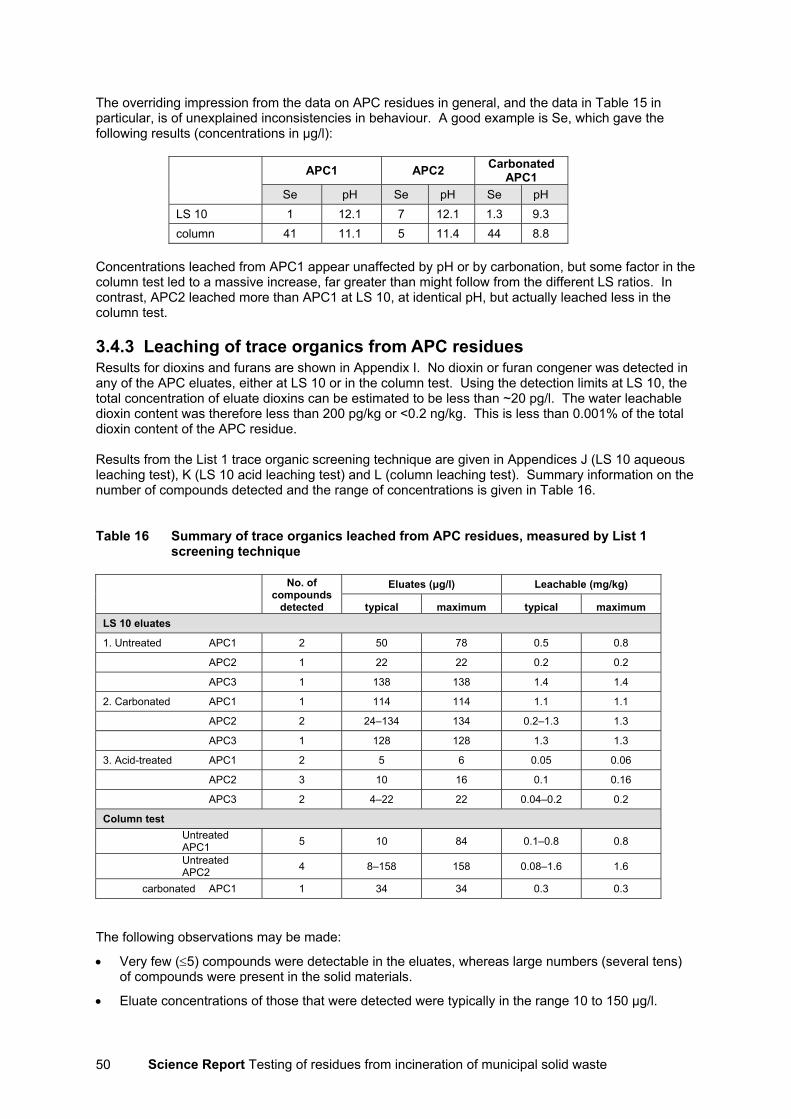
Science Report Testing of residues from incineration of municipal solid waste50
The overriding impression from the data on APC residues in general, and the data in Table 15 inparticular, is of unexplained inconsistencies in behaviour. A good example is Se, which gave thefollowing results (concentrations in µg/l):
APC1 APC2 CarbonatedAPC1
Se pH Se pH Se pHLS 10 1 12.1 7 12.1 1.3 9.3column 41 11.1 5 11.4 44 8.8
Concentrations leached from APC1 appear unaffected by pH or by carbonation, but some factor in thecolumn test led to a massive increase, far greater than might follow from the different LS ratios. Incontrast, APC2 leached more than APC1 at LS 10, at identical pH, but actually leached less in thecolumn test.
3.4.3 Leaching of trace organics from APC residuesResults for dioxins and furans are shown in Appendix I. No dioxin or furan congener was detected inany of the APC eluates, either at LS 10 or in the column test. Using the detection limits at LS 10, thetotal concentration of eluate dioxins can be estimated to be less than ~20 pg/l. The water leachabledioxin content was therefore less than 200 pg/kg or <0.2 ng/kg. This is less than 0.001% of the totaldioxin content of the APC residue.
Results from the List 1 trace organic screening technique are given in Appendices J (LS 10 aqueousleaching test), K (LS 10 acid leaching test) and L (column leaching test). Summary information on thenumber of compounds detected and the range of concentrations is given in Table 16.
Table 16 Summary of trace organics leached from APC residues, measured by List 1screening technique
Eluates (µg/l) Leachable (mg/kg)No. ofcompounds
detected typical maximum typical maximumLS 10 eluates
1. Untreated APC1 2 50 78 0.5 0.8
APC2 1 22 22 0.2 0.2
APC3 1 138 138 1.4 1.4
2. Carbonated APC1 1 114 114 1.1 1.1
APC2 2 24–134 134 0.2–1.3 1.3
APC3 1 128 128 1.3 1.3
3. Acid-treated APC1 2 5 6 0.05 0.06
APC2 3 10 16 0.1 0.16
APC3 2 4–22 22 0.04–0.2 0.2
Column testUntreatedAPC1 5 10 84 0.1–0.8 0.8
UntreatedAPC2 4 8–158 158 0.08–1.6 1.6
carbonated APC1 1 34 34 0.3 0.3
The following observations may be made:
• Very few (≤5) compounds were detectable in the eluates, whereas large numbers (several tens)of compounds were present in the solid materials.
• Eluate concentrations of those that were detected were typically in the range 10 to 150 µg/l.
Science Report Testing of residues from incineration of municipal solid waste 51
• The type of compounds leached were completely different from those found in the solids.Substances in the eluates were mainly C5–C8 ketones, alcohols and esters, all aliphatic. Thescreening technique detected no halogenated compounds, PAH, or BTEX compounds. None ofthe substances detected was a List 1 substance.
• Carbonation made no appreciable difference to the eluate concentrations but the eluate from acidtreatment had, overall, ~80% lower concentrations. This may indicate that the substances elutedwere solubilised at high pH. However, this would not be expected for most of the chemical typesthat were detected.
• The column test eluates contained more compounds (except for the carbonated sample) but thenumber was still small.
• Concentrations in the column test eluates were similar to those in the LS 10 eluates. This mayimply substances that are controlled by chemical equilibria rather than availability.
Science Report Testing of residues from incineration of municipal solid waste52
4 Discussion4.1 Suitability of the data obtainedThe solids composition and aqueous LS 10 eluates from the wastes used in this study werecomparable with data from other MSWI plants, both in the UK and other parts of the EU. Thesamples therefore form a suitable basis for assessing source term values, for considering the releaseof trace organics and for assessing the effects of treatment. Full achievement of these objectives washampered by several factors:
• Difficulty in hitting the chosen target pH value with the acid treatment; values ranged over ~2 pHunits and were generally higher than the intended 8.3.
• Missing results for some samples especially BOD, TKN and DOC for the APC residues andespecially in the column tests.
• High and variable detection limits for some parameters, such as COD, DOC, BOD, TKN andsome of the heavy metals. Cd was a notable example.
• Anomalous results for some parameters, such as low TON results on APC residues, and highTKN results on acid-treated bottom ash that were inconsistent with the DOC concentrations.
• Large differences between the sites, for certain parameters. An example was the solvent-extractable trace organics in bottom ash, and the occurrence of exceptionally high benzeneconcentrations in aqueous eluate from Site 3 bottom ash, but not in the other two sites.
• Inconsistency of the relationship between LS 10 data, column data (~LS 1) and field data from thePhase 1 study. These inconsistencies were particularly apparent for Se, Cd, TKN, pH, Ca andSO4, but also applied to a degree to several other parameters.
4.2 The release of trace organics4.2.1 Bottom ashDespite the presence of numerous halogenated compounds, BTEX PAH, phenols, etc. in the solidmaterials, virtually no List 1 trace organics leached from the bottom ash, with the following twoexceptions.
A single dioxin congener, OCDD, was recorded in the LS 10 eluate from Site 1 BA, at a very lowconcentration: 12.2 pg/l from the untreated ash and 7.2 pg/l from the carbonated ash. None werefound in the column test eluates or the LS 10 acid eluates. The WHO TEQ factor for OCDD is0.0001, so the concentration as TEQ is insignificant. Although 24 hour LS 10 leach tests are notregarded as suitable for organics, the 9 day duration of the column tests gives added confidence thatthe dioxins strongly partition to the solid phase.
Benzene was recorded in the LS 10 eluates from Site 3 BA at levels of ~4 mg/l. This was an order ofmagnitude greater than for any other trace organic component. Although Site 3 BA had far highersolvent-extractable trace organics than the other two sites, benzene was not identified in the solventextracts. The results cannot be dismissed lightly because it was recorded in the eluates from bothuntreated ash and carbonated ash. The source term values for bottom ash List 1 organics cannottherefore be established, or assumed to be ‘absent’ until further data is compiled.
The bottom ash eluates contained 500–1,000 µg/l of other identified trace organics. These weremainly aliphatic (C4 to C12) and aromatic acids, aldehydes, ketones, alcohols and esters. None ofthese were halogenated compounds. This is a completely different chemical profile to the compoundsextracted from the solids using dichloromethane. Individual compounds were typically present at 50to 100 µg/l and included bisphenol A at two of the three sites: while not a List 1 substance, this hasrecently been added to the UK’s Pollution Inventory reporting list for discharges to water.
Science Report Testing of residues from incineration of municipal solid waste 53
The identified trace organics constituted only a small percentage of the DOC. This reached severalhundred mg/l, and was almost doubled by acid treatment. The nature of >99% of the DOC isunknown. It has a high BOD/COD ratio, indicating that much of it would be readily degradable. It isalso strongly correlated with leachable Cu concentrations, indicating that a portion of it has strongmetal complexing capacity. The proportion of DOC with strong ligand properties, and itsdegradability, are unknown, although van Zomeren and Comans (2002) demonstrate around 20% ofDOC as fulvic acid in fresh bottom ash, declining on weathering as pH decreases. The remainingDOC is made up of a small proportion of humic acids and around 80% as undifferentiated hydrophilicorganic carbon faction (op. cit., 2002). Also unknown is the impact on the nature of the DOC, ofprolonged storage in a landfill, where anaerobic biological activity may sometimes develop.
The Phase 1 study identified uncertainty over the concentration of organic nitrogen compounds inbottom ash leachates. The analytical data from the present study indicate perhaps 20 mg/l of organicN in leachate from untreated and carbonated BA. This would be approximately 4% of the DOC, whichis slightly lower than the nitrogen proportion in the hard COD in conventional MSW leachates. Thedata from the acid treated bottom ash indicated a massive increase in leaching of organic nitrogen, toreach a C:N ratio of as little as 2:1 or less. It is very hard to envisage what compounds could bepresent that would have such a low C:N ratio and analytical error is suspected.
4.2.2 APC residuesThe dioxin content of the APC residues was much higher than in the bottom ash and was comparablewith previous UK studies, at ~1,000–2,000 ngTEQ/kg. Despite this, no dioxin was detected in any ofthe eluates from any of the samples, either at LS 10 or from the column tests. This indicates that thedioxins in APC residues also strongly partition to the solid phase.
The trace organics identified with the List 1 screening technique were present at lower concentrationsin the APC residue than in bottom ash, but were similar in their chemical nature, i.e. halogenatedaliphatics and aromatics, BTEX, PAH. However, no List 1 compounds were identified in the eluatesfrom any of the APC samples, either at LS 10 or from the column leachates. The compoundsidentified in the eluates were fewer in number and at lower concentrations than from the bottom ash.Leachable concentrations were up to ~150 µg/l, comprising not more than five components in any onesample. The substances were mainly C5–C8 aliphatic ketones, alcohols and esters. This is anarrower range of substances than in the bottom ash eluates but falls within the same broad chemicalgroups. Like the bottom ash, it is a completely different group of compounds than those identified inthe dichloromethane extracts of the solid waste.
Concentrations of DOC in the APC eluates were much lower than in those from bottom ash, by morethan an order of magnitude, but the DOC also remains largely uncharacterised. There wereinsufficient results for BOD and COD to give any firm information on its degradability, though itappears likely to have a lower BOD/COD ratio than the DOC from bottom ash. TKN data were alsoincomplete. The organic nitrogen concentration appeared to be low (~1 mg/l) but, given the lowerDOC (~20 mg/l) could have been a similar percentage of DOC to that in the bottom ash eluates. Incontrast to the bottom ash, acid treatment did not increase the leaching of either DOC or organicnitrogen from the APC residues.
Cu concentrations in the APC eluates did not show any clear correlation with DOC. This suggeststhat the strong ligands leachable from bottom ash are not present (or at least not leachable) in theAPC residues.
Science Report Testing of residues from incineration of municipal solid waste54
4.3 Effect of the two treatments on leachate qualityAcid treatment led to large increases in eluate concentrations of TON (nitric acid used), Ca,conductivity and TDS in both types of waste. Acid treatment and carbonation led to some increase inSO4 leaching from bottom ash, but not from APC residues. Carbonation led to a slight increase in Caleaching from bottom ash, but not from APC residue. There were no other significant impacts onleaching of major ions.
Sanitary parameters were only slightly affected by carbonation – APC residues exhibited somedecrease in leaching of organic indicators – whereas acid treatment led to greatly increased leachingof DOC and organic nitrogen from bottom ash, as discussed above.
The main impact of both treatments was on pH and the leaching of metals. The effects on metalswere not necessarily due entirely to the reduction in pH that resulted from the treatments:
• As expected, both treatments reduced the eluate pH values but not to the same extent.
• The treatments had a strong beneficial effect on most of the heavy metals that were leachable atthe highest concentrations from the untreated waste, namely:
Pb, Zn, Ba from bottom ash
Pb, Zn, Cu from APC residue
• The most obvious exceptions to these generally beneficial effects were:
- Cu, leachable at high concentration from bottom ash, and controlled by organic complexation,which was worsened by acid treatment;
- Mo, leachable at moderate concentration from both materials, was generally slightly worsenedby both treatments;
- acid treatment worsened the leaching of trace concentrations of Sb, Se, As and V;
- carbonation worsened the leaching of trace concentrations of Cr, Sb and V from bottom ash;
- Ba, leachable at high concentration from APC residue, was unaffected by acid treatment andslightly reduced by carbonation.
- Cd, leachable from APC residues at higher concentrations after both treatments.
One significant advantage of carbonation over acid neutralisation is the reduction in pH without loss ofbuffering capacity due to precipitation of calcite (Astrup et al., 2001).
4.3.1 Impact of treatment on achieving Waste Acceptance CriteriaFrom this study it is inferred that the untreated APC residues would fail to meet acceptance criteria forhazardous waste landfill for Pb and Cl. Carbonation alone will bring leachable Pb concentrations forAPC residues to well below acceptance criteria for stable, non-reactive hazardous waste. However, itis interesting to note that Sb may not comply with acceptance criteria for stable, non-reactivehazardous waste. This effect is even more pronounced for acid neutralisation where Sb exceeds thislimit, and for some APC replicates exceeds the criteria for hazardous waste. The data for Cd areinconclusive, but indicate that any treatment method that results in a pH reduction may increase itsmobility.
Other researchers have used pre-wash steps to remove soluble salts and, in some cases combinedthis with carbonation and/or phosphate addition to immobilise Pb (e.g. Hjelmar et al., 2000, 2001).Cement stabilisation has a long history of use in a number of countries for treating APC residues toproduce low permeability waste forms, particularly in the USA and France (Environment Agency,2004b). However, limited leachate data is available from landfills that have accepted cementstabilised wastes. Environment Agency (2004a) includes limited data on composite leachate qualityfrom one landfill site (Site G) that accepted cement stabilised hazardous wastes, including fly ash andAPC residues.
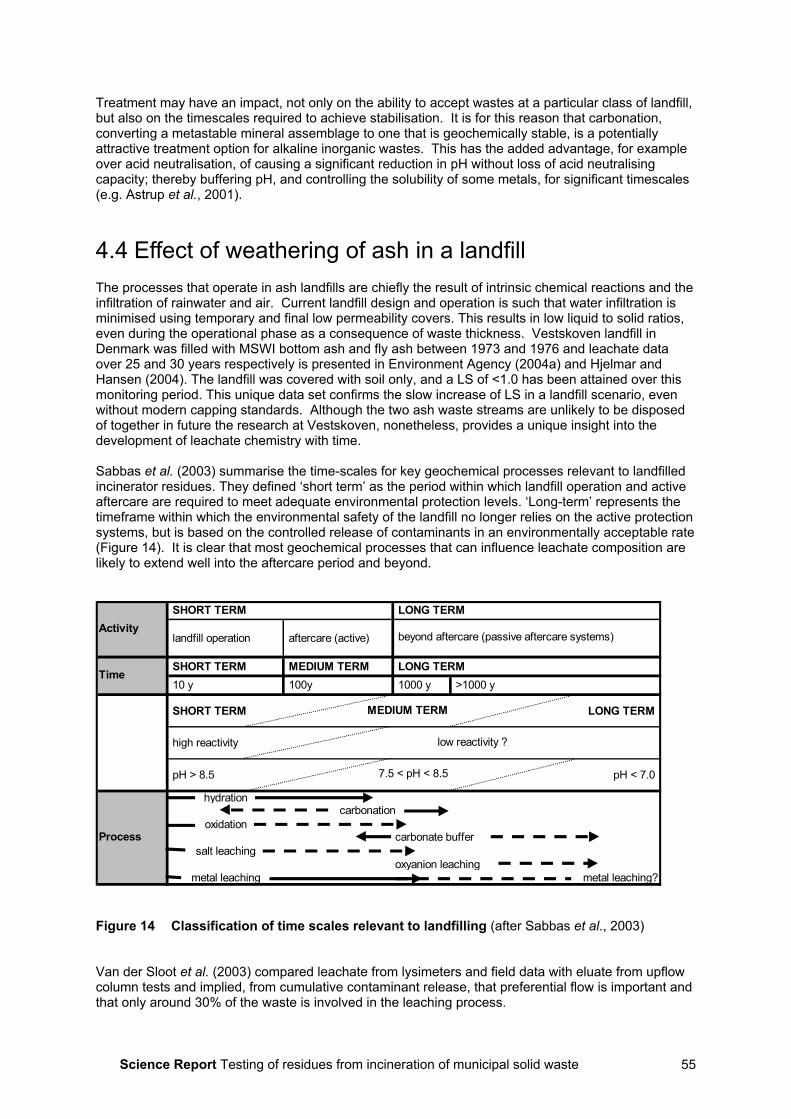
Science Report Testing of residues from incineration of municipal solid waste 55
Treatment may have an impact, not only on the ability to accept wastes at a particular class of landfill,but also on the timescales required to achieve stabilisation. It is for this reason that carbonation,converting a metastable mineral assemblage to one that is geochemically stable, is a potentiallyattractive treatment option for alkaline inorganic wastes. This has the added advantage, for exampleover acid neutralisation, of causing a significant reduction in pH without loss of acid neutralisingcapacity; thereby buffering pH, and controlling the solubility of some metals, for significant timescales(e.g. Astrup et al., 2001).
4.4 Effect of weathering of ash in a landfillThe processes that operate in ash landfills are chiefly the result of intrinsic chemical reactions and theinfiltration of rainwater and air. Current landfill design and operation is such that water infiltration isminimised using temporary and final low permeability covers. This results in low liquid to solid ratios,even during the operational phase as a consequence of waste thickness. Vestskoven landfill inDenmark was filled with MSWI bottom ash and fly ash between 1973 and 1976 and leachate dataover 25 and 30 years respectively is presented in Environment Agency (2004a) and Hjelmar andHansen (2004). The landfill was covered with soil only, and a LS of <1.0 has been attained over thismonitoring period. This unique data set confirms the slow increase of LS in a landfill scenario, evenwithout modern capping standards. Although the two ash waste streams are unlikely to be disposedof together in future the research at Vestskoven, nonetheless, provides a unique insight into thedevelopment of leachate chemistry with time.
Sabbas et al. (2003) summarise the time-scales for key geochemical processes relevant to landfilledincinerator residues. They defined ‘short term’ as the period within which landfill operation and activeaftercare are required to meet adequate environmental protection levels. ‘Long-term’ represents thetimeframe within which the environmental safety of the landfill no longer relies on the active protectionsystems, but is based on the controlled release of contaminants in an environmentally acceptable rate(Figure 14). It is clear that most geochemical processes that can influence leachate composition arelikely to extend well into the aftercare period and beyond.
landfill operation aftercare (active)
SHORT TERM MEDIUM TERM LONG TERM 10 y 100y 1000 y >1000 y
SHORT TERM LONG TERM
high reactivity
pH > 8.5 pH < 7.0
hydration
oxidation
salt leachingoxyanion leaching
metal leaching metal leaching?
Process
carbonation
carbonate buffer
MEDIUM TERM
7.5 < pH < 8.5
Time
low reactivity ?
beyond aftercare (passive aftercare systems)
LONG TERM SHORT TERMActivity
Figure 14 Classification of time scales relevant to landfilling (after Sabbas et al., 2003)
Van der Sloot et al. (2003) compared leachate from lysimeters and field data with eluate from upflowcolumn tests and implied, from cumulative contaminant release, that preferential flow is important andthat only around 30% of the waste is involved in the leaching process.
Science Report Testing of residues from incineration of municipal solid waste56
Van Zomeren et al. (2003a, 2003b) report results from laboratory and field-scale leaching of cementstabilised hazardous wastes deposited at the VBM landfill, The Netherlands. To date, the leachingdata shows good correlation between leached concentration and pH from field and laboratory data,and supports the identification of solubility-controlling mineral phases for heavy metals usingPHREEQC (van Zomeren et al., 2003a). Van der Sloot et al. (2003) observed good correlationbetween laboratory characterisation data and field leachate quality from mixed wastes, supporting theview that characterisation testing and geochemical modelling can be used effectively to predict long-term leaching behaviour.
Carbonation is an important process within both the waste and leachate collection system. Carbondioxide uptake from the atmosphere will occur in the leachate collection and storage system reducingthe pH of the leachate to near neutral (Kosson et al.,1996; van Zomeren et al., 2003a). This in partexplains the discrepancy between high pH eluates from leach tests and circum-neutral pH ofleachates from full-scale landfills.
Johnson et al. (1998) also observed circum-neutral pH leachate from a bottom ash landfill inSwitzerland, and attributed this to carbonation along preferential flow paths indicating little interactionwith the ash matrix. Occasional spikes of high pH were attributed to flushing highly alkaline porewaterfrom the matrix during high rainfall events. The proportion of by-pass flow in the leachate reached amaximum limit of around 60%.
Valls and Vazquez (2000) and Bodénan et al. (2000) also considered carbonation of the waste as animportant factor in determining its long-term leaching potential. Mostbauer et al. (2003) developed acombined weathering and upflow percolation leaching procedure and compared the results of theirlaboratory tests against lysimeter data. At the same liquid to solid ratio the results showed good toexcellent correlation between artificially weathered inorganic waste and leachate data from thenaturally-weathered waste placed in the lysimeters.
The effect of weathering on the long-term leaching, and ultimate stabilisation, of ash landfills is clearlyan important area of study for both leachate source term data and prediction of time to stabilisation.Further comparative studies on the leaching performance of fresh and weathered ash are needed tobetter understand inorganic landfill processes and, if required, develop appropriate characterisationtests (e.g. Mostbauer et al., 2003, Polettini and Pomi, 2003). Where possible, such studies should becalibrated against full-scale landfill leachate data, for example as reported by Johnson et al. (1998)and Hjelmar and Hansen (2004).
4.5 Estimated source term valuesIt had been hoped that a comparison of the field data obtained in Environment Agency (2004a) withthe experimental data at LS 10 and LS ~1 (column test) in this study, would reveal consistentrelationships. However, although the solid residues show a good correlation with other UK andEuropean data sets, the relationships between LS 10, column tests and field leachate data werecomplex and inconsistent.
Possibly one of the principal contributors to this was the variation in the pH of the eluates andleachates. Field pH values appear to depend on the extent of carbonation and other ageing factors,as well as the multi-domain hydraulic characteristics of the wastes. This results in leachatecomposition represented by a variable mixture from carbonated and non-carbonated zones within thelandfill.
However, the leaching behaviour cannot simply be attributed to pH, and inconsistent behaviour wasnoted both during this study and in comparing European data sets. An important example of this isCd. Hjelmar (1996) reported Cd concentrations of up to 10-100 µg/l and 1-10 mg/l from low LScolumn studies on bottom ash and APC residues respectively. Hjelmar et al. (1999) reported averageleaching of around 20 µg/l Cd based on the cumulative mass leached up to around LS 2. Leachateresults from a number of landfill sites are reported in Environment Agency (2004a) and summarisedfor Cd below:
Science Report Testing of residues from incineration of municipal solid waste 57
Lostorf * BA 0.4 - 5.4 µg/l pH 11.3 - 8.7Vestskoven 85% BA 15% fly ash < 1.0 µg/l pH ~ 8.4 - 10.4Site E APC Up to 7.3 mg/l pH ~ 7 - 10.5* Johnson et al. (1998)
The data for Vestskoven and Site E are presented as time-series graphs (Environment Agency,2004a) and show little correlation between Cd and pH.
Data from this study are compromised by variable reporting limits, particularly for APC residues. Mostdata are below reporting limits, which vary from 1 to 100 µg/l, except for the acid neutralised samples(see Section 3.4). From this, and other studies, it can be concluded that a consistent relationship forleaching of Cd cannot be made between LS 10, column tests and field data.
Despite these difficulties, some of the eluates at low LS ratio matched field data fairly well:
• Parameters such as DOC, COD, BOD, NH4-N, TKN and several of the soluble major ions werepresent in column eluates at roughly 5 to 10 times the LS 10 eluates and at levels similar toreported field data;
• Several metals were at similar concentrations in LS 10 and LS1 eluates, where pH was similar,suggesting equilibrium control rather than availability e.g. Zn, Pb, Mo.
Keeping in mind the caveats above, an attempt has been made to derive draft source term valuesfrom this study. These are presented below for bottom ash and APC residues, respectively. Theirderivation has necessarily involved a degree of subjective judgement, and they are recommended foruse not as default source term values but to inform professional judgement. They have been derivedfrom the results in this study using a method described in Environment Agency (2004a), influenced,where appropriate, by field leachate data.
Kappa values were estimated for untreated and carbonated bottom ash and APC residues, using thecomparison of leaching test results at LS 1 (column) and LS 10 (batch tests). The kappa value isderived from:
Kappa value = ln [LS1] - ln [LS 10]/10 - 1
For some parameters where data are missing, kappa values have been estimated. For the acidneutralised samples, no column tests were done so the kappa values for carbonated waste havebeen used. It is considered that insufficient data is available for trace organics to propose sourceterm data and site or waste stream specific data should be used on a case by case basis.
The maximum concentration, Co, has been estimated from the kappa values and CLS10 from the leachtests. The spread of the data from the three incinerators provides a high end and low end estimate ofthe maximum value of Co. The high end estimate is taken as the maximum point of the PDF for eachparameter. The low end estimate has been divided by the hydraulic factor of 5, to give the minimumpoint of the PDF. The most likely value still has to be evaluated, by reference to the shape of thePDF, but will usually be set closer to the maximum than the minimum.
4.5.1 Bottom ashThe proposed source term data presented in Tables 17 to 19 below are derived from a limited numberof laboratory tests using LS 10 batch leach tests and a recirculating upflow column test at LS 1. Thisinformation should be used to inform professional judgement when carrying out a groundwater riskassessment for a particular landfill site.
Sources of variationInputs of some non-municipal waste to the incinerator (e.g. plasterboard) could affect the lime contentof the ash, and hence the leachate pH and natural carbonation processes. Bottom ash from modernincinerators is likely to meet a higher standard in terms of screening and burn-out efficiency incomparison to the ash that gave rise to the leachate quality reported by Johnson et al. (1999) andHjelmar and Hansen (2004). The extent of pre- and post-separation could affect the metal and
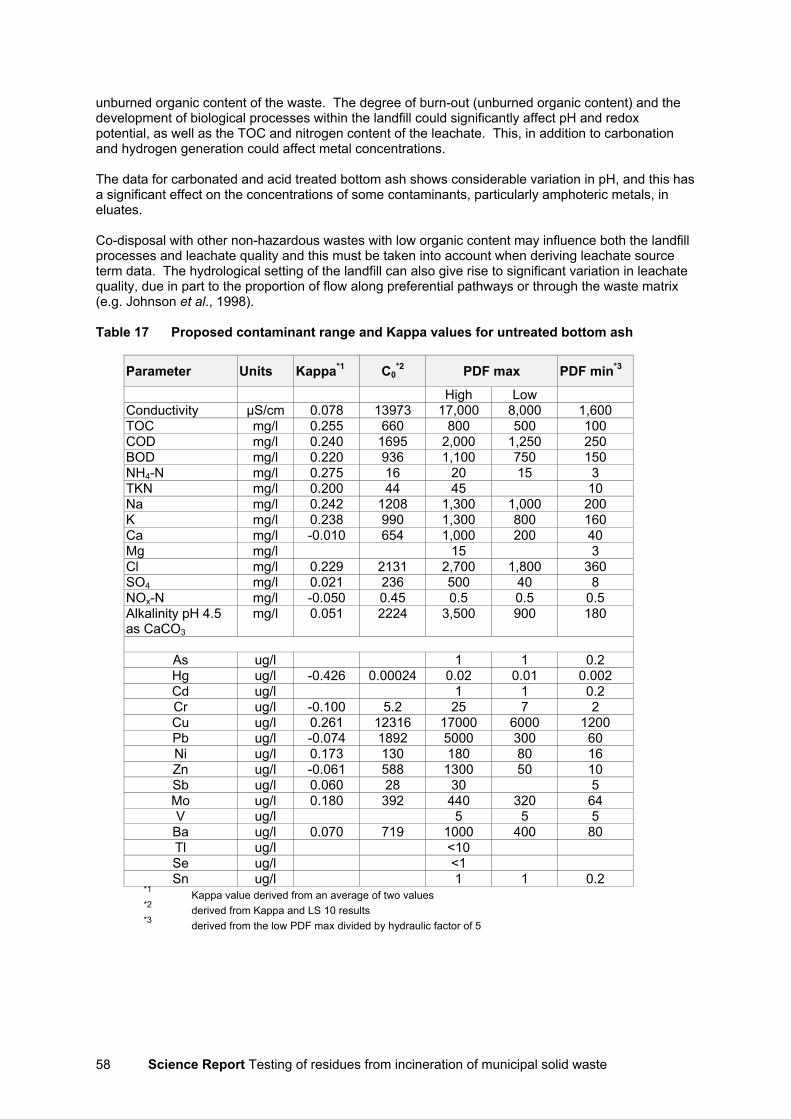
Science Report Testing of residues from incineration of municipal solid waste58
unburned organic content of the waste. The degree of burn-out (unburned organic content) and thedevelopment of biological processes within the landfill could significantly affect pH and redoxpotential, as well as the TOC and nitrogen content of the leachate. This, in addition to carbonationand hydrogen generation could affect metal concentrations.
The data for carbonated and acid treated bottom ash shows considerable variation in pH, and this hasa significant effect on the concentrations of some contaminants, particularly amphoteric metals, ineluates.
Co-disposal with other non-hazardous wastes with low organic content may influence both the landfillprocesses and leachate quality and this must be taken into account when deriving leachate sourceterm data. The hydrological setting of the landfill can also give rise to significant variation in leachatequality, due in part to the proportion of flow along preferential pathways or through the waste matrix(e.g. Johnson et al., 1998).
Table 17 Proposed contaminant range and Kappa values for untreated bottom ash
Parameter Units Kappa*1 C0*2 PDF max PDF min*3
High LowConductivity µS/cm 0.078 13973 17,000 8,000 1,600TOC mg/l 0.255 660 800 500 100COD mg/l 0.240 1695 2,000 1,250 250BOD mg/l 0.220 936 1,100 750 150NH4-N mg/l 0.275 16 20 15 3TKN mg/l 0.200 44 45 10Na mg/l 0.242 1208 1,300 1,000 200K mg/l 0.238 990 1,300 800 160Ca mg/l -0.010 654 1,000 200 40Mg mg/l 15 3Cl mg/l 0.229 2131 2,700 1,800 360SO4 mg/l 0.021 236 500 40 8NOx-N mg/l -0.050 0.45 0.5 0.5 0.5Alkalinity pH 4.5as CaCO3
mg/l 0.051 2224 3,500 900 180
As ug/l 1 1 0.2Hg ug/l -0.426 0.00024 0.02 0.01 0.002Cd ug/l 1 1 0.2Cr ug/l -0.100 5.2 25 7 2Cu ug/l 0.261 12316 17000 6000 1200Pb ug/l -0.074 1892 5000 300 60Ni ug/l 0.173 130 180 80 16Zn ug/l -0.061 588 1300 50 10Sb ug/l 0.060 28 30 5Mo ug/l 0.180 392 440 320 64V ug/l 5 5 5Ba ug/l 0.070 719 1000 400 80Tl ug/l <10Se ug/l <1Sn ug/l 1 1 0.2
*1 Kappa value derived from an average of two values*2 derived from Kappa and LS 10 results*3 derived from the low PDF max divided by hydraulic factor of 5
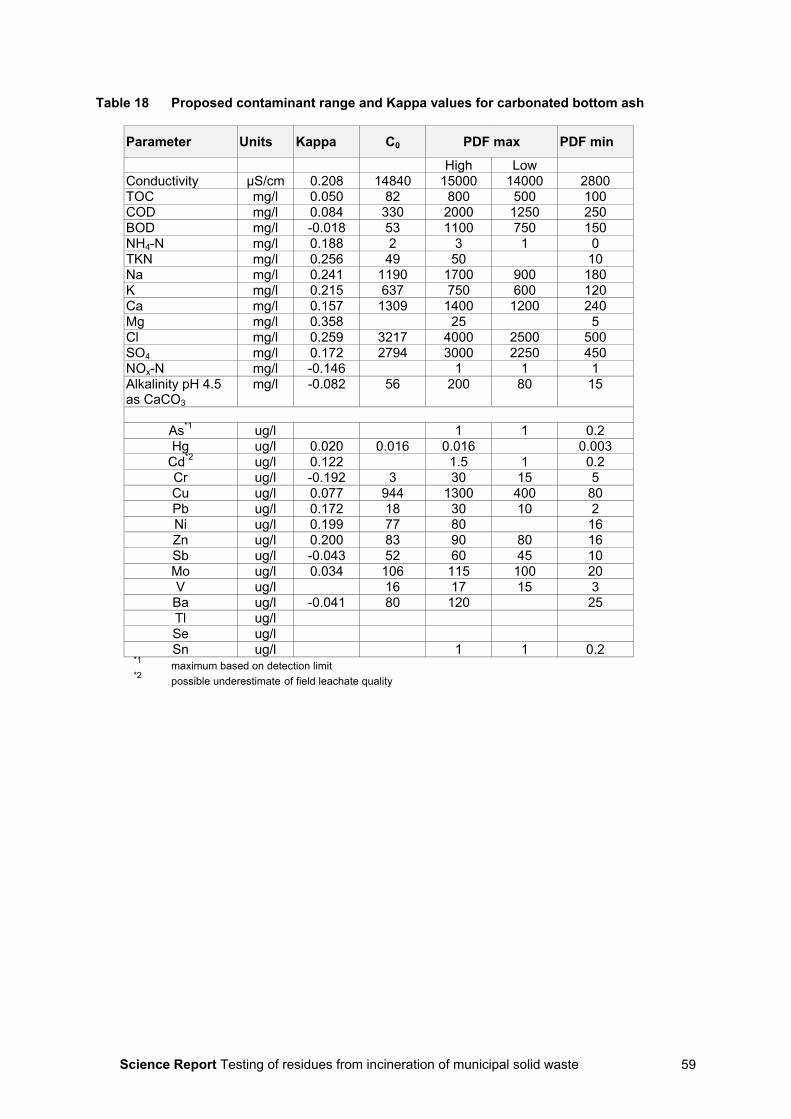
Science Report Testing of residues from incineration of municipal solid waste 59
Table 18 Proposed contaminant range and Kappa values for carbonated bottom ash
Parameter Units Kappa C0 PDF max PDF minHigh Low
Conductivity µS/cm 0.208 14840 15000 14000 2800TOC mg/l 0.050 82 800 500 100COD mg/l 0.084 330 2000 1250 250BOD mg/l -0.018 53 1100 750 150NH4-N mg/l 0.188 2 3 1 0TKN mg/l 0.256 49 50 10Na mg/l 0.241 1190 1700 900 180K mg/l 0.215 637 750 600 120Ca mg/l 0.157 1309 1400 1200 240Mg mg/l 0.358 25 5Cl mg/l 0.259 3217 4000 2500 500SO4 mg/l 0.172 2794 3000 2250 450NOx-N mg/l -0.146 1 1 1Alkalinity pH 4.5as CaCO3
mg/l -0.082 56 200 80 15
As*1 ug/l 1 1 0.2Hg ug/l 0.020 0.016 0.016 0.003
Cd*2 ug/l 0.122 1.5 1 0.2Cr ug/l -0.192 3 30 15 5Cu ug/l 0.077 944 1300 400 80Pb ug/l 0.172 18 30 10 2Ni ug/l 0.199 77 80 16Zn ug/l 0.200 83 90 80 16Sb ug/l -0.043 52 60 45 10Mo ug/l 0.034 106 115 100 20V ug/l 16 17 15 3Ba ug/l -0.041 80 120 25Tl ug/lSe ug/lSn ug/l 1 1 0.2
*1 maximum based on detection limit*2 possible underestimate of field leachate quality
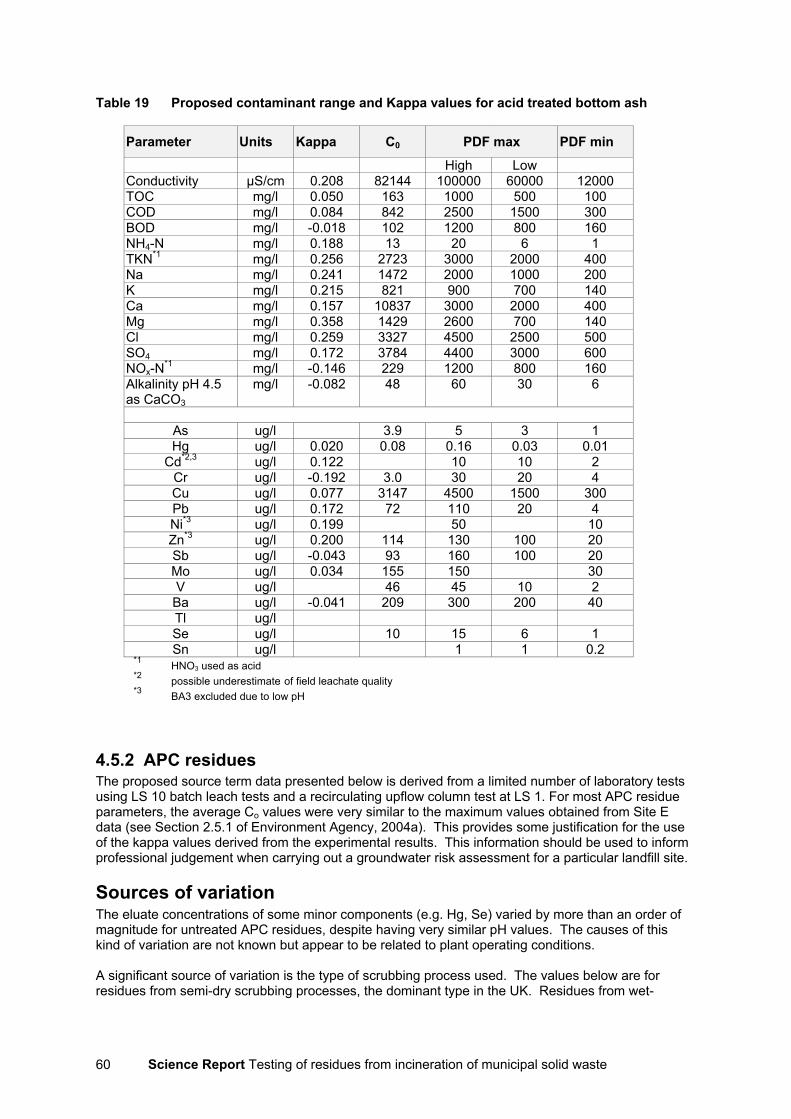
Science Report Testing of residues from incineration of municipal solid waste60
Table 19 Proposed contaminant range and Kappa values for acid treated bottom ash
Parameter Units Kappa C0 PDF max PDF minHigh Low
Conductivity µS/cm 0.208 82144 100000 60000 12000TOC mg/l 0.050 163 1000 500 100COD mg/l 0.084 842 2500 1500 300BOD mg/l -0.018 102 1200 800 160NH4-N mg/l 0.188 13 20 6 1TKN*1 mg/l 0.256 2723 3000 2000 400Na mg/l 0.241 1472 2000 1000 200K mg/l 0.215 821 900 700 140Ca mg/l 0.157 10837 3000 2000 400Mg mg/l 0.358 1429 2600 700 140Cl mg/l 0.259 3327 4500 2500 500SO4 mg/l 0.172 3784 4400 3000 600NOx-N*1 mg/l -0.146 229 1200 800 160Alkalinity pH 4.5as CaCO3
mg/l -0.082 48 60 30 6
As ug/l 3.9 5 3 1Hg ug/l 0.020 0.08 0.16 0.03 0.01
Cd*2,3 ug/l 0.122 10 10 2Cr ug/l -0.192 3.0 30 20 4Cu ug/l 0.077 3147 4500 1500 300Pb ug/l 0.172 72 110 20 4Ni*3 ug/l 0.199 50 10Zn*3 ug/l 0.200 114 130 100 20Sb ug/l -0.043 93 160 100 20Mo ug/l 0.034 155 150 30V ug/l 46 45 10 2Ba ug/l -0.041 209 300 200 40Tl ug/lSe ug/l 10 15 6 1Sn ug/l 1 1 0.2
*1 HNO3 used as acid*2 possible underestimate of field leachate quality*3 BA3 excluded due to low pH
4.5.2 APC residuesThe proposed source term data presented below is derived from a limited number of laboratory testsusing LS 10 batch leach tests and a recirculating upflow column test at LS 1. For most APC residueparameters, the average Co values were very similar to the maximum values obtained from Site Edata (see Section 2.5.1 of Environment Agency, 2004a). This provides some justification for the useof the kappa values derived from the experimental results. This information should be used to informprofessional judgement when carrying out a groundwater risk assessment for a particular landfill site.
Sources of variationThe eluate concentrations of some minor components (e.g. Hg, Se) varied by more than an order ofmagnitude for untreated APC residues, despite having very similar pH values. The causes of thiskind of variation are not known but appear to be related to plant operating conditions.
A significant source of variation is the type of scrubbing process used. The values below are forresidues from semi-dry scrubbing processes, the dominant type in the UK. Residues from wet-
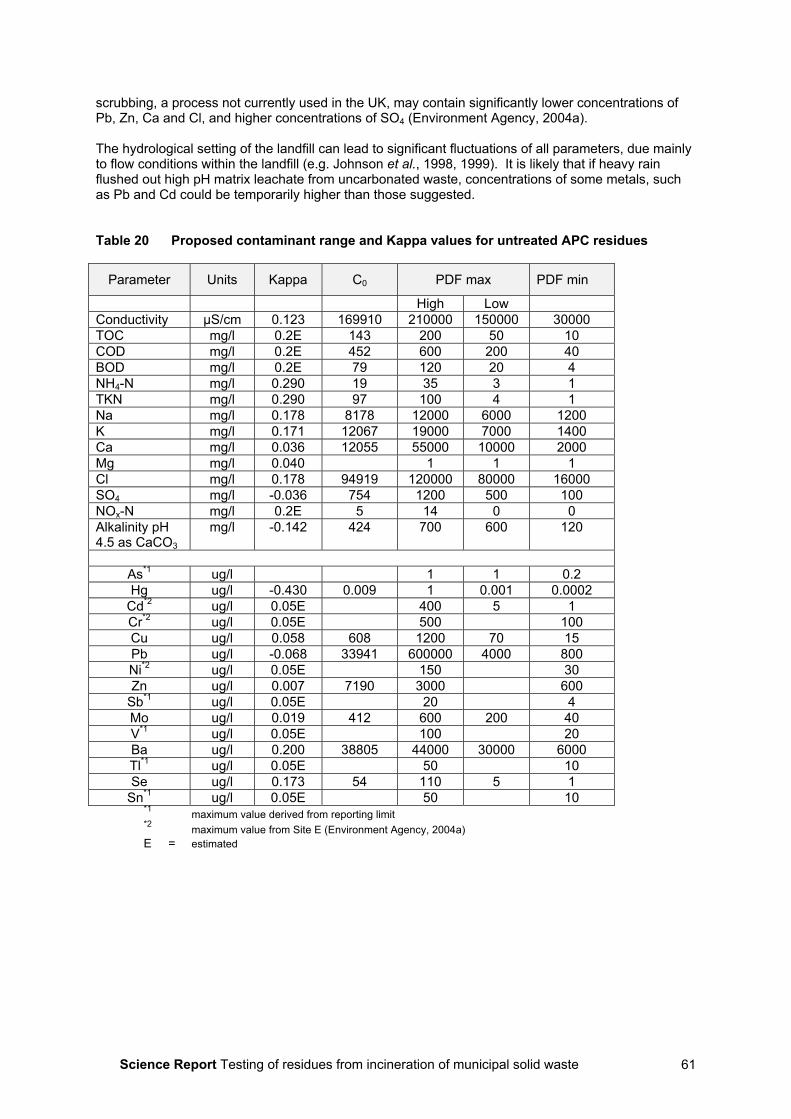
Science Report Testing of residues from incineration of municipal solid waste 61
scrubbing, a process not currently used in the UK, may contain significantly lower concentrations ofPb, Zn, Ca and Cl, and higher concentrations of SO4 (Environment Agency, 2004a).
The hydrological setting of the landfill can lead to significant fluctuations of all parameters, due mainlyto flow conditions within the landfill (e.g. Johnson et al., 1998, 1999). It is likely that if heavy rainflushed out high pH matrix leachate from uncarbonated waste, concentrations of some metals, suchas Pb and Cd could be temporarily higher than those suggested.
Table 20 Proposed contaminant range and Kappa values for untreated APC residues
Parameter Units Kappa C0 PDF max PDF min
High LowConductivity µS/cm 0.123 169910 210000 150000 30000TOC mg/l 0.2E 143 200 50 10COD mg/l 0.2E 452 600 200 40BOD mg/l 0.2E 79 120 20 4NH4-N mg/l 0.290 19 35 3 1TKN mg/l 0.290 97 100 4 1Na mg/l 0.178 8178 12000 6000 1200K mg/l 0.171 12067 19000 7000 1400Ca mg/l 0.036 12055 55000 10000 2000Mg mg/l 0.040 1 1 1Cl mg/l 0.178 94919 120000 80000 16000SO4 mg/l -0.036 754 1200 500 100NOx-N mg/l 0.2E 5 14 0 0Alkalinity pH4.5 as CaCO3
mg/l -0.142 424 700 600 120
As*1 ug/l 1 1 0.2Hg ug/l -0.430 0.009 1 0.001 0.0002
Cd*2 ug/l 0.05E 400 5 1Cr*2 ug/l 0.05E 500 100Cu ug/l 0.058 608 1200 70 15Pb ug/l -0.068 33941 600000 4000 800Ni*2 ug/l 0.05E 150 30Zn ug/l 0.007 7190 3000 600
Sb*1 ug/l 0.05E 20 4Mo ug/l 0.019 412 600 200 40V*1 ug/l 0.05E 100 20Ba ug/l 0.200 38805 44000 30000 6000Tl*1 ug/l 0.05E 50 10Se ug/l 0.173 54 110 5 1
Sn*1 ug/l 0.05E 50 10*1 maximum value derived from reporting limit*2 maximum value from Site E (Environment Agency, 2004a)E = estimated
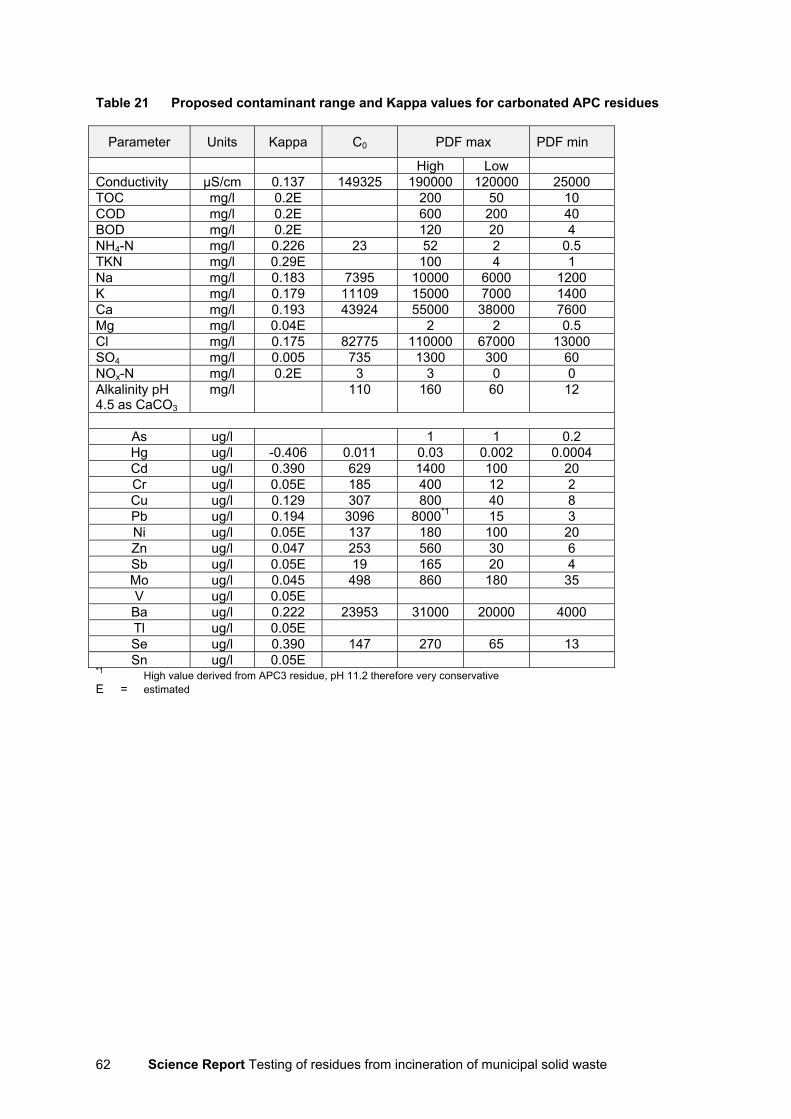
Science Report Testing of residues from incineration of municipal solid waste62
Table 21 Proposed contaminant range and Kappa values for carbonated APC residues
Parameter Units Kappa C0 PDF max PDF min
High LowConductivity µS/cm 0.137 149325 190000 120000 25000TOC mg/l 0.2E 200 50 10COD mg/l 0.2E 600 200 40BOD mg/l 0.2E 120 20 4NH4-N mg/l 0.226 23 52 2 0.5TKN mg/l 0.29E 100 4 1Na mg/l 0.183 7395 10000 6000 1200K mg/l 0.179 11109 15000 7000 1400Ca mg/l 0.193 43924 55000 38000 7600Mg mg/l 0.04E 2 2 0.5Cl mg/l 0.175 82775 110000 67000 13000SO4 mg/l 0.005 735 1300 300 60NOx-N mg/l 0.2E 3 3 0 0Alkalinity pH4.5 as CaCO3
mg/l 110 160 60 12
As ug/l 1 1 0.2Hg ug/l -0.406 0.011 0.03 0.002 0.0004Cd ug/l 0.390 629 1400 100 20Cr ug/l 0.05E 185 400 12 2Cu ug/l 0.129 307 800 40 8Pb ug/l 0.194 3096 8000*1 15 3Ni ug/l 0.05E 137 180 100 20Zn ug/l 0.047 253 560 30 6Sb ug/l 0.05E 19 165 20 4Mo ug/l 0.045 498 860 180 35V ug/l 0.05EBa ug/l 0.222 23953 31000 20000 4000Tl ug/l 0.05ESe ug/l 0.390 147 270 65 13Sn ug/l 0.05E
*1 High value derived from APC3 residue, pH 11.2 therefore very conservativeE = estimated
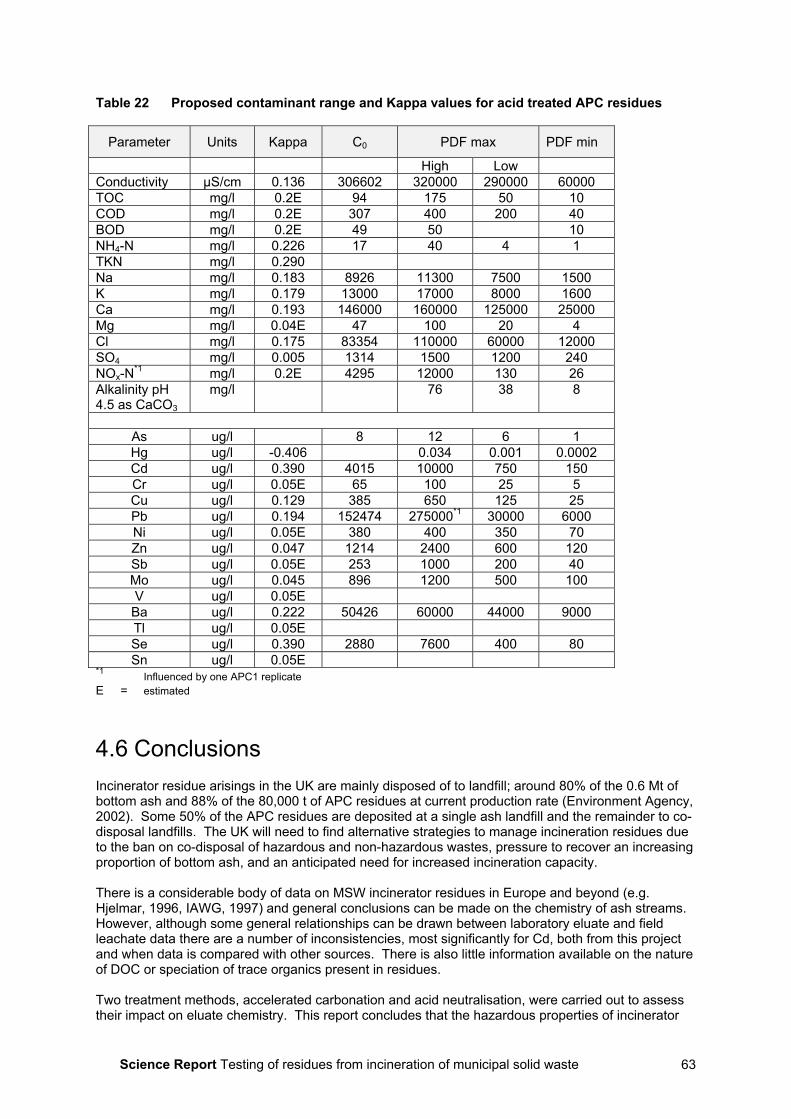
Science Report Testing of residues from incineration of municipal solid waste 63
Table 22 Proposed contaminant range and Kappa values for acid treated APC residues
Parameter Units Kappa C0 PDF max PDF min
High LowConductivity µS/cm 0.136 306602 320000 290000 60000TOC mg/l 0.2E 94 175 50 10COD mg/l 0.2E 307 400 200 40BOD mg/l 0.2E 49 50 10NH4-N mg/l 0.226 17 40 4 1TKN mg/l 0.290Na mg/l 0.183 8926 11300 7500 1500K mg/l 0.179 13000 17000 8000 1600Ca mg/l 0.193 146000 160000 125000 25000Mg mg/l 0.04E 47 100 20 4Cl mg/l 0.175 83354 110000 60000 12000SO4 mg/l 0.005 1314 1500 1200 240NOx-N*1 mg/l 0.2E 4295 12000 130 26Alkalinity pH4.5 as CaCO3
mg/l 76 38 8
As ug/l 8 12 6 1Hg ug/l -0.406 0.034 0.001 0.0002Cd ug/l 0.390 4015 10000 750 150Cr ug/l 0.05E 65 100 25 5Cu ug/l 0.129 385 650 125 25Pb ug/l 0.194 152474 275000*1 30000 6000Ni ug/l 0.05E 380 400 350 70Zn ug/l 0.047 1214 2400 600 120Sb ug/l 0.05E 253 1000 200 40Mo ug/l 0.045 896 1200 500 100V ug/l 0.05EBa ug/l 0.222 50426 60000 44000 9000Tl ug/l 0.05ESe ug/l 0.390 2880 7600 400 80Sn ug/l 0.05E
*1 Influenced by one APC1 replicateE = estimated
4.6 ConclusionsIncinerator residue arisings in the UK are mainly disposed of to landfill; around 80% of the 0.6 Mt ofbottom ash and 88% of the 80,000 t of APC residues at current production rate (Environment Agency,2002). Some 50% of the APC residues are deposited at a single ash landfill and the remainder to co-disposal landfills. The UK will need to find alternative strategies to manage incineration residues dueto the ban on co-disposal of hazardous and non-hazardous wastes, pressure to recover an increasingproportion of bottom ash, and an anticipated need for increased incineration capacity.
There is a considerable body of data on MSW incinerator residues in Europe and beyond (e.g.Hjelmar, 1996, IAWG, 1997) and general conclusions can be made on the chemistry of ash streams.However, although some general relationships can be drawn between laboratory eluate and fieldleachate data there are a number of inconsistencies, most significantly for Cd, both from this projectand when data is compared with other sources. There is also little information available on the natureof DOC or speciation of trace organics present in residues.
Two treatment methods, accelerated carbonation and acid neutralisation, were carried out to assesstheir impact on eluate chemistry. This report concludes that the hazardous properties of incinerator
Science Report Testing of residues from incineration of municipal solid waste64
residues can be reduced by carbonation due to consumption of lime and precipitation of calcite. Thisresults in a pH reduction, although not by as much as expected under the conditions of this study.However, other researchers have achieved consistent results below pH 9.
Heavy metal concentrations in eluates can also be significantly reduced, in particular Pb and Zn, Ba(bottom ash), Cu and Se (both APC). However, further work is required to evaluate the effect ofcarbonation on leaching Cd from APC residues. Notwithstanding this, carbonation shows promise asa treatment technology as pH reduction is achieved without significant loss of acid buffering capacity.
Acid neutralisation yielded far more variable replicate data than both the untreated and carbonatedeluates. Heavy metal concentrations were also significantly reduced, particularly Pb and Zn.However, some metals were released in significant concentrations, in particular Cd, Sb and Mo. Cuconcentrations in bottom ash eluates were also elevated, possibly due to complexation with DOCreleased from bottom ash samples.
Leachate source term data is proposed, primarily from the results of this study and supplemented byfield data. It was beyond the scope of this study to compile source term data from the wealth ofpublished literature available, but comparisons were made with other data sets as a quality check onthe data from this study. This information should be used to inform professional judgement whencarrying out a groundwater risk assessment for a particular landfill site that contains a significantproportion of incinerator residues..
The management of leachate from landfill sites containing predominantly incinerator residues cannotbe considered in isolation from other landfill processes, including the likelihood and longevity ofbiodegradation (e.g. of unburned paper), the implication of changing redox conditions, the generationof gases (e.g. from methanogenesis and elemental metal corrosion), temperature development,landfill hydraulics, the efficacy of leachate collection systems, and the effect of long-term changes(e.g. carbonation, humification) on the release of contaminants. Sabbas et al. (2003) present and anexcellent overview of management of incineration residues, and a number of research areas can behighlighted.
Key research needs are summarised below:
• Evaluation of the chemistry and mineralogy of residues; in particular the origin and compositionof DOC and its impact on mobilisation of metals and trace organics (e.g. Kim and Osako, 2004,Zhang et al., 2004);
• Evaluate the potential for gas (e.g. Magel et al., 2001) and heat (e.g. Huber, 1998) evolution,their influence on landfill processes and conditions, and liner integrity;
• Evaluate the influence of weathering on the leaching performance of residues (e.g. Bodénan etal., 2000, Polettini and Pomi, 2003, Mostbauer et al., 2003);
• Evaluation of the influence of dissolution and carbonation on the mechanical properties ofresidues, treated residues and the stability of incinerator residue landfills;
• Evaluation and compilation of leachate quality data from landfill sites containing predominantlyMSWI residues;
• Measurement and modelling of landfill hydraulics; and
• Evaluation of treatment technologies to enable re-use of residues, compliance with the WACs,and/or reduce the time to reach equilibrium status (Hall et al., 2004).
.
Science Report Testing of residues from incineration of municipal solid waste 65
ReferencesAbbas Z, 1998 Leaching behaviour of residues from municipal solid waste combustion. PhD thesis,University of Gothenburg, Institute for Organic Chemistry
Astrup, T., Hansen, J.B., Hjelmar, O. and Christensen, T.H. (2001) Long-term Development in APCAsh Landfill with respect to pH. In: Proceedings of Sardinia 2001. Eighth International WasteManagement and Landfill Symposium. 1-5 October 2001, Margherita de Pula, CISA, Cagliari, Italy.
Bodénan, F., Azaroual, M. and Piantone, P. (2000) Forecasting the long-term behaviour of municipalsolid waste incinerator bottom ash: rapid combined tests. In: WASCON 2000 Fourth InternationalConference on the Environmental and Technical Implications of Construction with AlternativeMaterials. Harrogate, UK. ISCOWA, The Netherlands.
British Standards Institution BS EN 12457 (2002) Characterisation of Waste – Leaching - ComplianceTest for Granular Waste Materials and Sludges.. Part 1: one stage batch test at a liquid to solid ratio of 2 l/kg for materials with high solid content andwith particle size below 4mm. Part 2: one stage batch test at a liquid to solid ratio of 10 l/kg for materials with particle size below4mm. Part 3: two stage batch test at a liquid to solid ratio of 2 l/kg and 8 l/kg for materials with a high solidcontent and with a particle size below 4mm. Part 4: one stage batch test at a liquid to solid ratio of 10l/kg for materials with particle size below10mm. British Standards Institution.
Chen D, Astrup T, Rosenblad C, and Christensen T.H. (2003) Factors affecting chromium leachingfrom waste incineration residues. Sardinia 2003. Ninth International Waste Management and LandfillSymposium, 6-10 October 2003, S. Margherita di Pula, CISA, Cagliari, Italy.
Clark, I.D., Fontes, J-C. and Fritz, P. (1992) Stable isotope disequilibria in travertine from high pHwaters: laboratory investigations and field observations from Oman. Geochimica et CosmochimicaActa, 56, 2041-2050.
Comité Européen Normalisation (2002) Draft prEN 14405. Leaching behaviour test - upflowpercolation test. CEN TC292/WG6. April 2002.
Energy Technology Support Unit, 1996 Lewin K, Blakey N, Turrell J, Bradshaw K, Collins R and vander Sloot H Properties and utilization of MSW incineration residues. ETSU B/RR/00368/REP.
Environment Agency (1999) Internal Guidance on the Interpretation and Application of Regulation 15of the Waste Management Licensing Regulations, 1994 (The protection of groundwater) with respectto landfill. Environment Agency, Bristol, UK, December 1999.
Environment Agency (2002) Solid residues from municipal waste incinerators in England and Wales.Report prepared internally by the Environment Agency, Bristol, May 2002.
Environment Agency (2003) Hazardous waste. Interpretation of the definition and classification ofhazardous waste. Environment Agency Technical Guidance WM2, Bristol. ISBN 1 84432 130 4.
Environment Agency (2004a) Improved definition of leachate source term for landfills. Phase 1:review of data from European landfills. Environment Agency Science Report, Bristol.
Environment Agency (2004b) Review of scientific literature on the use of stabilisation/ solidification forthe treatment of contaminated soil, solid waste and sludges. Environment Agency Science Report P5-064/TR/2.
European Commission (1999) Council Directive 1999/31/EC of 26 April 1999 on the landfill of waste.The Official Journal of the European Communities.
Science Report Testing of residues from incineration of municipal solid waste66
European Commission (2002) European Waste Catalogue. European Commission Decision2000/532/EC as amended by Decisions 2001/118/EC, 2001/119/EC and 2001/573/EC.
European Commission (2003) European Commission Decision 2003/33/EC of 19th December 2002establishing criteria and procedures for the acceptance of waste at landfills pursuant to Article 16 andAnnex II of Council Directive 1999/31/EC on the landfill of waste. Official Journal of the EuropeanCommunities LII 16.1.2003.
Hall, D.H., Gronow, J., Smith, R. and Blakey, N. (2004) Achieving equilibrium status and sustainablelandfill - the Holy Grail? In: Proceedings of the Waste 2004 Conference. Integrated WasteManagement and Pollution Control: Policy and Practice, Research and Solutions. 28-30 September,2004. The Waste Conference Ltd., Coventry, UK. pp. 568-578.
Hills, C.D. (2003) Pers. Comm.
Hjelmar, O. (1996) Disposal strategies for municipal solid waste incineration residues. J. HazardousMaterials, 47, pp. 345-368.
Hjelmar, O. and Hansen, J.B. (2004) Towards final storage quality in landfilling: an example. In:Proceedings of the Waste 2004 Conference. Integrated Waste Management and Pollution Control:Policy and Practice, Research and Solutions. 28-30 September, 2004. The Waste Conference Ltd.,Coventry, UK. pp. 579-588.
Hjelmar, O., Birch, H. and Hansen, J.B. (2000) Further development of a process for treatment ofAPC residues from MSW incinerators. In: Woolley, G.R., Goumans, J.J.J.M. and Wainwright, P.J.(editors). Waste Materials in Construction, 872-883. Elsevier Science Ltd.
Hjelmar, O., Birch, H. and Hansen, J.B. (2001) Treatment of APC residues from MSW incineration:development and optimisation of a treatment process in pilot scale. In: Proceedings of Sardinia 2001.Eighth International Waste Management and Landfill Symposium. 1-5 October 2001, Margherita dePula, CISA, Cagliari, Italy.
Huber, H. (1998) Development of pH and alkalinity in bottom ash - simulation of the long-termbehaviour. Waste Reports No. 8, ABF-BOKU, Vienna.
International Ash Working Group (1997) Municipal solid waste incinerator residues. Studies inEnvironmental Science 67, Elsevier Science, Amsterdam.
Johnson, C.A., Richner G.A., Vitvar, T., Schittle, N. and Eberhard, M. (1998) Hydrological andgeochemical factors affecting leachate composition in MSW incinerator bottom ash. Part I: thehydrology of Landfill Lostorf, Switzerland. J. Contaminant Hydrology, 33, pp. 361-376.
Johnson, C.A., Kaeppeli, M., Brandenberger, S., Ulrich, A. and Baumann, W. (1999) Hydrological andgeochemical factors affecting leachate composition in MSW incinerator bottom ash. Part II: thegeochemistry of leachate from Landfill Lostorf, Switzerland. J. Contaminant Hydrology 40, 239-259.
Khoury, H.N., Salameh, E. and Abdul-Jaber, Q. (1985) Characteristics of an unusual highly alkalinewater from the Marqarin area, northern Jordan. J. Hydrology. 81, 79-91.
Kim, Y-J. and Osako, M. (2004) Investigation on the humification of municipal solid waste incinerationresidue and its effect on the leaching behaviour of dioxins. Waste Management 24 (8), 815-823.
Kosson, D.S., van der Sloot, H.A. and Eighmy, T.T. (1996) An approach for estimation of contaminantrelease during utilisation and disposal of municipal waste combustion residues. Journal of HazardousMaterials 47, 43-75.
Lange, L.C., Hills, C.D., and Poole, A.B. (1996) Preliminary investigation into the effects ofcarbonation on cement-solidified hazardous wastes. Environmental Science and Technology, 30, 25-30.
Science Report Testing of residues from incineration of municipal solid waste 67
Lange, L.C., Hills, C.D. and Poole, A.B. (1997) Effect of Carbonation on Properties of Blended andNon-blended Cement Solidified Waste Forms. Journal of Hazardous Materials 52, 193-212.
Magel, G., Heuss-Assbichler, S. and Fehr, K.T. (2001) Abiotic H2 generating reactions in a MSWImonofill. In Proceedings of Sardinia 2001. The Eighth International Waste Management and LandfillSymposium, S. Margherita di Pula. CISA, Cagliari, Italy. 1-5 October 2001.
Mostbauer, P., Riegler, H. and Lechner, P. (2003) Artificial weathering of inorganic waste - evaluationof laboratory weathering and leaching methods. In: Proceedings Ninth International WasteManagement and Landfill Symposium, 6-10 October, 2003, S. Margherita di Pula, CISA, Cagliari,Italy.
Polettini, A. and Pomi, R. (2003) The influence of accelerated ageing on leaching behaviour ofincinerator bottom ash. In: Ortiz de Urbina, G. and Goumans, J.J.J.M. (Eds.) Proceedings ofWASCON 2003 Waste Materials in Construction. 4-6 June, 2003, San Sebastian, Spain. CD version,ISCOWA, The Netherlands (www.iscowa.org).
Robinson, H. (1995) A review of the composition of leachates from domestic wastes in landfill sites.Department of the Environment Report CWM/72_95.
Sabbas, T., Polettini, A., Pomi, R., Astrup, T., Hjelmar, O., Mostbauer, P., Cappai, G., Magel, G.,Salhofer, S., Speiser, C., Heuss-Assbichler, S., Klein, R. and Lechner, P. (2003)Management of municipal solid waste incineration residues. Waste Management 23, 61–88.
Stegemann. J.A., Schneider, J., Baetz, B.W. and Murphy, K.L. (1995) Lysimeter washing of MSWincinerator bottom ash. Waste Management and Research, 13 (2), 149-156.
Sweeney, R.E.H., Hills C.D. and Buenfeld, N.R. (1998) Investigation into Carbonation ofStabilised/Solidified Synthetic Waste. Environmental Technology 19, pp. 893-902.
Valls, S. and Vazquez, E. (2000) Durability study of a sewerage sludge-cement-sand system and itsenvironmental impact. In: WASCON 2000 Fourth International Conference on the Environmental andTechnical Implications of Construction with Alternative Materials. Harrogate, UK. ISCOWA, TheNetherlands.
van den Berg et al. (1998) Toxic equivalency factors for PCBs, PCDDs and PCDFs for humans andwildlife. Environmental Health Perspectives 106 (12) December 1998.
van der Sloot H.A., Rietra R.P.J.J. and Hoede D. (2000) Evaluation of leaching behaviour of selectedwastes designated as hazardous by means of basic characterization tests. Netherlands EnergyResearch Foundation ECN, Contract Research report ECN-C-00-050, pp.155
van der Sloot, H.A., van Zomeren, A., Dijkstra, J.J., Hoede, D., Jacobs, J. and Scharff, H. (2003)Prediction of long term leachate quality and chemical speciation for a predominantly inorganic wastelandfill. In: Proceedings Ninth International Waste Management and Landfill Symposium, 6-10October, 2003, S. Margherita di Pula, CISA, Cagliari, Italy.
van Zomeren A. and Comans, R.N.J. (2003) Speciation and characterisation of organic carbon inMunicipal Solid Waste Incinerator (MSWI) bottom ash. In: Ortiz de Urbina, G. and Goumans, J.J.J.M.(Eds.) Proceedings of WASCON 2003 Waste Materials in Construction. 4-6 June, 2003, SanSebastian, Spain. CD version, ISCOWA, The Netherlands (www.iscowa.org).
van Zomeren A., van der Sloot, H.A. and Hoede, D. (2003a) Laboratory, pilot and field studies onstabilized waste produced at the VBM site for recipe development, quality control and support ofregulation. In: Ortiz de Urbina, G. and Goumans, J.J.J.M. (Eds.) Proceedings of WASCON 2003Waste Materials in Construction. 4-6 June, 2003, San Sebastian, Spain. CD version, ISCOWA, TheNetherlands (www.iscowa.org).
Science Report Testing of residues from incineration of municipal solid waste68
van Zomeren A., van Wetten, H., Dijkstra, J.J. van der Sloot, H.A. and Bleijerveld, R. (2003b) Longterm prediction of release from a stabilised waste monofill and identification of controlling factors. In:Proceedings Ninth International Waste Management and Landfill Symposium, 6-10 October, 2003, S.Margherita di Pula, CISA, Cagliari, Italy.
Walker, M.(Ed.). (2002) Guide to the Construction of Reinforced Concrete in the Arabian Peninsula.CIRIA Publication C577, Concrete Society Special Publication CS136.
Young, J.R., How, M.I., Walker, A.P. and Worth, W.H.M. (1988) Classification as corrosive or irritantto skin of preparations containing acidic or alkaline substances without testing on animals. Toxic InVitro 2 (1), 19-26.
Zhang, S., Herbell, J.-D. and Gaye-Haake, B. (2004) Biodegradable organic matter in municipal solidwaste incineration bottom ash. Waste Management 24 (7), 673-679.
Science Report Testing of residues from incineration of municipal solid waste 69
Appendix A: Details of sampling ofMSWI residues
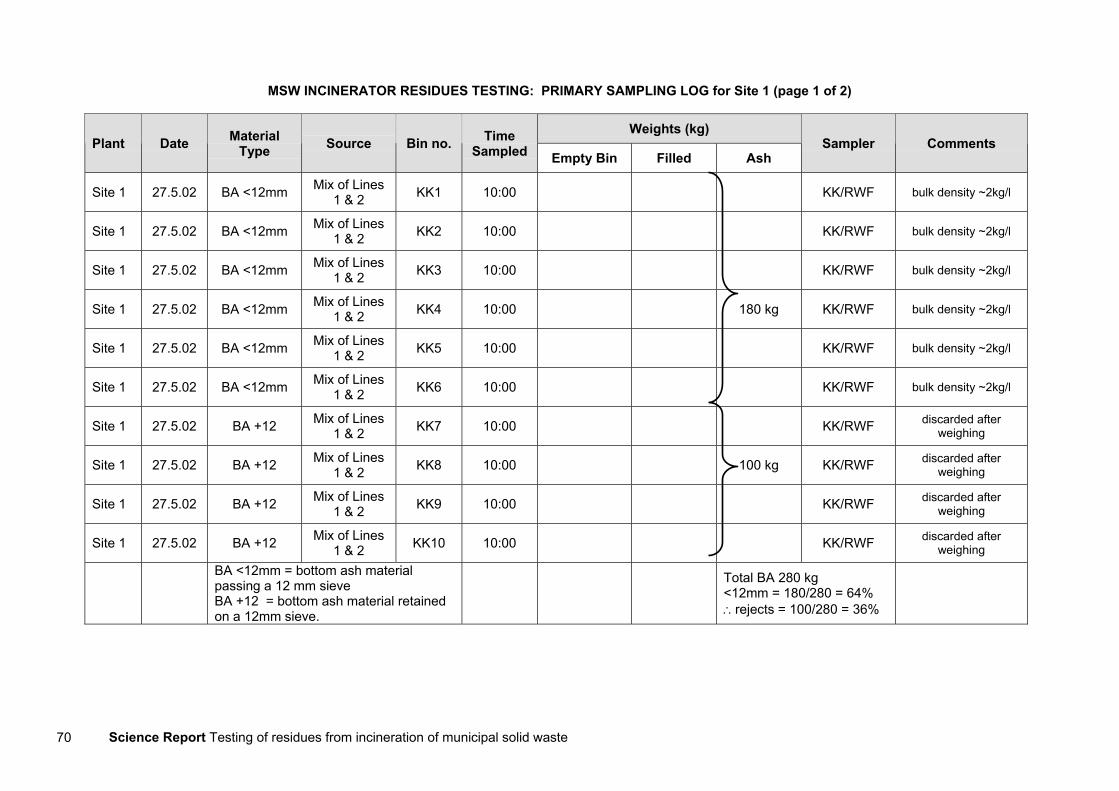
Science Report Testing of residues from incineration of municipal solid waste70
MSW INCINERATOR RESIDUES TESTING: PRIMARY SAMPLING LOG for Site 1 (page 1 of 2)
Weights (kg)Plant Date Material
Type Source Bin no. TimeSampled Empty Bin Filled Ash
Sampler Comments
Site 1 27.5.02 BA <12mm Mix of Lines1 & 2 KK1 10:00 KK/RWF bulk density ~2kg/l
Site 1 27.5.02 BA <12mm Mix of Lines1 & 2 KK2 10:00 KK/RWF bulk density ~2kg/l
Site 1 27.5.02 BA <12mm Mix of Lines1 & 2 KK3 10:00 KK/RWF bulk density ~2kg/l
Site 1 27.5.02 BA <12mm Mix of Lines1 & 2 KK4 10:00 180 kg KK/RWF bulk density ~2kg/l
Site 1 27.5.02 BA <12mm Mix of Lines1 & 2 KK5 10:00 KK/RWF bulk density ~2kg/l
Site 1 27.5.02 BA <12mm Mix of Lines1 & 2 KK6 10:00 KK/RWF bulk density ~2kg/l
Site 1 27.5.02 BA +12 Mix of Lines1 & 2 KK7 10:00 KK/RWF discarded after
weighing
Site 1 27.5.02 BA +12 Mix of Lines1 & 2 KK8 10:00 100 kg KK/RWF discarded after
weighing
Site 1 27.5.02 BA +12 Mix of Lines1 & 2 KK9 10:00 KK/RWF discarded after
weighing
Site 1 27.5.02 BA +12 Mix of Lines1 & 2 KK10 10:00 KK/RWF discarded after
weighing
BA <12mm = bottom ash materialpassing a 12 mm sieveBA +12 = bottom ash material retainedon a 12mm sieve.
Total BA 280 kg<12mm = 180/280 = 64%∴rejects = 100/280 = 36%
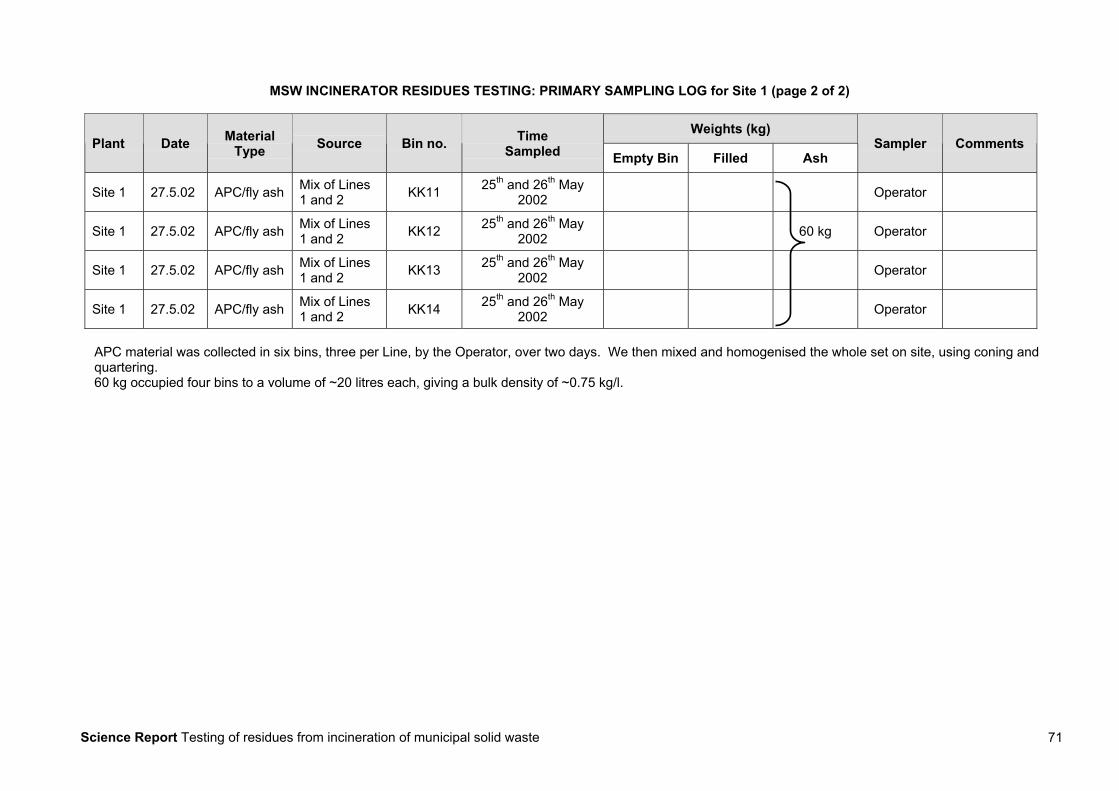
Science Report Testing of residues from incineration of municipal solid waste 71
MSW INCINERATOR RESIDUES TESTING: PRIMARY SAMPLING LOG for Site 1 (page 2 of 2)
Weights (kg)Plant Date Material
Type Source Bin no. TimeSampled Empty Bin Filled Ash
Sampler Comments
Site 1 27.5.02 APC/fly ash Mix of Lines1 and 2 KK11 25th and 26th May
2002 Operator
Site 1 27.5.02 APC/fly ash Mix of Lines1 and 2 KK12 25th and 26th May
2002 60 kg Operator
Site 1 27.5.02 APC/fly ash Mix of Lines1 and 2 KK13 25th and 26th May
2002 Operator
Site 1 27.5.02 APC/fly ash Mix of Lines1 and 2 KK14 25th and 26th May
2002 Operator
APC material was collected in six bins, three per Line, by the Operator, over two days. We then mixed and homogenised the whole set on site, using coning andquartering.60 kg occupied four bins to a volume of ~20 litres each, giving a bulk density of ~0.75 kg/l.
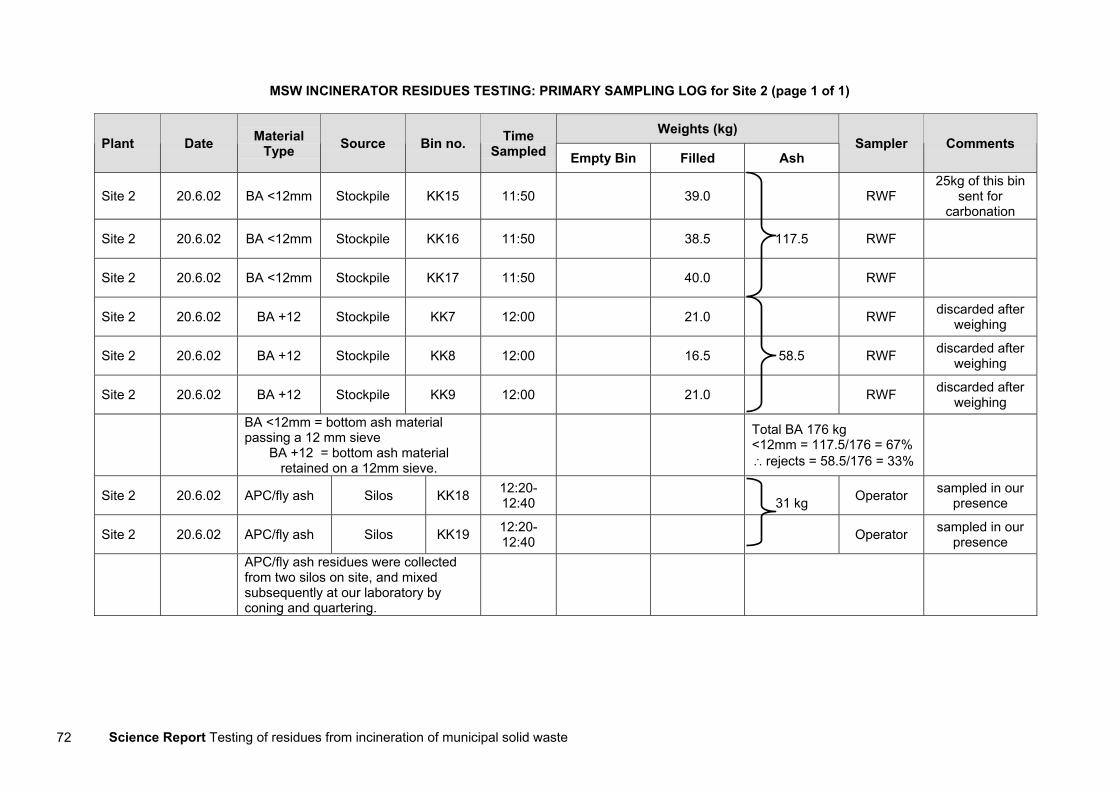
Science Report Testing of residues from incineration of municipal solid waste72
MSW INCINERATOR RESIDUES TESTING: PRIMARY SAMPLING LOG for Site 2 (page 1 of 1)
Weights (kg)Plant Date Material
Type Source Bin no. TimeSampled Empty Bin Filled Ash
Sampler Comments
Site 2 20.6.02 BA <12mm Stockpile KK15 11:50 39.0 RWF25kg of this bin
sent forcarbonation
Site 2 20.6.02 BA <12mm Stockpile KK16 11:50 38.5 117.5 RWF
Site 2 20.6.02 BA <12mm Stockpile KK17 11:50 40.0 RWF
Site 2 20.6.02 BA +12 Stockpile KK7 12:00 21.0 RWF discarded afterweighing
Site 2 20.6.02 BA +12 Stockpile KK8 12:00 16.5 58.5 RWF discarded afterweighing
Site 2 20.6.02 BA +12 Stockpile KK9 12:00 21.0 RWF discarded afterweighing
BA <12mm = bottom ash materialpassing a 12 mm sieve
BA +12 = bottom ash materialretained on a 12mm sieve.
Total BA 176 kg<12mm = 117.5/176 = 67%∴rejects = 58.5/176 = 33%
Site 2 20.6.02 APC/fly ash Silos KK18 12:20-12:40 31 kg Operator sampled in our
presence
Site 2 20.6.02 APC/fly ash Silos KK19 12:20-12:40 Operator sampled in our
presenceAPC/fly ash residues were collectedfrom two silos on site, and mixedsubsequently at our laboratory byconing and quartering.
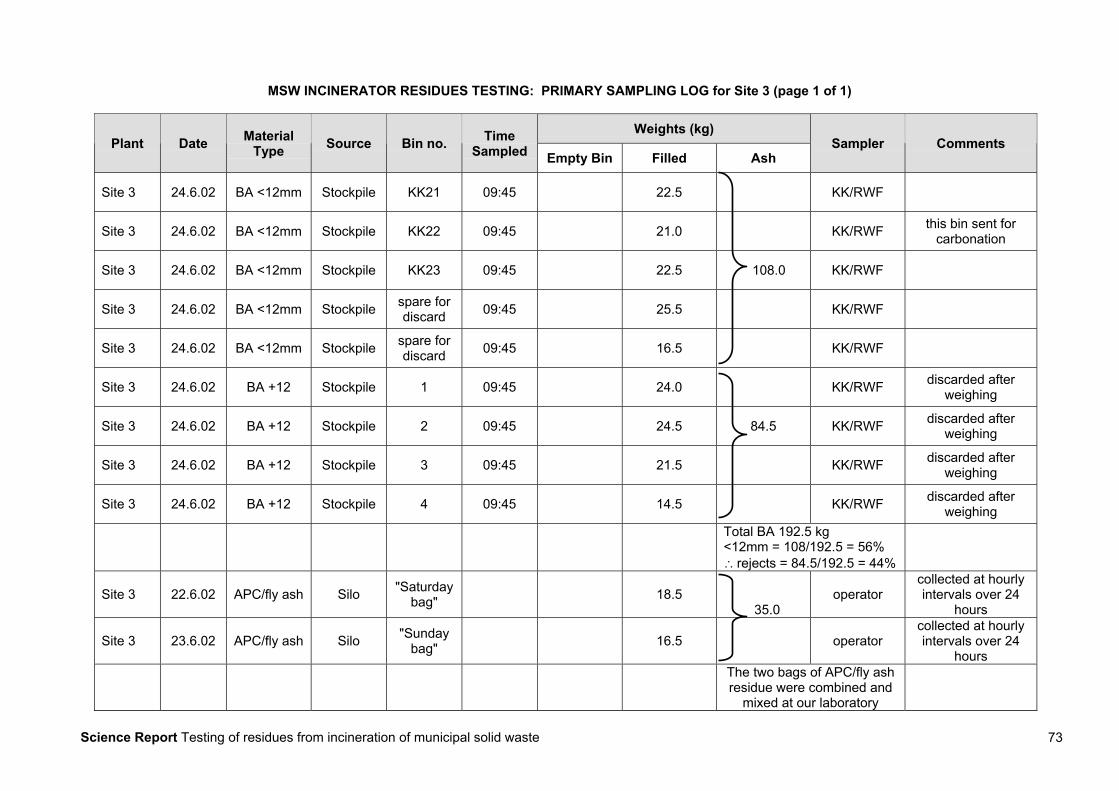
Science Report Testing of residues from incineration of municipal solid waste 73
MSW INCINERATOR RESIDUES TESTING: PRIMARY SAMPLING LOG for Site 3 (page 1 of 1)
Weights (kg)Plant Date Material
Type Source Bin no. TimeSampled Empty Bin Filled Ash
Sampler Comments
Site 3 24.6.02 BA <12mm Stockpile KK21 09:45 22.5 KK/RWF
Site 3 24.6.02 BA <12mm Stockpile KK22 09:45 21.0 KK/RWF this bin sent forcarbonation
Site 3 24.6.02 BA <12mm Stockpile KK23 09:45 22.5 108.0 KK/RWF
Site 3 24.6.02 BA <12mm Stockpile spare fordiscard 09:45 25.5 KK/RWF
Site 3 24.6.02 BA <12mm Stockpile spare fordiscard 09:45 16.5 KK/RWF
Site 3 24.6.02 BA +12 Stockpile 1 09:45 24.0 KK/RWF discarded afterweighing
Site 3 24.6.02 BA +12 Stockpile 2 09:45 24.5 84.5 KK/RWF discarded afterweighing
Site 3 24.6.02 BA +12 Stockpile 3 09:45 21.5 KK/RWF discarded afterweighing
Site 3 24.6.02 BA +12 Stockpile 4 09:45 14.5 KK/RWF discarded afterweighing
Total BA 192.5 kg<12mm = 108/192.5 = 56%∴rejects = 84.5/192.5 = 44%
Site 3 22.6.02 APC/fly ash Silo "Saturdaybag" 18.5
35.0operator
collected at hourlyintervals over 24
hours
Site 3 23.6.02 APC/fly ash Silo "Sundaybag" 16.5 operator
collected at hourlyintervals over 24
hoursThe two bags of APC/fly ashresidue were combined and
mixed at our laboratory
Science Report Testing of residues from incineration of municipal solid waste74
Appendix B: Report by LafargeEnvirocem on the carbonation ofsamples
Science Report Testing of residues from incineration of municipal solid waste 75
IntroductionAn Environment Agency project is underway to look at the carbonation of municipal solid wasteincineration (MSWI) ashes from three incinerators in the UK. Samples of bottom ash (normally acoarse clinker) and fly ash/APC residues (fine powder) were provided for carbonation by exposure toa 100% carbon dioxide atmosphere for 20 minutes.
Carbonation chamberThe carbonation chamber, which was based at Lafarge Envirocem Solutions (near Nottingham),consists of a horizontally mounted cylindrical drum fitted with a paddle blade along the central axis.The dimensions of the drum are as follows: 500 mm diameter x 700 mm length and an internalvolume of 140 litres, although the recommended working capacity is 80 litres. A 5.5 horsepower motordrives the paddle blades. The chamber is fitted with a hinged access hatch and a hand operated"bomb" door outlet. Gaseous carbon dioxide is fed into the chamber from a liquid CO2 cylinder via avaporisation unit, which consists of a series of metal tubes, so that ambient temperature converts theliquid into gas. Exhaust gases are removed via a carbon filter to the atmosphere.
MethodologyPrevious work relating to the carbonation of wastes had indicated that too much water might impedecarbonation and, therefore, the bottom ashes were dried at 50ºC (to avoid loss of organic compounds)for 3 days prior to treatment. Similar work with fine powders had also indicated that a certain amountof water was necessary to allow carbonation to proceed, the optimum being about 20% for mostmaterials. The APC residues were, therefore, mixed with 20% water in the carbonation chamber for10 minutes prior to introduction of gaseous carbon dioxide. The mixer was operated during thecarbonation time of 20 minutes, to break up any agglomerates and to continually expose freshsurfaces to the gas. On completion of treatment, the material was placed into a plastic drum andsealed. Treated samples were sent to Enviros Consulting Ltd for leach testing.
Moisture contents were obtained on receipt of the sample and before and after treatment (except forRWF1 and RWF2) and the data is recorded in Tables 1 (bottom ash) and 2 (APC residues). Thebottom ashes showed little moisture loss during treatment whilst the AP residues lost significantquantities (about 50%); probably associated with the high temperatures generated (see Table 4). Theaccelerated carbonation reaction is usually characterised by a rapid rise in temperature and it isevident that the APC residues responded better to carbonation than the bottom ashes (Table 3).
Science Report Testing of residues from incineration of municipal solid waste76
Table 1 Physical properties of the bottom ashes.
Sample Appearance Moisturecontent, as
received (%)
Moisture contentbefore treatment
(%)
Moisture contentafter treatment (%)
RWF2 Coarse greyclinker
18.7 14.1 N/K
KK15 Coarse blackclinker
35.4 18.4 15.9
KK22 Similar toKK22
18.5 13.1 13.1
Table 2 Physical properties of the APC residues
Sample Density (kg/m3) Moisturecontent, as
received (%)
Moisturecontent beforetreatment (%)
Moisturecontent aftertreatment (%)
RWF1 570 0 20 N/KKK19 619 0 20 9.7RWF3 735 0 20 9.7
Table 3 Observations during treatment of the bottom ashes
Sample Temperature beforetreatment (ºC)
Temperature aftertreatment (ºC)
Appearance aftertreatment
RWF2 15 28 Wet putty
KK15 19 24 Coarse clinker
KK22 20 31 Coarse clinker
Table 4 Observations during treatment of the APC residues
Sample Temperaturebefore treatment
(ºC)
Temperatureafter addition of
water (ºC)
Temperatureafter treatment
(ºC)
Appearance
RWF1 18 35 68 Coarse greypowder
KK19 19 35 70 Dark grey stickypowder
RWF3 20 42 75 Similar to treatedKK19
Science Report Testing of residues from incineration of municipal solid waste 77
Appendix C: Details of LS 10leaching tests
Science Report Testing of residues from incineration of municipal solid waste78
Site 1 eluate testing of MSWI residues at LS 10
Wastetype
Replicatenumber
SourceBin label
Weightused (g)
Leachantvolume
(ml)
Date &time solids
weighed
Date & timeleachant
added
Date &time roller
started
Date &time rollerstopped
Date &time
filteredDate & timeeluates split
Date sentto EA lab
APCAPCAPCAPCAPCblank
T-APCT-APCT-APCT-APCT-APC
12345
12345
1414141412-
RWF-1RWF-1RWF-1RWF-1RWF-1
90.290.490.190.190.0
-
108.3107.8107.9108.2108.1
900900900900900900
900900900900900
17/6 11.0517/6 11.1017/6 11.1517/6 11.2017/6 11.2517/6 11.00
17/6 11.3517/6 11.4517/6 11.5017/6 12.0017/6 12.10
17/6 11.0517/6 11.1017/6 11.1517/6 11.2017/6 11.2517/6 11.00
17/6 11.3517/6 11.4517/6 11.5017/6 12.0017/6 12.10
17/6 12.1017/6 12.1017/6 12.1017/6 12.1017/6 12.1017/6 12.10
17/6 12.1017/6 12.1017/6 12.1017/6 12.1017/6 12.10
notrecorded
18/6 11.0518/6 11.1518/6 11.2518/6 11.3518/6 11.4518/6 10.55
18/6 12.0018/6 12.15
not recorded 27/6/02
BABABABABA
blank
T-BAT-BAT-BAT-BAT-BA
12345
12345
KK1KK2KK3KK4KK6
-
RWF-2RWF-2RWF-2RWF-2RWF-2
111.2111.4111.5111.3111.3
-
104.5104.3104.6104.6108.0
880880880880880880
885885885885885
17.6.0217.6.0217.6.0217.6.0217.6.02
-
17.6.0217.6.0217.6.0217.6.0217.6.02
18/6 10.0018/6 10.0018/6 10.0018/6 10.0018/6 10.0018/6 10.00
18/6 10.0018/6 10.0018/6 10.0018/6 10.0018/6 10.00
18/6 10.2518/6 10.2518/6 10.2518/6 10.2518/6 10.2518/6 10.25
18/6 10.2518/6 10.2518/6 10.2518/6 10.2518/6 10.25
notrecorded
notrecorded
not recorded 27/6/02
Science Report Testing of residues from incineration of municipal solid waste 79
Site 2 eluate testing of MSWI residues at LS 10
Wastetype
Replicatenumber
SourceBin
labelWeightused (g)
Leachantvolume
(ml)
Date & timesolids
weighed
Date & timeleachant
added
Date & timeroller
started
Date &time rollerstopped
Date &time
filtereddate & timeeluates split
date sentto EA lab
APCAPCAPCAPCAPC
blank x 2
T-APCT-APCT-APCT-APCT-APC
12345
12345
Mix
KK19
90.389.990.289.890.3
99.699.899.899.799.6
900900900900900
900 x 2
890890890890890
8/7 14:008/7 14:078/7 14:148/7 14:218/7 14:28
10/7 13:1810/7 13:2310/7 13:2910/7 13:3410/7 13:39
8/7 14:018/7 14:088/7 14:158/7 14:228/7 14:298/7 14:36
10/7 13:1910/7 13:2410/7 13:3010/7 13:3510/7 13:40
8/7 14:37
10/7 13:42
notrecorded
11/7 13:04
notrecorded
11/7 14:0711/7 14:2111/7 14:3711/7 14:5311/7 15:06
10/7/0214:00-14:55
11/7 14:0811/7 14:2211/7 14:3811/7 14:5411/7 15:07
16/7/02
BABABABABA
blank x 2
TBATBATBATBATBA
12345
12345
KK17
KK15
139.1139.3139.6139.2139.3
107.3107.4107.1107.3107.1
851851851851851
900 x 2
883883883883883
8/7 13:258/7 13:328/7 13:398/7 13:468/7 13:53
10/7 12:1410/7 12:2010/7 12:2710/7 12:3110/7 12:36
8/7 13:268/7 13:338/7 13:408/7 13:478/7 13:54
10/7 12:00
10/7 12:1510/7 12:2110/7 12:2810/7 12:3210/7 12:37
8/7 14:37
10/7 13:42
notrecorded
11/7 13:04
notrecorded
11/7 13:25
11/7 16:2711/7 16:1911/7 15:4011/7 15:5511/7 16:07
10/7/0214:55-15:45
11/7 13:26
11/7 16:2811/7 16:2011/7 15:4111/7 15:5611/7 16:08
16/7/02
Science Report Testing of residues from incineration of municipal solid waste80
Site 3 eluate testing of MSWI residues at LS 10
Wastetype
Replicatenumber
SourceBin label
Weightused (g)
Leachantvolume
(ml)
Date & timesolids
weighed
Date & timeleachant
added
date & timeroller
started
date & timeroller
stoppeddate & time
filtered
date & timeeluates
splitdate sent to
EA lab
APCAPCAPCAPCAPC
blank x 2
T-APCT-APCT-APCT-APCT-APC
12345
12345
90.090.090.090.090.1
99.899.899.799.799.6
900900900900900
900 x 2
890890890890890
16/7 11:4016/7 12:0016/7 11:5416/7 11:4816/7 11:3416/7 11:40
16/7 12:2516/7 12:1016/7 12:2016/7 12:1616/7 12:05
16/7 11:4216/7 12:0116/7 11:5616/7 11:5016/7 11:3716/7 11:25
16/7 12:2816/7 12:1216/7 12:2216/7 12:1816/7 12:06
16/7/0212:28
17/7/0213:34
18/7 13:4518/7 10:4018/7 12:2518/7 13:3318/7 13:2017/7 14:0618/7 14:4518/7 14:3318/7 14:0618/7 14:2018/7 14:56
18/718/7 10:4818/7 12:3018/7 13:3918/7 13:2717/7 14:1918/7 14:5118/7 14:3918/7 14:1418/7 14:2618/7 15:05
19/7/02
BABABABABA
blank x 2
TBATBATBATBATBA
12345
12345
KK23 110.4110.2110.4110..6110.4
103.5103.5103.4103.4103.6
880880880880880
900 x 2
886886886886886
not recorded 15/7 10:3715/7 10:2915/7 10:5115/7 10:4415/7 10:5715/7 10:21
15/7 11:4115/7 11:3415/7 11:2915/7 11:2415/7 11:18
15/7/0211:41
16/7/0211:17
17/7 15:1717/7 14:3617/7 15:0517/7 14:5217/7 14:2417/7 15:43
17/7 17:1117/7 16:5817/7 16:2717/7 16:0017/7 16:16
17/7 15:2317/7 14:4517/7 15;1117/7 14:5817/7 14:3317/7 15:50
17/7 17:1617/7 17:0417/7 16:3217/7 16:0517/7 16:21
19/7/02

Science Report Testing of residues from incineration of municipal solid waste 81
Appendix D: Details of acid leachingtests at LS 10
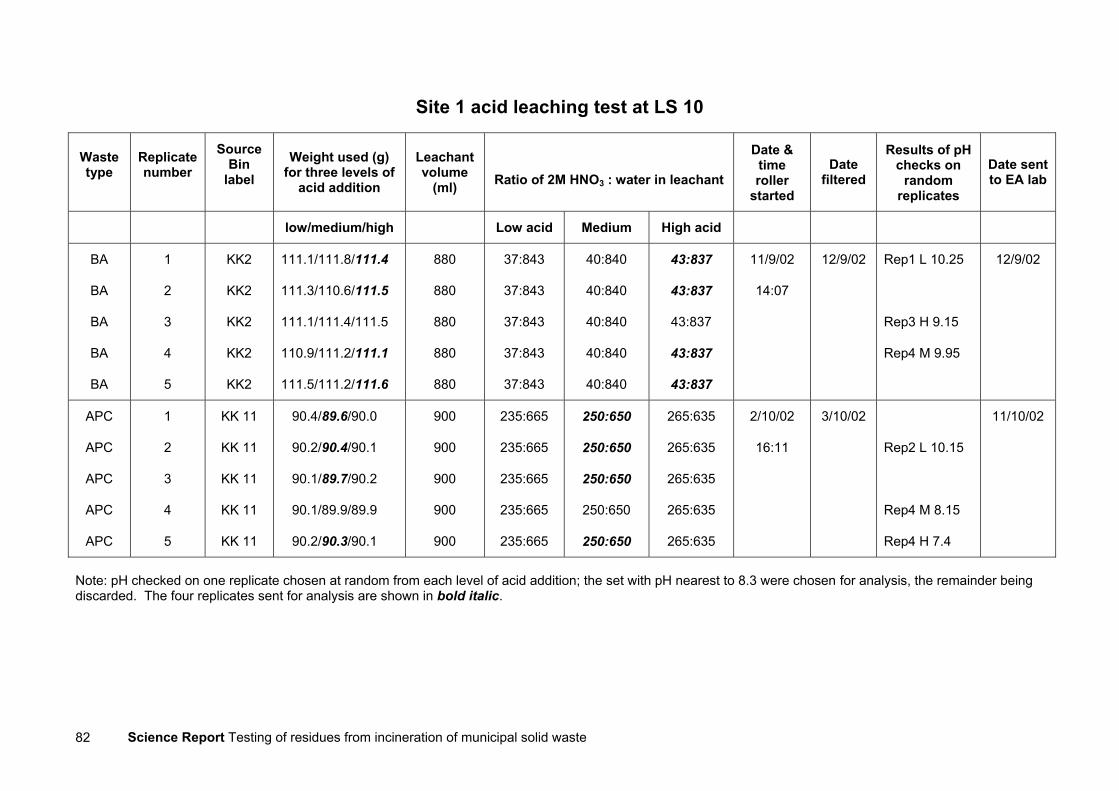
Science Report Testing of residues from incineration of municipal solid waste82
Site 1 acid leaching test at LS 10
Wastetype
Replicatenumber
SourceBin
labelWeight used (g)
for three levels ofacid addition
Leachantvolume
(ml) Ratio of 2M HNO3 : water in leachant
Date &timeroller
started
Datefiltered
Results of pHchecks on
randomreplicates
Date sentto EA lab
low/medium/high Low acid Medium High acid
BA
BA
BA
BA
BA
1
2
3
4
5
KK2
KK2
KK2
KK2
KK2
111.1/111.8/111.4
111.3/110.6/111.5
111.1/111.4/111.5
110.9/111.2/111.1
111.5/111.2/111.6
880
880
880
880
880
37:843
37:843
37:843
37:843
37:843
40:840
40:840
40:840
40:840
40:840
43:837
43:837
43:837
43:837
43:837
11/9/02
14:07
12/9/02 Rep1 L 10.25
Rep3 H 9.15
Rep4 M 9.95
12/9/02
APC
APC
APC
APC
APC
1
2
3
4
5
KK 11
KK 11
KK 11
KK 11
KK 11
90.4/89.6/90.0
90.2/90.4/90.1
90.1/89.7/90.2
90.1/89.9/89.9
90.2/90.3/90.1
900
900
900
900
900
235:665
235:665
235:665
235:665
235:665
250:650
250:650
250:650
250:650
250:650
265:635
265:635
265:635
265:635
265:635
2/10/02
16:11
3/10/02
Rep2 L 10.15
Rep4 M 8.15
Rep4 H 7.4
11/10/02
Note: pH checked on one replicate chosen at random from each level of acid addition; the set with pH nearest to 8.3 were chosen for analysis, the remainder beingdiscarded. The four replicates sent for analysis are shown in bold italic.
Science Report Testing of residues from incineration of municipal solid waste 83
Site 2 acid leaching test at LS 10
Wastetype
Replicatenumber
SourceBin label
Weight used (g)for three levels of
acid addition
Leachantvolume
(ml)Ratio of 2M HNO3 : water in leachant
Date &time roller
startedDate
filtered
Results of pHchecks on
randomreplicates
Datesent toEA lab
low/medium/high Low acid Medium High acid
BA
BA
BA
BA
BA
1
2
3
4
5
KK 16
KK 16
KK 16
KK 16
KK 16
139.4/139.3/139.6
139.6/139.1/139.8
139.0/138.8/139.0
139.1/139.4/139.8
138.7/139.6/139.2
851
851
851
851
851
27/824
27/824
27/824
27/824
27/824
29/822
29/822
29/822
29/822
29/822
31/820
31/820
31/820
31/820
31/820
9/9/02
13:07
10/9/02
Rep2 L 8.2
Rep3 M 7.95
Rep4 H 7.65
12/9/02
APC
APC
APC
APC
APC
1
2
3
4
5
Mix 90.2/90.1/90.2
90.4/89.9/89.8
90.3/90.2/89.7
89.9/90.0/90.0
90.0/90.2/90.2
900
900
900
900
900
350/550
350/550
350/550
350/550
350/550
400/500
400/500
400/500
400/500
400/500
450/450
450/450
450/450
450/450
450/450
7/10/02
12:46
8/10/02
Rep5 L 11.15
Rep5 M 8.40
Rep5 H 4.55
11/10/02
Note: pH checked on one replicate chosen at random from each level of acid addition; the set with pH nearest to 8.3 were chosen for analysis, the remainder beingdiscarded. The four replicates sent for analysis are shown in bold italic.
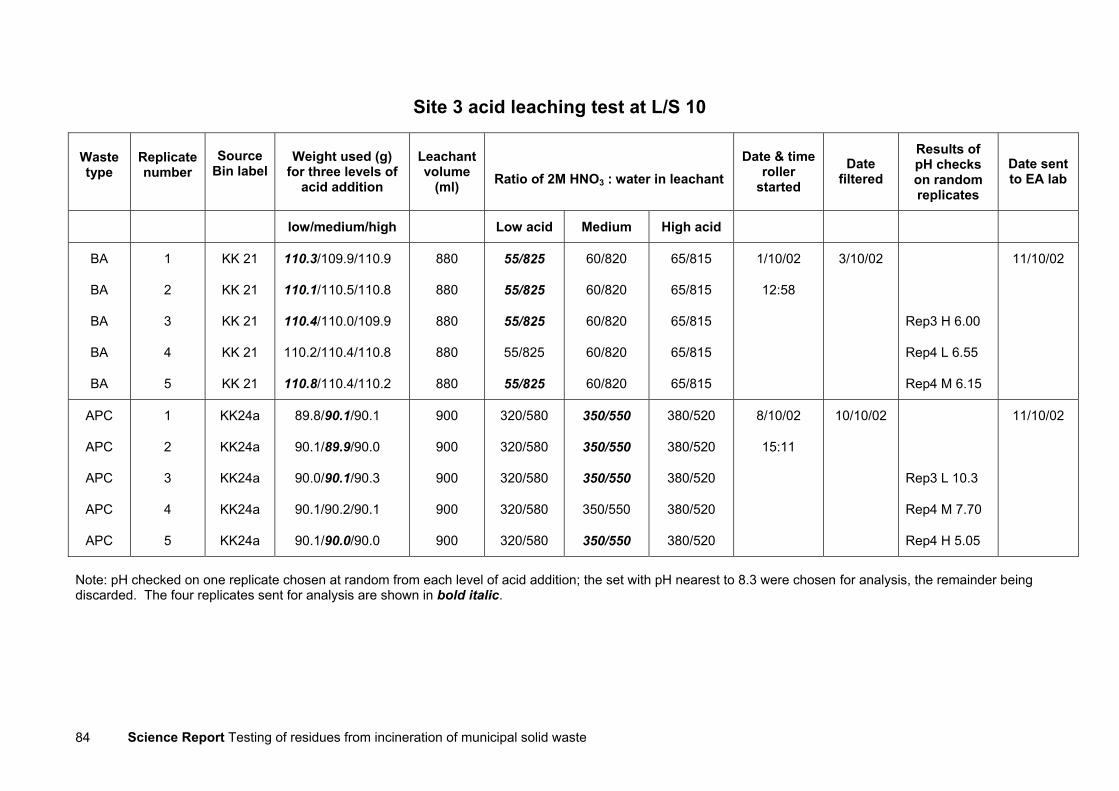
Science Report Testing of residues from incineration of municipal solid waste84
Site 3 acid leaching test at L/S 10
Wastetype
Replicatenumber
SourceBin label
Weight used (g)for three levels of
acid addition
Leachantvolume
(ml) Ratio of 2M HNO3 : water in leachantDate & time
rollerstarted
Datefiltered
Results ofpH checkson randomreplicates
Date sentto EA lab
low/medium/high Low acid Medium High acid
BA
BA
BA
BA
BA
1
2
3
4
5
KK 21
KK 21
KK 21
KK 21
KK 21
110.3/109.9/110.9
110.1/110.5/110.8
110.4/110.0/109.9
110.2/110.4/110.8
110.8/110.4/110.2
880
880
880
880
880
55/825
55/825
55/825
55/825
55/825
60/820
60/820
60/820
60/820
60/820
65/815
65/815
65/815
65/815
65/815
1/10/02
12:58
3/10/02
Rep3 H 6.00
Rep4 L 6.55
Rep4 M 6.15
11/10/02
APC
APC
APC
APC
APC
1
2
3
4
5
KK24a
KK24a
KK24a
KK24a
KK24a
89.8/90.1/90.1
90.1/89.9/90.0
90.0/90.1/90.3
90.1/90.2/90.1
90.1/90.0/90.0
900
900
900
900
900
320/580
320/580
320/580
320/580
320/580
350/550
350/550
350/550
350/550
350/550
380/520
380/520
380/520
380/520
380/520
8/10/02
15:11
10/10/02
Rep3 L 10.3
Rep4 M 7.70
Rep4 H 5.05
11/10/02
Note: pH checked on one replicate chosen at random from each level of acid addition; the set with pH nearest to 8.3 were chosen for analysis, the remainder beingdiscarded. The four replicates sent for analysis are shown in bold italic.
Science Report Testing of residues from incineration of municipal solid waste 85
Appendix E: Stage 3 column tests -conductivity results and graphs
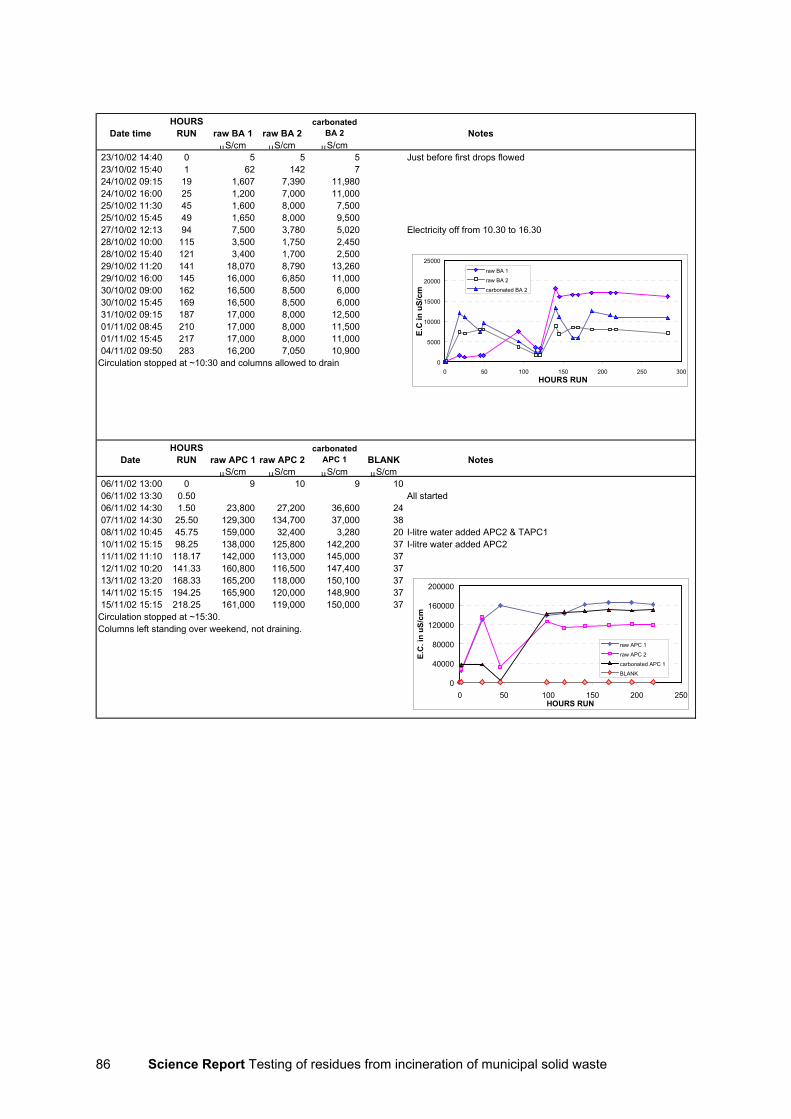
Science Report Testing of residues from incineration of municipal solid waste86
Date timeHOURS
RUN raw BA 1 raw BA 2carbonated
BA 2 NotesµS/cm µS/cm µS/cm
23/10/02 14:40 0 5 5 5 Just before first drops flowed23/10/02 15:40 1 62 142 724/10/02 09:15 19 1,607 7,390 11,98024/10/02 16:00 25 1,200 7,000 11,00025/10/02 11:30 45 1,600 8,000 7,50025/10/02 15:45 49 1,650 8,000 9,50027/10/02 12:13 94 7,500 3,780 5,020 Electricity off from 10.30 to 16.3028/10/02 10:00 115 3,500 1,750 2,45028/10/02 15:40 121 3,400 1,700 2,50029/10/02 11:20 141 18,070 8,790 13,26029/10/02 16:00 145 16,000 6,850 11,00030/10/02 09:00 162 16,500 8,500 6,00030/10/02 15:45 169 16,500 8,500 6,00031/10/02 09:15 187 17,000 8,000 12,50001/11/02 08:45 210 17,000 8,000 11,50001/11/02 15:45 217 17,000 8,000 11,00004/11/02 09:50 283 16,200 7,050 10,900
Circulation stopped at ~10:30 and columns allowed to drain
DateHOURS
RUN raw APC 1 raw APC 2carbonated
APC 1 BLANK NotesµS/cm µS/cm µS/cm µS/cm
06/11/02 13:00 0 9 10 9 1006/11/02 13:30 0.50 All started06/11/02 14:30 1.50 23,800 27,200 36,600 2407/11/02 14:30 25.50 129,300 134,700 37,000 3808/11/02 10:45 45.75 159,000 32,400 3,280 20 I-litre water added APC2 & TAPC110/11/02 15:15 98.25 138,000 125,800 142,200 37 I-litre water added APC2 11/11/02 11:10 118.17 142,000 113,000 145,000 3712/11/02 10:20 141.33 160,800 116,500 147,400 3713/11/02 13:20 168.33 165,200 118,000 150,100 3714/11/02 15:15 194.25 165,900 120,000 148,900 3715/11/02 15:15 218.25 161,000 119,000 150,000 37
Circulation stopped at ~15:30.Columns left standing over weekend, not draining.
0
5000
10000
15000
20000
25000
0 50 100 150 200 250 300HOURS RUN
E.C
in u
S/cm
raw BA 1
raw BA 2
carbonated BA 2
0
40000
80000
120000
160000
200000
0 50 100 150 200 250HOURS RUN
E.C
. in
uS/c
m
raw APC 1
raw APC 2
carbonated APC 1
BLANK
Science Report Testing of residues from incineration of municipal solid waste 87
Appendix F: Log of laboratoryanalysis of solids and eluates
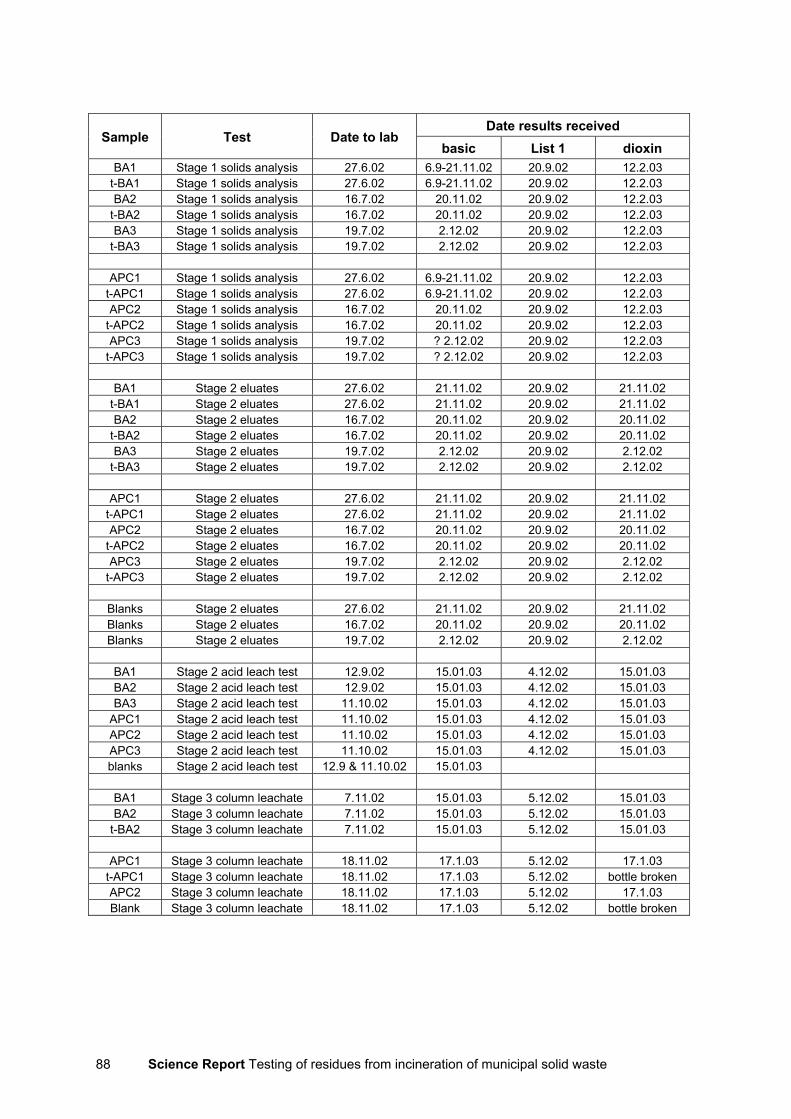
Science Report Testing of residues from incineration of municipal solid waste88
Date results receivedSample Test Date to lab
basic List 1 dioxinBA1 Stage 1 solids analysis 27.6.02 6.9-21.11.02 20.9.02 12.2.03
t-BA1 Stage 1 solids analysis 27.6.02 6.9-21.11.02 20.9.02 12.2.03BA2 Stage 1 solids analysis 16.7.02 20.11.02 20.9.02 12.2.03
t-BA2 Stage 1 solids analysis 16.7.02 20.11.02 20.9.02 12.2.03BA3 Stage 1 solids analysis 19.7.02 2.12.02 20.9.02 12.2.03
t-BA3 Stage 1 solids analysis 19.7.02 2.12.02 20.9.02 12.2.03
APC1 Stage 1 solids analysis 27.6.02 6.9-21.11.02 20.9.02 12.2.03t-APC1 Stage 1 solids analysis 27.6.02 6.9-21.11.02 20.9.02 12.2.03APC2 Stage 1 solids analysis 16.7.02 20.11.02 20.9.02 12.2.03
t-APC2 Stage 1 solids analysis 16.7.02 20.11.02 20.9.02 12.2.03APC3 Stage 1 solids analysis 19.7.02 ? 2.12.02 20.9.02 12.2.03
t-APC3 Stage 1 solids analysis 19.7.02 ? 2.12.02 20.9.02 12.2.03
BA1 Stage 2 eluates 27.6.02 21.11.02 20.9.02 21.11.02t-BA1 Stage 2 eluates 27.6.02 21.11.02 20.9.02 21.11.02BA2 Stage 2 eluates 16.7.02 20.11.02 20.9.02 20.11.02
t-BA2 Stage 2 eluates 16.7.02 20.11.02 20.9.02 20.11.02BA3 Stage 2 eluates 19.7.02 2.12.02 20.9.02 2.12.02
t-BA3 Stage 2 eluates 19.7.02 2.12.02 20.9.02 2.12.02
APC1 Stage 2 eluates 27.6.02 21.11.02 20.9.02 21.11.02t-APC1 Stage 2 eluates 27.6.02 21.11.02 20.9.02 21.11.02APC2 Stage 2 eluates 16.7.02 20.11.02 20.9.02 20.11.02
t-APC2 Stage 2 eluates 16.7.02 20.11.02 20.9.02 20.11.02APC3 Stage 2 eluates 19.7.02 2.12.02 20.9.02 2.12.02
t-APC3 Stage 2 eluates 19.7.02 2.12.02 20.9.02 2.12.02
Blanks Stage 2 eluates 27.6.02 21.11.02 20.9.02 21.11.02Blanks Stage 2 eluates 16.7.02 20.11.02 20.9.02 20.11.02Blanks Stage 2 eluates 19.7.02 2.12.02 20.9.02 2.12.02
BA1 Stage 2 acid leach test 12.9.02 15.01.03 4.12.02 15.01.03BA2 Stage 2 acid leach test 12.9.02 15.01.03 4.12.02 15.01.03BA3 Stage 2 acid leach test 11.10.02 15.01.03 4.12.02 15.01.03
APC1 Stage 2 acid leach test 11.10.02 15.01.03 4.12.02 15.01.03APC2 Stage 2 acid leach test 11.10.02 15.01.03 4.12.02 15.01.03APC3 Stage 2 acid leach test 11.10.02 15.01.03 4.12.02 15.01.03blanks Stage 2 acid leach test 12.9 & 11.10.02 15.01.03
BA1 Stage 3 column leachate 7.11.02 15.01.03 5.12.02 15.01.03BA2 Stage 3 column leachate 7.11.02 15.01.03 5.12.02 15.01.03
t-BA2 Stage 3 column leachate 7.11.02 15.01.03 5.12.02 15.01.03
APC1 Stage 3 column leachate 18.11.02 17.1.03 5.12.02 17.1.03t-APC1 Stage 3 column leachate 18.11.02 17.1.03 5.12.02 bottle brokenAPC2 Stage 3 column leachate 18.11.02 17.1.03 5.12.02 17.1.03Blank Stage 3 column leachate 18.11.02 17.1.03 5.12.02 bottle broken
Science Report Testing of residues from incineration of municipal solid waste 89
Appendix G: Results of List 1 traceorganic scan on solid MSWIresidues
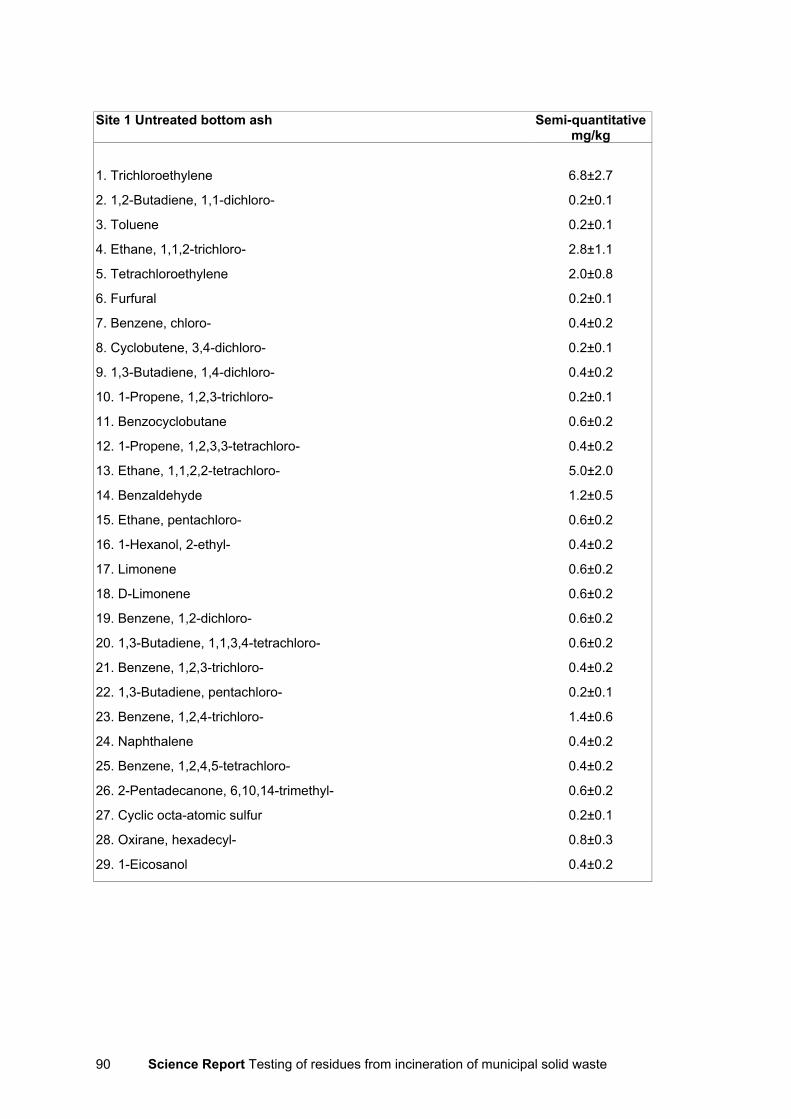
Science Report Testing of residues from incineration of municipal solid waste90
Site 1 Untreated bottom ash Semi-quantitativemg/kg
1. Trichloroethylene 6.8±2.7
2. 1,2-Butadiene, 1,1-dichloro- 0.2±0.1
3. Toluene 0.2±0.1
4. Ethane, 1,1,2-trichloro- 2.8±1.1
5. Tetrachloroethylene 2.0±0.8
6. Furfural 0.2±0.1
7. Benzene, chloro- 0.4±0.2
8. Cyclobutene, 3,4-dichloro- 0.2±0.1
9. 1,3-Butadiene, 1,4-dichloro- 0.4±0.2
10. 1-Propene, 1,2,3-trichloro- 0.2±0.1
11. Benzocyclobutane 0.6±0.2
12. 1-Propene, 1,2,3,3-tetrachloro- 0.4±0.2
13. Ethane, 1,1,2,2-tetrachloro- 5.0±2.0
14. Benzaldehyde 1.2±0.5
15. Ethane, pentachloro- 0.6±0.2
16. 1-Hexanol, 2-ethyl- 0.4±0.2
17. Limonene 0.6±0.2
18. D-Limonene 0.6±0.2
19. Benzene, 1,2-dichloro- 0.6±0.2
20. 1,3-Butadiene, 1,1,3,4-tetrachloro- 0.6±0.2
21. Benzene, 1,2,3-trichloro- 0.4±0.2
22. 1,3-Butadiene, pentachloro- 0.2±0.1
23. Benzene, 1,2,4-trichloro- 1.4±0.6
24. Naphthalene 0.4±0.2
25. Benzene, 1,2,4,5-tetrachloro- 0.4±0.2
26. 2-Pentadecanone, 6,10,14-trimethyl- 0.6±0.2
27. Cyclic octa-atomic sulfur 0.2±0.1
28. Oxirane, hexadecyl- 0.8±0.3
29. 1-Eicosanol 0.4±0.2
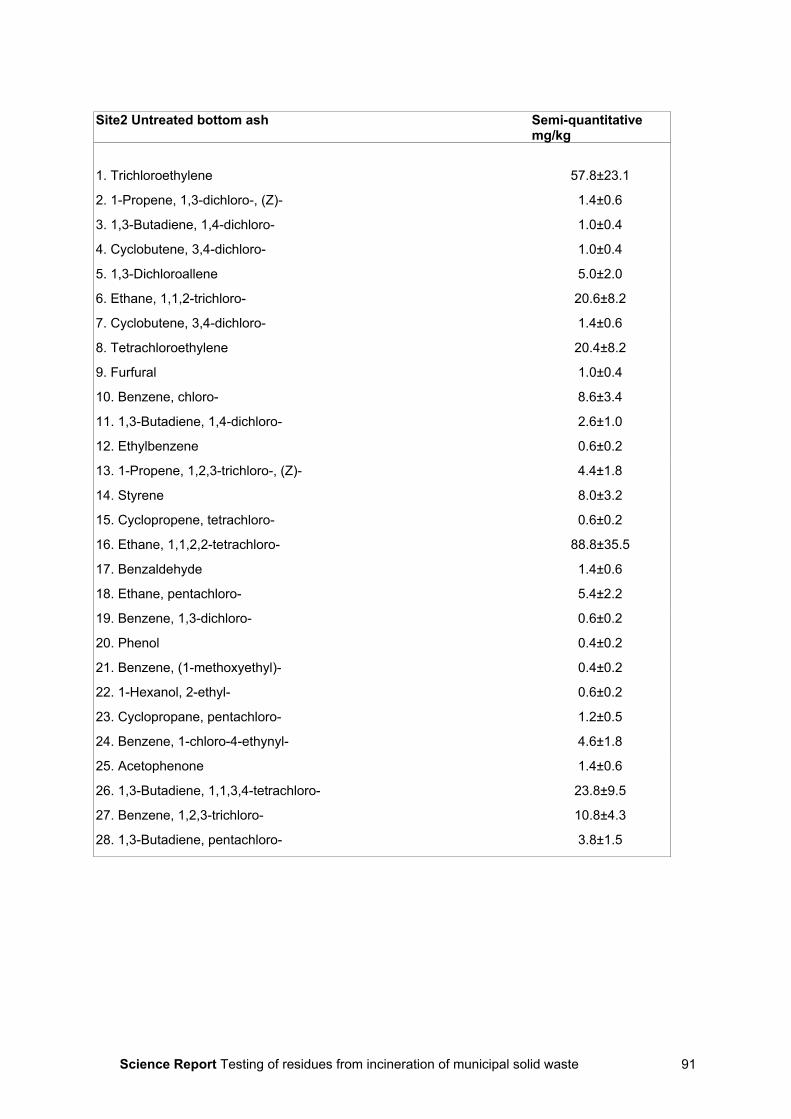
Science Report Testing of residues from incineration of municipal solid waste 91
Site2 Untreated bottom ash Semi-quantitativemg/kg
1. Trichloroethylene 57.8±23.1
2. 1-Propene, 1,3-dichloro-, (Z)- 1.4±0.6
3. 1,3-Butadiene, 1,4-dichloro- 1.0±0.4
4. Cyclobutene, 3,4-dichloro- 1.0±0.4
5. 1,3-Dichloroallene 5.0±2.0
6. Ethane, 1,1,2-trichloro- 20.6±8.2
7. Cyclobutene, 3,4-dichloro- 1.4±0.6
8. Tetrachloroethylene 20.4±8.2
9. Furfural 1.0±0.4
10. Benzene, chloro- 8.6±3.4
11. 1,3-Butadiene, 1,4-dichloro- 2.6±1.0
12. Ethylbenzene 0.6±0.2
13. 1-Propene, 1,2,3-trichloro-, (Z)- 4.4±1.8
14. Styrene 8.0±3.2
15. Cyclopropene, tetrachloro- 0.6±0.2
16. Ethane, 1,1,2,2-tetrachloro- 88.8±35.5
17. Benzaldehyde 1.4±0.6
18. Ethane, pentachloro- 5.4±2.2
19. Benzene, 1,3-dichloro- 0.6±0.2
20. Phenol 0.4±0.2
21. Benzene, (1-methoxyethyl)- 0.4±0.2
22. 1-Hexanol, 2-ethyl- 0.6±0.2
23. Cyclopropane, pentachloro- 1.2±0.5
24. Benzene, 1-chloro-4-ethynyl- 4.6±1.8
25. Acetophenone 1.4±0.6
26. 1,3-Butadiene, 1,1,3,4-tetrachloro- 23.8±9.5
27. Benzene, 1,2,3-trichloro- 10.8±4.3
28. 1,3-Butadiene, pentachloro- 3.8±1.5
Science Report Testing of residues from incineration of municipal solid waste92
Sample 287827 Site2 Raw BA (continued) Semi-Quantmg/kg
29. 1,3-Cyclopentadiene, 1,2,3,4-tetrachloro- 1.0±0.4
30. Benzoic Acid 0.8±0.3
31. Benzene,1,4-diethynyl- 0.4±0.2
32. Naphthalene 2.0±0.8
33. Benzene, 1,2,4,5-tetrachloro- 14.8±5.9
34. Naphthalene, 2-chloro- 1.8±0.7
35. Benzene, pentachloro- 4.0±1.6
36. 3-Hexadecene, (Z)- 0.8±0.3
37. Hexadecane 0.4±0.2
38. Naphthalene, 1,2-dichloro- 1.2±0.5
39. Benzene, 1,1'-(1,3-propanediyl)bis- 0.6±0.2
40. Methyl tetradecanoate 0.8±0.3
41. Naphthalene, 2,3,6-trichloro- 0.4±0.2
42. Naphthalene, 2,3,6-trichloro- 2.0±0.8
43. Naphthalene, 2,3,6-trichloro- 2.0±0.8
44. Anthracene 1.0±0.4
45. 1,14-Tetradecanediol 0.4±0.2
46. 1-Octadecene 0.6±0.2
47. Naphthalene, 1,2,3,4-tetrachloro- 1.6±0.6
48. Hexadecanoic acid, methyl ester 12.2±4.9
49. n-Hexadecanoic acid 62.2±24.9
50. Naphthalene, 2-phenyl- 0.6±0.2
51. 11-Octadecenoic acid, methyl ester, (Z)- 22.8±9.1
52. Ethyl Oleate 4.6±1.8
53. 9-Octadecenoic acid, (E)- 49.6±19.8
54. Octadecanoic acid 25.2±10.1
55. 1,1':3',1''-Terphenyl, 5'-phenyl- 1.4±0.6
56. 3-Chloro-17-(1,5-dimethylhexyl)-10,13-dimethyl-2,3,4,7,8,9,10,11,12,13,14,15,16,17-tetradecahydro-1H-cyclopenta[a]phenanthrene
27.2±10.9
Science Report Testing of residues from incineration of municipal solid waste 93
Site3 Untreated bottom ash Semi-quantitativemg/kg
1. 1,2-Propadiene, 1,1-dichloro- 30± 12
2. 1-Propene, 1,3-dichloro-, (E)- 120± 48
3. 1,3-Butadiene, 1,4-dichloro- 102± 40
4. 1,3-Dichloroallene 160± 64
5. Tetrachloroethylene 1444± 577
6. Benzene, chloro- 38± 15
7. Cyclobutene, 3,4-dichloro- 128± 51
8. 1-Propene, 1,2,3-trichloro-, (Z)- 180± 72
9. Furfural 22± 8
10. Benzene, chloro- 542± 216
11. Ethane, 1,1,1,2-tetrachloro- 168± 67
12. Phenylethyne 94± 37
13. Benzocyclobutane 868± 347
14. Cyclopropene, tetrachloro- 88± 35
15. 1,2-Butadiene, 1,1,4-trichloro- 58± 23
16. Ethane, 1,1,2,2-tetrachloro- 4020± 1608
17. Benzaldehyde 198± 79
18. à-Methylstyrene 24± 9
19. Ethane, pentachloro- 394± 157
20. 1-Propene, 1,2,3,3-tetrachloro- 46± 18
21. Benzene, 1,2-dichloro- 998± 399
22. Benzene, 1-chloro-4-ethynyl- 236± 94
23. 1-Propene, pentachloro- 22± 8
24. Benzene, 1,3-dichloro- 96± 38
25. 1,3-Butadiene, 1,1,3,4-tetrachloro- 840± 336
26. Benzene, 1,2,4-trichloro- 572± 228
27. 1,3-Butadiene, pentachloro- 212± 84
28. Naphthalene 26± 10
Science Report Testing of residues from incineration of municipal solid waste94
Site3 Untreated bottom ash (continued) Semi-quantitativemg/kg
29. 1,3-Cyclopentadiene, 1,2,3,4-tetrachloro- 28± 11
30. Benzene, 1,2,4-trichloro- 2442± 976
31. Naphthalene 68± 27
32. Benzene, 1,2,3-trichloro- 882± 352
33. 2,6-Dichlorostyrene 76± 30
34. Benzene, 1,2-dichloro-4-(chloromethyl)- 22± 8
35. Benzene, 1,2,4,5-tetrachloro- 734± 293
36. Benzene, 2,4-dichloro-1-(chloromethyl)- 52± 20
37. Benzene, 1,4-dichloro-2-(2-chloroethenyl)- 30± 12
38. Naphthalene, 2-chloro- 146± 58
39. Benzene, 1-chloro-4-(trichloromethyl)- 22± 8
40. Benzene, 1,4-dichloro-2-(2-chloroethenyl)- 68± 27
41. Benzene, pentachloro- 258± 103
42. Naphthalene, 1,4-dichloro- 250± 100
43. Naphthalene, 2,3,6-trichloro- 180± 72
44. Hexadecanal 36± 14
45. 2-Pentadecanone, 6,10,14-trimethyl- 232± 92
46. Naphthalene, 1,3,5,7-tetrachloro- 86± 34
47. Hexadecanoic acid, methyl ester 120± 48
48. Naphthalene, 1,2,3,4-tetrachloro- 172± 68
49. n-Hexadecanoic acid 74± 29
50. Naphthalene, 2-phenyl- 20± 8
51. 9-Octadecenoic acid (Z)-, methyl ester 114± 45
52. Pyrene 22± 8
53. 1,14-Tetradecanediol 20± 8
54. Anthracene, 9,10-dichloro- 28± 11
Science Report Testing of residues from incineration of municipal solid waste 95
Site 1 Carbonated bottom ash Semi-quantitativemg/kg
1. Toluene 0.4±0.2
2. Ethane, 1,1,2-trichloro- 0.2±0.1
3. Furfural 0.2±0.1
4. Bicyclo[4.2.0]octa-1,3,5-triene 0.2±0.1
5. Ethane, 1,1,2,2-tetrachloro- 0.4±0.2
6. Benzaldehyde 0.6±0.2
7. Limonene 0.6±0.2
8. Naphthalene 0.2±0.1
9. 2-Pentadecanone, 6,10,14-trimethyl- 0.4±0.2
10. Hexadecanoic acid, methyl ester 0.4±0.2
11. 9-Octadecenoic acid (Z)-, methyl ester 0.8±0.3
12. Phytol 0.8±0.3
13. Cyclic octatomic sulfur 1.6±0.6
14. 2-Propenoic acid, 3-(4-methoxyphenyl)-, 2-ethylhexyl ester 0.4±0.2
15. Nonanedioic acid, bis(2-ethylhexyl) ester 1.0±0.4
16. Squalene 1.0±0.4
17. Pentadecanal- 0.4±0.2
Science Report Testing of residues from incineration of municipal solid waste96
Site2 Carbonated bottom ash Semi-quantitativemg/kg
1. Trichloroethylene 0.6±0.2
2. Toluene 0.4±0.2
3. Ethane, 1,1,2-trichloro- 0.2±0.1
4. Hexanal 0.4±0.2
5. Furfural 0.8±0.3
6. Styrene 0.6±0.2
7. Ethane, 1,1,2,2-tetrachloro- 0.6±0.2
8. 5-methyl furfural 0.2±0.1
9. Benzaldehyde 1.0±0.4
10. Phenol 0.2±0.1
11. 1-Hexanol, 2-ethyl- 0.2±0.1
12. D-Limonene 1.2±0.5
13. Acetophenone 0.2±0.1
14. Nonanal 0.2±0.1
15. Naphthalene 0.6±0.2
16. Ethanol, 2-phenoxy- 0.2±0.1
17. 1,4:3,6-Dianhydro-à-d-glucopyranose 0.4±0.2
18. 2-Undecenal 0.2±0.1
19. Biphenyl 0.4±0.2
20. 1-Hexanone, 1-phenyl- 0.2±0.1
21. 1-Octadecene 0.2±0.1
22. 1,3-Diphenylpropane 0.2±0.1
23. 1-Octadecene 0.2±0.1
24. Phenanthrene 0.4±0.2
25. 2-Pentadecanone, 6,10,14-trimethyl- 0.4±0.2
26. Caffeine 0.2±0.1
27. Hexadecanenitrile 0.2±0.1
28. Hexadecanoic acid, methyl ester 0.4±0.2
Science Report Testing of residues from incineration of municipal solid waste 97
Site2 Carbonated bottom ash (continued) Semi-quantitativemg/kg
29. n-Hexadecanoic acid 0.8±0.3
30. Dibutyl phthalate 0.2±0.1
31. 1-Octadecene 0.2±0.1
32. 2-Phenylnaphthalene 0.2±0.1
33. 1,15-Pentadecanediol 0.2±0.1
34. 1-Nonadecene 0.2±0.1
35. 9-Octadecenoic acid (Z)-, methyl ester 1.0±0.4
36. Fluoranthene 0.4±0.2
37. Ethyl Oleate 0.6±0.2
38. Pyrene 0.4±0.2
39. Parsol MCX 0.4±0.2
40. 1-Nonadecene 0.4±0.2
41. Bisphenol A 0.2±0.1
42. Phenanthrene, 2,4,5,7-tetramethyl- 0.4±0.2
43. 1,15-Pentadecanediol 0.4±0.2
44. 1,3,5-Triphenylbenzene 0.6±0.2
Science Report Testing of residues from incineration of municipal solid waste98
Site3 Carbonated bottom ash Semi-quantitativemg/kg
1. Ethane, 1,1,2-trichloro- 0.4±0.2
2. Styrene 0.4±0.2
3. Ethane, 1,1,2,2-tetrachloro- 0.8±0.3
4. Benzaldehyde 1.0±0.4
5. 2-Pentadecanone, 6,10,14-trimethyl- 1.4±0.6
6. 3,7,11,15-Tetramethyl-2-hexadecen-1-ol 0.4±0.2
7. 9-Octadecenoic acid (Z)-, methyl ester 0.4±0.2
8. 3,7,11,15-Tetramethyl-2-hexadecen-1-ol 4.4±1.8
9. Cyclic octaatomic sulfur 1.0±0.4
10. 9,12-Octadecadienoic acid, ethyl ester 1.8±0.7
11. Ethyl 9-octadecenoate, (E)- 5.4±2.2
12. Hexadecanamide 1.0±0.4
13. Bisphenol A 0.4±0.2
14. 9-Octadecenamide, (Z)- 0.6±0.2
15. Pentadecanal- 1.2±0.5
Science Report Testing of residues from incineration of municipal solid waste 99
Site 1 Untreated APC residues Semi-quantitativemg/kg
1. Trichloroethylene 9.0±3.6
2. 1,3-Dichloroallene 0.8±0.3
3. Toluene 0.4±0.2
4. Ethane, 1,1,2-trichloro- 2.4±1.0
5. Tetrachloroethylene 1.8±0.7
6. Benzene, chloro- 1.0±0.4
7. 1,3-Butadiene, 1,4-dichloro- 0.2±0.1
8. Ethane, 1,1,2,2-tetrachloro- 15.0±6.0
9. Ethane, pentachloro- 0.4±0.2
10. 1,3-Butadiene, 1,1,3,4-tetrachloro- 0.4±0.2
11. Benzene, 1,4-dichloro- 2.2±0.9
12. Benzene, 1-chloro-4-ethynyl- 0.8±0.3
13. Benzene, 1,2-dichloro- 0.2±0.1
14. 1,3-Butadiene, 1,1,3,4-tetrachloro- 3.4±1.4
15. 1,3-Butadiene, 1,1,3,4-tetrachloro- 1.0±0.4
16. Benzene, 1,2,3-trichloro- 1.2±0.5
17. 1,3-Butadiene, pentachloro- 0.4±0.2
18. Benzene, 1,2,4-trichloro- 6.2±2.5
19. Naphthalene 0.2±0.1
20. Benzene, 1,2,4,5-tetrachloro- 1.2±0.5
21. Benzene, pentachloro- 0.4±0.2
22. Naphthalene, 2,3-dichloro- 0.2±0.1
23. Naphthalene, 1,4-dichloro- 0.2±0.1
24. Hexanedioic acid, bis(2-ethylhexyl) ester 0.6±0.2
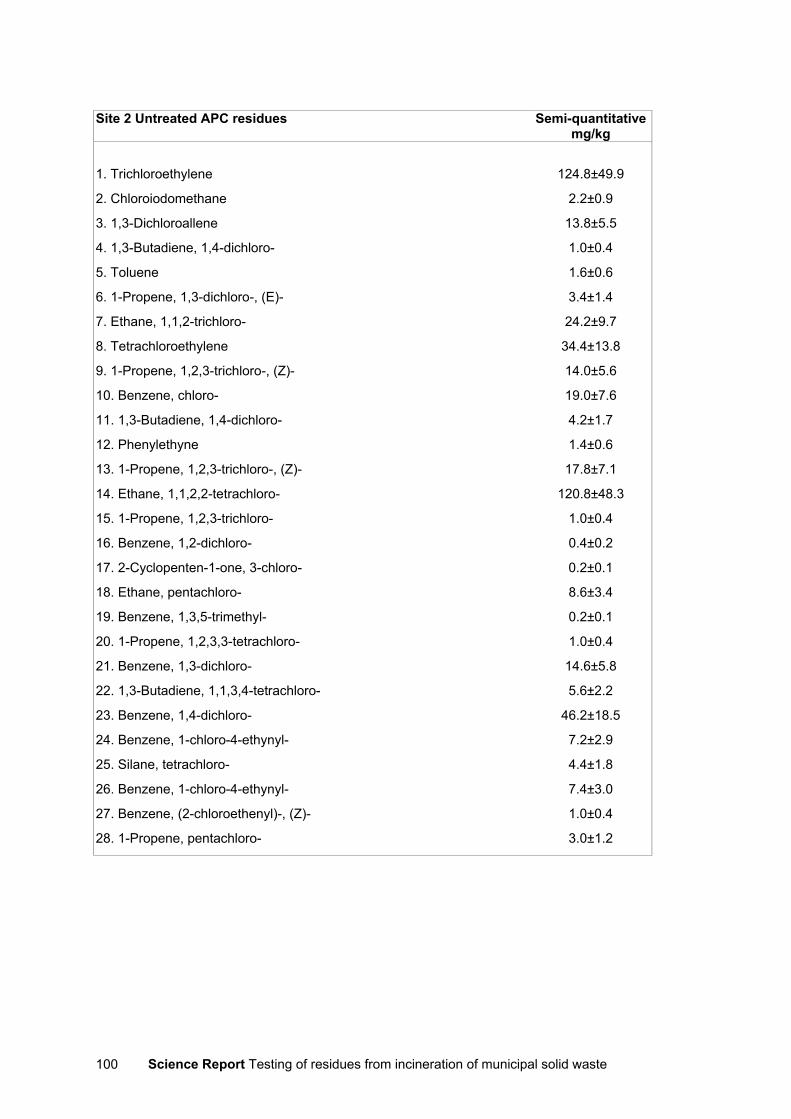
Science Report Testing of residues from incineration of municipal solid waste100
Site 2 Untreated APC residues Semi-quantitativemg/kg
1. Trichloroethylene 124.8±49.9
2. Chloroiodomethane 2.2±0.9
3. 1,3-Dichloroallene 13.8±5.5
4. 1,3-Butadiene, 1,4-dichloro- 1.0±0.4
5. Toluene 1.6±0.6
6. 1-Propene, 1,3-dichloro-, (E)- 3.4±1.4
7. Ethane, 1,1,2-trichloro- 24.2±9.7
8. Tetrachloroethylene 34.4±13.8
9. 1-Propene, 1,2,3-trichloro-, (Z)- 14.0±5.6
10. Benzene, chloro- 19.0±7.6
11. 1,3-Butadiene, 1,4-dichloro- 4.2±1.7
12. Phenylethyne 1.4±0.6
13. 1-Propene, 1,2,3-trichloro-, (Z)- 17.8±7.1
14. Ethane, 1,1,2,2-tetrachloro- 120.8±48.3
15. 1-Propene, 1,2,3-trichloro- 1.0±0.4
16. Benzene, 1,2-dichloro- 0.4±0.2
17. 2-Cyclopenten-1-one, 3-chloro- 0.2±0.1
18. Ethane, pentachloro- 8.6±3.4
19. Benzene, 1,3,5-trimethyl- 0.2±0.1
20. 1-Propene, 1,2,3,3-tetrachloro- 1.0±0.4
21. Benzene, 1,3-dichloro- 14.6±5.8
22. 1,3-Butadiene, 1,1,3,4-tetrachloro- 5.6±2.2
23. Benzene, 1,4-dichloro- 46.2±18.5
24. Benzene, 1-chloro-4-ethynyl- 7.2±2.9
25. Silane, tetrachloro- 4.4±1.8
26. Benzene, 1-chloro-4-ethynyl- 7.4±3.0
27. Benzene, (2-chloroethenyl)-, (Z)- 1.0±0.4
28. 1-Propene, pentachloro- 3.0±1.2
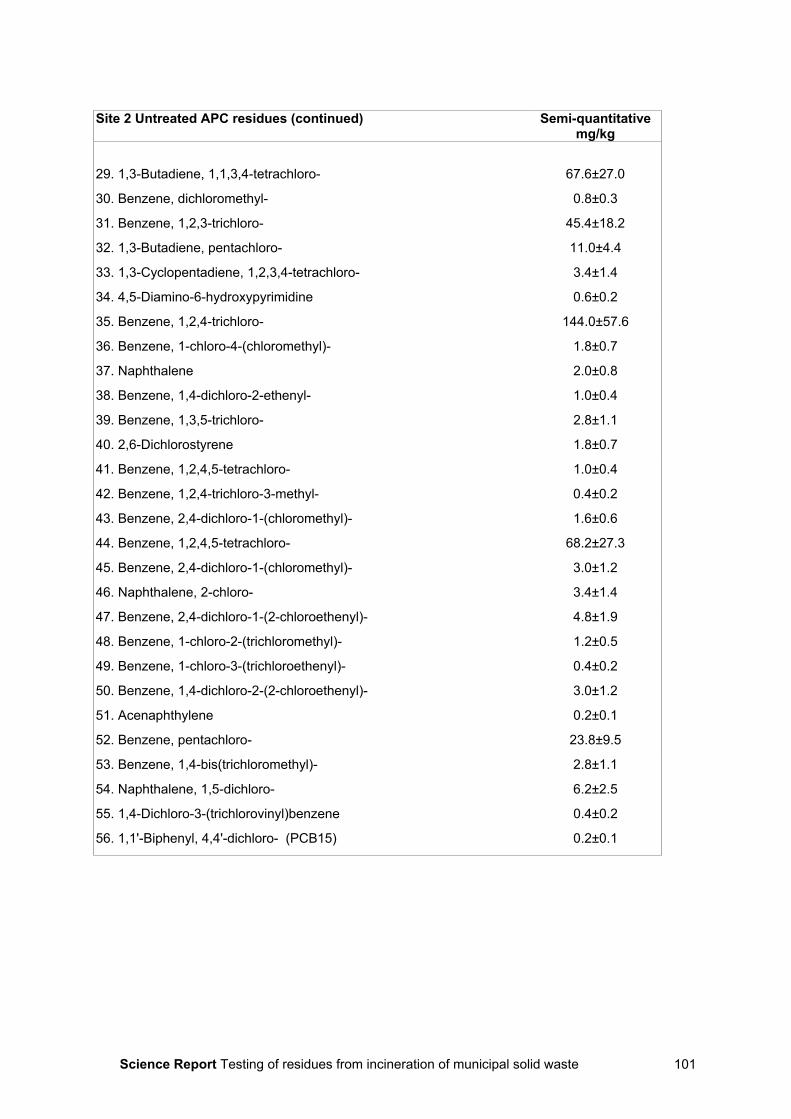
Science Report Testing of residues from incineration of municipal solid waste 101
Site 2 Untreated APC residues (continued) Semi-quantitativemg/kg
29. 1,3-Butadiene, 1,1,3,4-tetrachloro- 67.6±27.0
30. Benzene, dichloromethyl- 0.8±0.3
31. Benzene, 1,2,3-trichloro- 45.4±18.2
32. 1,3-Butadiene, pentachloro- 11.0±4.4
33. 1,3-Cyclopentadiene, 1,2,3,4-tetrachloro- 3.4±1.4
34. 4,5-Diamino-6-hydroxypyrimidine 0.6±0.2
35. Benzene, 1,2,4-trichloro- 144.0±57.6
36. Benzene, 1-chloro-4-(chloromethyl)- 1.8±0.7
37. Naphthalene 2.0±0.8
38. Benzene, 1,4-dichloro-2-ethenyl- 1.0±0.4
39. Benzene, 1,3,5-trichloro- 2.8±1.1
40. 2,6-Dichlorostyrene 1.8±0.7
41. Benzene, 1,2,4,5-tetrachloro- 1.0±0.4
42. Benzene, 1,2,4-trichloro-3-methyl- 0.4±0.2
43. Benzene, 2,4-dichloro-1-(chloromethyl)- 1.6±0.6
44. Benzene, 1,2,4,5-tetrachloro- 68.2±27.3
45. Benzene, 2,4-dichloro-1-(chloromethyl)- 3.0±1.2
46. Naphthalene, 2-chloro- 3.4±1.4
47. Benzene, 2,4-dichloro-1-(2-chloroethenyl)- 4.8±1.9
48. Benzene, 1-chloro-2-(trichloromethyl)- 1.2±0.5
49. Benzene, 1-chloro-3-(trichloroethenyl)- 0.4±0.2
50. Benzene, 1,4-dichloro-2-(2-chloroethenyl)- 3.0±1.2
51. Acenaphthylene 0.2±0.1
52. Benzene, pentachloro- 23.8±9.5
53. Benzene, 1,4-bis(trichloromethyl)- 2.8±1.1
54. Naphthalene, 1,5-dichloro- 6.2±2.5
55. 1,4-Dichloro-3-(trichlorovinyl)benzene 0.4±0.2
56. 1,1'-Biphenyl, 4,4'-dichloro- (PCB15) 0.2±0.1
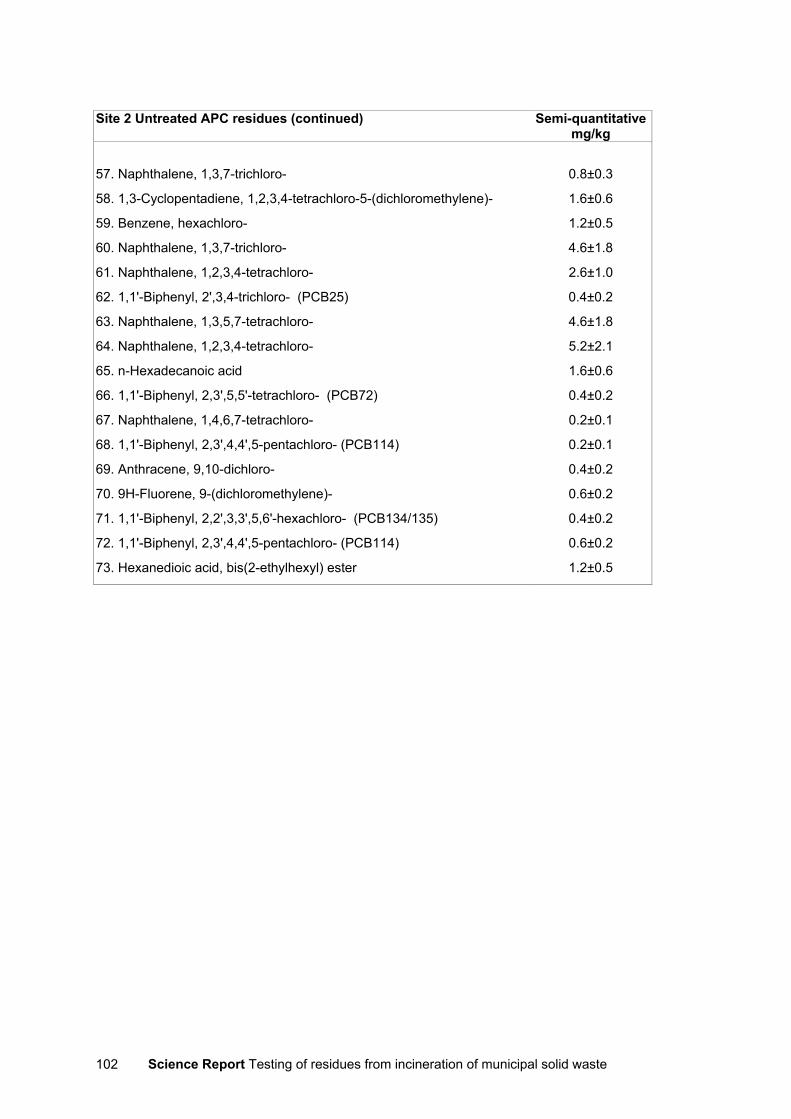
Science Report Testing of residues from incineration of municipal solid waste102
Site 2 Untreated APC residues (continued) Semi-quantitativemg/kg
57. Naphthalene, 1,3,7-trichloro- 0.8±0.3
58. 1,3-Cyclopentadiene, 1,2,3,4-tetrachloro-5-(dichloromethylene)- 1.6±0.6
59. Benzene, hexachloro- 1.2±0.5
60. Naphthalene, 1,3,7-trichloro- 4.6±1.8
61. Naphthalene, 1,2,3,4-tetrachloro- 2.6±1.0
62. 1,1'-Biphenyl, 2',3,4-trichloro- (PCB25) 0.4±0.2
63. Naphthalene, 1,3,5,7-tetrachloro- 4.6±1.8
64. Naphthalene, 1,2,3,4-tetrachloro- 5.2±2.1
65. n-Hexadecanoic acid 1.6±0.6
66. 1,1'-Biphenyl, 2,3',5,5'-tetrachloro- (PCB72) 0.4±0.2
67. Naphthalene, 1,4,6,7-tetrachloro- 0.2±0.1
68. 1,1'-Biphenyl, 2,3',4,4',5-pentachloro- (PCB114) 0.2±0.1
69. Anthracene, 9,10-dichloro- 0.4±0.2
70. 9H-Fluorene, 9-(dichloromethylene)- 0.6±0.2
71. 1,1'-Biphenyl, 2,2',3,3',5,6'-hexachloro- (PCB134/135) 0.4±0.2
72. 1,1'-Biphenyl, 2,3',4,4',5-pentachloro- (PCB114) 0.6±0.2
73. Hexanedioic acid, bis(2-ethylhexyl) ester 1.2±0.5
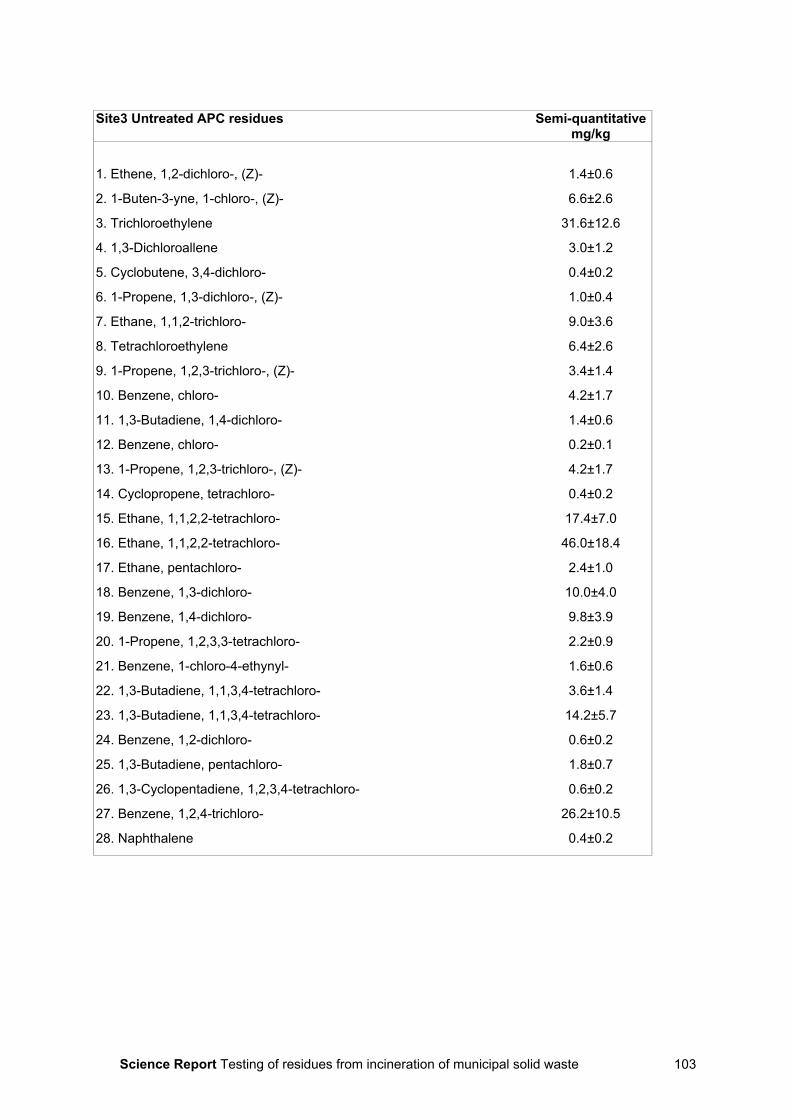
Science Report Testing of residues from incineration of municipal solid waste 103
Site3 Untreated APC residues Semi-quantitativemg/kg
1. Ethene, 1,2-dichloro-, (Z)- 1.4±0.6
2. 1-Buten-3-yne, 1-chloro-, (Z)- 6.6±2.6
3. Trichloroethylene 31.6±12.6
4. 1,3-Dichloroallene 3.0±1.2
5. Cyclobutene, 3,4-dichloro- 0.4±0.2
6. 1-Propene, 1,3-dichloro-, (Z)- 1.0±0.4
7. Ethane, 1,1,2-trichloro- 9.0±3.6
8. Tetrachloroethylene 6.4±2.6
9. 1-Propene, 1,2,3-trichloro-, (Z)- 3.4±1.4
10. Benzene, chloro- 4.2±1.7
11. 1,3-Butadiene, 1,4-dichloro- 1.4±0.6
12. Benzene, chloro- 0.2±0.1
13. 1-Propene, 1,2,3-trichloro-, (Z)- 4.2±1.7
14. Cyclopropene, tetrachloro- 0.4±0.2
15. Ethane, 1,1,2,2-tetrachloro- 17.4±7.0
16. Ethane, 1,1,2,2-tetrachloro- 46.0±18.4
17. Ethane, pentachloro- 2.4±1.0
18. Benzene, 1,3-dichloro- 10.0±4.0
19. Benzene, 1,4-dichloro- 9.8±3.9
20. 1-Propene, 1,2,3,3-tetrachloro- 2.2±0.9
21. Benzene, 1-chloro-4-ethynyl- 1.6±0.6
22. 1,3-Butadiene, 1,1,3,4-tetrachloro- 3.6±1.4
23. 1,3-Butadiene, 1,1,3,4-tetrachloro- 14.2±5.7
24. Benzene, 1,2-dichloro- 0.6±0.2
25. 1,3-Butadiene, pentachloro- 1.8±0.7
26. 1,3-Cyclopentadiene, 1,2,3,4-tetrachloro- 0.6±0.2
27. Benzene, 1,2,4-trichloro- 26.2±10.5
28. Naphthalene 0.4±0.2
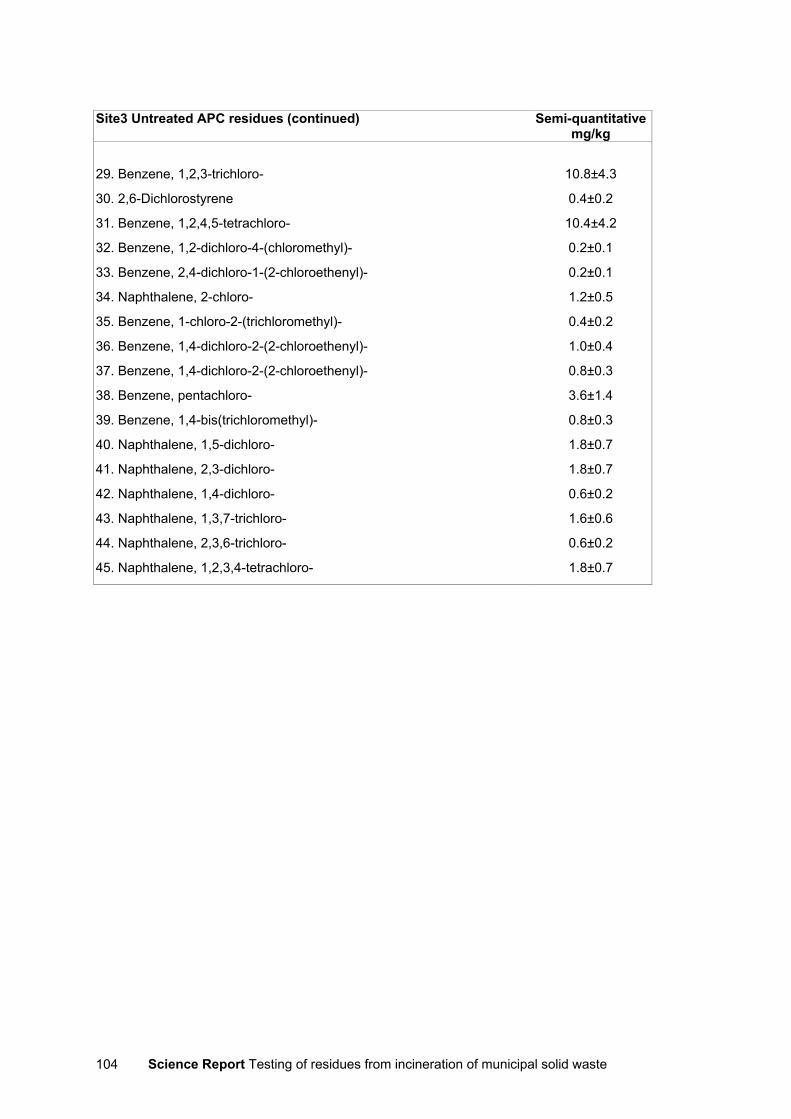
Science Report Testing of residues from incineration of municipal solid waste104
Site3 Untreated APC residues (continued) Semi-quantitativemg/kg
29. Benzene, 1,2,3-trichloro- 10.8±4.3
30. 2,6-Dichlorostyrene 0.4±0.2
31. Benzene, 1,2,4,5-tetrachloro- 10.4±4.2
32. Benzene, 1,2-dichloro-4-(chloromethyl)- 0.2±0.1
33. Benzene, 2,4-dichloro-1-(2-chloroethenyl)- 0.2±0.1
34. Naphthalene, 2-chloro- 1.2±0.5
35. Benzene, 1-chloro-2-(trichloromethyl)- 0.4±0.2
36. Benzene, 1,4-dichloro-2-(2-chloroethenyl)- 1.0±0.4
37. Benzene, 1,4-dichloro-2-(2-chloroethenyl)- 0.8±0.3
38. Benzene, pentachloro- 3.6±1.4
39. Benzene, 1,4-bis(trichloromethyl)- 0.8±0.3
40. Naphthalene, 1,5-dichloro- 1.8±0.7
41. Naphthalene, 2,3-dichloro- 1.8±0.7
42. Naphthalene, 1,4-dichloro- 0.6±0.2
43. Naphthalene, 1,3,7-trichloro- 1.6±0.6
44. Naphthalene, 2,3,6-trichloro- 0.6±0.2
45. Naphthalene, 1,2,3,4-tetrachloro- 1.8±0.7
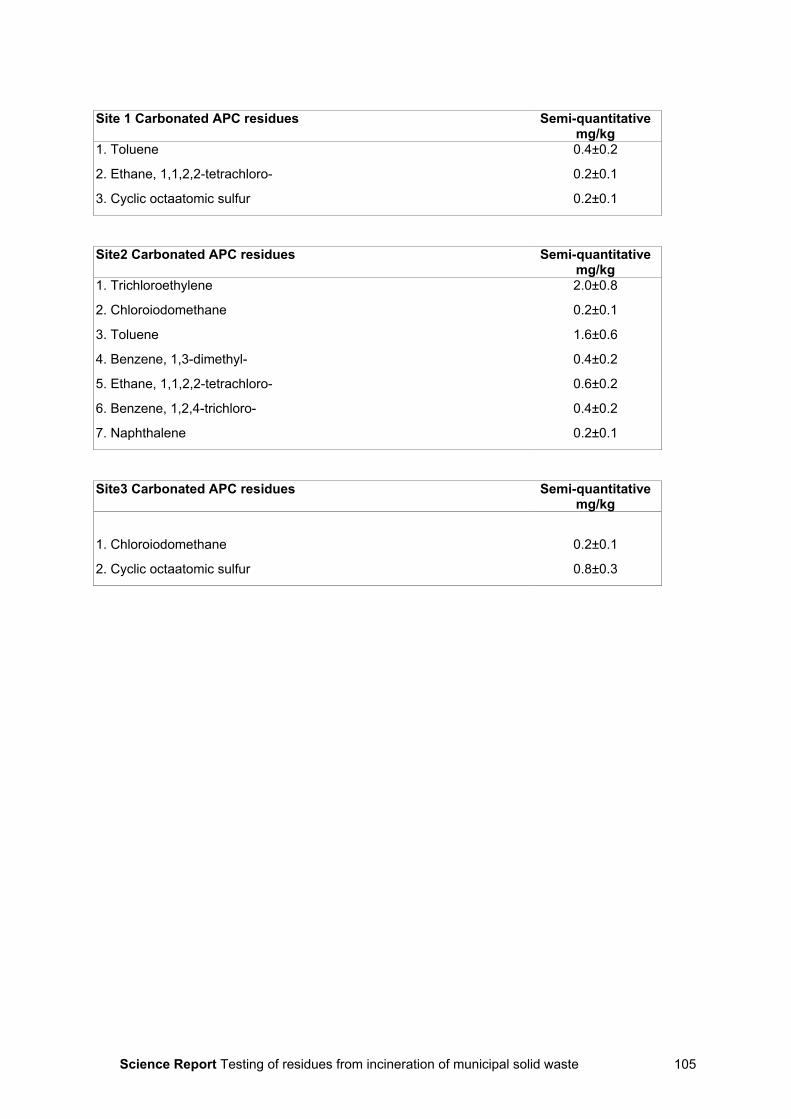
Science Report Testing of residues from incineration of municipal solid waste 105
Site 1 Carbonated APC residues Semi-quantitativemg/kg
1. Toluene 0.4±0.2
2. Ethane, 1,1,2,2-tetrachloro- 0.2±0.1
3. Cyclic octaatomic sulfur 0.2±0.1
Site2 Carbonated APC residues Semi-quantitativemg/kg
1. Trichloroethylene 2.0±0.8
2. Chloroiodomethane 0.2±0.1
3. Toluene 1.6±0.6
4. Benzene, 1,3-dimethyl- 0.4±0.2
5. Ethane, 1,1,2,2-tetrachloro- 0.6±0.2
6. Benzene, 1,2,4-trichloro- 0.4±0.2
7. Naphthalene 0.2±0.1
Site3 Carbonated APC residues Semi-quantitativemg/kg
1. Chloroiodomethane 0.2±0.1
2. Cyclic octaatomic sulfur 0.8±0.3
Science Report Testing of residues from incineration of municipal solid waste106
Appendix H: Analysis of LS 10eluates for major ions, sanitaryparameters and heavy metals
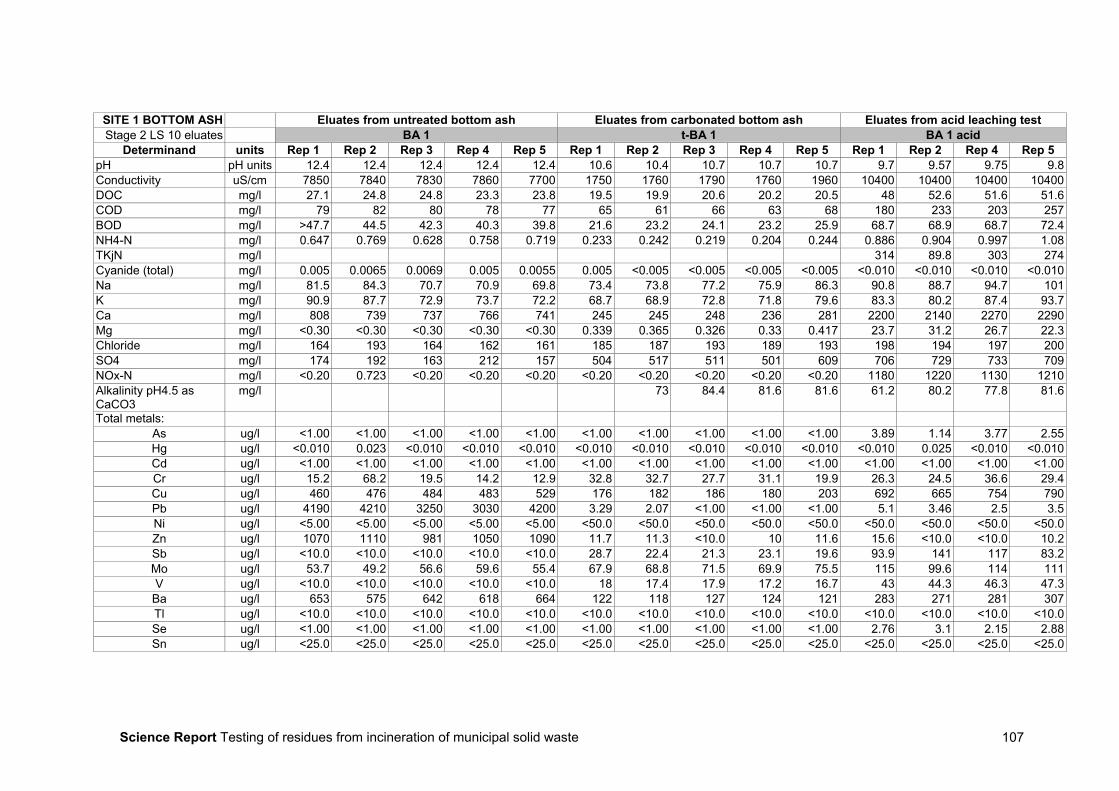
Science Report Testing of residues from incineration of municipal solid waste 107
SITE 1 BOTTOM ASH Eluates from untreated bottom ash Eluates from carbonated bottom ash Eluates from acid leaching testStage 2 LS 10 eluates BA 1 t-BA 1 BA 1 acid
Determinand units Rep 1 Rep 2 Rep 3 Rep 4 Rep 5 Rep 1 Rep 2 Rep 3 Rep 4 Rep 5 Rep 1 Rep 2 Rep 4 Rep 5pH pH units 12.4 12.4 12.4 12.4 12.4 10.6 10.4 10.7 10.7 10.7 9.7 9.57 9.75 9.8Conductivity uS/cm 7850 7840 7830 7860 7700 1750 1760 1790 1760 1960 10400 10400 10400 10400DOC mg/l 27.1 24.8 24.8 23.3 23.8 19.5 19.9 20.6 20.2 20.5 48 52.6 51.6 51.6COD mg/l 79 82 80 78 77 65 61 66 63 68 180 233 203 257BOD mg/l >47.7 44.5 42.3 40.3 39.8 21.6 23.2 24.1 23.2 25.9 68.7 68.9 68.7 72.4NH4-N mg/l 0.647 0.769 0.628 0.758 0.719 0.233 0.242 0.219 0.204 0.244 0.886 0.904 0.997 1.08TKjN mg/l 314 89.8 303 274Cyanide (total) mg/l 0.005 0.0065 0.0069 0.005 0.0055 0.005 <0.005 <0.005 <0.005 <0.005 <0.010 <0.010 <0.010 <0.010Na mg/l 81.5 84.3 70.7 70.9 69.8 73.4 73.8 77.2 75.9 86.3 90.8 88.7 94.7 101K mg/l 90.9 87.7 72.9 73.7 72.2 68.7 68.9 72.8 71.8 79.6 83.3 80.2 87.4 93.7Ca mg/l 808 739 737 766 741 245 245 248 236 281 2200 2140 2270 2290Mg mg/l <0.30 <0.30 <0.30 <0.30 <0.30 0.339 0.365 0.326 0.33 0.417 23.7 31.2 26.7 22.3Chloride mg/l 164 193 164 162 161 185 187 193 189 193 198 194 197 200SO4 mg/l 174 192 163 212 157 504 517 511 501 609 706 729 733 709NOx-N mg/l <0.20 0.723 <0.20 <0.20 <0.20 <0.20 <0.20 <0.20 <0.20 <0.20 1180 1220 1130 1210Alkalinity pH4.5 asCaCO3
mg/l 73 84.4 81.6 81.6 61.2 80.2 77.8 81.6
Total metals:As ug/l <1.00 <1.00 <1.00 <1.00 <1.00 <1.00 <1.00 <1.00 <1.00 <1.00 3.89 1.14 3.77 2.55Hg ug/l <0.010 0.023 <0.010 <0.010 <0.010 <0.010 <0.010 <0.010 <0.010 <0.010 <0.010 0.025 <0.010 <0.010Cd ug/l <1.00 <1.00 <1.00 <1.00 <1.00 <1.00 <1.00 <1.00 <1.00 <1.00 <1.00 <1.00 <1.00 <1.00Cr ug/l 15.2 68.2 19.5 14.2 12.9 32.8 32.7 27.7 31.1 19.9 26.3 24.5 36.6 29.4Cu ug/l 460 476 484 483 529 176 182 186 180 203 692 665 754 790Pb ug/l 4190 4210 3250 3030 4200 3.29 2.07 <1.00 <1.00 <1.00 5.1 3.46 2.5 3.5Ni ug/l <5.00 <5.00 <5.00 <5.00 <5.00 <50.0 <50.0 <50.0 <50.0 <50.0 <50.0 <50.0 <50.0 <50.0Zn ug/l 1070 1110 981 1050 1090 11.7 11.3 <10.0 10 11.6 15.6 <10.0 <10.0 10.2Sb ug/l <10.0 <10.0 <10.0 <10.0 <10.0 28.7 22.4 21.3 23.1 19.6 93.9 141 117 83.2Mo ug/l 53.7 49.2 56.6 59.6 55.4 67.9 68.8 71.5 69.9 75.5 115 99.6 114 111V ug/l <10.0 <10.0 <10.0 <10.0 <10.0 18 17.4 17.9 17.2 16.7 43 44.3 46.3 47.3
Ba ug/l 653 575 642 618 664 122 118 127 124 121 283 271 281 307Tl ug/l <10.0 <10.0 <10.0 <10.0 <10.0 <10.0 <10.0 <10.0 <10.0 <10.0 <10.0 <10.0 <10.0 <10.0Se ug/l <1.00 <1.00 <1.00 <1.00 <1.00 <1.00 <1.00 <1.00 <1.00 <1.00 2.76 3.1 2.15 2.88Sn ug/l <25.0 <25.0 <25.0 <25.0 <25.0 <25.0 <25.0 <25.0 <25.0 <25.0 <25.0 <25.0 <25.0 <25.0
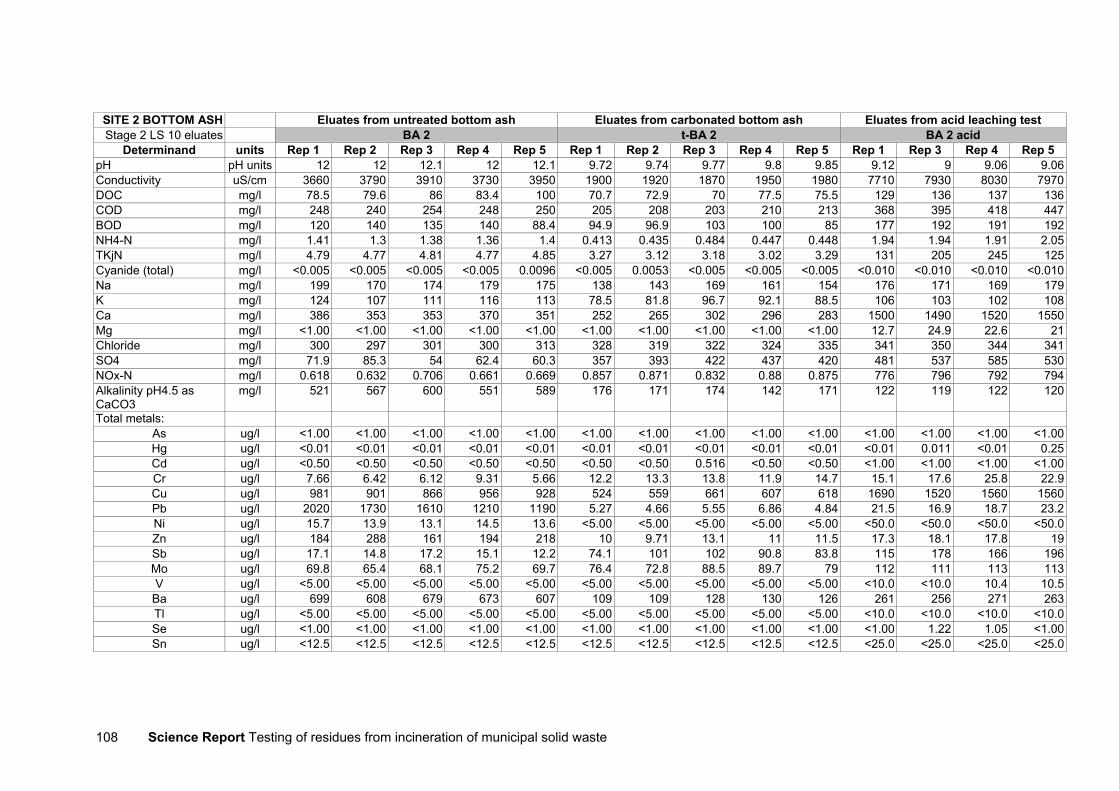
Science Report Testing of residues from incineration of municipal solid waste108
SITE 2 BOTTOM ASH Eluates from untreated bottom ash Eluates from carbonated bottom ash Eluates from acid leaching testStage 2 LS 10 eluates BA 2 t-BA 2 BA 2 acid
Determinand units Rep 1 Rep 2 Rep 3 Rep 4 Rep 5 Rep 1 Rep 2 Rep 3 Rep 4 Rep 5 Rep 1 Rep 3 Rep 4 Rep 5pH pH units 12 12 12.1 12 12.1 9.72 9.74 9.77 9.8 9.85 9.12 9 9.06 9.06Conductivity uS/cm 3660 3790 3910 3730 3950 1900 1920 1870 1950 1980 7710 7930 8030 7970DOC mg/l 78.5 79.6 86 83.4 100 70.7 72.9 70 77.5 75.5 129 136 137 136COD mg/l 248 240 254 248 250 205 208 203 210 213 368 395 418 447BOD mg/l 120 140 135 140 88.4 94.9 96.9 103 100 85 177 192 191 192NH4-N mg/l 1.41 1.3 1.38 1.36 1.4 0.413 0.435 0.484 0.447 0.448 1.94 1.94 1.91 2.05TKjN mg/l 4.79 4.77 4.81 4.77 4.85 3.27 3.12 3.18 3.02 3.29 131 205 245 125Cyanide (total) mg/l <0.005 <0.005 <0.005 <0.005 0.0096 <0.005 0.0053 <0.005 <0.005 <0.005 <0.010 <0.010 <0.010 <0.010Na mg/l 199 170 174 179 175 138 143 169 161 154 176 171 169 179K mg/l 124 107 111 116 113 78.5 81.8 96.7 92.1 88.5 106 103 102 108Ca mg/l 386 353 353 370 351 252 265 302 296 283 1500 1490 1520 1550Mg mg/l <1.00 <1.00 <1.00 <1.00 <1.00 <1.00 <1.00 <1.00 <1.00 <1.00 12.7 24.9 22.6 21Chloride mg/l 300 297 301 300 313 328 319 322 324 335 341 350 344 341SO4 mg/l 71.9 85.3 54 62.4 60.3 357 393 422 437 420 481 537 585 530NOx-N mg/l 0.618 0.632 0.706 0.661 0.669 0.857 0.871 0.832 0.88 0.875 776 796 792 794Alkalinity pH4.5 asCaCO3
mg/l 521 567 600 551 589 176 171 174 142 171 122 119 122 120
Total metals:As ug/l <1.00 <1.00 <1.00 <1.00 <1.00 <1.00 <1.00 <1.00 <1.00 <1.00 <1.00 <1.00 <1.00 <1.00Hg ug/l <0.01 <0.01 <0.01 <0.01 <0.01 <0.01 <0.01 <0.01 <0.01 <0.01 <0.01 0.011 <0.01 0.25Cd ug/l <0.50 <0.50 <0.50 <0.50 <0.50 <0.50 <0.50 0.516 <0.50 <0.50 <1.00 <1.00 <1.00 <1.00Cr ug/l 7.66 6.42 6.12 9.31 5.66 12.2 13.3 13.8 11.9 14.7 15.1 17.6 25.8 22.9Cu ug/l 981 901 866 956 928 524 559 661 607 618 1690 1520 1560 1560Pb ug/l 2020 1730 1610 1210 1190 5.27 4.66 5.55 6.86 4.84 21.5 16.9 18.7 23.2Ni ug/l 15.7 13.9 13.1 14.5 13.6 <5.00 <5.00 <5.00 <5.00 <5.00 <50.0 <50.0 <50.0 <50.0Zn ug/l 184 288 161 194 218 10 9.71 13.1 11 11.5 17.3 18.1 17.8 19Sb ug/l 17.1 14.8 17.2 15.1 12.2 74.1 101 102 90.8 83.8 115 178 166 196Mo ug/l 69.8 65.4 68.1 75.2 69.7 76.4 72.8 88.5 89.7 79 112 111 113 113V ug/l <5.00 <5.00 <5.00 <5.00 <5.00 <5.00 <5.00 <5.00 <5.00 <5.00 <10.0 <10.0 10.4 10.5
Ba ug/l 699 608 679 673 607 109 109 128 130 126 261 256 271 263Tl ug/l <5.00 <5.00 <5.00 <5.00 <5.00 <5.00 <5.00 <5.00 <5.00 <5.00 <10.0 <10.0 <10.0 <10.0Se ug/l <1.00 <1.00 <1.00 <1.00 <1.00 <1.00 <1.00 <1.00 <1.00 <1.00 <1.00 1.22 1.05 <1.00Sn ug/l <12.5 <12.5 <12.5 <12.5 <12.5 <12.5 <12.5 <12.5 <12.5 <12.5 <25.0 <25.0 <25.0 <25.0
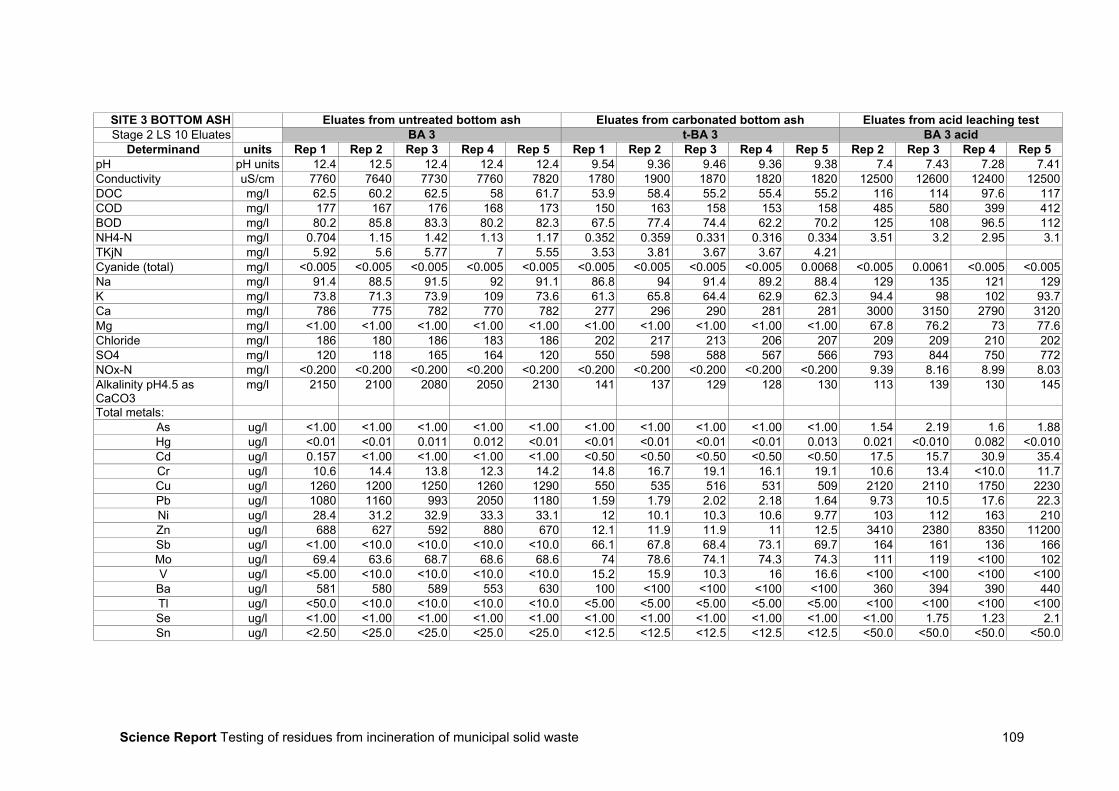
Science Report Testing of residues from incineration of municipal solid waste 109
SITE 3 BOTTOM ASH Eluates from untreated bottom ash Eluates from carbonated bottom ash Eluates from acid leaching testStage 2 LS 10 Eluates BA 3 t-BA 3 BA 3 acid
Determinand units Rep 1 Rep 2 Rep 3 Rep 4 Rep 5 Rep 1 Rep 2 Rep 3 Rep 4 Rep 5 Rep 2 Rep 3 Rep 4 Rep 5pH pH units 12.4 12.5 12.4 12.4 12.4 9.54 9.36 9.46 9.36 9.38 7.4 7.43 7.28 7.41Conductivity uS/cm 7760 7640 7730 7760 7820 1780 1900 1870 1820 1820 12500 12600 12400 12500DOC mg/l 62.5 60.2 62.5 58 61.7 53.9 58.4 55.2 55.4 55.2 116 114 97.6 117COD mg/l 177 167 176 168 173 150 163 158 153 158 485 580 399 412BOD mg/l 80.2 85.8 83.3 80.2 82.3 67.5 77.4 74.4 62.2 70.2 125 108 96.5 112NH4-N mg/l 0.704 1.15 1.42 1.13 1.17 0.352 0.359 0.331 0.316 0.334 3.51 3.2 2.95 3.1TKjN mg/l 5.92 5.6 5.77 7 5.55 3.53 3.81 3.67 3.67 4.21Cyanide (total) mg/l <0.005 <0.005 <0.005 <0.005 <0.005 <0.005 <0.005 <0.005 <0.005 0.0068 <0.005 0.0061 <0.005 <0.005Na mg/l 91.4 88.5 91.5 92 91.1 86.8 94 91.4 89.2 88.4 129 135 121 129K mg/l 73.8 71.3 73.9 109 73.6 61.3 65.8 64.4 62.9 62.3 94.4 98 102 93.7Ca mg/l 786 775 782 770 782 277 296 290 281 281 3000 3150 2790 3120Mg mg/l <1.00 <1.00 <1.00 <1.00 <1.00 <1.00 <1.00 <1.00 <1.00 <1.00 67.8 76.2 73 77.6Chloride mg/l 186 180 186 183 186 202 217 213 206 207 209 209 210 202SO4 mg/l 120 118 165 164 120 550 598 588 567 566 793 844 750 772NOx-N mg/l <0.200 <0.200 <0.200 <0.200 <0.200 <0.200 <0.200 <0.200 <0.200 <0.200 9.39 8.16 8.99 8.03Alkalinity pH4.5 asCaCO3
mg/l 2150 2100 2080 2050 2130 141 137 129 128 130 113 139 130 145
Total metals:As ug/l <1.00 <1.00 <1.00 <1.00 <1.00 <1.00 <1.00 <1.00 <1.00 <1.00 1.54 2.19 1.6 1.88Hg ug/l <0.01 <0.01 0.011 0.012 <0.01 <0.01 <0.01 <0.01 <0.01 0.013 0.021 <0.010 0.082 <0.010Cd ug/l 0.157 <1.00 <1.00 <1.00 <1.00 <0.50 <0.50 <0.50 <0.50 <0.50 17.5 15.7 30.9 35.4Cr ug/l 10.6 14.4 13.8 12.3 14.2 14.8 16.7 19.1 16.1 19.1 10.6 13.4 <10.0 11.7Cu ug/l 1260 1200 1250 1260 1290 550 535 516 531 509 2120 2110 1750 2230Pb ug/l 1080 1160 993 2050 1180 1.59 1.79 2.02 2.18 1.64 9.73 10.5 17.6 22.3Ni ug/l 28.4 31.2 32.9 33.3 33.1 12 10.1 10.3 10.6 9.77 103 112 163 210Zn ug/l 688 627 592 880 670 12.1 11.9 11.9 11 12.5 3410 2380 8350 11200Sb ug/l <1.00 <10.0 <10.0 <10.0 <10.0 66.1 67.8 68.4 73.1 69.7 164 161 136 166Mo ug/l 69.4 63.6 68.7 68.6 68.6 74 78.6 74.1 74.3 74.3 111 119 <100 102V ug/l <5.00 <10.0 <10.0 <10.0 <10.0 15.2 15.9 10.3 16 16.6 <100 <100 <100 <100
Ba ug/l 581 580 589 553 630 100 <100 <100 <100 <100 360 394 390 440Tl ug/l <50.0 <10.0 <10.0 <10.0 <10.0 <5.00 <5.00 <5.00 <5.00 <5.00 <100 <100 <100 <100Se ug/l <1.00 <1.00 <1.00 <1.00 <1.00 <1.00 <1.00 <1.00 <1.00 <1.00 <1.00 1.75 1.23 2.1Sn ug/l <2.50 <25.0 <25.0 <25.0 <25.0 <12.5 <12.5 <12.5 <12.5 <12.5 <50.0 <50.0 <50.0 <50.0
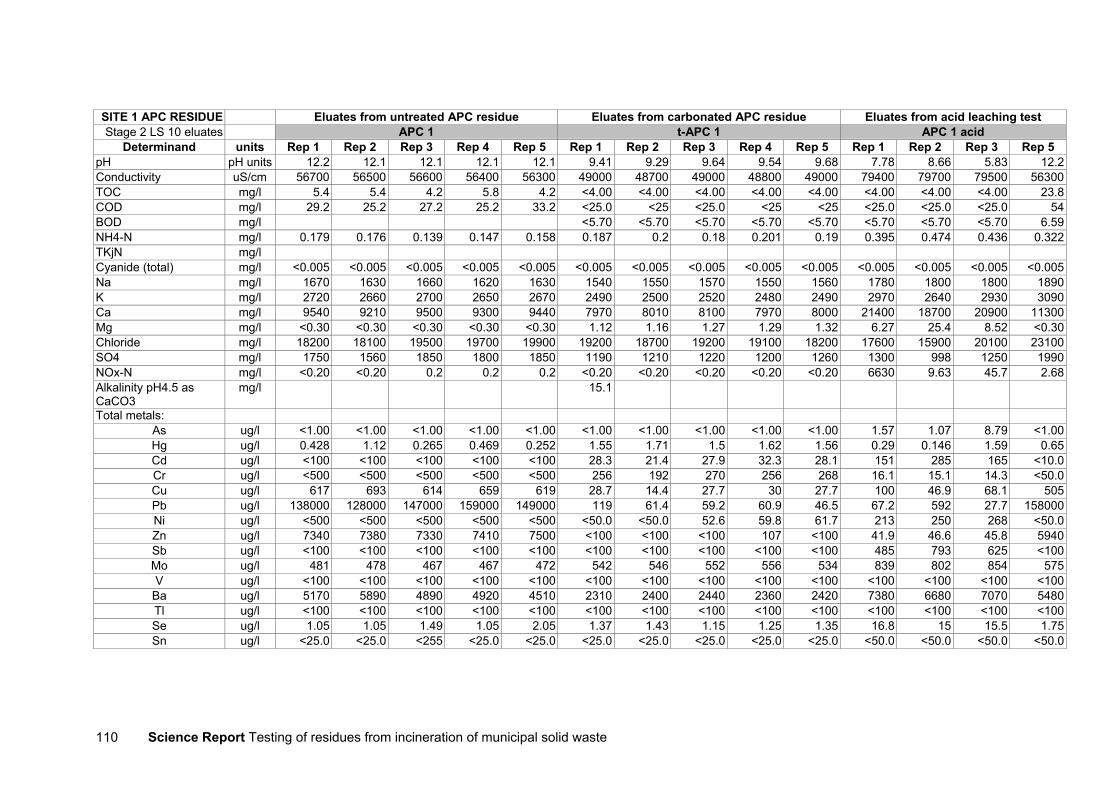
Science Report Testing of residues from incineration of municipal solid waste110
SITE 1 APC RESIDUE Eluates from untreated APC residue Eluates from carbonated APC residue Eluates from acid leaching testStage 2 LS 10 eluates APC 1 t-APC 1 APC 1 acid
Determinand units Rep 1 Rep 2 Rep 3 Rep 4 Rep 5 Rep 1 Rep 2 Rep 3 Rep 4 Rep 5 Rep 1 Rep 2 Rep 3 Rep 5pH pH units 12.2 12.1 12.1 12.1 12.1 9.41 9.29 9.64 9.54 9.68 7.78 8.66 5.83 12.2Conductivity uS/cm 56700 56500 56600 56400 56300 49000 48700 49000 48800 49000 79400 79700 79500 56300TOC mg/l 5.4 5.4 4.2 5.8 4.2 <4.00 <4.00 <4.00 <4.00 <4.00 <4.00 <4.00 <4.00 23.8COD mg/l 29.2 25.2 27.2 25.2 33.2 <25.0 <25 <25.0 <25 <25 <25.0 <25.0 <25.0 54BOD mg/l <5.70 <5.70 <5.70 <5.70 <5.70 <5.70 <5.70 <5.70 6.59NH4-N mg/l 0.179 0.176 0.139 0.147 0.158 0.187 0.2 0.18 0.201 0.19 0.395 0.474 0.436 0.322TKjN mg/lCyanide (total) mg/l <0.005 <0.005 <0.005 <0.005 <0.005 <0.005 <0.005 <0.005 <0.005 <0.005 <0.005 <0.005 <0.005 <0.005Na mg/l 1670 1630 1660 1620 1630 1540 1550 1570 1550 1560 1780 1800 1800 1890K mg/l 2720 2660 2700 2650 2670 2490 2500 2520 2480 2490 2970 2640 2930 3090Ca mg/l 9540 9210 9500 9300 9440 7970 8010 8100 7970 8000 21400 18700 20900 11300Mg mg/l <0.30 <0.30 <0.30 <0.30 <0.30 1.12 1.16 1.27 1.29 1.32 6.27 25.4 8.52 <0.30Chloride mg/l 18200 18100 19500 19700 19900 19200 18700 19200 19100 18200 17600 15900 20100 23100SO4 mg/l 1750 1560 1850 1800 1850 1190 1210 1220 1200 1260 1300 998 1250 1990NOx-N mg/l <0.20 <0.20 0.2 0.2 0.2 <0.20 <0.20 <0.20 <0.20 <0.20 6630 9.63 45.7 2.68Alkalinity pH4.5 asCaCO3
mg/l 15.1
Total metals:As ug/l <1.00 <1.00 <1.00 <1.00 <1.00 <1.00 <1.00 <1.00 <1.00 <1.00 1.57 1.07 8.79 <1.00Hg ug/l 0.428 1.12 0.265 0.469 0.252 1.55 1.71 1.5 1.62 1.56 0.29 0.146 1.59 0.65Cd ug/l <100 <100 <100 <100 <100 28.3 21.4 27.9 32.3 28.1 151 285 165 <10.0Cr ug/l <500 <500 <500 <500 <500 256 192 270 256 268 16.1 15.1 14.3 <50.0Cu ug/l 617 693 614 659 619 28.7 14.4 27.7 30 27.7 100 46.9 68.1 505Pb ug/l 138000 128000 147000 159000 149000 119 61.4 59.2 60.9 46.5 67.2 592 27.7 158000Ni ug/l <500 <500 <500 <500 <500 <50.0 <50.0 52.6 59.8 61.7 213 250 268 <50.0Zn ug/l 7340 7380 7330 7410 7500 <100 <100 <100 107 <100 41.9 46.6 45.8 5940Sb ug/l <100 <100 <100 <100 <100 <100 <100 <100 <100 <100 485 793 625 <100Mo ug/l 481 478 467 467 472 542 546 552 556 534 839 802 854 575V ug/l <100 <100 <100 <100 <100 <100 <100 <100 <100 <100 <100 <100 <100 <100
Ba ug/l 5170 5890 4890 4920 4510 2310 2400 2440 2360 2420 7380 6680 7070 5480Tl ug/l <100 <100 <100 <100 <100 <100 <100 <100 <100 <100 <100 <100 <100 <100Se ug/l 1.05 1.05 1.49 1.05 2.05 1.37 1.43 1.15 1.25 1.35 16.8 15 15.5 1.75Sn ug/l <25.0 <25.0 <255 <25.0 <25.0 <25.0 <25.0 <25.0 <25.0 <25.0 <50.0 <50.0 <50.0 <50.0
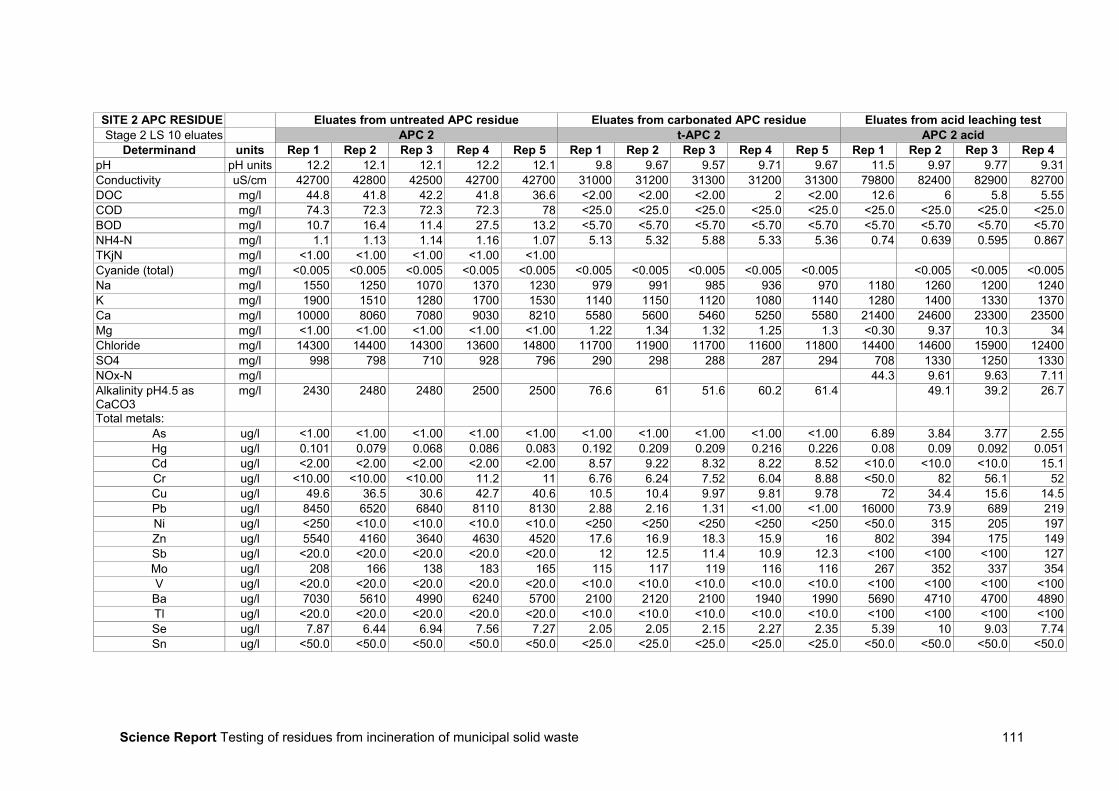
Science Report Testing of residues from incineration of municipal solid waste 111
SITE 2 APC RESIDUE Eluates from untreated APC residue Eluates from carbonated APC residue Eluates from acid leaching testStage 2 LS 10 eluates APC 2 t-APC 2 APC 2 acid
Determinand units Rep 1 Rep 2 Rep 3 Rep 4 Rep 5 Rep 1 Rep 2 Rep 3 Rep 4 Rep 5 Rep 1 Rep 2 Rep 3 Rep 4pH pH units 12.2 12.1 12.1 12.2 12.1 9.8 9.67 9.57 9.71 9.67 11.5 9.97 9.77 9.31Conductivity uS/cm 42700 42800 42500 42700 42700 31000 31200 31300 31200 31300 79800 82400 82900 82700DOC mg/l 44.8 41.8 42.2 41.8 36.6 <2.00 <2.00 <2.00 2 <2.00 12.6 6 5.8 5.55COD mg/l 74.3 72.3 72.3 72.3 78 <25.0 <25.0 <25.0 <25.0 <25.0 <25.0 <25.0 <25.0 <25.0BOD mg/l 10.7 16.4 11.4 27.5 13.2 <5.70 <5.70 <5.70 <5.70 <5.70 <5.70 <5.70 <5.70 <5.70NH4-N mg/l 1.1 1.13 1.14 1.16 1.07 5.13 5.32 5.88 5.33 5.36 0.74 0.639 0.595 0.867TKjN mg/l <1.00 <1.00 <1.00 <1.00 <1.00Cyanide (total) mg/l <0.005 <0.005 <0.005 <0.005 <0.005 <0.005 <0.005 <0.005 <0.005 <0.005 <0.005 <0.005 <0.005Na mg/l 1550 1250 1070 1370 1230 979 991 985 936 970 1180 1260 1200 1240K mg/l 1900 1510 1280 1700 1530 1140 1150 1120 1080 1140 1280 1400 1330 1370Ca mg/l 10000 8060 7080 9030 8210 5580 5600 5460 5250 5580 21400 24600 23300 23500Mg mg/l <1.00 <1.00 <1.00 <1.00 <1.00 1.22 1.34 1.32 1.25 1.3 <0.30 9.37 10.3 34Chloride mg/l 14300 14400 14300 13600 14800 11700 11900 11700 11600 11800 14400 14600 15900 12400SO4 mg/l 998 798 710 928 796 290 298 288 287 294 708 1330 1250 1330NOx-N mg/l 44.3 9.61 9.63 7.11Alkalinity pH4.5 asCaCO3
mg/l 2430 2480 2480 2500 2500 76.6 61 51.6 60.2 61.4 49.1 39.2 26.7
Total metals:As ug/l <1.00 <1.00 <1.00 <1.00 <1.00 <1.00 <1.00 <1.00 <1.00 <1.00 6.89 3.84 3.77 2.55Hg ug/l 0.101 0.079 0.068 0.086 0.083 0.192 0.209 0.209 0.216 0.226 0.08 0.09 0.092 0.051Cd ug/l <2.00 <2.00 <2.00 <2.00 <2.00 8.57 9.22 8.32 8.22 8.52 <10.0 <10.0 <10.0 15.1Cr ug/l <10.00 <10.00 <10.00 11.2 11 6.76 6.24 7.52 6.04 8.88 <50.0 82 56.1 52Cu ug/l 49.6 36.5 30.6 42.7 40.6 10.5 10.4 9.97 9.81 9.78 72 34.4 15.6 14.5Pb ug/l 8450 6520 6840 8110 8130 2.88 2.16 1.31 <1.00 <1.00 16000 73.9 689 219Ni ug/l <250 <10.0 <10.0 <10.0 <10.0 <250 <250 <250 <250 <250 <50.0 315 205 197Zn ug/l 5540 4160 3640 4630 4520 17.6 16.9 18.3 15.9 16 802 394 175 149Sb ug/l <20.0 <20.0 <20.0 <20.0 <20.0 12 12.5 11.4 10.9 12.3 <100 <100 <100 127Mo ug/l 208 166 138 183 165 115 117 119 116 116 267 352 337 354V ug/l <20.0 <20.0 <20.0 <20.0 <20.0 <10.0 <10.0 <10.0 <10.0 <10.0 <100 <100 <100 <100
Ba ug/l 7030 5610 4990 6240 5700 2100 2120 2100 1940 1990 5690 4710 4700 4890Tl ug/l <20.0 <20.0 <20.0 <20.0 <20.0 <10.0 <10.0 <10.0 <10.0 <10.0 <100 <100 <100 <100Se ug/l 7.87 6.44 6.94 7.56 7.27 2.05 2.05 2.15 2.27 2.35 5.39 10 9.03 7.74Sn ug/l <50.0 <50.0 <50.0 <50.0 <50.0 <25.0 <25.0 <25.0 <25.0 <25.0 <50.0 <50.0 <50.0 <50.0
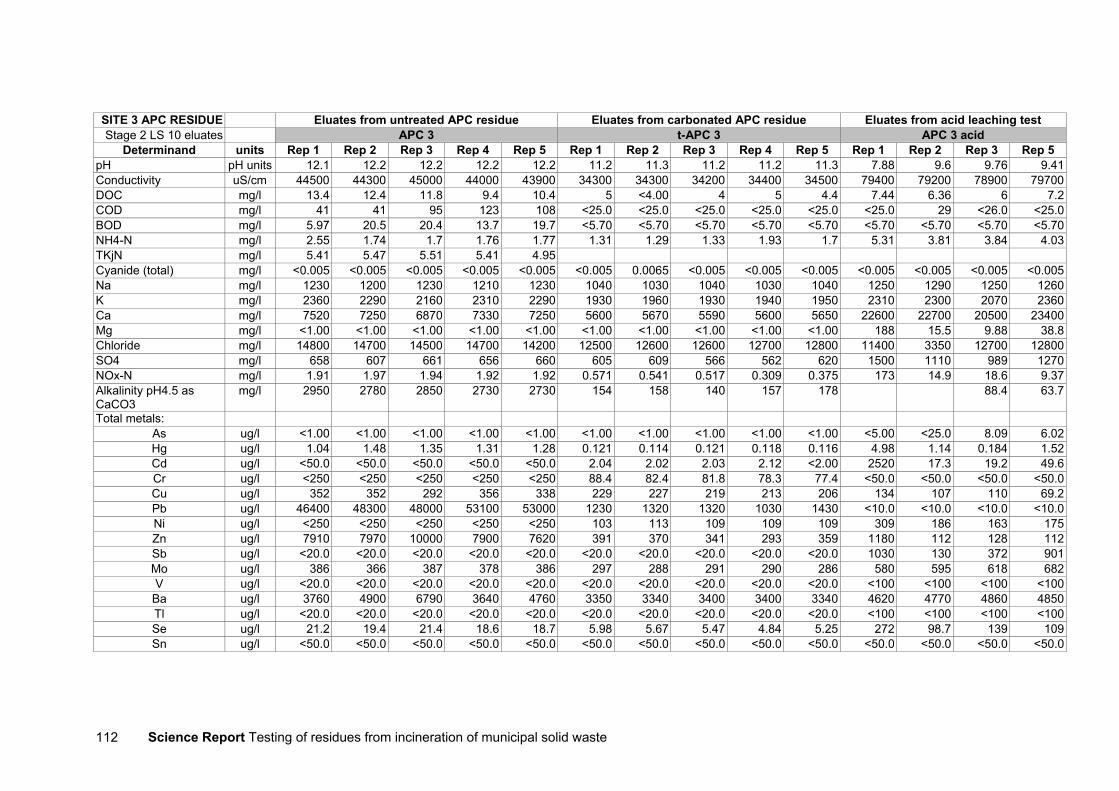
Science Report Testing of residues from incineration of municipal solid waste112
SITE 3 APC RESIDUE Eluates from untreated APC residue Eluates from carbonated APC residue Eluates from acid leaching testStage 2 LS 10 eluates APC 3 t-APC 3 APC 3 acid
Determinand units Rep 1 Rep 2 Rep 3 Rep 4 Rep 5 Rep 1 Rep 2 Rep 3 Rep 4 Rep 5 Rep 1 Rep 2 Rep 3 Rep 5pH pH units 12.1 12.2 12.2 12.2 12.2 11.2 11.3 11.2 11.2 11.3 7.88 9.6 9.76 9.41Conductivity uS/cm 44500 44300 45000 44000 43900 34300 34300 34200 34400 34500 79400 79200 78900 79700DOC mg/l 13.4 12.4 11.8 9.4 10.4 5 <4.00 4 5 4.4 7.44 6.36 6 7.2COD mg/l 41 41 95 123 108 <25.0 <25.0 <25.0 <25.0 <25.0 <25.0 29 <26.0 <25.0BOD mg/l 5.97 20.5 20.4 13.7 19.7 <5.70 <5.70 <5.70 <5.70 <5.70 <5.70 <5.70 <5.70 <5.70NH4-N mg/l 2.55 1.74 1.7 1.76 1.77 1.31 1.29 1.33 1.93 1.7 5.31 3.81 3.84 4.03TKjN mg/l 5.41 5.47 5.51 5.41 4.95Cyanide (total) mg/l <0.005 <0.005 <0.005 <0.005 <0.005 <0.005 0.0065 <0.005 <0.005 <0.005 <0.005 <0.005 <0.005 <0.005Na mg/l 1230 1200 1230 1210 1230 1040 1030 1040 1030 1040 1250 1290 1250 1260K mg/l 2360 2290 2160 2310 2290 1930 1960 1930 1940 1950 2310 2300 2070 2360Ca mg/l 7520 7250 6870 7330 7250 5600 5670 5590 5600 5650 22600 22700 20500 23400Mg mg/l <1.00 <1.00 <1.00 <1.00 <1.00 <1.00 <1.00 <1.00 <1.00 <1.00 188 15.5 9.88 38.8Chloride mg/l 14800 14700 14500 14700 14200 12500 12600 12600 12700 12800 11400 3350 12700 12800SO4 mg/l 658 607 661 656 660 605 609 566 562 620 1500 1110 989 1270NOx-N mg/l 1.91 1.97 1.94 1.92 1.92 0.571 0.541 0.517 0.309 0.375 173 14.9 18.6 9.37Alkalinity pH4.5 asCaCO3
mg/l 2950 2780 2850 2730 2730 154 158 140 157 178 88.4 63.7
Total metals:As ug/l <1.00 <1.00 <1.00 <1.00 <1.00 <1.00 <1.00 <1.00 <1.00 <1.00 <5.00 <25.0 8.09 6.02Hg ug/l 1.04 1.48 1.35 1.31 1.28 0.121 0.114 0.121 0.118 0.116 4.98 1.14 0.184 1.52Cd ug/l <50.0 <50.0 <50.0 <50.0 <50.0 2.04 2.02 2.03 2.12 <2.00 2520 17.3 19.2 49.6Cr ug/l <250 <250 <250 <250 <250 88.4 82.4 81.8 78.3 77.4 <50.0 <50.0 <50.0 <50.0Cu ug/l 352 352 292 356 338 229 227 219 213 206 134 107 110 69.2Pb ug/l 46400 48300 48000 53100 53000 1230 1320 1320 1030 1430 <10.0 <10.0 <10.0 <10.0Ni ug/l <250 <250 <250 <250 <250 103 113 109 109 109 309 186 163 175Zn ug/l 7910 7970 10000 7900 7620 391 370 341 293 359 1180 112 128 112Sb ug/l <20.0 <20.0 <20.0 <20.0 <20.0 <20.0 <20.0 <20.0 <20.0 <20.0 1030 130 372 901Mo ug/l 386 366 387 378 386 297 288 291 290 286 580 595 618 682V ug/l <20.0 <20.0 <20.0 <20.0 <20.0 <20.0 <20.0 <20.0 <20.0 <20.0 <100 <100 <100 <100
Ba ug/l 3760 4900 6790 3640 4760 3350 3340 3400 3400 3340 4620 4770 4860 4850Tl ug/l <20.0 <20.0 <20.0 <20.0 <20.0 <20.0 <20.0 <20.0 <20.0 <20.0 <100 <100 <100 <100Se ug/l 21.2 19.4 21.4 18.6 18.7 5.98 5.67 5.47 4.84 5.25 272 98.7 139 109Sn ug/l <50.0 <50.0 <50.0 <50.0 <50.0 <50.0 <50.0 <50.0 <50.0 <50.0 <50.0 <50.0 <50.0 <50.0
Science Report Testing of residues from incineration of municipal solid waste 113
Appendix I: Analytical results fordioxins and furans in LS 10 eluates
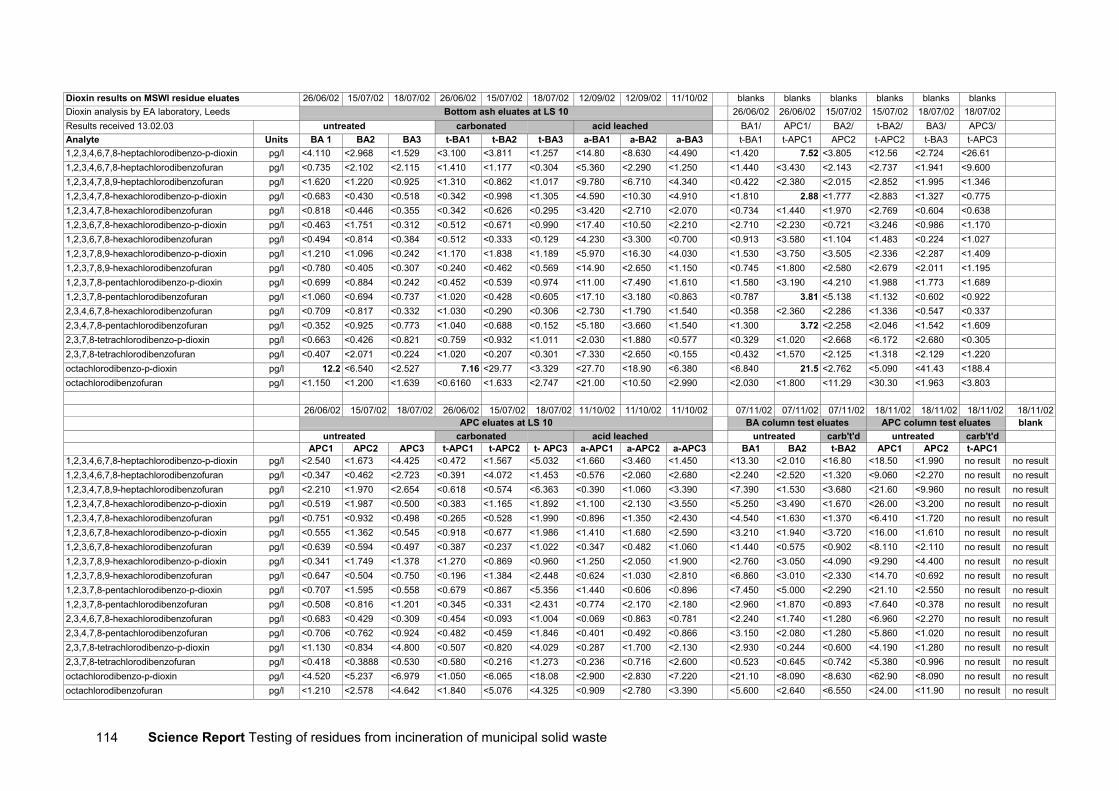
Science Report Testing of residues from incineration of municipal solid waste114
Dioxin results on MSWI residue eluates 26/06/02 15/07/02 18/07/02 26/06/02 15/07/02 18/07/02 12/09/02 12/09/02 11/10/02 blanks blanks blanks blanks blanks blanksDioxin analysis by EA laboratory, Leeds Bottom ash eluates at LS 10 26/06/02 26/06/02 15/07/02 15/07/02 18/07/02 18/07/02Results received 13.02.03 untreated carbonated acid leached BA1/ APC1/ BA2/ t-BA2/ BA3/ APC3/Analyte Units BA 1 BA2 BA3 t-BA1 t-BA2 t-BA3 a-BA1 a-BA2 a-BA3 t-BA1 t-APC1 APC2 t-APC2 t-BA3 t-APC31,2,3,4,6,7,8-heptachlorodibenzo-p-dioxin pg/l <4.110 <2.968 <1.529 <3.100 <3.811 <1.257 <14.80 <8.630 <4.490 <1.420 7.52 <3.805 <12.56 <2.724 <26.611,2,3,4,6,7,8-heptachlorodibenzofuran pg/l <0.735 <2.102 <2.115 <1.410 <1.177 <0.304 <5.360 <2.290 <1.250 <1.440 <3.430 <2.143 <2.737 <1.941 <9.6001,2,3,4,7,8,9-heptachlorodibenzofuran pg/l <1.620 <1.220 <0.925 <1.310 <0.862 <1.017 <9.780 <6.710 <4.340 <0.422 <2.380 <2.015 <2.852 <1.995 <1.3461,2,3,4,7,8-hexachlorodibenzo-p-dioxin pg/l <0.683 <0.430 <0.518 <0.342 <0.998 <1.305 <4.590 <10.30 <4.910 <1.810 2.88 <1.777 <2.883 <1.327 <0.7751,2,3,4,7,8-hexachlorodibenzofuran pg/l <0.818 <0.446 <0.355 <0.342 <0.626 <0.295 <3.420 <2.710 <2.070 <0.734 <1.440 <1.970 <2.769 <0.604 <0.6381,2,3,6,7,8-hexachlorodibenzo-p-dioxin pg/l <0.463 <1.751 <0.312 <0.512 <0.671 <0.990 <17.40 <10.50 <2.210 <2.710 <2.230 <0.721 <3.246 <0.986 <1.1701,2,3,6,7,8-hexachlorodibenzofuran pg/l <0.494 <0.814 <0.384 <0.512 <0.333 <0.129 <4.230 <3.300 <0.700 <0.913 <3.580 <1.104 <1.483 <0.224 <1.0271,2,3,7,8,9-hexachlorodibenzo-p-dioxin pg/l <1.210 <1.096 <0.242 <1.170 <1.838 <1.189 <5.970 <16.30 <4.030 <1.530 <3.750 <3.505 <2.336 <2.287 <1.4091,2,3,7,8,9-hexachlorodibenzofuran pg/l <0.780 <0.405 <0.307 <0.240 <0.462 <0.569 <14.90 <2.650 <1.150 <0.745 <1.800 <2.580 <2.679 <2.011 <1.1951,2,3,7,8-pentachlorodibenzo-p-dioxin pg/l <0.699 <0.884 <0.242 <0.452 <0.539 <0.974 <11.00 <7.490 <1.610 <1.580 <3.190 <4.210 <1.988 <1.773 <1.6891,2,3,7,8-pentachlorodibenzofuran pg/l <1.060 <0.694 <0.737 <1.020 <0.428 <0.605 <17.10 <3.180 <0.863 <0.787 3.81 <5.138 <1.132 <0.602 <0.9222,3,4,6,7,8-hexachlorodibenzofuran pg/l <0.709 <0.817 <0.332 <1.030 <0.290 <0.306 <2.730 <1.790 <1.540 <0.358 <2.360 <2.286 <1.336 <0.547 <0.3372,3,4,7,8-pentachlorodibenzofuran pg/l <0.352 <0.925 <0.773 <1.040 <0.688 <0.152 <5.180 <3.660 <1.540 <1.300 3.72 <2.258 <2.046 <1.542 <1.6092,3,7,8-tetrachlorodibenzo-p-dioxin pg/l <0.663 <0.426 <0.821 <0.759 <0.932 <1.011 <2.030 <1.880 <0.577 <0.329 <1.020 <2.668 <6.172 <2.680 <0.3052,3,7,8-tetrachlorodibenzofuran pg/l <0.407 <2.071 <0.224 <1.020 <0.207 <0.301 <7.330 <2.650 <0.155 <0.432 <1.570 <2.125 <1.318 <2.129 <1.220octachlorodibenzo-p-dioxin pg/l 12.2 <6.540 <2.527 7.16 <29.77 <3.329 <27.70 <18.90 <6.380 <6.840 21.5 <2.762 <5.090 <41.43 <188.4octachlorodibenzofuran pg/l <1.150 <1.200 <1.639 <0.6160 <1.633 <2.747 <21.00 <10.50 <2.990 <2.030 <1.800 <11.29 <30.30 <1.963 <3.803
26/06/02 15/07/02 18/07/02 26/06/02 15/07/02 18/07/02 11/10/02 11/10/02 11/10/02 07/11/02 07/11/02 07/11/02 18/11/02 18/11/02 18/11/02 18/11/02APC eluates at LS 10 BA column test eluates APC column test eluates blank
untreated carbonated acid leached untreated carb't'd untreated carb't'dAPC1 APC2 APC3 t-APC1 t-APC2 t- APC3 a-APC1 a-APC2 a-APC3 BA1 BA2 t-BA2 APC1 APC2 t-APC1
1,2,3,4,6,7,8-heptachlorodibenzo-p-dioxin pg/l <2.540 <1.673 <4.425 <0.472 <1.567 <5.032 <1.660 <3.460 <1.450 <13.30 <2.010 <16.80 <18.50 <1.990 no result no result1,2,3,4,6,7,8-heptachlorodibenzofuran pg/l <0.347 <0.462 <2.723 <0.391 <4.072 <1.453 <0.576 <2.060 <2.680 <2.240 <2.520 <1.320 <9.060 <2.270 no result no result1,2,3,4,7,8,9-heptachlorodibenzofuran pg/l <2.210 <1.970 <2.654 <0.618 <0.574 <6.363 <0.390 <1.060 <3.390 <7.390 <1.530 <3.680 <21.60 <9.960 no result no result1,2,3,4,7,8-hexachlorodibenzo-p-dioxin pg/l <0.519 <1.987 <0.500 <0.383 <1.165 <1.892 <1.100 <2.130 <3.550 <5.250 <3.490 <1.670 <26.00 <3.200 no result no result1,2,3,4,7,8-hexachlorodibenzofuran pg/l <0.751 <0.932 <0.498 <0.265 <0.528 <1.990 <0.896 <1.350 <2.430 <4.540 <1.630 <1.370 <6.410 <1.720 no result no result1,2,3,6,7,8-hexachlorodibenzo-p-dioxin pg/l <0.555 <1.362 <0.545 <0.918 <0.677 <1.986 <1.410 <1.680 <2.590 <3.210 <1.940 <3.720 <16.00 <1.610 no result no result1,2,3,6,7,8-hexachlorodibenzofuran pg/l <0.639 <0.594 <0.497 <0.387 <0.237 <1.022 <0.347 <0.482 <1.060 <1.440 <0.575 <0.902 <8.110 <2.110 no result no result1,2,3,7,8,9-hexachlorodibenzo-p-dioxin pg/l <0.341 <1.749 <1.378 <1.270 <0.869 <0.960 <1.250 <2.050 <1.900 <2.760 <3.050 <4.090 <9.290 <4.400 no result no result1,2,3,7,8,9-hexachlorodibenzofuran pg/l <0.647 <0.504 <0.750 <0.196 <1.384 <2.448 <0.624 <1.030 <2.810 <6.860 <3.010 <2.330 <14.70 <0.692 no result no result1,2,3,7,8-pentachlorodibenzo-p-dioxin pg/l <0.707 <1.595 <0.558 <0.679 <0.867 <5.356 <1.440 <0.606 <0.896 <7.450 <5.000 <2.290 <21.10 <2.550 no result no result1,2,3,7,8-pentachlorodibenzofuran pg/l <0.508 <0.816 <1.201 <0.345 <0.331 <2.431 <0.774 <2.170 <2.180 <2.960 <1.870 <0.893 <7.640 <0.378 no result no result2,3,4,6,7,8-hexachlorodibenzofuran pg/l <0.683 <0.429 <0.309 <0.454 <0.093 <1.004 <0.069 <0.863 <0.781 <2.240 <1.740 <1.280 <6.960 <2.270 no result no result2,3,4,7,8-pentachlorodibenzofuran pg/l <0.706 <0.762 <0.924 <0.482 <0.459 <1.846 <0.401 <0.492 <0.866 <3.150 <2.080 <1.280 <5.860 <1.020 no result no result2,3,7,8-tetrachlorodibenzo-p-dioxin pg/l <1.130 <0.834 <4.800 <0.507 <0.820 <4.029 <0.287 <1.700 <2.130 <2.930 <0.244 <0.600 <4.190 <1.280 no result no result2,3,7,8-tetrachlorodibenzofuran pg/l <0.418 <0.3888 <0.530 <0.580 <0.216 <1.273 <0.236 <0.716 <2.600 <0.523 <0.645 <0.742 <5.380 <0.996 no result no resultoctachlorodibenzo-p-dioxin pg/l <4.520 <5.237 <6.979 <1.050 <6.065 <18.08 <2.900 <2.830 <7.220 <21.10 <8.090 <8.630 <62.90 <8.090 no result no resultoctachlorodibenzofuran pg/l <1.210 <2.578 <4.642 <1.840 <5.076 <4.325 <0.909 <2.780 <3.390 <5.600 <2.640 <6.550 <24.00 <11.90 no result no result
Science Report Testing of residues from incineration of municipal solid waste 115
Appendix J: List 1 trace organicsin LS 10 eluates
Results of a screening technique conducted by the EANational Laboratory Service, Nottingham
All results are given in µg/l in the eluate as submitted to thelaboratory
Science Report Testing of residues from incineration of municipal solid waste116
Compound Semi-quantitativeµg/l
Site 1 untreated bottom ash1. Ethylisoamylketone 234± 93
2. Benzaldehyde 52± 20
3. 1-Hexanol, 2-ethyl- 74± 29
4. 1-Dodecene 24± 9
5. 3-Buten-2-one, 4-phenyl- 24± 9
6. Dihydroactinidolide 26± 10
Site 2 untreated bottom ash1. Pyrrolidine, 2-ethyl-1-methyl- 8± 3
2. Benzaldehyde 4± 1
3. Hexanoic acid 10± 4
4. 1-Hexanol, 2-ethyl- 12± 4
5. Heptanoic acid 6± 2
6. Octanoic Acid 16± 6
7. Benzoic Acid 16± 6
8. n-Decanoic acid 18± 7
9. Vanillin 44± 17
10. Lauric anhydride 10± 4
11. Phenol, 4,4'-(1-methylethylidene)bis- Bisphenol A 28± 11
Site 3 untreated bottom ash1. Benzene 3528± 1411
2. Benzaldehyde 174± 69
3. 1-Hexanol, 2-ethyl- 90± 36
4. Dihydroactinidiolide 70± 28
Science Report Testing of residues from incineration of municipal solid waste 117
Compound Semi-quantitativeµg/l
Site 1 carbonated bottom ash1. Butanoic acid 100± 40
2. Butanoic acid, 3-methyl- 50± 20
3. Butanoic acid, 2-methyl- 38± 15
4. Ethylisoamylketone 234± 93
5. Pentanoic acid, 4-methyl- 60± 24
6. Benzaldehyde 24± 9
7. Hexanoic acid 70± 28
8. 2-Propyl-1-pentanol 24± 9
9. Benzoic Acid 66± 26
10. iso-Vanillin 226± 90
11. Lauric anhydride 50± 20
12. Benzenepropanoic acid 22± 8
Site 2 carbonated bottom ash1. Hexanoic acid 58± 23
2. 1-Hexanol, 2-ethyl- 22± 8
3. Heptanoic acid 34± 13
4. Benzoic Acid 120± 48
5. Nonanoic acid 26± 10
6. n-Decanoic acid 106± 42
7. Vanillin 230± 92
8. Lauric anhydride 116± 46
9. Benzaldehyde, 4-hydroxy-3,5-dimethoxy- 22± 8
10. Phenol, 4,4'-(1-methylethylidene)bis- BisPhenol A 80± 32
11. Caffeine 20± 8
Site 3 carbonated bottom ash1. Benzene 4182± 1672
2. Butanoic acid 38± 15
3. Butanoic acid, 3-methyl- 36± 14
4. 3-Heptanone, 5-methyl- 134± 53
5. Benzaldehyde 82± 32
6. Heptanoic acid 50± 20
7. Octanoic Acid 142± 56
8. Benzoic Acid 130± 52
Science Report Testing of residues from incineration of municipal solid waste118
Site 2 carbonated bottom ash (continued)9. Benzeneacetic acid 50± 20
10. Nonanoic acid 66± 26
11. Benzylmalonic acid 176± 70
12. n-Decanoic acid 182± 72
13. Benzaldehyde, 4-hydroxy- 24± 9
14. iso Vanillin 484± 193
15. Aceto vanilone 22± 8
16. Butyl maleate 26± 10
17. Dihydroactinidiolide 44± 17
18. Lauric anhydride 136± 54
19. Benzaldehyde, 4-hydroxy-3,5-dimethoxy- 32± 12
20. Tetradecanoic acid 22± 8
21. Caffeine 34± 13
22. 5,10-Diethoxy-2,3,7,8-tetrahydro-1H,6H-dipyrrolo[1,2-a;1',2'-d]pyrazine
36± 14
23. Methyl Linoleate 114± 45
24. Bisphenol A 170± 68
Science Report Testing of residues from incineration of municipal solid waste 119
Compound Semi-quantitativeµg/l
Site 1 untreated APC residue1. Ethylisoamylketone 78± 31
2. 1-Hexanol, 2-ethyl- 44± 17
Site 2 untreated APC residue1. 1-Hexanol, 2-ethyl- 22± 8
Site 3 untreated APC residue1. 3-Heptanone, 5-methyl- 138± 55
Compound Semi-quantitativeµg/l
Site 1 carbonated APC residue1. Ethylisoamylketone 114± 45
Site 2 carbonated APC residue1. 3-Heptanone, 5-methyl- 134± 53
2. 1-Dodecene 24± 9
Site 3 carbonated APC residue1. 3-Heptanone, 5-methyl- 128± 51
Science Report Testing of residues from incineration of municipal solid waste120
Appendix K: List 1 trace organicsin LS 10 acid leaching eluates
Results of a screening technique conducted by the EANational Laboratory Service
All results are given in µg/l in the eluate as submitted to thelaboratory
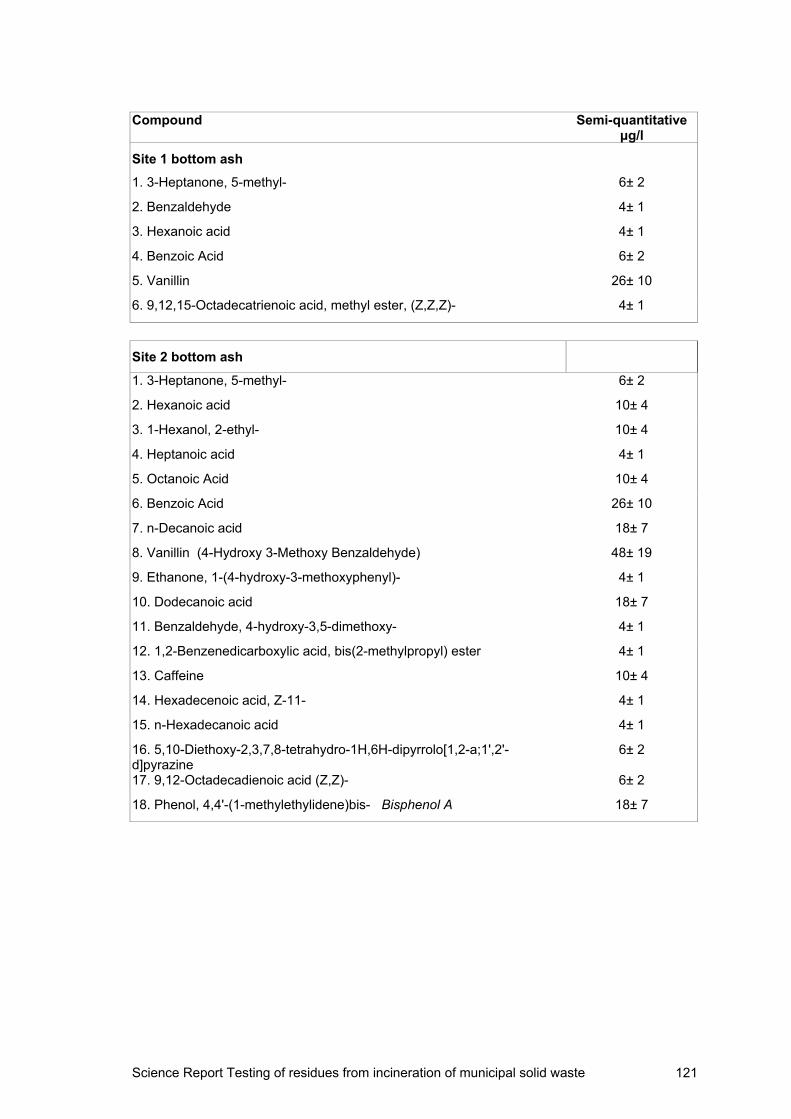
Science Report Testing of residues from incineration of municipal solid waste 121
Compound Semi-quantitativeµg/l
Site 1 bottom ash1. 3-Heptanone, 5-methyl- 6± 2
2. Benzaldehyde 4± 1
3. Hexanoic acid 4± 1
4. Benzoic Acid 6± 2
5. Vanillin 26± 10
6. 9,12,15-Octadecatrienoic acid, methyl ester, (Z,Z,Z)- 4± 1
Site 2 bottom ash1. 3-Heptanone, 5-methyl- 6± 2
2. Hexanoic acid 10± 4
3. 1-Hexanol, 2-ethyl- 10± 4
4. Heptanoic acid 4± 1
5. Octanoic Acid 10± 4
6. Benzoic Acid 26± 10
7. n-Decanoic acid 18± 7
8. Vanillin (4-Hydroxy 3-Methoxy Benzaldehyde) 48± 19
9. Ethanone, 1-(4-hydroxy-3-methoxyphenyl)- 4± 1
10. Dodecanoic acid 18± 7
11. Benzaldehyde, 4-hydroxy-3,5-dimethoxy- 4± 1
12. 1,2-Benzenedicarboxylic acid, bis(2-methylpropyl) ester 4± 1
13. Caffeine 10± 4
14. Hexadecenoic acid, Z-11- 4± 1
15. n-Hexadecanoic acid 4± 1
16. 5,10-Diethoxy-2,3,7,8-tetrahydro-1H,6H-dipyrrolo[1,2-a;1',2'-d]pyrazine
6± 2
17. 9,12-Octadecadienoic acid (Z,Z)- 6± 2
18. Phenol, 4,4'-(1-methylethylidene)bis- Bisphenol A 18± 7
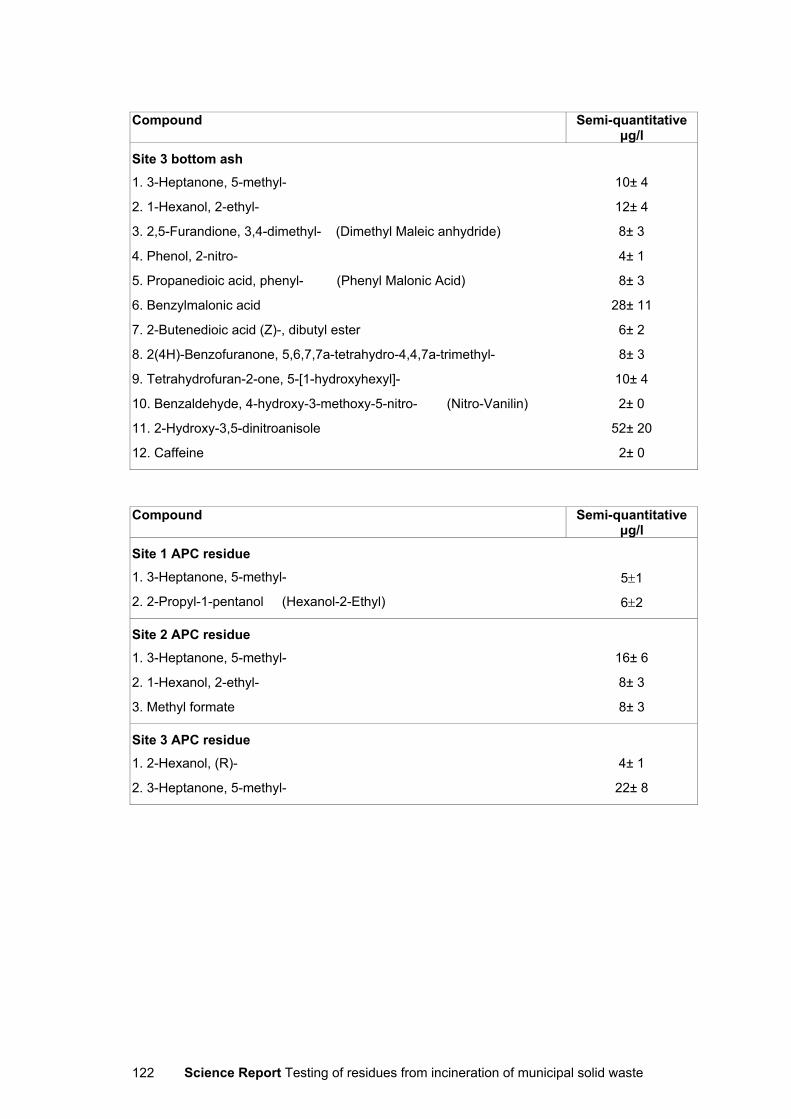
Science Report Testing of residues from incineration of municipal solid waste122
Compound Semi-quantitativeµg/l
Site 3 bottom ash1. 3-Heptanone, 5-methyl- 10± 4
2. 1-Hexanol, 2-ethyl- 12± 4
3. 2,5-Furandione, 3,4-dimethyl- (Dimethyl Maleic anhydride) 8± 3
4. Phenol, 2-nitro- 4± 1
5. Propanedioic acid, phenyl- (Phenyl Malonic Acid) 8± 3
6. Benzylmalonic acid 28± 11
7. 2-Butenedioic acid (Z)-, dibutyl ester 6± 2
8. 2(4H)-Benzofuranone, 5,6,7,7a-tetrahydro-4,4,7a-trimethyl- 8± 3
9. Tetrahydrofuran-2-one, 5-[1-hydroxyhexyl]- 10± 4
10. Benzaldehyde, 4-hydroxy-3-methoxy-5-nitro- (Nitro-Vanilin) 2± 0
11. 2-Hydroxy-3,5-dinitroanisole 52± 20
12. Caffeine 2± 0
Compound Semi-quantitativeµg/l
Site 1 APC residue1. 3-Heptanone, 5-methyl- 5±1
2. 2-Propyl-1-pentanol (Hexanol-2-Ethyl) 6±2
Site 2 APC residue1. 3-Heptanone, 5-methyl- 16± 6
2. 1-Hexanol, 2-ethyl- 8± 3
3. Methyl formate 8± 3
Site 3 APC residue1. 2-Hexanol, (R)- 4± 1
2. 3-Heptanone, 5-methyl- 22± 8
Science Report Testing of residues from incineration of municipal solid waste 123
Appendix L: List 1 trace organicsin column leaching test eluates
Results of a screening technique conducted by the EANational Laboratory Service
All results are given in µg/l in the eluate as submitted to thelaboratory
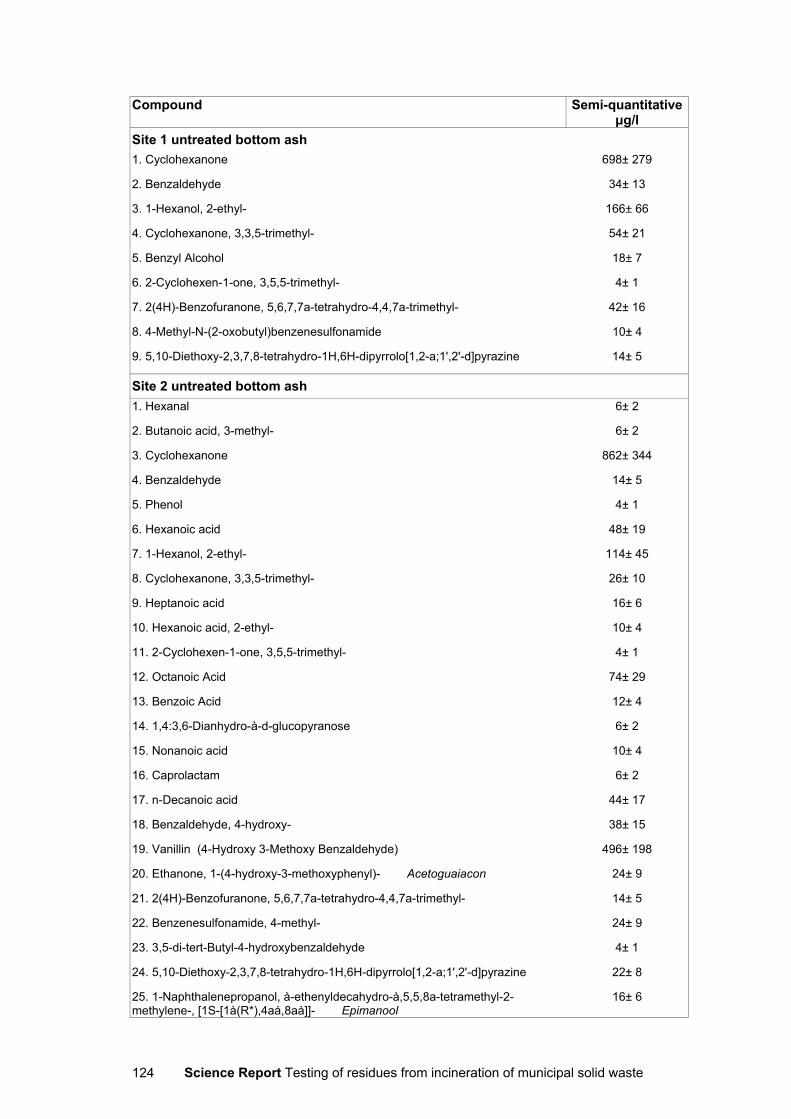
Science Report Testing of residues from incineration of municipal solid waste124
Compound Semi-quantitativeµg/l
Site 1 untreated bottom ash1. Cyclohexanone 698± 279
2. Benzaldehyde 34± 13
3. 1-Hexanol, 2-ethyl- 166± 66
4. Cyclohexanone, 3,3,5-trimethyl- 54± 21
5. Benzyl Alcohol 18± 7
6. 2-Cyclohexen-1-one, 3,5,5-trimethyl- 4± 1
7. 2(4H)-Benzofuranone, 5,6,7,7a-tetrahydro-4,4,7a-trimethyl- 42± 16
8. 4-Methyl-N-(2-oxobutyl)benzenesulfonamide 10± 4
9. 5,10-Diethoxy-2,3,7,8-tetrahydro-1H,6H-dipyrrolo[1,2-a;1',2'-d]pyrazine 14± 5
Site 2 untreated bottom ash1. Hexanal 6± 2
2. Butanoic acid, 3-methyl- 6± 2
3. Cyclohexanone 862± 344
4. Benzaldehyde 14± 5
5. Phenol 4± 1
6. Hexanoic acid 48± 19
7. 1-Hexanol, 2-ethyl- 114± 45
8. Cyclohexanone, 3,3,5-trimethyl- 26± 10
9. Heptanoic acid 16± 6
10. Hexanoic acid, 2-ethyl- 10± 4
11. 2-Cyclohexen-1-one, 3,5,5-trimethyl- 4± 1
12. Octanoic Acid 74± 29
13. Benzoic Acid 12± 4
14. 1,4:3,6-Dianhydro-à-d-glucopyranose 6± 2
15. Nonanoic acid 10± 4
16. Caprolactam 6± 2
17. n-Decanoic acid 44± 17
18. Benzaldehyde, 4-hydroxy- 38± 15
19. Vanillin (4-Hydroxy 3-Methoxy Benzaldehyde) 496± 198
20. Ethanone, 1-(4-hydroxy-3-methoxyphenyl)- Acetoguaiacon 24± 9
21. 2(4H)-Benzofuranone, 5,6,7,7a-tetrahydro-4,4,7a-trimethyl- 14± 5
22. Benzenesulfonamide, 4-methyl- 24± 9
23. 3,5-di-tert-Butyl-4-hydroxybenzaldehyde 4± 1
24. 5,10-Diethoxy-2,3,7,8-tetrahydro-1H,6H-dipyrrolo[1,2-a;1',2'-d]pyrazine 22± 8
25. 1-Naphthalenepropanol, à-ethenyldecahydro-à,5,5,8a-tetramethyl-2-methylene-, [1S-[1à(R*),4aá,8aà]]- Epimanool
16± 6
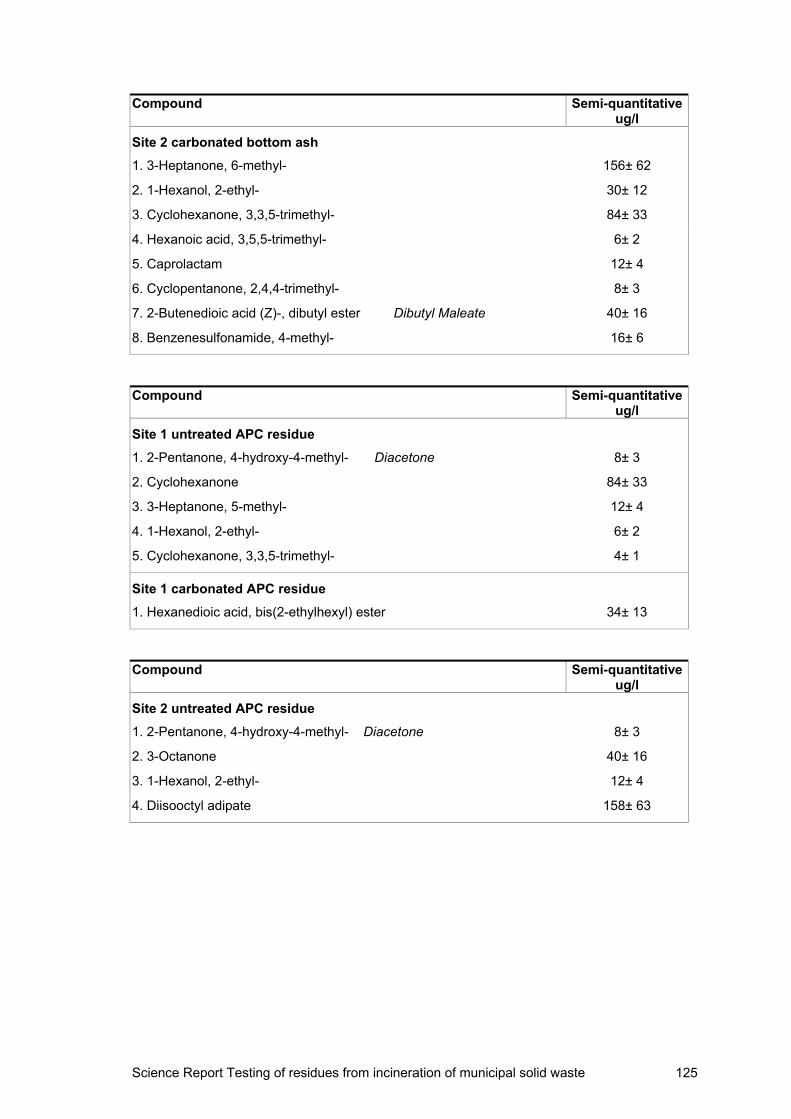
Science Report Testing of residues from incineration of municipal solid waste 125
Compound Semi-quantitativeug/l
Site 2 carbonated bottom ash1. 3-Heptanone, 6-methyl- 156± 62
2. 1-Hexanol, 2-ethyl- 30± 12
3. Cyclohexanone, 3,3,5-trimethyl- 84± 33
4. Hexanoic acid, 3,5,5-trimethyl- 6± 2
5. Caprolactam 12± 4
6. Cyclopentanone, 2,4,4-trimethyl- 8± 3
7. 2-Butenedioic acid (Z)-, dibutyl ester Dibutyl Maleate 40± 16
8. Benzenesulfonamide, 4-methyl- 16± 6
Compound Semi-quantitativeug/l
Site 1 untreated APC residue1. 2-Pentanone, 4-hydroxy-4-methyl- Diacetone 8± 3
2. Cyclohexanone 84± 33
3. 3-Heptanone, 5-methyl- 12± 4
4. 1-Hexanol, 2-ethyl- 6± 2
5. Cyclohexanone, 3,3,5-trimethyl- 4± 1
Site 1 carbonated APC residue1. Hexanedioic acid, bis(2-ethylhexyl) ester 34± 13
Compound Semi-quantitativeug/l
Site 2 untreated APC residue1. 2-Pentanone, 4-hydroxy-4-methyl- Diacetone 8± 3
2. 3-Octanone 40± 16
3. 1-Hexanol, 2-ethyl- 12± 4
4. Diisooctyl adipate 158± 63

We welcome views from our users, stakeholders and the public, includingcomments about the content and presentation of this report. If you are happywith our service, please tell us about it. It helps us to identify good practice andrewards our staff. If you are unhappy with our service, please let us know howwe can improve it.