Embed Size (px)
Citation preview
Testing Screw-ups
Howard WainerNational Board of Medical
Examiners
Rudiments of Quality Control
In any large enterprise, errors are inevitable.
Thus the quality of the enterprise must be judged not only by the frequency and seriousness of the errors but also by
how they are dealt with once they occur.

I will illustrate my talk today with three principal examples:
1. A scoring error that was made by NCS Pearson, Inc. (under contract to the College Entrance Examination Board) on October 8, 2005 on an administration of the SAT Reasoning test.
2. A September 2008 report published by the National Association for College Admission Counseling in which one of the principal recommendations was for colleges and universities to reconsider requiring the SAT or the ACT for applicants.
3. A tragic misuse of the results on the PSSA third grade math test in an elementary school in southeastern Pennsylvania, where a teacher was suspended without pay because her class did unexpectedly well.

One excuse for all of them was the plea that resources were limited and they
couldn’t afford to do as complete a job as turned out to be required.
This illustrates what is a guiding axiom, (it is almost a commandment),
“If you think doing it right is expensive, try doing it wrong.”

A guiding principle of quality control
In any complex process, zero errors is an impossible dream.
Striving for zero errors will only inflate your costs and hinder more important development (because it will use up
resources that can be more effectively used elsewhere).
Consider a process that has one error/thousand.
How can this be fixed?Having inspectors won’t do it, because looking for a rare error is so boring they will fall asleep and miss it, or they will see proper things and
incorrectly call them errors.Having recheckers check the checkers increases
the costs and introduces its own errors.
Quis custodiet ipsos custodes?
As a dramatic example let us consider the accuracy of mammograms at spotting carcinomas.
Radiologists correctly identify carcinomas in mammograms about 85% of the time.
But they incorrectly identify benign spots as cancer about 10% of the time.
To see what this means let’s consider what such errors yield in practice.
Suppose you have a mammogram and it is positive.
What is the probability that you have cancer?

The probability of a false positive 10%and of a correct positive is 85%.
There are 33.5 million mammograms administered each year and
187,000 breast cancers are correctly diagnosed.
That means that there are about 33.3 million women without cancer getting a mammogram and that 10%
(3.33 million) of them will get a positive initial diagnosis.
Simultaneously, 85% of the 187 thousand women with breast cancer (159 thousand) will also get a positive
diagnosis.

So the probability of someone with a positive diagnosis actually having
cancer is:
159,000/(159,000+3,330,000) = 159/(3,500) = 4.5%
Or if you are diagnosed with breast cancer
from a mammogram, more than 95% of the time you do not
have it!
If you are diagnosed negative you almost certainly are negative.
The best advice one might give someone considering a
mammogram is“if its negative, believe it;
if it is positive, don’t believe it.”
It is natural to ask is the expense of doing such a test on so many people worth this level of
accuracy?
Even if it is, it is still worth doing these error calculations; especially to do them separately
by age/risk group.
Current intelligence strongly suggests that if you have no other risk factors and are under 50
(under 60?), don’t bother.

This brings us to the QC dictum that,“You cannot inspect quality into a
product, you must build it in.”
Nowhere is this better illustrated than with US automobile
manufacturing.

Because errors are inevitable, the measure of the quality of a testing program must be broader than just the proportion of times errors are made, although that is surely one part,
but also the seriousness of the errors, and, most importantly,
how the errors are dealt with once they are uncovered.

My experience, gathered over 40 years in the testing business,
has given me the distinct impression that while technical errors in test scoring, test equating, test
calibrating, and all of the other minutiae that are required
in modern large-scale assessment occur with disappointing frequency, their frequency and their import are
dwarfed by errors in score interpretation and misuse; also by errors generated in
attempting to cover-up.
I will illustrate that today.
Example 1. Mis-scoring the SATOn October 8, 2005 NCS Pearson, Inc., under contract to the College Entrance Examination
Board, scored an administration of the SAT Reasoning test.
Subsequently it was discovered that there was a scanning error that had affected 5,024
examinees’ scores (out of almost 1.5 million).
After rescoring it was revealed that 4,411 test scores were too low and
613 were too high.

The exams that were underscored were revised upward and the revised scores were reported to the designated colleges and universities.
The College Board decided that “it would be unfair to re-report the scores of the 613 test
takers” whose scores were improperly too high and hence did not correct them.
A motion for a preliminary injunction to force the re-scoring of these students’ tests was then
filed in the United States District Court for the District of Minnesota
(Civil Action no, 06-1481 PAM/JSM).
The College Board reported that:
“550 of 613 test takers had scores that were overstated by only 10 points; an
additional 58 had scores that were overstated by only 20 points.
Only five test takers,…, had score differences greater than 20 points,”
(three had 30 point gains, one 40 and one 50).

Why not correct the errors?
What were the statistical arguments used by College Board to not revise the erroneously too-high scores?
1. “None of the 613 test takers had overstated scores that were in excess of the standard error of measurement” or (in excess of)
2. “the standard error of the difference for the SAT.”
3. “More than one-third of the test takers – 215 out of 613 – had higher SAT scores on file”

A statistical expansionThe College Board’s argument is that if two scores are not significantly different
(e.g. 10-30 points) they are not different.
This is often called,
“The margin of error fallacy”
If it could be, it is.
An empirical challenge
Let me propose a wager aimed at those who buy the College Board argument. Let us gather a large sample,
say 100,000 pairs of students, where each pair go to the same college and have the same major, but one has a 30 point higher (though not statistically significantly
different) SAT score.
If you truly believe that such a pair are indistinguishable you should be willing to take either one as eventually
earning a higher GPA in college.
So here is the bet – I’ll take the higher scoring one (for say $10 each).
The amount of money I win (or lose) should be an indicant of the truth of the College Board’s argument.

Tests have three possible goals:
They can be used as:1. measuring instruments, 2. contests, or3. prods.
Sometimes tests are asked to serve multiple purposes, but the character of a test required to
fulfill one of these goals is often at odds with what would be required for another.
But there is always a primary purpose, and a specific test is usually constructed to accomplish
its primary goal as well as possible.

A typical instance of tests being used for measurement are diagnostic tests that
probe an examinee’s strengths and weaknesses with the goal of suggesting
remediation.
For tests of this sort the statistical machinery of standard errors is of
obvious importance, for one would want to be sure that the weaknesses noted are likely to be real so that the remediation is
not chasing noise.

A test used as a contest does not require such machinery, for the goal is to choose a winner.
Consider, as an example, the Olympic 100m dash – no one suggests that a difference of one-
hundredth of a second in the finish portends a “significant” difference, nor that if the race were
to be run again the same result would necessarily occur.
The only outcome of interest is “who won.”
Of key aspect here is that, the most important characteristic of
test as contest is that it be fair;
we cannot have stopwatches of different speeds on different runners.

Do these arguments hold water?
The SAT is, first and foremost, a contest. Winners are admitted, given scholarships, etc.
losers are not.
The College Board’s argument that because the range of inflated test scores is within the standard
error of measurement or standard error of difference then the scoring errors are “not
material” is specious.
The idea of a standard error is to provide some idea of the stability of the score if the test should be
taken repeatedly without any change in the examinee’s ability.

But that is not relevant in a contest.
For the SAT, what matters is not what your score might have been had you taken it many more times, but rather what your
score actually was – indeed what it was in comparison with the others who took it
and are in competition with you for admission, for scholarships, etc.

800700600500400300200
0
1
2
3
4
SAT-M
Gain in percentile rank
Gain in percentile rank associated
with a 10 point gain in score
The results shown in this figure tell us many things.
Two of them are:
(i) A ten-point gain in the middle of the distribution yields a bigger increase in someone’s percentile rank than would be the case in the tails (to be expected since the people are more densely packed in the middle and so a ten-point jump carries you over more of them in the middle), and
(ii) The gain can be as much as 3.5 percentile ranks.
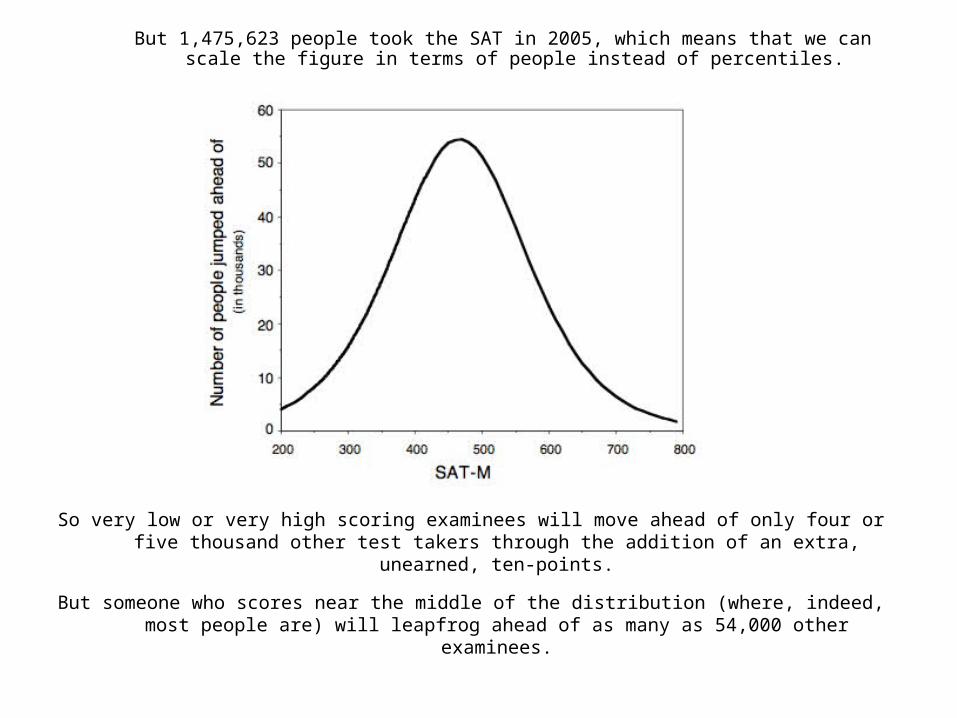
So very low or very high scoring examinees will move ahead of only four or five thousand other test takers through the addition of an extra, unearned, ten-points.
But someone who scores near the middle of the distribution (where, indeed, most people are) will leapfrog ahead of as many as 54,000 other examinees.
But 1,475,623 people took the SAT in 2005, which means that we can scale the figure in terms of people instead of percentiles.

Note that the error in scoring was tiny, affecting only a small number of examinees.
The big problem was caused by the College Board’s decision to leave erroneous scores uncorrected
and
to make up some statistical gobbly-gook to try to justify a scientifically and ethically indefensible
position.

Apparently others agreed with my assessment of the validity of the College Board’s argument, for on August 24, 2007 the
New York Times reported that the College Board and Pearson agreed to pay $2.85 million ($4,650/person).
This was ratified by Judge Joan Ericksen on November 29, 2007.
Edna Johnson, a spokeswoman for the College Board, said,
“We were eager to put this behind us and focus on the future.”
Pearson spokesman Dave Hakensen said the company declined comment.

Example 2.
National Association for College Admission Counseling’s September 2008 report on admissions testing
On September 22, 2008, the New York Times carried the first of three articles about a report, commissioned by
announcement by the National Association for College Admission Counseling, that was critical of the current,
widely used, college admissions exams, the SAT and the ACT. The commission was chaired by William R.
Fitzsimmons, the dean of admissions and financial aid at Harvard.
The report was reasonably wide-ranging and drew many conclusions while offering alternatives.
Although well-meaning, many of the suggestions only make sense
if you say them very fast.
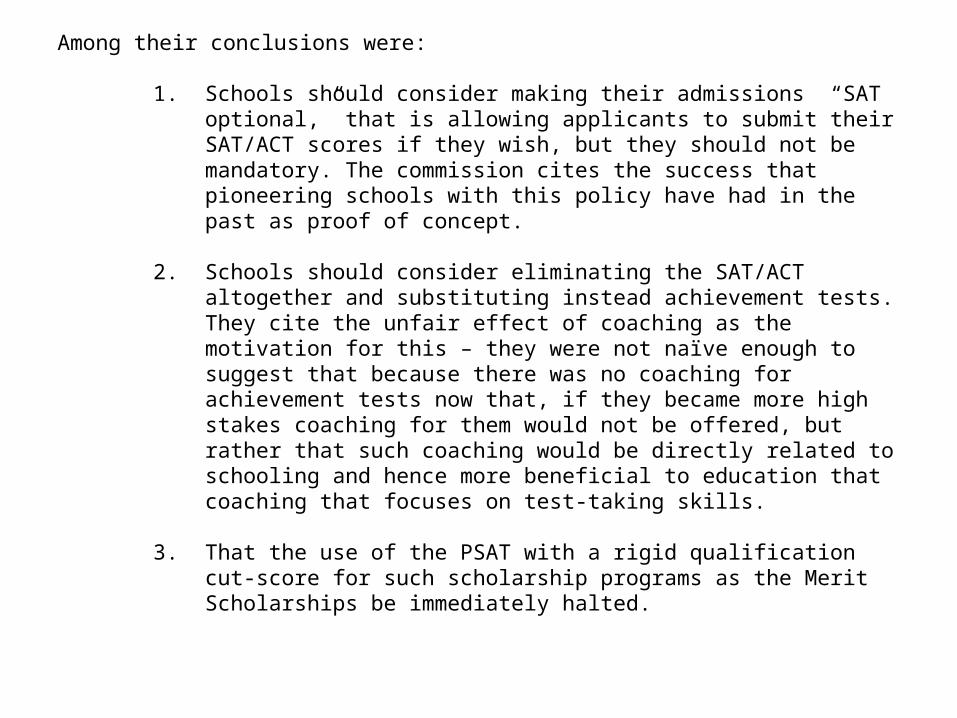
Among their conclusions were:
1. Schools should consider making their admissions “SAT optional,” that is allowing applicants to submit their SAT/ACT scores if they wish, but they should not be mandatory. The commission cites the success that pioneering schools with this policy have had in the past as proof of concept.
2. Schools should consider eliminating the SAT/ACT altogether and substituting instead achievement tests. They cite the unfair effect of coaching as the motivation for this – they were not naïve enough to suggest that because there was no coaching for achievement tests now that, if they became more high stakes coaching for them would not be offered, but rather that such coaching would be directly related to schooling and hence more beneficial to education that coaching that focuses on test-taking skills.
3. That the use of the PSAT with a rigid qualification cut-score for such scholarship programs as the Merit Scholarships be immediately halted.

Recommendation 1. Make SAT optional:
It is useful to examine those schools that have instituted “SAT Optional” policies and see if the admissions process been hampered in those schools.
The first reasonably competitive school to institute such a policy was Bowdoin College, in 1969.
Bowdoin is a small, highly competitive, liberal arts college in Brunswick, Maine.A shade under 400 students a year elect to matriculate at Bowdoin, and roughly
a quarter of them choose to not submit SAT scores.
In the following table is a summary of the classes at Bowdoin and five other institutions whose entering freshman class had approximately the same
average SAT score.
At the other five institutions the students who didn’t submit SAT scores used ACT scores instead.
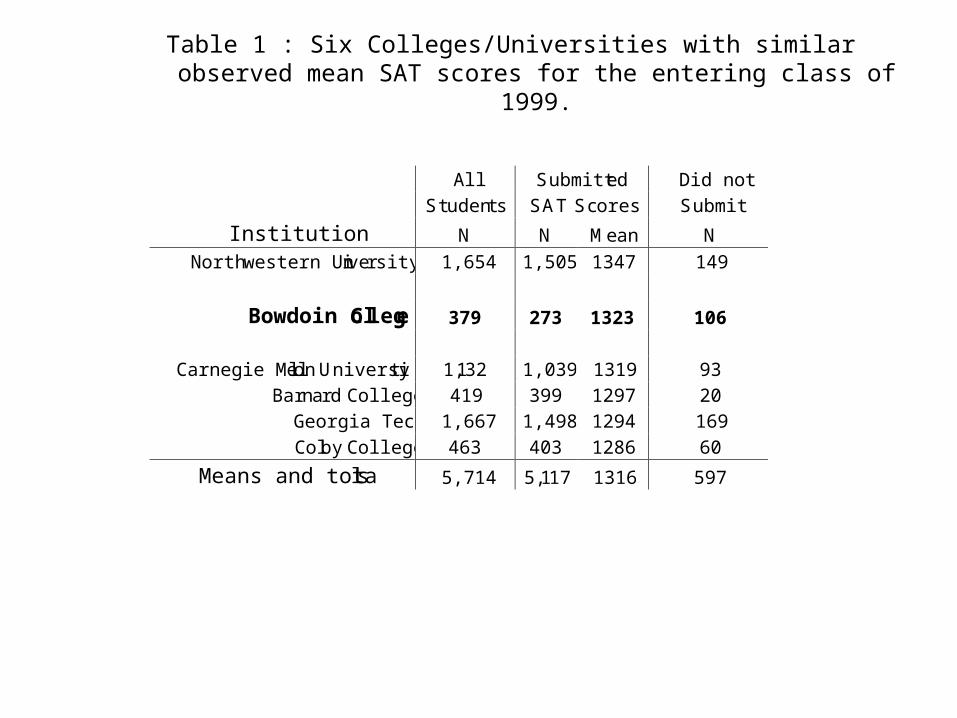
Table 1 : Six Colleges/Universities with similar observed mean SAT scores for the entering class of 1999.
All Submitted Did not Students SAT Scores Submit
Institution N N Mean N Northwestern University 1,654 1,505 1347 149
Bowdoin College 379 273 1323 106
Carnegie Mellon University 1,132 1,039 1319 93 Barnard College 419 399 1297 20
Georgia Tech 1,667 1,498 1294 169 Colby College 463 403 1286 60
Means and totals 5,714 5,117 1316 597

To know how Bowdoin’s SAT policy is working we will need to know two things:
1. How did the students who didn’t submit SAT scores do at Bowdoin in comparison to those students that did submit them?
2. Would the non-submitters performance at Bowdoin have been predicted by their SAT scores had the admissions office had access to them?

The first question is easily answered by looking at their first year grades at Bowdoin.
4.03.83.63.43.23.02.82.62.42.2
2
4
6
8
10
12
14
16
18
Submitted
SAT scores
Did not submit
SAT scores
All students
Bowdoin students who did not send their SAT scores performed
worse in their first year courses than those who did submit them
First Year Grade Point Average
Frequency
0
2.0

We see that non-SAT submitters did about a standard deviation worse than students who did
submit SAT scores.
We can conclude that if the admissions office were using other variables to make up for the missing SAT scores, those variables did not contain enough information to
prevent them from admitting a class that was academically inferior to the rest.

But would their SAT scores have provided information missing from other submitted information?
Ordinarily this would be a question that is impossible to answer, for these students did not submit their SAT
scores.
However all of these students actually took the SAT, and through a special data-gathering effort at the
Educational Testing Service we found that the students who didn’t submit these scores behaved sensibly.
And, realizing that their lower than average scores would not help their cause at Bowdoin, chose to not submit
them.
Here is the distribution of SAT scores for those who submitted them as well as those who did not.

155014501350125011501050950850750
0
5
10
15
Submitted
Unsubmitted
Total
Those students who don't submit SAT scores to Bowdoin score about 120
points lower than those who do submit their scores
SAT (V+M)
Frequency
As it turns out, the SAT scores for the students who did not submit them would have accurately predicted their lower performance at Bowdoin.
In fact the correlation between grades and SAT scores was higher for those who didn’t submit them (0.9) than for those who did (0.8).
So not having this information does not improve the academic performance of
Bowdoin’s entering class – on the contrary it diminishes it.
Why would a school opt for such a policy?Why is less information preferred to
more?

There are surely many answers to this, but one is seen in an augmented version of the earlier table 1:
All Students Submitted
SATs Did Not Submit
I nstitution N Mean N Mean N Mean
Northwestern University 1,654 1338 1,505 1347 149 1250
Bowdoin College 379 1288 273 1323 106 1201
Carnegie Mellon University 1,132 1312 1,039 1319 93 1242
Barnard College 419 1293 399 1297 20 1213
Georgia Tech 1,667 1288 1,498 1294 169 1241
Colby College 463 1278 403 1286 60 1226
Means and totals 5,714 1307 5,117 1316 597 1234
We see that if all of the students in Bowdoin’s entering class
had their SAT scores included, the average SAT atBowdoin would shrink from 1323 to 1288, and instead of
being second among these six schoolsthey would have been tied for next to last.

Since mean SAT scores are a key component in school rankings, a school can game those rankings by allowing their lowest scoring students to not be included in average.
I believe that Bowdoin’s adoption of this policy pre-dates US News & World Report’s rankings,
so that was unlikely to have been their motivation,
but I cannot say the same thing for schools that have chosen such a policy more recently.

Recommendation 2. Using Achievement Tests Instead
Driving the Commission’s recommendations was the notion that the differential availability of commercial coaching made admissions testing unfair.
They recognized that the 100 point gain (on the 1200 point SAT scale) coaching schools often tout as a typical outcome was hype and agreed with the estimates from more neutral sources of about 20 points was more likely.
But, they deemed even 20 points too many.
The Commission pointed out that there was no wide-spread coaching for achievement tests, but agreed that should the admissions option shift to achievement tests the coaching would likely follow.
This would be no fairer to those applicants who could not afford extra coaching, but at least the coaching would be of material more germane to the subject matter and less related to test-taking strategies.
One can argue with the logic of this – that a test that is less subject oriented and related more to the estimation of a general aptitude might have greater generality.
And that a test that is less related to specific subject matter might be fairer to those students whose schools have more limited resources for teaching a broad range of courses.
I find these arguments persuasive, but I have no data at hand to support them.
So instead I will take a different, albeit more technical, tack – the psychometric reality associated with replacing general aptitude tests with achievement tests means that making the kinds of comparisons that schools need among different candidates impossible.
When all students take the same tests we can compare their scores on the same basis.
The SAT and ACT were constructed specifically to be suitable for a wide range of curricula.
SAT–Math is based on mathematics no more advanced than 8th grade.
Contrast this with what would be the case with achievement tests.
There would need to be a range of tests and students would chose a subset of them that best displayed both the coursework they have had
and the areas they felt they were best in.
Some might take chemistry, others physics; some French, others music.
The current system has students typically taking three achievement tests (SAT-II).
How can such very different tests be scored so that the outcome on different tests can be compared?

Do you know more French than I know physics?
Was Mozart a better composer than Einstein was a physicist?
How can admissions officers make sensible decisions through
incomparable scores?

How are SAT-II exams scored currently?Or more specifically, how they had been scored for decades when I left the employ
of ETS nine years ago – I don’t know if they have changed anything in the interim.
They were all scored on the familiar 200-800 scales, but similar scores on two different tests are only vaguely comparable.
How could they be comparable?
What is currently done is that tests in mathematics and science are roughly equated using the SAT-Math, the aptitude test that
everyone takes, as an equating link.
In the same way tests in the humanities and social sciences are equated using the SAT-Verbal.
This is not a great solution, but is the best that can be done in a very difficult situation.
Comparing history with physics is not worth doing for even moderately close comparisons.

One obvious approach would be to norm reference each test, so that someone who scores average for all those who take a
particular test gets a 500 and someone a standard deviation higher gets a 600, etc.
This would work if the people who take each test were, in some sense, of equal ability.
But that is not only unlikely, it is empirically false.
The average student taking the French achievement test would starve to death in a French restaurant, whereas the average
person who takes the Hebrew achievement test, if dropped onto the streets of Tel Aviv in the middle of the night would do fine.
Happily the latter students also do much better on the SAT-VERBAL test and so the equating helps.
This is not true for the Spanish test, where a substantial portion of those taking it come from Spanish speaking homes.

Substituting achievement tests is not a feasible option unless
admissions officers are prepared to have subject matter quotas.
Too inflexible for the modern world I reckon.

Recommendation 3. Halt the use of a cut-score on the PSAT to qualify for Merit
ScholarshipsOne of the principal goals of the Merit Scholarship program is to
distribute a limited amount of money to highly deserving students without regard to their sex, ethnicity, or geographic
location.
This is done by first using a very cheap and wide ranging screening test.
The PSAT is dirt-cheap and is taken by about 1.5 million students annually.
The Commission objected to a rigid cut-off on the screening test.
They believed that if the cut-off was, say, at a score of 50, we could not say that someone who scored 49 was different
enough to warrant excluding them from further consideration.
They suggested replacing the PSAT with a more thorough and accurate set of measures for initial screening.
The problem with a hard and fast cut score is one that has plagued testing for more than a century.
The Indian Civil Service system, on which the American Civil Service system is based, found a clever way around it.
The passing mark to qualify for a civil service position was 20.
But if you received a 19 you were given one ‘honor point’ and qualified.
If you scored 18 you were given two honor points, and again qualified.
If you scored 17, you were given three honor points, and you qualified.
But if you scored 16 you did not qualify, for you were four points away.
I don’t know exactly what the logic was behind this system,
but I might guess that experience had shown that anyone scoring below 17 was sufficiently unlikely to be
successful in obtaining a position,
that it was foolish to include them in the competition.
But having a sharp break at 16 might have been thought too abrupt and so the method of honor points was
concocted.

How does this compare with the Merit Scholarship program?
The initial screening selects 15,000 (top 1%) from the original pool.
These 15,000 are then screened much more carefully using both the SAT and ancillary information to select down to the 1,500
winners (the top 10% of the 15,000 semi-finalists).

Once this process is viewed as a whole several things become obvious:
1. Since the winners are in the top 0.1% of the population it is dead certain these are all likely to be enormously talented individuals.
2. There will surely be many worthy individuals that were missed, but that is inevitable if there is only money for 1,500 winners.
3. Expanding the initial semifinal pool by even a few points will expand the pool of semi-finalists enormously (the normal curve grows exponentially), and those given the equivalent of some PSAT “honor points” are extraordinarily unlikely to win anyway, given the strength of the competition.
What about making the screening a more rigorous process – rather than just using the PSAT scores?
Such a screening must be more expensive, and to employ it as widely would, I suspect, use up much more of the available
resources leaving little or nothing for the actual scholarships.
The irony is that utilizing a system like that proposed by the Commission would either have to be much more limited in its initial reach, or it would have to content itself with giving out
many fewer scholarships.
Of course, one could argue that more money should be raised to do a better job in initial screening.
I would argue that if more money was available the same method of allocating should be continued and used to either give out
more scholarships or bigger ones.

This completes more of the reasoning behind my initial conclusion that some of the
recommendations of the Commission only made sense if
you said them fast.
I tried to slow things down a bit.

Example 3. High test scores as evidence of cheating?
Each year Pennsylvania students are required to take a set of standardized exams and the quality of instruction is inferred
from their aggregated scores.
The state as a whole is judged, as are the districts, the schools and the teachers.
Everyone is exhorted to get the best performance possible out of the students; but no more than that.
In 2006 in one third-grade class in a middle class district in southeastern Pennsylvania 16 out of 25 students got perfect
scores on the math portion of the test.
Although the teacher was considered talented and had always done a fine job in the past, this glittery performance was
feared to be too good to be true.

The school board investigated and brought in an expert from the University of Pennsylvania (a recent graduate of the Graduate School of Education) and paid him $200 to take a careful look
at the situation.
He spent the better part of 90 minutes doing just that and declared that the probability of obtaining a score distribution like this with just the usual instruction was vanishingly small,
leaving open only cheating as a plausible explanation.
The teacher was suspended without pay and other disciplinary measures were taken.
The teachers’ union asked a big gun from the outside to look into the matter.

A careful look revealed that the school district should be ashamed of itself.
First, the PSSA 3rd grade math test has no top.
The distribution of scores is skewed toward the high end.This is obvious in the frequency distribution of raw scores.
5 7 8 9 10 11 12 13 14 15 16 17 18 19 20 21 22 23 24 25 26 27 28 29 30 31 32 33 34 35 36 37 38 39 40 41 42 43 44 45 46 47 48 49 50 51 52 53 54 55 56 57 58 59 60 61
0
1000
2000
3000
4000
5000
6000
7000
8000
9000
10000
Frequency Distribution of PSSA 3rd grade math scores 2006
Raw Score
Frequency
Although only 2.03% of all 3rd graders statewide had
perfect scores of 61 on the test, about 22% had scores 58 or
greater.There is only a very small difference in performance
between perfect and very good.

In fact, more than half the children (54%) taking this test scored 53 or greater.
Thus the test does not distinguish very well among the best students – few would conclude that a 3rd grader who gets 58 right out of 61 on a math test was demonstrably worse than one
who got 61 right.
And no one knowledgeable about the psychometric variability of test scores would
claim that such a score difference was reliable enough to replicate in repeated testing.

But the figure above is for the entire state.What about Smith County?
What about John W. Tukey Elementary School?To answer this we must compare these two areas of interest with the state using
the summary data available to us.One such summary is shown in the table below:
From this we see that Smith County does much better than the state as a whole,
and the John Tukey School better still with fully 97% of its students being classified as Advanced or Proficient.
PSSA 3rd Grade Math 2006 Advanced Proficient Basic Below Basic
54% 28% 11% 7% State PA
73% 22% 3% 2% Smith County
72% 25% 1% 2% JWT Elem. School

There was no concern expressed about the reading test scores, and we see that on the PSSA Reading test the students of the
John Tukey School did very well indeed.
110 160 210 260 310 360
50
100
150
200
250
Read Pseudo Score

(i) Reading and math scores are reasonably highly related (r = 0.9) and that
(ii) although the John Tukey School did very well on both tests they actually did a little worse on math in 2006 than would
have been predicted by their reading scores, for they are below the regression line,
150
225
300
375
150 225 300 375
Read Pseudo Score
M
a
t
h
P
s
e
u
d
o
S
c
o
r
e

A natural question to ask now is not what the overall score distribution on math is over the state, but rather what is the conditional distribution of math scores for those schools that scored about the same in reading as the John Tukey School.
This conditional distribution is shown by the shaded portion in the next figure.

Note that the John Tukey school is in elite company, and all schools in their company are within whispering distance of perfect outcomes.

Thus if any school is going to have a substantial number of perfect scores the John Tukey school is surely a contender.
Observations:23 non-Jones students with perfect math scores had a mean reading score of 1549 with a standard error of 30.
Whereas the 16 students in Ms. Jones’s class with perfect math scores had a mean reading score of 1650 with a standard error of 41.

Shown on the right is a graph showing these results.
The boxes enclose one standard error of the mean (68% of the students under the usual normal assumption) and the vertical whiskers depict the region between 1 and 2 standard errors of the mean (encompassing 98% of the data under a normal distribution).
14
15
15
16
16
17
17
Jones
Everyone
else
PSSA Reading scores of those students
with perfect Math scores
PSSA Reading Score

We can see that Ms. Jones’s students' Reading scores are not below the reference group's (as would be expected had she
intervened).
On the contrary: her 16 perfect math students did significantly better on Reading than non-Jones students who earned perfect
Math scores.
This suggests that Ms. Jones’s students' perfect Math scores are not inconsistent with their Reading scores.
And, in fact, if the math test had a higher top her students would be predicted to do better still.
Thus based on the data we have available we cannot reject the hypothesis that Ms. Jones’s students came by their scores
honestly.

Another way to think about this is to predict math scores from reading scores and then to compare the predicted scores for the students whose perfect scores are not being questioned to those from Ms.
Jones’s class.
The results of this are:..

Note that this plot uses the regression model based on all district data except Ms. Jones’s
students..
1350
1400
1450
1500
1550
1600
1650
1700
1750
1800
1850
non-Jones
students
Jones'
students
Predicted PSSA math scores for
students who had perfect scores
Predicted PSSA Mathematics Scores
Once again we see that the students in Ms. Jones’s class who obtained perfect scores are predicted to do better than
those other students in the district whose perfect scores were unquestioned.
This provides additional evidence against the hypothesis that the perfect scores obtained by Ms. Jones’s students are
not legitimate.
In short there is no empirical evidence that Ms. Jones’s students’ scores are any less legitimate than those of
students from other classes in the district.
Conclusions1. Work hard to avoid screw-ups by setting up processes
that provide ample resources (time, personnel and money) to do a proper job. Don’t rely on checking to catch errors. Remember Ford.
2. When screw-ups occur make them as public as necessary. This will aid in finding their causes and reducing their likelihood in the future. And fix them. Remember Pearson and the College Board.
3. Keep an active eye on how your test scores are used and discourage their misuse; privately at first, publicly if that doesn’t work. Remember the National Association for College Admission Counseling & the John Tukey Middle School.

New directions – Doing Well by Doing
Good
Offer (at modest cost – at least to begin with) a high quality consulting service to users of your scores on the bounds of proper usage.