Embed Size (px)
Citation preview
vol. 164, no. 3 the american naturalist september 2004 �
Testing Species Boundaries in an Ancient Species Complexwith Deep Phylogeographic History: Genus Xantusia
(Squamata: Xantusiidae)
Elizabeth A. Sinclair,1,2,* Robert L. Bezy,3 Kathryn Bolles,3 Jose L. Camarillo R.,4 Keith A. Crandall,1,5 andJack W. Sites, Jr.1,5
1. Department of Integrative Biology, Brigham Young University,Provo, Utah 84602;2. Division of Science and Engineering, Murdoch University,Murdoch, Western Australia 6150, Australia;3. Natural History Museum of Los Angeles County, Los Angeles,California 90007;4. Laboratrio y Coleccion de Herpetolgıa, CyMA, Escuela Nacionalde Estudios Profesionales Iztacala, A.P. 314, Tlalnepantla, Estadode Mexico, Mexico;5. Monte L. Bean Life Science Museum, Brigham YoungUniversity, Provo, Utah 84602
Submitted October 3, 2002; Accepted August 27, 2003;Electronically published July 30, 2004
Online enhancements: table, figure, appendixes.
abstract: Identification of species in natural populations has re-cently received increased attention with a number of investigatorsproposing rigorous methods for species delimitation. Morphologi-cally conservative species (or species complexes) with deep phylo-genetic histories (and limited gene flow) are likely to pose particularproblems when attempting to delimit species, yet this is crucial tocomparative studies of the geography of speciation. We apply twomethods of species delimitation to an ancient group of lizards (genusXantusia) that occur throughout southwestern North America. Mi-tochondrial cytochrome b and nicotinamide adenine dinucleotidedehydrogenase subunit 4 gene sequences were generated from sam-ples taken throughout the geographic range of Xantusia. Maximumlikelihood, Bayesian, and nested cladogram analyses were used toestimate relationships among haplotypes and to infer evolutionaryprocesses. We found multiple well-supported independent lineageswithin Xantusia, for which there is considerable discordance withthe currently recognized taxonomy. High levels of sequence diver-gence (21.3%) suggest that the pattern in Xantusia may predate the
* Corresponding author. Address for correspondence: Department of Inte-
grative Biology, Brigham Young University, Provo, Utah 84602; e-mail
Am. Nat. 2004. Vol. 164, pp. 396–414. � 2004 by The University of Chicago.0003-0147/2004/16403-20370$15.00. All rights reserved.
vicariant events usually hypothesized for the fauna of the Baja Cal-ifornia peninsula, and the existence of deeply divergent clades(18.8%–26.9%) elsewhere in the complex indicates the occurrenceof ancient sundering events whose genetic signatures were not erasedby the late Wisconsin vegetation changes. We present a revised tax-onomic arrangement for this genus consistent with the distinctmtDNA lineages and discuss the phylogeographic history of thisgenus as a model system for studies of speciation in North Americandeserts.
Keywords: species boundaries, phylogeography, mtDNA, maximumlikelihood, Bayesian analysis, nested clade analysis, Xantusia.
Morphologically conservative species complexes with deepphylogeographic structure are likely to pose particularproblems when attempting to delimit species boundaries.Limited morphological variation may mask considerableevolutionary diversity in some groups (e.g., Highton 2000;Wake and Jockusch 2000), yet reliance on the mtDNAlocus alone may overresolve this diversity (Irwin 2002) orprovide misleading results (e.g., Shaw 2002). Several newmethods attempt to combine morphological and molec-ular data (Puorto et al. 2001; Wiens and Penkrot 2002)or to integrate these with ecological, physiological, or life-history data (Templeton 1998, 2001) to delimit species.Species are obviously fundamental to virtually all studiesin evolutionary biology and biodiversity assessment, andrigorous delimitation of their boundaries clearly impactsinferences made in all areas (Brown et al. 1996; Blackburnand Gaston 1998; Peterson and Navarro-Siguenza 1999).Rigorous delimitation of species coupled with detailed dis-tributional data is also required for phylogenetic study ofthe geography of speciation (Losos and Glor 2003).
Species biology lies at the interface between populationgenetics and systematics; relationships above the specieslevel are of a hierarchical nature (and hence traditionalphylogenetic methods can be used for tree reconstruction),while relationships below the species level are tokogenetic,and nonhierarchical network-based approaches are more
Phylogeography of Xantusia 397
appropriate (Davis 1996; Posada and Crandall 2001).Given the nature of these relationships, we propose thata reasonable approach to identifying species boundariesmight incorporate traditional phylogenetic methods to re-cover deep lineages and nonhierarchical methods to un-derstand shallower (unresolved) relationships within line-ages and to infer the processes responsible for their geneticdiversity. Here, we adopt the concept of species as inde-pendent evolutionary lineages (Mayden 1997; de Queiroz1998) and apply two recently developed methods to de-limit species boundaries. Wiens and Penkrot (2002) pro-pose an explicit (qualitative) protocol for delimiting spe-cies boundaries based on haplotype phylogenies integratedwith the nonhierarchical network-based approach of Tem-pleton et al. (1995; nested clade analysis [NCA]). The NCAwas recently extended explicitly to test species boundarieswithin the context of the cohesion species concept (Tem-pleton 1989, 2001). Both methods should provide the sameresult relating to the identification of independent lineages,but inferences from the NCA may also provide infor-mation about the processes leading to and following spe-ciation. We are aware of the limitations of the NCA (Know-les and Maddison 2002; Petit and Grivet 2002; Masta etal. 2003) and return to some of these points in thediscussion.
The night lizards (genus Xantusia) provide an excellentstudy system for cryptic-species diagnosis due to the largenumber of allopatric populations that are deeply divergentgenetically (Bezy and Sites 1987; Lovich 2001; Papenfusset al. 2001) but difficult to diagnose on the basis of mor-phology, when individual and geographic variation is fullyappraised (Bezy 1967a, 1967b; Bezy and Flores-Villela1999). Xantusia occurs throughout the southwestern de-sert region of North America (fig. 1; fig. A1 in the onlineedition of the American Naturalist), an area with unusuallycomplex geological and vegetational structure and history.Xantusia vigilis is the most widespread of seven currentlyrecognized species (Bezy 1982; Bezy and Flores-Villela1999; Lovich 2001; Papenfuss et al. 2001); however, itsdistribution is extremely patchy due in part to its limitedvagility (Zweifel and Lowe 1966) and close association withparticular structural niches, such as rock crevices or de-caying yuccas and agaves (Bezy 1989). These life-historycharacteristics may make this genus particularly attractiveas a model system for studies of the geography of speci-ation because historical range changes may have been suf-ficiently slow that the mode of speciation remains detect-able (Barraclough and Vogler 2000; Losos and Glor 2003).This attribute is particularly attractive in view of the cur-rent interest in using multiple clades of vertebrates in com-parative biogeographic studies of the Baja California pen-insula and warm deserts of southwestern North America(Riddle et al. 2000a, 2000b, 2000c).
Here, we take a molecular-based phylogenetic approachto hypothesize species boundaries and biogeographic pat-terns in X. vigilis using partial DNA sequences from themitochondrial cytochrome b (cyt b) and nicotinamide ad-enine dinucleotide dehydrogenase subunit 4 (ND4) generegions. Extensive sampling was conducted across the en-tire range of the genus to delimit species boundaries basedon the Wiens and Penkrot (2002) molecular approach andcontrast the biogeographic pattern reflected in the Xan-tusia phylogeny with those for other North American de-sert vertebrates. We draw attention to general issues oftesting species boundaries in morphologically conserva-tive, low-vagility species and to geographic sampling andlimitations of the NCA. Because these limitations can nowbe accommodated in future research designs, we suggestthat Xantusia offers many attributes as a model system forfurther study of the geography of speciation in south-western North America.
Material and Methods
Data Collection
We obtained mtDNA sequence data from a total of 122individuals of Xantusia from 87 localities. All localities aresummarized in table A1 and figure A1 in the online editionof the American Naturalist or are available from the au-thors on request. Our sampling locations closely reflectthe known distribution of Xantusia vigilis (map in Bezy1982), but not all known localities were sampled, and newlocalities continue to be reported (e.g., Feldman et al.2003). All named taxa were sampled, including Xantusiahenshawi gracilis ( ), Xantusia bolsonae ( ), Xan-n p 1 n p 1tusia sanchezi ( ), Xantusia riversiana ( ), andn p 2 n p 1the seven described subspecies of X. vigilis ( ), in-n p 117cluding populations recently assigned to Xantusia bezyiand Xantusia arizonae by Papenfuss et al. (2001). In ad-dition, 15 X. henshawi cyt b sequences were included (ac-cession nos. AF313374–AF313386; Lovich 2001). For out-group rooting, we generated sequences for fiveLepidophyma species, the sister group to Xantusia (Hedgeset al. 1991; Hedges and Bezy 1993; Vicario et al. 2003).
Genomic DNA was extracted using chloroform/phenolwith isopropanol precipitation (Sambrook et al. 1989)from fresh frozen liver, heart, or muscle tissue maintainedin liquid nitrogen (�194�C). Two partial mitochondrialgene regions were amplified via polymerase chain reaction(PCR) using cyt b L14841 (Bickham et al. 1995) andH15149 (Kocher et al. 1989) and ND4 (11165–11196) andLeu (12086–12111; Arevalo et al. 1994). Details of PCRamplification and sequencing protocols can be found inappendix B in the online edition of the American Natu-ralist. Sequences were edited and aligned using ClustalX
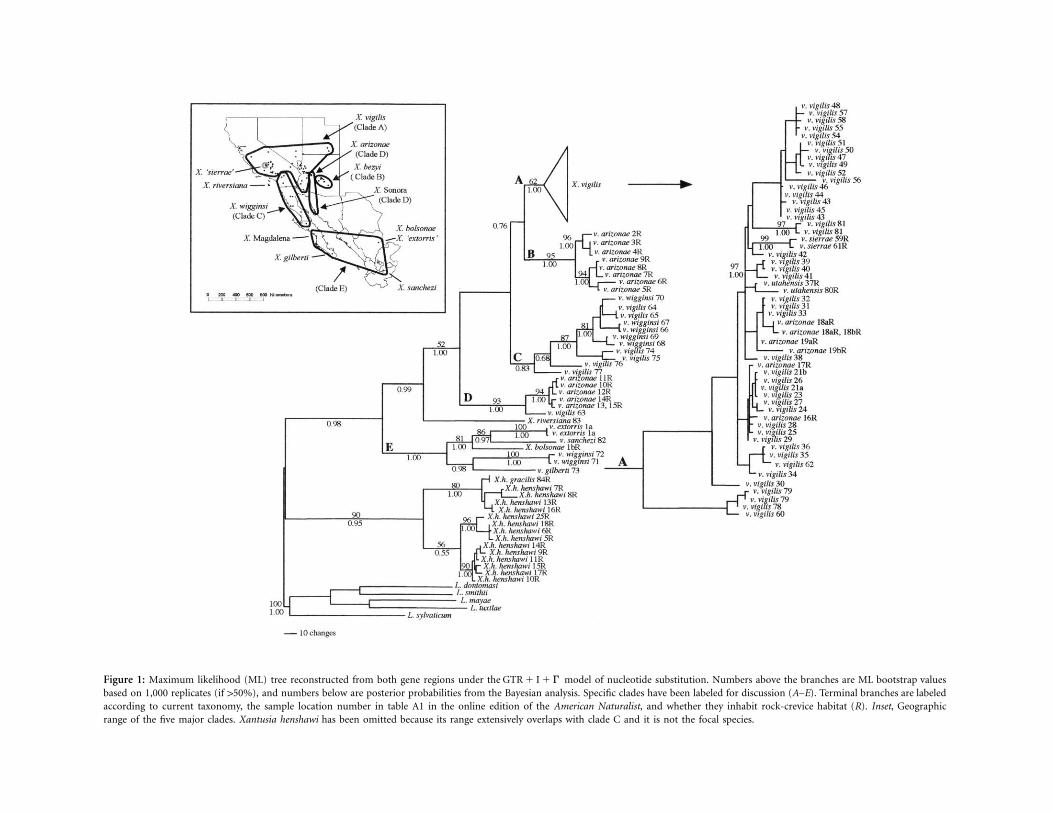
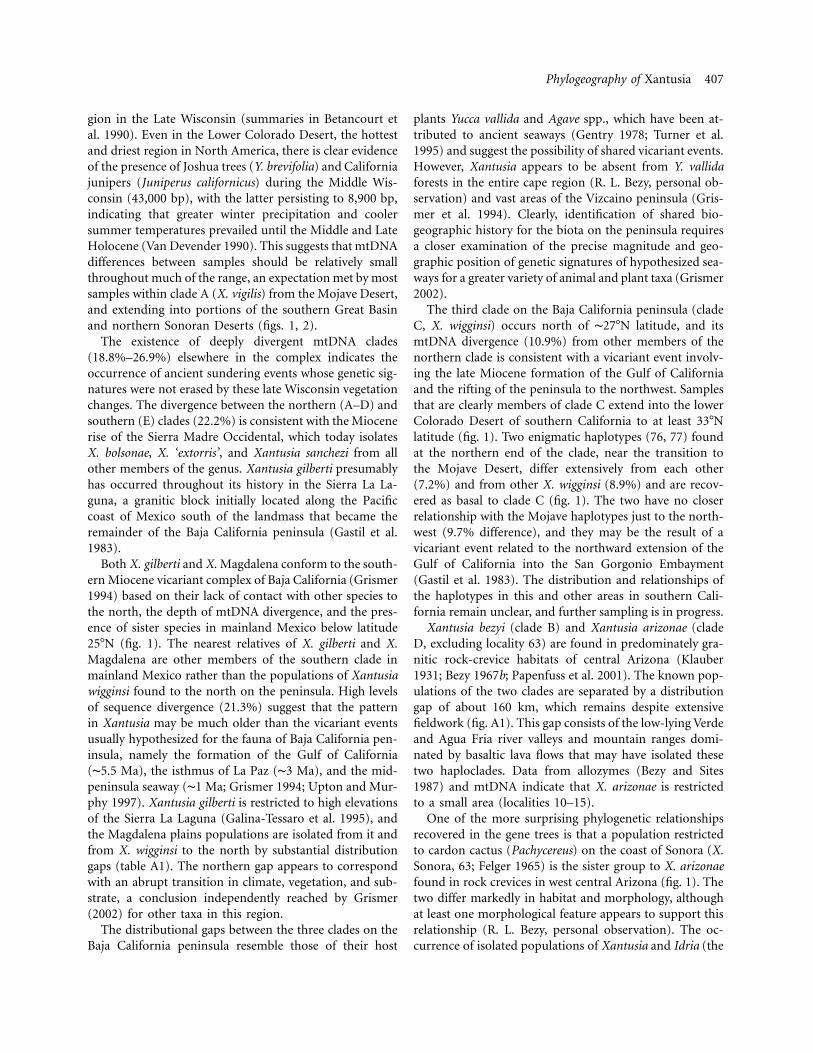
Figure 1: Maximum likelihood (ML) tree reconstructed from both gene regions under the model of nucleotide substitution. Numbers above the branches are ML bootstrap valuesGTR � I � G
based on 1,000 replicates (if 150%), and numbers below are posterior probabilities from the Bayesian analysis. Specific clades have been labeled for discussion (A–E). Terminal branches are labeledaccording to current taxonomy, the sample location number in table A1 in the online edition of the American Naturalist, and whether they inhabit rock-crevice habitat (R). Inset, Geographicrange of the five major clades. Xantusia henshawi has been omitted because its range extensively overlaps with clade C and it is not the focal species.
Phylogeography of Xantusia 399
(Thompson et al. 1997). Alignments were checked by eye.Both protein-coding regions were translated into aminoacid sequences using MacClade 4.0 (Maddison and Mad-dison 2000). Sequence-divergence estimates were based onthe combined data set incorporating the best-fit model ofevolution (see below).
Phylogenetic Approaches
We used both maximum likelihood (ML) and Bayesianmethods to reconstruct single and combined gene phy-logenies; ML analyses were performed using PAUP∗ 4.0b10(Swofford 2002) and the program Modeltest 3.06 (Posadaand Crandall 1998) to select the best-fit model of evolutionfor each gene region and for the combined data set. Treesearches were performed (heuristic search with 100 ran-dom additions and tree bisection/reconnection branchswapping) using unique haplotypes and implementing thebest-fit model. Lepidophyma sequences were designated asoutgroups, and all Xantusia sequences were defined as in-group taxa. Confidence in the nodes was assessed usingthe bootstrap procedure (Felsenstein 1985) with 1,000 re-sampling replicates, and bootstrap values ≥70% were con-sidered well supported (Hillis and Bull 1993). We evaluatedpotential conflict between topologies recovered from theindividual gene regions using the qualitative method sug-gested by Wiens (1998), which prevents a combined anal-ysis from being strongly misled by conflicting phylogenetichistories in two data sets (if these exist) and allows regionsof shared history to be corroborated by the maximumnumber of characters.
Bayesian analyses were performed for the combined dataset using the computer program MrBayes 2.0 (Huelsen-beck and Ronquist 2001). Bayesian inference of phylogenyis a probability-based method in which prior beliefs aboutthe probability of a hypothesis are combined with the like-lihood. The posterior probability of a phylogeny is ap-proximated by sampling trees from the distribution ofposterior probabilities. A model of evolution is incorpo-rated, although the model parameters were treated as un-known variables with uniform priors and are subsequentlyestimated as part of the analysis (rather than given beforethe search as in our ML analysis). Markov chain MonteCarlo (MCMC) was used to sample the phylogenies ac-cording to their posterior probabilities and was initiatedwith a random tree and run for generations, with61 # 10sampling every 1,000 generations. To ensure the Markovchain has reached stationarity (ln-likelihood values of thesample points reach a stable equilibrium; Huelsenbeck andRonquist 2001), the ln-likelihood scores for samplingpoints were plotted against generation time. All samplepoints before stationarity (burn in) were removed beforegenerating posterior probabilities. Three replicate runs
were performed, and stationarity levels were compared forconvergence (Huelsenbeck and Bollback 2001); indepen-dent analyses (which have different starting trees) wereconsidered to have converged if their ln-likelihood scoresapproach similar mean values (Leache and Reeder 2002).Four incrementally heated Markov chains were used toenable a more thorough search of the parameter space(and avoid getting stuck on local optima). A 50% majorityrule consensus tree was generated in PAUP∗, and the per-centage of samples recovering a particular clade was takenas that clade’s posterior probability (Huelsenbeck andRonquist 2001). Convergence among the independentruns was evaluated by comparing tree topology and sup-port for comparable nodes across the three consensustrees. We consider Bayesian posterior probabilities 10.95well supported (Leache and Reeder 2002).
To test for monophyly of the X. vigilis complex, weimplemented the Shimodaira-Hawegawa test (S-H test;Shimodaira and Hawegawa 1999) in PAUP∗. The tree ob-tained from our ML search was compared with a con-strained tree obtained from a second heuristic search usingthe search criteria described above. The S-H test is anappropriate nonparametric test to compare tree topologieswhen at least one of the trees being tested is selected aposteriori from analysis of the data being tested (Goldmanet al. 2000). One thousand bootstrap replicates were runusing the RELL methods option.
Nested Clade Analysis
A statistical parsimony network was constructed from cytb sequences from one densely sampled clade (see below)using the approach of Templeton et al. (1992). Thismethod has been shown to outperform parsimony analyseswhen few characters are available to differentiate betweenhaplotypes (Crandall et al. 1994; Posada and Crandall2001). This algorithm was implemented using the com-puter program TCS v1.13 (Clement et al. 2000), whichestimates the number of substitutions among haplotypesthat could be linked in the cladogram with a probabilityof 0.95 or greater and then obtains a minimum connectingnetwork of genealogical relationships. With the resultingnetwork, we then implemented the nesting algorithm ofTempleton and Sing (1993) as modified by Crandall (1996)for sequence data and followed Templeton et al. (1995) totest the association between the nested cladograms andgeographic distances among the sampled populations. Twostatistics were estimated: the clade distance Dc, which mea-sures the geographical spread of a clade, and the nestedclade distance Dn, which measures how a clade is geo-graphically distributed relative to other clades in the samehigher-level nesting category. Ten thousand permutationswere performed to discriminate among nonindependent
400 The American Naturalist
geographic distributions of haplotypes at the 95% confi-dence level using the computer program GeoDis v2.0(Posada et al. 2000). The computer programs and arevised inference key (from Templeton 1998) used tointerpret patterns of population structure and historicalevents are available at http://inbio.byu.edu/faculty/kac/crandall_lab/computer.html. We also included the modi-fication to the inference key suggested by Masta et al.(2003) and performed Tajima’s D-test (Tajima 1989) andFu’s Fs-test (Fu 1997), using Arlequin version 2.0 (Schnei-der et al. 1996), to cross-verify inferences of recent pop-ulation expansion.
Delimiting Species Boundaries
The diagnosis of taxa within Xantusia in the past has beenad hoc and ambiguous, and in this study we present apriori criteria in a hypothesis-testing framework (Sites andCrandall 1997; Sites and Marshall 2003) to delimit speciesboundaries. We used the approach described by Wiens andPenkrot (2002), which requires two sampling design com-ponents: inclusion of as many closely related referencespecies as possible to increase the strength of the exclusivitytest for the focal species of interest, and inclusion of atleast two individuals from as many localities as possibleto increase the strength of the between-population gene-flow inferences (Slatkin and Maddison 1989). To imple-ment the method, we constructed a haplotype sequencetree (using the combined data set) for all population sam-ples of the focal species (X. vigilis complex), along withall nonfocal species (all other Xantusia), and followed thechain of inference given by Wiens and Penkrot (2002; fig.1).
At shallow levels of divergence, we implemented theNCA to test the boundaries of cohesion species in a singledensely sampled exclusive group (clade A; figs. 1, 2), fol-lowing the method described by Templeton (2001). Themethod is implemented by testing two hypotheses: H1,organisms sampled are derived from a single evolutionarylineage; and H2, populations of lineages identified by re-jection of H1 are genetically exchangeable and/or ecolog-ically interchangeable. For inferring species boundaries,the relevant outcome is rejection of H1 with statistical sup-port for historical fragmentation at some clade level. Hy-pothesis two can be tested by direct statistical contrasts ofthe lineages previously identified or through the NCA withother types of data. Hypothesis two is rejected by a sig-nificant association between geography and the trait ortraits associated with genetic exchangeability or ecologicalinterchangeability and the concordant phylogenetic posi-tion of this change with the previously identified frag-mentation of evolutionary lineages (i.e., when both areidentified at the same clade level). Although data limita-
tions do not permit us to implement the statistical testrequired by H2, we can for many samples qualitativelyassess concordance between the distinct mtDNA cladesidentified by rejection of H1 and independent data sets(allozymes, chromosomes, and morphological characters).Here, we recognize candidate species from the NCA anal-ysis if the clades identified with significant support for pastfragmentation events are also distinct in at least one otherdata set and if the distribution of unique combinations ofcharacters in the second data set is also concordant withgeography.
Results
Phylogeny Estimation
Cytochrome b (cyt b). Three hundred seven base pairs (bp)of cyt b sequence data were obtained from 122 individualsof Xantusia, and these resolved 71 unique haplotypes rep-resenting 68 localities. There were 147 variable sites acrossingroup haplotypes (47.8%). Despite collecting multiplesamples for single localities and the fine-scale sampling,only 14 haplotypes were observed at more than one lo-cation, and in every case these were geographically close.Twelve individuals were sequenced from population 23;11 of these were identical, and one differed by a singlebase. The general time reversible model plus gamma dis-tribution rate heterogeneity ( ) was the best-fitGTR � G
model of evolution for the cyt b data. The base frequencieswere , , , andA p 0.3364 C p 0.3288 G p 0.0626 T p
; transition rates were (A-G) 6.0842 and (C-T)0.27223.8196; transversion rates were (A-C) 0.2571, (A-T)0.2103, (C-G) 0.5427, and (G-T) 1.0000; and a gammadistribution shape parameter (G) was 0.2988. The MLanalysis based on this model resolved a single tree (notshown) with . The Bayesian analysis�lnL p 3,686.7432recovered the same topology as the ML tree but with highernodal support. Three independent Bayesian analysesconverged on similar ln-likelihood scores (mean p
; to �3,971.3222) and�3,891.8016 range p �3,798.5574generation times (first 80,000 generations were discardedas burn in).
Nicotinamide Adenine Dinucleotide Dehydrogenase Subunit4 (ND4). Six hundred fifteen bp of ND4 sequence (in-cluding 100 bp of the histidine and serine tRNAs) wereobtained from 96 individuals of Xantusia; there was lessvariation among ND4 sequences, with 272 variable sitesamong ingroup sequences (44.2%) resolving 91 uniquehaplotypes. All sequences translated into amino acids andended with a TAA or TAG stop codon. The transversionmodel plus invariable sites plus gamma distribution rateheterogeneity ( ; Posada and Crandall 1998)TVM � I � G
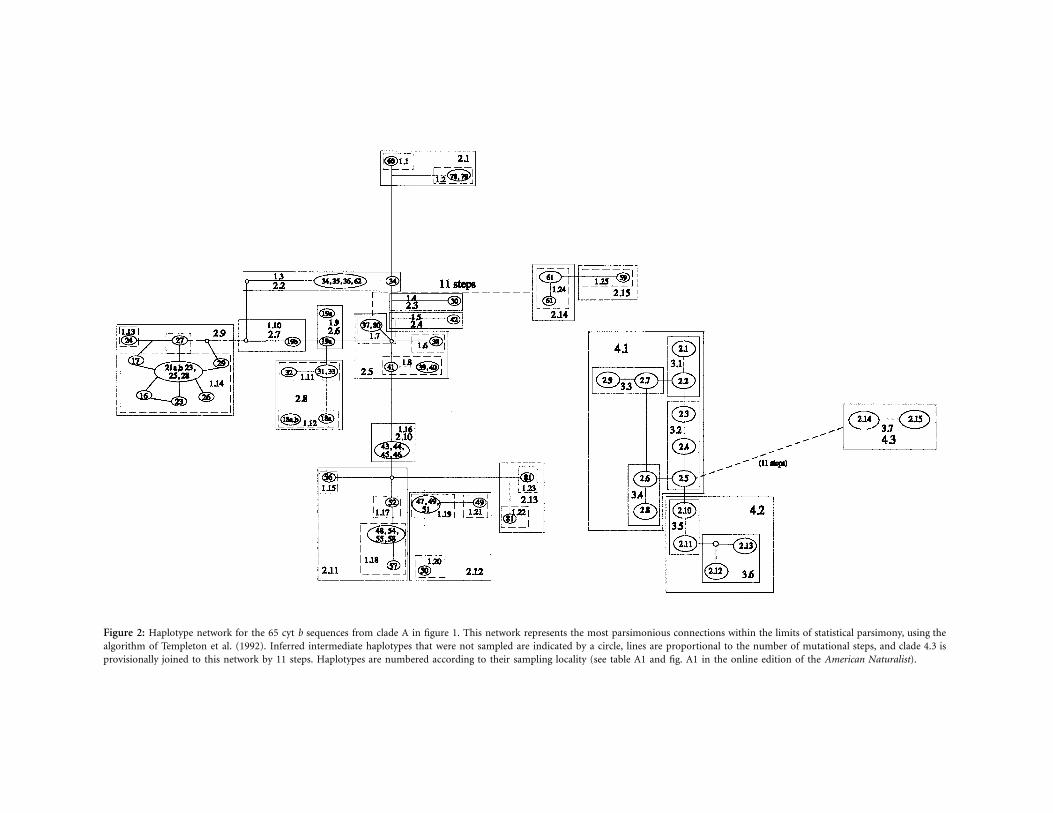
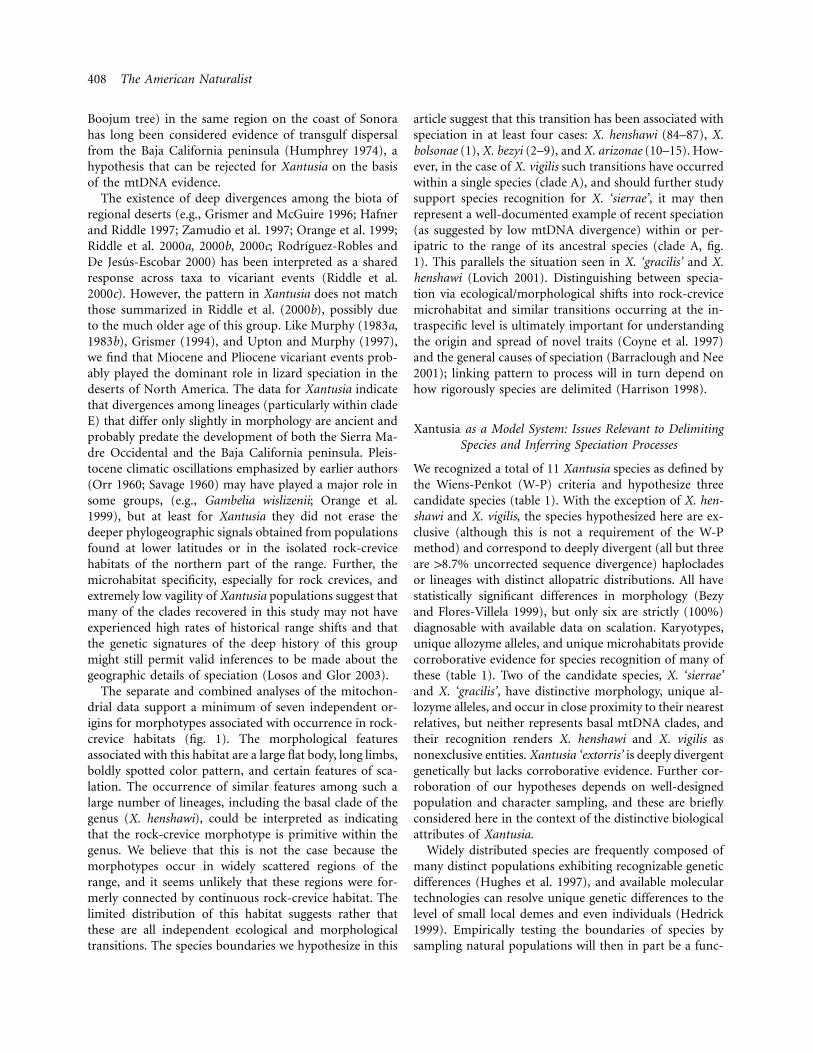
Figure 2: Haplotype network for the 65 cyt b sequences from clade A in figure 1. This network represents the most parsimonious connections within the limits of statistical parsimony, using thealgorithm of Templeton et al. (1992). Inferred intermediate haplotypes that were not sampled are indicated by a circle, lines are proportional to the number of mutational steps, and clade 4.3 isprovisionally joined to this network by 11 steps. Haplotypes are numbered according to their sampling locality (see table A1 and fig. A1 in the online edition of the American Naturalist).
402 The American Naturalist
was the best-fit model of evolution for the ND4 data. Basefrequencies were , , ,A p 0.3909 C p 0.3168 G p 0.0797and ; transition rates were (A-G) 9.3621 andT p 0.2126(C-T) 9.3621; transversion rates were (A-C) 0.7714, (A-T) 0.9099, (C-G) 0.9617, and (G-T) 1.0000; the proportionof invariable sites was 0.3532; and a gamma shape param-eter was 1.0759. The ML analysis based on this modelresolved four most likely trees with .�lnL p 6,052.8001Differences among these four trees (not shown) were re-stricted to haplotypes from three geographically proximallocalities (21a, 23, and 26) that were within the largelyunresolved clade A (see below). The Bayesian analyses re-covered the same topology as the ML tree but with highernodal support, particularly at the deeper nodes. Three rep-licate runs for the Bayesian analyses converged on similarln-likelihood scores ( ;mean p �6,188.9586 range p
to �6,225.8354), with consensus trees for the�6,154.8470independent runs differing only in the arrangement ofhaplotypes from three localities (60, 78, and 79).
Combined Phylogeny. The qualitative test of Wiens (1998)revealed no major conflicts between the trees obtained forcyt b and ND4. For 94 Xantusia terminals (excluding Xan-tusia henshawi) for which we had sequences for both genes,there were 91 unique haplotypes, including one that wasshared by two individuals from geographically proximallocations (18a and b; app. A). For phylogenetic analyseswe included 15 X. h. henshawi/gracilis sequences, althoughND4 sequence was available for only two of them (13 leftas missing data). The general time reversible model plusinvariable sites plus gamma distribution rate heterogeneity( ; Rodrıguez et al. 1990) was the best-fitGTR � I � G
model of evolution for the combined gene regions. Basefrequencies were , , ,A p 0.3660 C p 0.3267 G p 0.0743and ; transition rates were (A-G) 9.9283 andT p 0.2330(C-T) 9.0450; transversion rates were (A-C) 0.6545, (A-T) 0.7639, (C-G) 0.9102, and (G-T) 1.0000; the proportionof invariable sites was 0.3636; gamma distribution shapeparameter was 1.0632. A single most likely tree was found,with a ln-likelihood score of �9,785.6682 (fig. 1). For theBayesian analyses, the first 130,000 generations were dis-carded as burn in. The mean ln-likelihood score for theconsensus tree was �9,939.3337 ( torange p �9,904.1019�9,976.3290). The 50% majority rule consensus tree sup-ported 59 of 73 (ingroup) nodes with posterior probabil-ities ≥0.95.
The ML and Bayesian trees were very similar to eachother and to the single-gene trees (not shown). All majorclades present in the individual gene trees were retainedin the combined data tree but with slightly higher boot-strap support for most nodes. Differences in the topologiesamong the gene trees are reflected by lower ML bootstrapvalues (all !50) at the deeper nodes. Posterior probabilities
for all nodes were higher than the ML bootstrap values,but there was a significant correlation between these values( , ). Phylogenetic analysis of the2r p 0.5078 P p .0049combined data recovered five major clades within the Xan-tusia vigilis complex (fig. 1), all of which have geograph-ically cohesive ranges. All but one of the clades is stronglysupported, and three also contain strongly supported geo-graphic subclades. In order of branching sequence, frombasal to most nested, these are X. henshawi (including X.h. gracilis) in the northern peninsular ranges of Baja Cal-ifornia and southern California; clade E composed of fivedeeply divergent lineages found below 24�N latitude inmainland Mexico and Baja California; Xantusia riversiana,which is restricted to the California Islands and is the sisterspecies to all populations of the complex above 27�N lat-itude; clade D composed of two deeply divergent lineageson the coast of Sonora and in west central Arizona; cladeC on the Baja California peninsula from 27�N latitude intosouthern California; clade B in east central Arizona; anda weakly supported, widely distributed clade A found fromcentral and southern California east through southern Ne-vada, southern Utah, and western Arizona. Thus, the X.vigilis complex (clades A–E) is deeply paraphyletic withrespect to X. riversiana. When the X. vigilis complex isconstrained to be monophyletic ( ),�lnL p �9,827.6207the resulting tree is rejected as significantly less likely thanour ML tree (S-H test: ). There is thus consid-P ! .004erable discordance between the clades recovered in figure1 and the taxa as presently defined within the genus.
All haplotypes from populations inhabiting rock-crevicehabitats are indicated with an R in figure 1. The transitionfrom plant-litter to rock-crevice habitats appears to haveoccurred in a total of four major clades (henshawi, A, B,and D). Within clade A, there have also been severalyounger independent origins of the rock-crevice morpho-type (fig. 1; v. sierrae, v. utahensis, northwest Arizona),indicating repeated convergent evolution to this structuralniche.
Nested Cladogram Analysis
A statistical parsimony network was constructed from 65cyt b sequences only (fig. 2) within the poorly resolvedclade A (fig. 1) because variation at the ND4 region waslower and less informative for examining phylogeographicpatterns. The most parsimonious connections were madeto a maximum of seven mutational steps. The most distantclade (4.3) was included in the network only by invokingthe conditions of pars (Posada et al. 2000). Theprob � 1lower bootstrap support for clade A (62%; fig. 1) is con-sistent with the tentative inclusion of these haplotypes.
There was significant geographic structure associatedwith the pattern of genetic diversity, particularly at the
Phylogeography of Xantusia 403
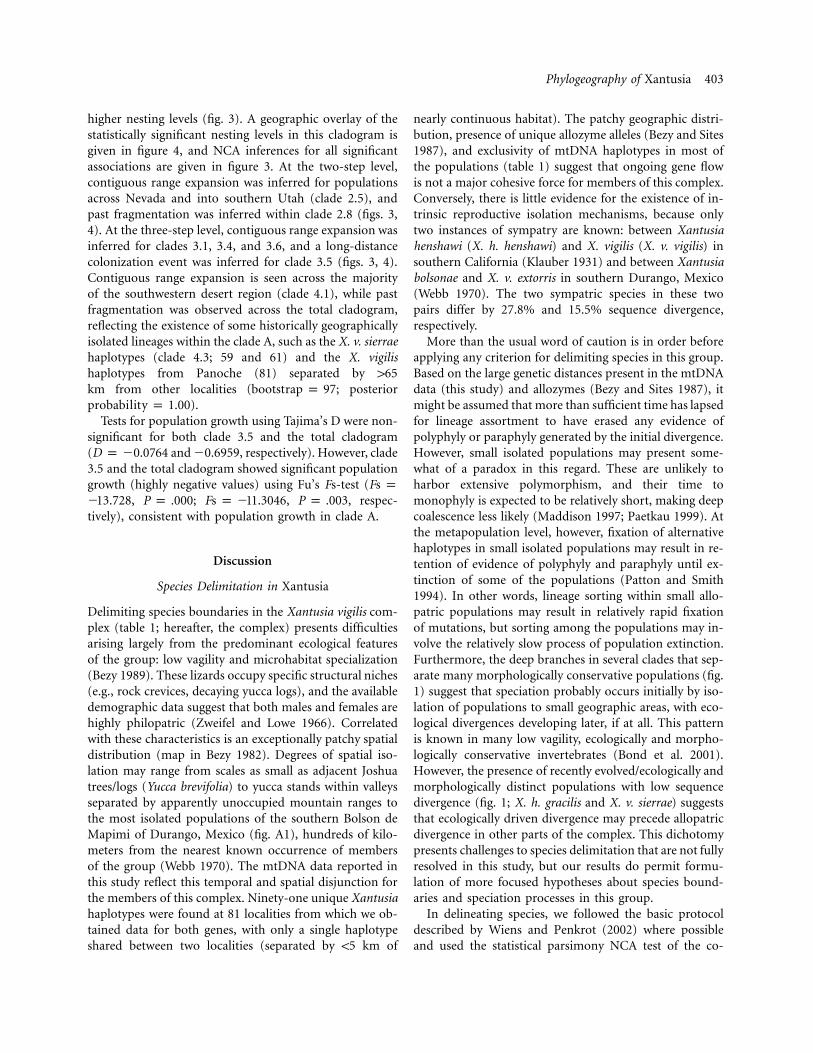
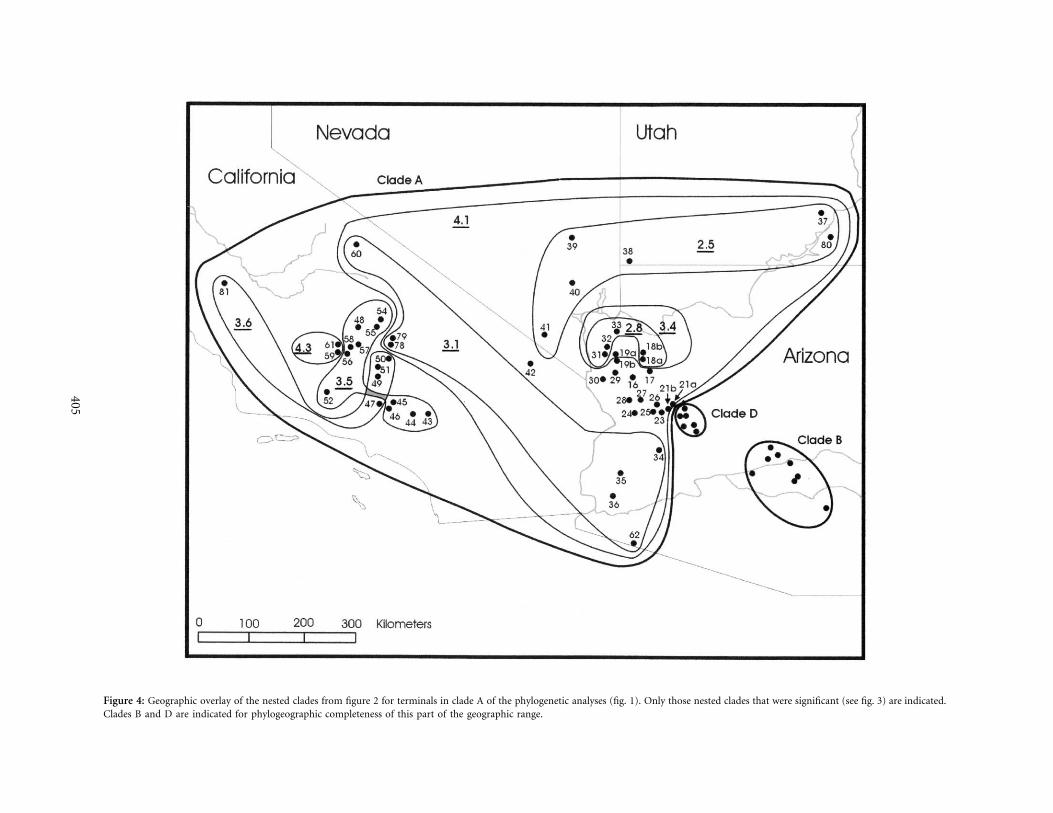
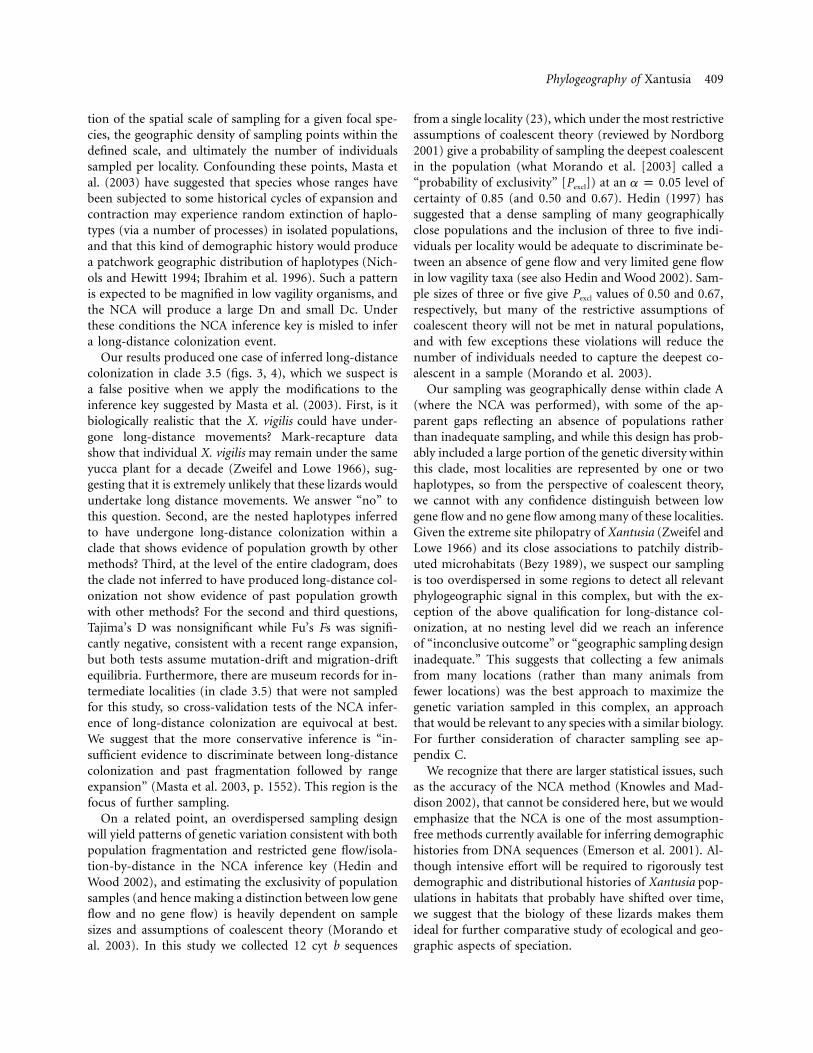
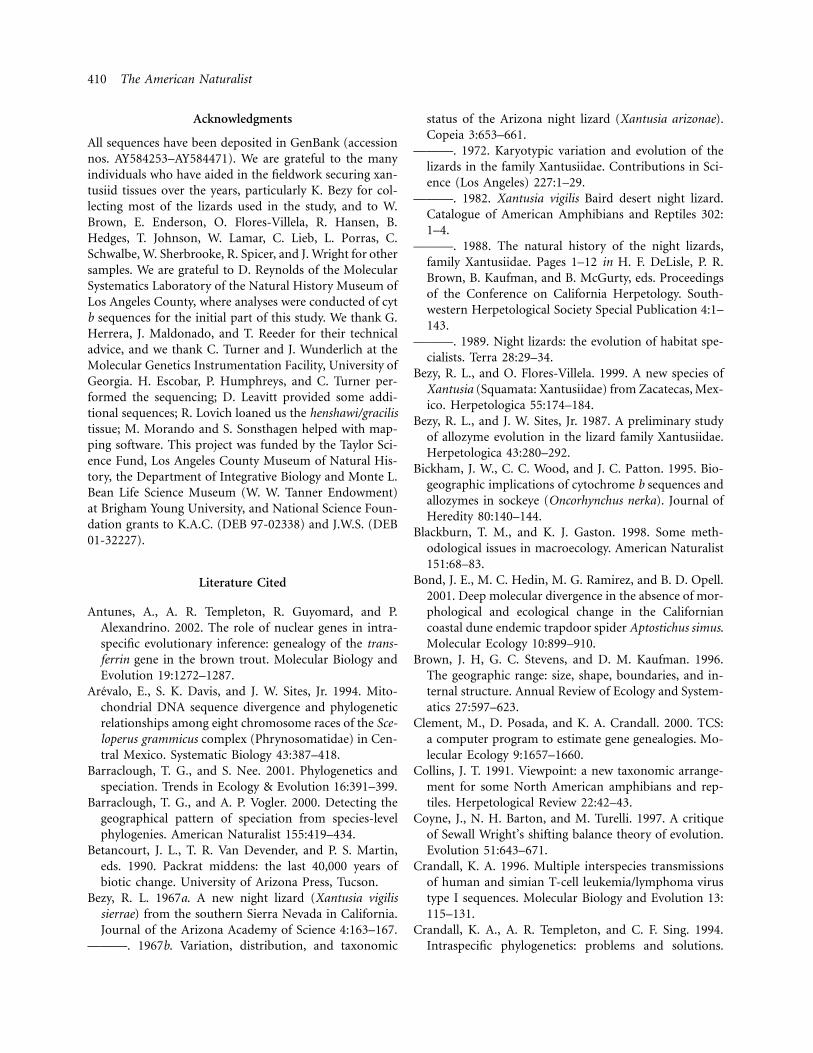
higher nesting levels (fig. 3). A geographic overlay of thestatistically significant nesting levels in this cladogram isgiven in figure 4, and NCA inferences for all significantassociations are given in figure 3. At the two-step level,contiguous range expansion was inferred for populationsacross Nevada and into southern Utah (clade 2.5), andpast fragmentation was inferred within clade 2.8 (figs. 3,4). At the three-step level, contiguous range expansion wasinferred for clades 3.1, 3.4, and 3.6, and a long-distancecolonization event was inferred for clade 3.5 (figs. 3, 4).Contiguous range expansion is seen across the majorityof the southwestern desert region (clade 4.1), while pastfragmentation was observed across the total cladogram,reflecting the existence of some historically geographicallyisolated lineages within the clade A, such as the X. v. sierraehaplotypes (clade 4.3; 59 and 61) and the X. vigilishaplotypes from Panoche (81) separated by 165km from other localities ( ; posteriorbootstrap p 97
).probability p 1.00Tests for population growth using Tajima’s D were non-
significant for both clade 3.5 and the total cladogram( and �0.6959, respectively). However, cladeD p �0.07643.5 and the total cladogram showed significant populationgrowth (highly negative values) using Fu’s Fs-test (Fs p
, ; , , respec-�13.728 P p .000 Fs p �11.3046 P p .003tively), consistent with population growth in clade A.
Discussion
Species Delimitation in Xantusia
Delimiting species boundaries in the Xantusia vigilis com-plex (table 1; hereafter, the complex) presents difficultiesarising largely from the predominant ecological featuresof the group: low vagility and microhabitat specialization(Bezy 1989). These lizards occupy specific structural niches(e.g., rock crevices, decaying yucca logs), and the availabledemographic data suggest that both males and females arehighly philopatric (Zweifel and Lowe 1966). Correlatedwith these characteristics is an exceptionally patchy spatialdistribution (map in Bezy 1982). Degrees of spatial iso-lation may range from scales as small as adjacent Joshuatrees/logs (Yucca brevifolia) to yucca stands within valleysseparated by apparently unoccupied mountain ranges tothe most isolated populations of the southern Bolson deMapimi of Durango, Mexico (fig. A1), hundreds of kilo-meters from the nearest known occurrence of membersof the group (Webb 1970). The mtDNA data reported inthis study reflect this temporal and spatial disjunction forthe members of this complex. Ninety-one unique Xantusiahaplotypes were found at 81 localities from which we ob-tained data for both genes, with only a single haplotypeshared between two localities (separated by !5 km of
nearly continuous habitat). The patchy geographic distri-bution, presence of unique allozyme alleles (Bezy and Sites1987), and exclusivity of mtDNA haplotypes in most ofthe populations (table 1) suggest that ongoing gene flowis not a major cohesive force for members of this complex.Conversely, there is little evidence for the existence of in-trinsic reproductive isolation mechanisms, because onlytwo instances of sympatry are known: between Xantusiahenshawi (X. h. henshawi) and X. vigilis (X. v. vigilis) insouthern California (Klauber 1931) and between Xantusiabolsonae and X. v. extorris in southern Durango, Mexico(Webb 1970). The two sympatric species in these twopairs differ by 27.8% and 15.5% sequence divergence,respectively.
More than the usual word of caution is in order beforeapplying any criterion for delimiting species in this group.Based on the large genetic distances present in the mtDNAdata (this study) and allozymes (Bezy and Sites 1987), itmight be assumed that more than sufficient time has lapsedfor lineage assortment to have erased any evidence ofpolyphyly or paraphyly generated by the initial divergence.However, small isolated populations may present some-what of a paradox in this regard. These are unlikely toharbor extensive polymorphism, and their time tomonophyly is expected to be relatively short, making deepcoalescence less likely (Maddison 1997; Paetkau 1999). Atthe metapopulation level, however, fixation of alternativehaplotypes in small isolated populations may result in re-tention of evidence of polyphyly and paraphyly until ex-tinction of some of the populations (Patton and Smith1994). In other words, lineage sorting within small allo-patric populations may result in relatively rapid fixationof mutations, but sorting among the populations may in-volve the relatively slow process of population extinction.Furthermore, the deep branches in several clades that sep-arate many morphologically conservative populations (fig.1) suggest that speciation probably occurs initially by iso-lation of populations to small geographic areas, with eco-logical divergences developing later, if at all. This patternis known in many low vagility, ecologically and morpho-logically conservative invertebrates (Bond et al. 2001).However, the presence of recently evolved/ecologically andmorphologically distinct populations with low sequencedivergence (fig. 1; X. h. gracilis and X. v. sierrae) suggeststhat ecologically driven divergence may precede allopatricdivergence in other parts of the complex. This dichotomypresents challenges to species delimitation that are not fullyresolved in this study, but our results do permit formu-lation of more focused hypotheses about species bound-aries and speciation processes in this group.
In delineating species, we followed the basic protocoldescribed by Wiens and Penkrot (2002) where possibleand used the statistical parsimony NCA test of the co-
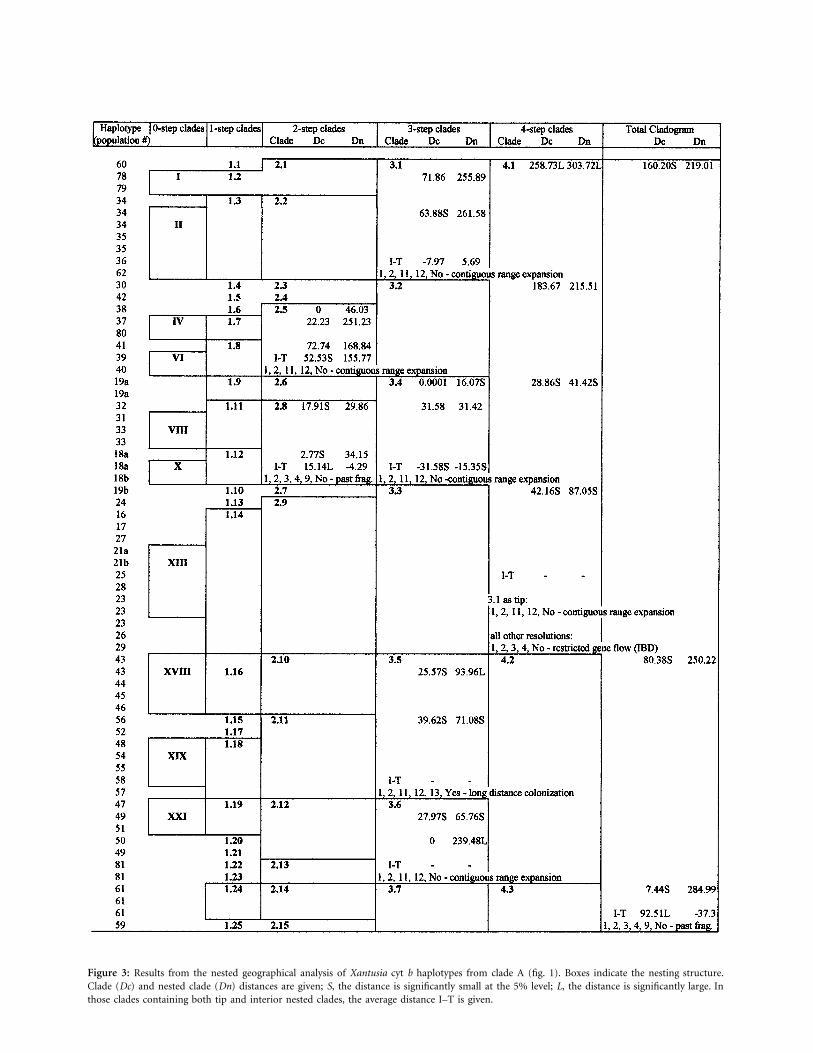
Figure 3: Results from the nested geographical analysis of Xantusia cyt b haplotypes from clade A (fig. 1). Boxes indicate the nesting structure.Clade (Dc) and nested clade (Dn) distances are given; S, the distance is significantly small at the 5% level; L, the distance is significantly large. Inthose clades containing both tip and interior nested clades, the average distance I–T is given.
405
Figure 4: Geographic overlay of the nested clades from figure 2 for terminals in clade A of the phylogenetic analyses (fig. 1). Only those nested clades that were significant (see fig. 3) are indicated.Clades B and D are indicated for phylogeographic completeness of this part of the geographic range.
406 The American Naturalist
Table 1: Taxa recognized in the genus Xantusia
Previous taxa Proposed taxa
CladeMorphologically
diagnosable
Haplotypedivergence
(%) AllelesKaryotype(2np40) MicrohabitatName Phyly Name Phyly
henshawi: P … … … … … … … …h. henshawi P henshawi P … � 5.0 4 (4) 2 Rock-crevicesh. gracilis M ‘gracilis’ M … � 5.0 2 (2) … Rock-crevicesh. bolsonae a M bolsonae M E � 15.5 2 (2) 1b Rock-crevices
riversiana M riversiana M (?) … � 15.7 5 (4) 1b Rockssanchezi a M sanchezi M E � 14.1 … 1a Plantsvigilis: a P … … … … … … … …
v. vigilisa P vigilis P A ? 3.3 0 1a Rocks/plantsv. sierrae a M ‘sierrae’ M A � 3.3 2 (2) 1a Rock-crevicesv. utahensis a M vigilis M A ? 1.0 … … Rocks/plants(v. arizonae)a P vigilis P A ? .4 0 … Rock-crevices(v. vigilis)a … Sonora M (?) D � 4.7 … 1b Plants (cardon)v. arizonae a P arizonae M D ? 4.7 7 (7) 1b Rock-crevices(v. arizonae) … bezyi M B ? 9.2 3 (3) … Rock-crevicesv. extorris a M ‘extorris’ M E ? 14.1 0 1b Plantsv. gilberti a M gilberti M (?) E � 18.8 … … Rocks/plantsv. wigginsi a P wigginsi M C ? 9.8 1 (1) 1a Plants(v. wigginsi)a … Magdalena M E � 18.8 … … Plants
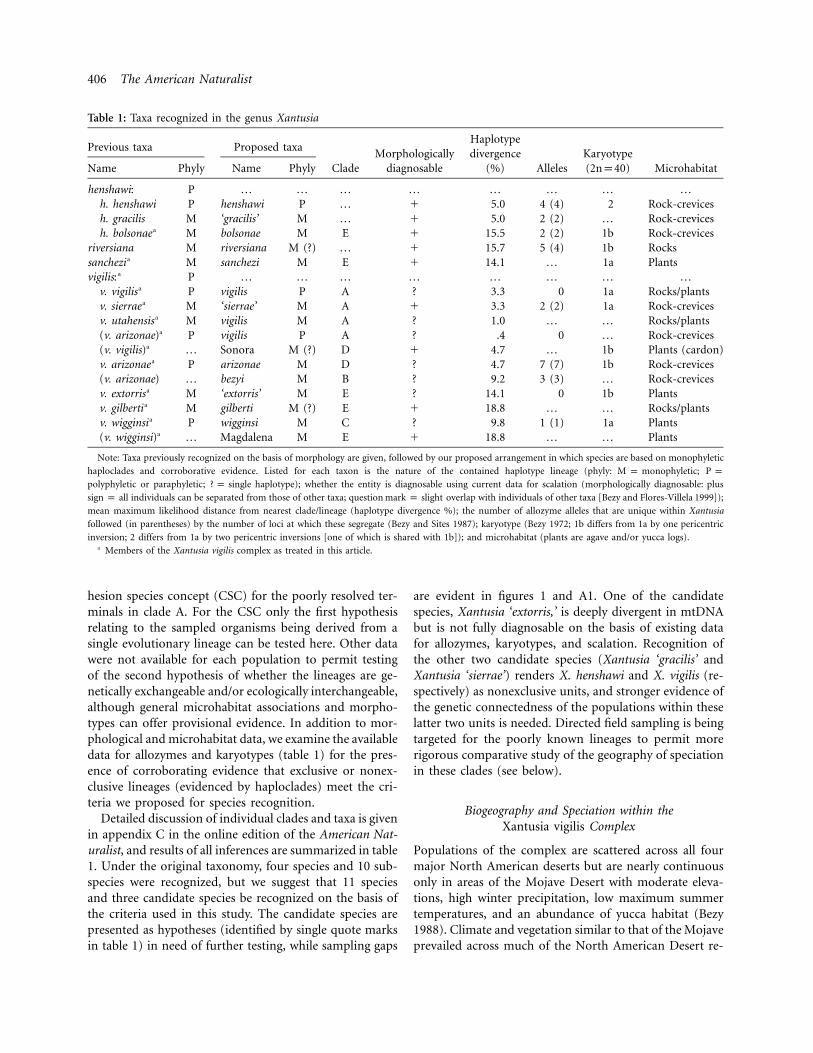
Note: Taxa previously recognized on the basis of morphology are given, followed by our proposed arrangement in which species are based on monophyletic
haploclades and corroborative evidence. Listed for each taxon is the nature of the contained haplotype lineage (phyly: ;M p monophyletic P p; haplotype); whether the entity is diagnosable using current data for scalation (morphologically diagnosable: pluspolyphyletic or paraphyletic ? p single
individuals can be separated from those of other taxa; question overlap with individuals of other taxa [Bezy and Flores-Villela 1999]);sign p all mark p slight
mean maximum likelihood distance from nearest clade/lineage (haplotype divergence %); the number of allozyme alleles that are unique within Xantusia
followed (in parentheses) by the number of loci at which these segregate (Bezy and Sites 1987); karyotype (Bezy 1972; 1b differs from 1a by one pericentric
inversion; 2 differs from 1a by two pericentric inversions [one of which is shared with 1b]); and microhabitat (plants are agave and/or yucca logs).a Members of the Xantusia vigilis complex as treated in this article.
hesion species concept (CSC) for the poorly resolved ter-minals in clade A. For the CSC only the first hypothesisrelating to the sampled organisms being derived from asingle evolutionary lineage can be tested here. Other datawere not available for each population to permit testingof the second hypothesis of whether the lineages are ge-netically exchangeable and/or ecologically interchangeable,although general microhabitat associations and morpho-types can offer provisional evidence. In addition to mor-phological and microhabitat data, we examine the availabledata for allozymes and karyotypes (table 1) for the pres-ence of corroborating evidence that exclusive or nonex-clusive lineages (evidenced by haploclades) meet the cri-teria we proposed for species recognition.
Detailed discussion of individual clades and taxa is givenin appendix C in the online edition of the American Nat-uralist, and results of all inferences are summarized in table1. Under the original taxonomy, four species and 10 sub-species were recognized, but we suggest that 11 speciesand three candidate species be recognized on the basis ofthe criteria used in this study. The candidate species arepresented as hypotheses (identified by single quote marksin table 1) in need of further testing, while sampling gaps
are evident in figures 1 and A1. One of the candidatespecies, Xantusia ‘extorris,’ is deeply divergent in mtDNAbut is not fully diagnosable on the basis of existing datafor allozymes, karyotypes, and scalation. Recognition ofthe other two candidate species (Xantusia ‘gracilis’ andXantusia ‘sierrae’) renders X. henshawi and X. vigilis (re-spectively) as nonexclusive units, and stronger evidence ofthe genetic connectedness of the populations within theselatter two units is needed. Directed field sampling is beingtargeted for the poorly known lineages to permit morerigorous comparative study of the geography of speciationin these clades (see below).
Biogeography and Speciation within theXantusia vigilis Complex
Populations of the complex are scattered across all fourmajor North American deserts but are nearly continuousonly in areas of the Mojave Desert with moderate eleva-tions, high winter precipitation, low maximum summertemperatures, and an abundance of yucca habitat (Bezy1988). Climate and vegetation similar to that of the Mojaveprevailed across much of the North American Desert re-
Phylogeography of Xantusia 407
gion in the Late Wisconsin (summaries in Betancourt etal. 1990). Even in the Lower Colorado Desert, the hottestand driest region in North America, there is clear evidenceof the presence of Joshua trees (Y. brevifolia) and Californiajunipers (Juniperus californicus) during the Middle Wis-consin (43,000 bp), with the latter persisting to 8,900 bp,indicating that greater winter precipitation and coolersummer temperatures prevailed until the Middle and LateHolocene (Van Devender 1990). This suggests that mtDNAdifferences between samples should be relatively smallthroughout much of the range, an expectation met by mostsamples within clade A (X. vigilis) from the Mojave Desert,and extending into portions of the southern Great Basinand northern Sonoran Deserts (figs. 1, 2).
The existence of deeply divergent mtDNA clades(18.8%–26.9%) elsewhere in the complex indicates theoccurrence of ancient sundering events whose genetic sig-natures were not erased by these late Wisconsin vegetationchanges. The divergence between the northern (A–D) andsouthern (E) clades (22.2%) is consistent with the Miocenerise of the Sierra Madre Occidental, which today isolatesX. bolsonae, X. ‘extorris’, and Xantusia sanchezi from allother members of the genus. Xantusia gilberti presumablyhas occurred throughout its history in the Sierra La La-guna, a granitic block initially located along the Pacificcoast of Mexico south of the landmass that became theremainder of the Baja California peninsula (Gastil et al.1983).
Both X. gilberti and X. Magdalena conform to the south-ern Miocene vicariant complex of Baja California (Grismer1994) based on their lack of contact with other species tothe north, the depth of mtDNA divergence, and the pres-ence of sister species in mainland Mexico below latitude25�N (fig. 1). The nearest relatives of X. gilberti and X.Magdalena are other members of the southern clade inmainland Mexico rather than the populations of Xantusiawigginsi found to the north on the peninsula. High levelsof sequence divergence (21.3%) suggest that the patternin Xantusia may be much older than the vicariant eventsusually hypothesized for the fauna of Baja California pen-insula, namely the formation of the Gulf of California(∼5.5 Ma), the isthmus of La Paz (∼3 Ma), and the mid-peninsula seaway (∼1 Ma; Grismer 1994; Upton and Mur-phy 1997). Xantusia gilberti is restricted to high elevationsof the Sierra La Laguna (Galina-Tessaro et al. 1995), andthe Magdalena plains populations are isolated from it andfrom X. wigginsi to the north by substantial distributiongaps (table A1). The northern gap appears to correspondwith an abrupt transition in climate, vegetation, and sub-strate, a conclusion independently reached by Grismer(2002) for other taxa in this region.
The distributional gaps between the three clades on theBaja California peninsula resemble those of their host
plants Yucca vallida and Agave spp., which have been at-tributed to ancient seaways (Gentry 1978; Turner et al.1995) and suggest the possibility of shared vicariant events.However, Xantusia appears to be absent from Y. vallidaforests in the entire cape region (R. L. Bezy, personal ob-servation) and vast areas of the Vizcaino peninsula (Gris-mer et al. 1994). Clearly, identification of shared bio-geographic history for the biota on the peninsula requiresa closer examination of the precise magnitude and geo-graphic position of genetic signatures of hypothesized sea-ways for a greater variety of animal and plant taxa (Grismer2002).
The third clade on the Baja California peninsula (cladeC, X. wigginsi) occurs north of ∼27�N latitude, and itsmtDNA divergence (10.9%) from other members of thenorthern clade is consistent with a vicariant event involv-ing the late Miocene formation of the Gulf of Californiaand the rifting of the peninsula to the northwest. Samplesthat are clearly members of clade C extend into the lowerColorado Desert of southern California to at least 33�Nlatitude (fig. 1). Two enigmatic haplotypes (76, 77) foundat the northern end of the clade, near the transition tothe Mojave Desert, differ extensively from each other(7.2%) and from other X. wigginsi (8.9%) and are recov-ered as basal to clade C (fig. 1). The two have no closerrelationship with the Mojave haplotypes just to the north-west (9.7% difference), and they may be the result of avicariant event related to the northward extension of theGulf of California into the San Gorgonio Embayment(Gastil et al. 1983). The distribution and relationships ofthe haplotypes in this and other areas in southern Cali-fornia remain unclear, and further sampling is in progress.
Xantusia bezyi (clade B) and Xantusia arizonae (cladeD, excluding locality 63) are found in predominately gra-nitic rock-crevice habitats of central Arizona (Klauber1931; Bezy 1967b; Papenfuss et al. 2001). The known pop-ulations of the two clades are separated by a distributiongap of about 160 km, which remains despite extensivefieldwork (fig. A1). This gap consists of the low-lying Verdeand Agua Fria river valleys and mountain ranges domi-nated by basaltic lava flows that may have isolated thesetwo haploclades. Data from allozymes (Bezy and Sites1987) and mtDNA indicate that X. arizonae is restrictedto a small area (localities 10–15).
One of the more surprising phylogenetic relationshipsrecovered in the gene trees is that a population restrictedto cardon cactus (Pachycereus) on the coast of Sonora (X.Sonora, 63; Felger 1965) is the sister group to X. arizonaefound in rock crevices in west central Arizona (fig. 1). Thetwo differ markedly in habitat and morphology, althoughat least one morphological feature appears to support thisrelationship (R. L. Bezy, personal observation). The oc-currence of isolated populations of Xantusia and Idria (the
408 The American Naturalist
Boojum tree) in the same region on the coast of Sonorahas long been considered evidence of transgulf dispersalfrom the Baja California peninsula (Humphrey 1974), ahypothesis that can be rejected for Xantusia on the basisof the mtDNA evidence.
The existence of deep divergences among the biota ofregional deserts (e.g., Grismer and McGuire 1996; Hafnerand Riddle 1997; Zamudio et al. 1997; Orange et al. 1999;Riddle et al. 2000a, 2000b, 2000c; Rodrıguez-Robles andDe Jesus-Escobar 2000) has been interpreted as a sharedresponse across taxa to vicariant events (Riddle et al.2000c). However, the pattern in Xantusia does not matchthose summarized in Riddle et al. (2000b), possibly dueto the much older age of this group. Like Murphy (1983a,1983b), Grismer (1994), and Upton and Murphy (1997),we find that Miocene and Pliocene vicariant events prob-ably played the dominant role in lizard speciation in thedeserts of North America. The data for Xantusia indicatethat divergences among lineages (particularly within cladeE) that differ only slightly in morphology are ancient andprobably predate the development of both the Sierra Ma-dre Occidental and the Baja California peninsula. Pleis-tocene climatic oscillations emphasized by earlier authors(Orr 1960; Savage 1960) may have played a major role insome groups, (e.g., Gambelia wislizenii; Orange et al.1999), but at least for Xantusia they did not erase thedeeper phylogeographic signals obtained from populationsfound at lower latitudes or in the isolated rock-crevicehabitats of the northern part of the range. Further, themicrohabitat specificity, especially for rock crevices, andextremely low vagility of Xantusia populations suggest thatmany of the clades recovered in this study may not haveexperienced high rates of historical range shifts and thatthe genetic signatures of the deep history of this groupmight still permit valid inferences to be made about thegeographic details of speciation (Losos and Glor 2003).
The separate and combined analyses of the mitochon-drial data support a minimum of seven independent or-igins for morphotypes associated with occurrence in rock-crevice habitats (fig. 1). The morphological featuresassociated with this habitat are a large flat body, long limbs,boldly spotted color pattern, and certain features of sca-lation. The occurrence of similar features among such alarge number of lineages, including the basal clade of thegenus (X. henshawi), could be interpreted as indicatingthat the rock-crevice morphotype is primitive within thegenus. We believe that this is not the case because themorphotypes occur in widely scattered regions of therange, and it seems unlikely that these regions were for-merly connected by continuous rock-crevice habitat. Thelimited distribution of this habitat suggests rather thatthese are all independent ecological and morphologicaltransitions. The species boundaries we hypothesize in this
article suggest that this transition has been associated withspeciation in at least four cases: X. henshawi (84–87), X.bolsonae (1), X. bezyi (2–9), and X. arizonae (10–15). How-ever, in the case of X. vigilis such transitions have occurredwithin a single species (clade A), and should further studysupport species recognition for X. ‘sierrae’, it may thenrepresent a well-documented example of recent speciation(as suggested by low mtDNA divergence) within or per-ipatric to the range of its ancestral species (clade A, fig.1). This parallels the situation seen in X. ‘gracilis’ and X.henshawi (Lovich 2001). Distinguishing between specia-tion via ecological/morphological shifts into rock-crevicemicrohabitat and similar transitions occurring at the in-traspecific level is ultimately important for understandingthe origin and spread of novel traits (Coyne et al. 1997)and the general causes of speciation (Barraclough and Nee2001); linking pattern to process will in turn depend onhow rigorously species are delimited (Harrison 1998).
Xantusia as a Model System: Issues Relevant to DelimitingSpecies and Inferring Speciation Processes
We recognized a total of 11 Xantusia species as defined bythe Wiens-Penkot (W-P) criteria and hypothesize threecandidate species (table 1). With the exception of X. hen-shawi and X. vigilis, the species hypothesized here are ex-clusive (although this is not a requirement of the W-Pmethod) and correspond to deeply divergent (all but threeare 18.7% uncorrected sequence divergence) haplocladesor lineages with distinct allopatric distributions. All havestatistically significant differences in morphology (Bezyand Flores-Villela 1999), but only six are strictly (100%)diagnosable with available data on scalation. Karyotypes,unique allozyme alleles, and unique microhabitats providecorroborative evidence for species recognition of many ofthese (table 1). Two of the candidate species, X. ‘sierrae’and X. ‘gracilis’, have distinctive morphology, unique al-lozyme alleles, and occur in close proximity to their nearestrelatives, but neither represents basal mtDNA clades, andtheir recognition renders X. henshawi and X. vigilis asnonexclusive entities. Xantusia ‘extorris’ is deeply divergentgenetically but lacks corroborative evidence. Further cor-roboration of our hypotheses depends on well-designedpopulation and character sampling, and these are brieflyconsidered here in the context of the distinctive biologicalattributes of Xantusia.
Widely distributed species are frequently composed ofmany distinct populations exhibiting recognizable geneticdifferences (Hughes et al. 1997), and available moleculartechnologies can resolve unique genetic differences to thelevel of small local demes and even individuals (Hedrick1999). Empirically testing the boundaries of species bysampling natural populations will then in part be a func-
Phylogeography of Xantusia 409
tion of the spatial scale of sampling for a given focal spe-cies, the geographic density of sampling points within thedefined scale, and ultimately the number of individualssampled per locality. Confounding these points, Masta etal. (2003) have suggested that species whose ranges havebeen subjected to some historical cycles of expansion andcontraction may experience random extinction of haplo-types (via a number of processes) in isolated populations,and that this kind of demographic history would producea patchwork geographic distribution of haplotypes (Nich-ols and Hewitt 1994; Ibrahim et al. 1996). Such a patternis expected to be magnified in low vagility organisms, andthe NCA will produce a large Dn and small Dc. Underthese conditions the NCA inference key is misled to infera long-distance colonization event.
Our results produced one case of inferred long-distancecolonization in clade 3.5 (figs. 3, 4), which we suspect isa false positive when we apply the modifications to theinference key suggested by Masta et al. (2003). First, is itbiologically realistic that the X. vigilis could have under-gone long-distance movements? Mark-recapture datashow that individual X. vigilis may remain under the sameyucca plant for a decade (Zweifel and Lowe 1966), sug-gesting that it is extremely unlikely that these lizards wouldundertake long distance movements. We answer “no” tothis question. Second, are the nested haplotypes inferredto have undergone long-distance colonization within aclade that shows evidence of population growth by othermethods? Third, at the level of the entire cladogram, doesthe clade not inferred to have produced long-distance col-onization not show evidence of past population growthwith other methods? For the second and third questions,Tajima’s D was nonsignificant while Fu’s Fs was signifi-cantly negative, consistent with a recent range expansion,but both tests assume mutation-drift and migration-driftequilibria. Furthermore, there are museum records for in-termediate localities (in clade 3.5) that were not sampledfor this study, so cross-validation tests of the NCA infer-ence of long-distance colonization are equivocal at best.We suggest that the more conservative inference is “in-sufficient evidence to discriminate between long-distancecolonization and past fragmentation followed by rangeexpansion” (Masta et al. 2003, p. 1552). This region is thefocus of further sampling.
On a related point, an overdispersed sampling designwill yield patterns of genetic variation consistent with bothpopulation fragmentation and restricted gene flow/isola-tion-by-distance in the NCA inference key (Hedin andWood 2002), and estimating the exclusivity of populationsamples (and hence making a distinction between low geneflow and no gene flow) is heavily dependent on samplesizes and assumptions of coalescent theory (Morando etal. 2003). In this study we collected 12 cyt b sequences
from a single locality (23), which under the most restrictiveassumptions of coalescent theory (reviewed by Nordborg2001) give a probability of sampling the deepest coalescentin the population (what Morando et al. [2003] called a“probability of exclusivity” [Pexcl]) at an level ofa p 0.05certainty of 0.85 (and 0.50 and 0.67). Hedin (1997) hassuggested that a dense sampling of many geographicallyclose populations and the inclusion of three to five indi-viduals per locality would be adequate to discriminate be-tween an absence of gene flow and very limited gene flowin low vagility taxa (see also Hedin and Wood 2002). Sam-ple sizes of three or five give Pexcl values of 0.50 and 0.67,respectively, but many of the restrictive assumptions ofcoalescent theory will not be met in natural populations,and with few exceptions these violations will reduce thenumber of individuals needed to capture the deepest co-alescent in a sample (Morando et al. 2003).
Our sampling was geographically dense within clade A(where the NCA was performed), with some of the ap-parent gaps reflecting an absence of populations ratherthan inadequate sampling, and while this design has prob-ably included a large portion of the genetic diversity withinthis clade, most localities are represented by one or twohaplotypes, so from the perspective of coalescent theory,we cannot with any confidence distinguish between lowgene flow and no gene flow among many of these localities.Given the extreme site philopatry of Xantusia (Zweifel andLowe 1966) and its close associations to patchily distrib-uted microhabitats (Bezy 1989), we suspect our samplingis too overdispersed in some regions to detect all relevantphylogeographic signal in this complex, but with the ex-ception of the above qualification for long-distance col-onization, at no nesting level did we reach an inferenceof “inconclusive outcome” or “geographic sampling designinadequate.” This suggests that collecting a few animalsfrom many locations (rather than many animals fromfewer locations) was the best approach to maximize thegenetic variation sampled in this complex, an approachthat would be relevant to any species with a similar biology.For further consideration of character sampling see ap-pendix C.
We recognize that there are larger statistical issues, suchas the accuracy of the NCA method (Knowles and Mad-dison 2002), that cannot be considered here, but we wouldemphasize that the NCA is one of the most assumption-free methods currently available for inferring demographichistories from DNA sequences (Emerson et al. 2001). Al-though intensive effort will be required to rigorously testdemographic and distributional histories of Xantusia pop-ulations in habitats that probably have shifted over time,we suggest that the biology of these lizards makes themideal for further comparative study of ecological and geo-graphic aspects of speciation.
410 The American Naturalist
Acknowledgments
All sequences have been deposited in GenBank (accessionnos. AY584253–AY584471). We are grateful to the manyindividuals who have aided in the fieldwork securing xan-tusiid tissues over the years, particularly K. Bezy for col-lecting most of the lizards used in the study, and to W.Brown, E. Enderson, O. Flores-Villela, R. Hansen, B.Hedges, T. Johnson, W. Lamar, C. Lieb, L. Porras, C.Schwalbe, W. Sherbrooke, R. Spicer, and J. Wright for othersamples. We are grateful to D. Reynolds of the MolecularSystematics Laboratory of the Natural History Museum ofLos Angeles County, where analyses were conducted of cytb sequences for the initial part of this study. We thank G.Herrera, J. Maldonado, and T. Reeder for their technicaladvice, and we thank C. Turner and J. Wunderlich at theMolecular Genetics Instrumentation Facility, University ofGeorgia. H. Escobar, P. Humphreys, and C. Turner per-formed the sequencing; D. Leavitt provided some addi-tional sequences; R. Lovich loaned us the henshawi/gracilistissue; M. Morando and S. Sonsthagen helped with map-ping software. This project was funded by the Taylor Sci-ence Fund, Los Angeles County Museum of Natural His-tory, the Department of Integrative Biology and Monte L.Bean Life Science Museum (W. W. Tanner Endowment)at Brigham Young University, and National Science Foun-dation grants to K.A.C. (DEB 97-02338) and J.W.S. (DEB01-32227).
Literature Cited
Antunes, A., A. R. Templeton, R. Guyomard, and P.Alexandrino. 2002. The role of nuclear genes in intra-specific evolutionary inference: genealogy of the trans-ferrin gene in the brown trout. Molecular Biology andEvolution 19:1272–1287.
Arevalo, E., S. K. Davis, and J. W. Sites, Jr. 1994. Mito-chondrial DNA sequence divergence and phylogeneticrelationships among eight chromosome races of the Sce-loperus grammicus complex (Phrynosomatidae) in Cen-tral Mexico. Systematic Biology 43:387–418.
Barraclough, T. G., and S. Nee. 2001. Phylogenetics andspeciation. Trends in Ecology & Evolution 16:391–399.
Barraclough, T. G., and A. P. Vogler. 2000. Detecting thegeographical pattern of speciation from species-levelphylogenies. American Naturalist 155:419–434.
Betancourt, J. L., T. R. Van Devender, and P. S. Martin,eds. 1990. Packrat middens: the last 40,000 years ofbiotic change. University of Arizona Press, Tucson.
Bezy, R. L. 1967a. A new night lizard (Xantusia vigilissierrae) from the southern Sierra Nevada in California.Journal of the Arizona Academy of Science 4:163–167.
———. 1967b. Variation, distribution, and taxonomic
status of the Arizona night lizard (Xantusia arizonae).Copeia 3:653–661.
———. 1972. Karyotypic variation and evolution of thelizards in the family Xantusiidae. Contributions in Sci-ence (Los Angeles) 227:1–29.
———. 1982. Xantusia vigilis Baird desert night lizard.Catalogue of American Amphibians and Reptiles 302:1–4.
———. 1988. The natural history of the night lizards,family Xantusiidae. Pages 1–12 in H. F. DeLisle, P. R.Brown, B. Kaufman, and B. McGurty, eds. Proceedingsof the Conference on California Herpetology. South-western Herpetological Society Special Publication 4:1–143.
———. 1989. Night lizards: the evolution of habitat spe-cialists. Terra 28:29–34.
Bezy, R. L., and O. Flores-Villela. 1999. A new species ofXantusia (Squamata: Xantusiidae) from Zacatecas, Mex-ico. Herpetologica 55:174–184.
Bezy, R. L., and J. W. Sites, Jr. 1987. A preliminary studyof allozyme evolution in the lizard family Xantusiidae.Herpetologica 43:280–292.
Bickham, J. W., C. C. Wood, and J. C. Patton. 1995. Bio-geographic implications of cytochrome b sequences andallozymes in sockeye (Oncorhynchus nerka). Journal ofHeredity 80:140–144.
Blackburn, T. M., and K. J. Gaston. 1998. Some meth-odological issues in macroecology. American Naturalist151:68–83.
Bond, J. E., M. C. Hedin, M. G. Ramirez, and B. D. Opell.2001. Deep molecular divergence in the absence of mor-phological and ecological change in the Californiancoastal dune endemic trapdoor spider Aptostichus simus.Molecular Ecology 10:899–910.
Brown, J. H, G. C. Stevens, and D. M. Kaufman. 1996.The geographic range: size, shape, boundaries, and in-ternal structure. Annual Review of Ecology and System-atics 27:597–623.
Clement, M., D. Posada, and K. A. Crandall. 2000. TCS:a computer program to estimate gene genealogies. Mo-lecular Ecology 9:1657–1660.
Collins, J. T. 1991. Viewpoint: a new taxonomic arrange-ment for some North American amphibians and rep-tiles. Herpetological Review 22:42–43.
Coyne, J., N. H. Barton, and M. Turelli. 1997. A critiqueof Sewall Wright’s shifting balance theory of evolution.Evolution 51:643–671.
Crandall, K. A. 1996. Multiple interspecies transmissionsof human and simian T-cell leukemia/lymphoma virustype I sequences. Molecular Biology and Evolution 13:115–131.
Crandall, K. A., A. R. Templeton, and C. F. Sing. 1994.Intraspecific phylogenetics: problems and solutions.
Phylogeography of Xantusia 411
Pages 273–297 in R. W. Scotland, D. J. Siebert, and D.M. Williams, eds. Models of phylogeny reconstruction.Clarendon, Oxford.
Davis, J. I. 1996. Phylogenetics, molecular variation, andspecies concepts. BioScience 46:502–511.
de Queiroz, K. 1998. The general lineage concept of spe-cies, species criteria, and the process of speciation. Pages57–75 in D. J. Howard and S. H. Berlocher, eds. Endlessforms: species and speciation. Oxford University Press,Oxford.
Emerson, B., C. E. Paradis, and C. Thebaud. 2001. Re-vealing the demographic histories of species using DNAsequences. Trends in Ecology & Evolution 16:707–716.
Feldman, C. R., D. G. Mulcahy, and R. W. Hansen. 2003.Geographic distribution: Xantusia vigilis. HerpetologicalReview 34:167.
Felger, R. S. 1965. Xantusia vigilis and its habitat in Sonora,Mexico. Herpetologica 21:146–147.
Felsenstein, J. 1985. Confidence limits on phylogenies: anapproach using the bootstrap. Evolution 39:783–791.
Fu, Y.-X. 1997. Statistical test of neutrality of mutationsagainst population growth, hitchhiking, and back-ground selection. Genetics 147:915–925.
Galina-Tessaro, P., S. Alvarez-Cardenas, A. Ortego-Rubio,and A. Gonzalez-Romero. 1995. Lizards of the Sierrade La Laguna, Baja California Sur, Mexico. Pages 638–642 in L. F. DeBano, P. F. Ffolliott, A. Ortega-Rubio, G.J. Gottfried, R. H. Hamre, and C. B. Edminster, eds.Biodiversity and management of the Madrean Archi-pelago: the sky islands of southwestern United Statesand Northwestern Mexico. USDA Forest Service Gen-eral Technical Report RM-GTR-264.
Gastil, R. G., J. C. Minch, and R. P. Philips. 1983. Thegeology and ages of the islands. Pages 13–25 in T. J.Case and M. L. Cody, eds. Island biogeography and theSea of Cortez. University of California Press, Berkeley.
Gentry, H. S. 1978. The agaves of Baja California. Occa-sional Papers California Academy of Science 130:1–119.
Goldman, N., J. P. Anderson, and A. G. Rodrigo. 2000.Likelihood-based tests of topologies in phylogenetics.Systematic Zoology 49:652–670.
Grismer, L. L. 1994. The origin and evolution of the pen-insula herpetofauna of Baja California, Mexico. Her-petological Natural History 2:51–106.
———. 2002. A re-evaluation of the evidence for a mid-Pleistocene mid-peninsular seaway in Baja California: areply to Riddle et al. Herpetological Review 33:15–16.
Grismer, L. L., and J. A. McGuire. 1996. Taxonomy andbiogeography of the Sceloporus magister complex (Squa-mata: Phrynosomatidae) in Baja California. Herpeto-logica 52:416–427.
Grismer, L. L., J. A. McGuire, and B. D. Hollingsworth.1994. A report on the herpetofauna of the Vizcaino
Peninsula, Baja California, Mexico, with a discussion ofits biogeographic and taxonomic implications. BulletinSouthern California Academy of Sciences 93:45–80.
Hafner, D. J., and B. R. Riddle. 1997. Biogeography of BajaCalifornia peninsular desert mammals. Pages 39–68 inT. L. Yates, W. L. Gannon, and D. E. Wilson, eds. Lifeamong the muses: papers in honor of James S. Findley.University of New Mexico, Alberquerque.
Hare, M. P. 2001. Prospects for nuclear gene phylogeo-graphy. Trends in Ecology & Evolution 16:546–557.
Harrison, R. G. 1998. Linking evolutionary pattern andprocess: the relevance of species concepts for the studyof speciation. Pages 19–31 in D. J. Howard and S. L.Berlocher, eds. Endless forms: species and speciation.Oxford University Press, New York.
Hedges, S. B., and R. L. Bezy. 1993. Phylogeny of Xan-thusiid lizards: concern for data and analysis. MolecularPhylogenetics and Evolution 2:76–87.
Hedges, S. B., R. L. Bezy, and L. R. Maxson. 1991. Phy-logenetic relationships and biogeography of Xantusiidlizards, inferred from mitochondrial DNA sequences.Molecular Biology and Evolution 8:767–780.
Hedin, M. 1997. Speciational history in a diverse clade ofhabitat-specialized spiders (Araneae: Nesticidae: Nesti-cus): inferences from geographic-based sampling. Evo-lution 51:1929–1945.
Hedin, M., and D. A. Wood. 2002. Genealogical exclusivityin geographically proximate populations of Hypochilusthorelli Marx (Aranae, Hypochilidae) on the Cumber-land Plateau of North America. Molecular Ecology 11:1975–1988.
Hedrick, P. W. 1999. Perspective: highly variable loci andtheir interpretation in evolution and conservation. Evo-lution 53:313–318.
Highton, R. 2000. Detecting cryptic species using allozymedata. Pages 215–241 in R. C. Bruce, R. G. Jaeger, andL. D. Houck, eds. The biology of plethodontid sala-maders. Kluwer Academic/Plenum, New York.
Hillis, D. M., and J. J. Bull. 1993. An empirical test ofbootstrapping as a method for assessing confidence inphylogenetic analysis. Systematic Biology 42:182–192.
Huelsenbeck, J. P., and J. P. Bollback. 2001. Empirical andhierarchical Bayesian estimation of ancestral states. Sys-tematic Biology 50:351–366.
Huelsenbeck, J. P., and F. Ronquist. 2001. MRBAYES:Bayesian inference of phylogenetic trees. Bioinformatics17:754–755.
Hughes, J. B., G. C. Daily, and P. R. Ehrlich. 1997. Pop-ulation diversity: its extent and extinction. Science 278:689–692.
Humphrey, R. R. 1974. The boojum and its home. Uni-versity of Arizona Press, Tucson.
Ibrahim, K., R. A. Nichols, and G. M. Hewitt. 1996. Spatial
412 The American Naturalist
patterns of genetic variation generated by differentforms of dispersal during range expansion. Heredity 77:282–291.
Irwin, D. E. 2002. Phylogeographic breaks without geo-graphic barriers to gene flow. Evolution 56:2383–2394.
Klauber, L. M. 1931. A new species of Xantusia from Ar-izona, with a synopsis of the genus. Transactions of theSan Diego Society of Natural History 7:1–16.
Knowles, L. L., and W. P. Maddison. 2002. Statistical phy-logeography. Molecular Ecology 11:2623–2735.
Kocher, T. D., W. K. Thomas, A. Meyer, S. V. Edwards, S.Paabo, F. X. Villablanca, and A. C. Wilson. 1989. Dy-namics of mitochondrial DNA evolution in animals:amplification and sequencing with conserved primers.Proceedings of the National Academy of Sciences of theUSA 86:6196–6200.
Leache, A. D., and T. W. Reeder. 2002. Molecular system-atics of the eastern fence lizard (Sceloporus undulatus):a comparison of parsimony, likelihood, and Bayesianapproaches. Systematic Biology 51:44–68.
Losos, J. B., and R. E. Glor. 2003. Phylogenetic comparativemethods and the geography of speciation. Trends inEcology & Evolution 18:220–227.
Lovich, R. 2001. Phylogeography of the night lizard, Xan-tusia henshawi, in southern California: evolution acrossfault zones. Herpetologica 57:470–487.
Maddison, D. R., and W. P. Maddison. 2000. MacClade4.0b25. Sinauer, Sunderland, Mass.
Maddison, W. P. 1997. Gene trees in species trees. System-atic Biology 46:523–536.
Masta, S. E., N. M. Laurent, and E. J. Routman. 2003.Population genetic structure of the toad Bufo woodhou-sii: an empirical assessment of the effects of haplotypeextinction on nested cladistic analysis. Molecular Ecol-ogy 12:1541–1554.
Mayden, R. L. 1997. A hierarchy of species concepts: thedenouement in the saga of the species problem. Pages381–424 in M. F. Claridge, H. A. Dawah, and M. R.Wilson, eds. Species: the units of biodiversity. Chapman& Hall, London.
Morando, M., L. J. Avila, and J. W. Sites, Jr. 2003. Samplingstrategies for delimiting species: genes, individuals, andpopulation in the Liolaemus elongatus-kreigi complex(Squamata: Liolaemidae) in Andean-Patagonian SouthAmerica. Systematic Biology 52:159–185.
Murphy, R. W. 1983a. Paleobiogeography and patterns ofgenetic differentiation of the Baja California herpeto-fauna. Occasional Papers of the California Academy ofScience 137:1–48.
———. 1983b. The reptiles: origins and evolution. Pages130–158 in T. J. Case and M. L. Cody, eds. Island bio-geography on the Sea of Cortez. University of CaliforniaPress, Berkeley.
Murphy, R. W., J. W. Sites, Jr., D. G. Buth, and C. H.Haufler. 1996. Proteins: isozyme electrophoresis. Pages51–120 in D. M. Hillis, C. Moritz, and B. K. Mable,eds. Molecular systematics. Sinauer, Sunderland, Mass.
Nichols, R. A., and G. M. Hewitt. 1994. The genetic con-sequences of long distance dispersal during coloniza-tion. Heredity 72:312–317.
Nordborg, M. 2001. Coalescent theory. Pages 1–37 in D.Balding, M. Bishop, and C. Cannings, eds. Handbookof statistical genetics. Wiley, Chichester.
Orange, D. I., B. R. Riddle, and D. C. Nickle. 1999. Phy-logeography of a wide-ranging desert lizard, Gambeliawislizenii (Crotaphytidae). Copeia 2:267–273.
Orr, R. T. 1960. An analysis of the recent land mammals.Systematic Zoology 9:171–179.
Paetkau, D. 1999. Using genetics to identify intraspecificconservation units: a critique of current methods. Con-servation Biology 13:1507–1509.
Papenfuss, T. J., J. R. Macy, and J. A. Schulte. 2001. A newlizard species on the genus Xantusia from Arizona. Sci-entific Papers, Natural History Museum, University ofKansas 23:1–9.
Patton, J. L., and M. F. Smith. 1994. Paraphyly, polyphyly,and the nature of species boundaries in pocket gophers(genus Thomomys). Systematic Biology 43:11–26.
Peterson, A. T., and A. G. Navarro-Siguenza. 1999. Alter-nate species concepts as bases for determining priorityconservation areas. Conservation Biology 13:427–431.
Petit, R. J., and D. Grivet. 2002. Optimal randomizationstrategies when testing the existence of a phylogeo-graphic structure. Genetics 161:469–471.
Ponce Campos, P., S. M. Huerta Ortega, C. Nogueira Gon-zalez, and H. M. Smith. 2001. Natural history notes onthe Southern Plateau Night Lizard, Xantusia sanchezi.Bulletin of the Maryland Herpetological Society 37:18–21.
Posada, D., and K. A. Crandall. 1998. Modeltest: testingthe model of DNA substitution. Bioinformatics 14:817–818.
———. 2001. Intraspecific gene genealogies: trees graftingonto networks. Trends in Ecology & Evolution 16:37–47.
Posada, D., K. A. Crandall, and A. R. Templeton. 2000.GeoDis: software for the cladistic nested analysis of thegeographical distribution of genetic haplotypes. Molec-ular Ecology 9:487–488.
Puorto, G., M. Da Graca Salomao, R. D. G. Theakston,R. S. Thorpe, D. A. Warrell, and W. Wuster. 2001. Com-bining mitochondrial DMA sequences and morpholog-ical data to infer species boundaries: phylogeography oflanceheaded pitvipers in the Brazilian Atlantic forest,and the status of Bothrops pradoi (squamata: Serpentes:Viperidae). Journal of Evolutionary Biology 14:527–538.
Phylogeography of Xantusia 413
Riddle, B. R., D. J. Hafner, and L. F. Alexander. 2000a.Comparative phylogeography of Bailey’s pocket mouse(Chaetodipus baileyi) and the Peromyscus eremicus spe-cies group: historical vicariance of the Baja Californiapeninsula desert. Molecular Phylogenetics and Evolu-tion 17:161–172.
Riddle, B. R., D. J. Hafner, L. F. Alexander, and J. R. Jaeger.2000b. Cryptic vicariance in the historical assembly ofa Baja California peninsula desert biota. Proceedings ofthe National Academy of Sciences of the USA 97:14439–14443.
Riddle, B. R., D. J. Hafner, and L. F. Alexander. 2000c.Phylogeography and systematics of the Peromyscus er-emicus species group and the historical biogeography ofNorth American warm regional deserts. Molecular Phy-logenetics and Evolution 17:145–160.
Rodrıguez, F., J. F. Oliver, A. Marın, and J. R. Medina.1990. The general stochastic model of nucleotide sub-stitution. Journal of Theoretical Biology 142:485–501.
Rodrıguez-Robles, J. A., and J. M. De Jesus-Escobar. 2000.Molecular systematics of the New World gopher, bull,and pinesnakes (Pituophis: Colubridae), a transconti-nental species complex. Molecular Phylogenetics andEvolution 14:35–50.
Sambrook, F., E. F. Fritsch, and T. Maniatis. 1989. Mo-lecular cloning: a laboratory manual. Cold SpringHarbor Laboratory, Cold Spring Harbor, N.Y.
Savage, J. M. 1957. Studies on the lizard family Xantusi-idae. III. A new genus for Xantusia riversiana Cope,1883. Zoologica (New York) 42:83–86.
———. 1960. Evolution of a peninsular herpetofauna.Systematic Zoology 9:184–212.
Schneider, S., J.-M. Kueffer, D. Roessli, and L. Excoffier.1996. Arlequin: a software package for population ge-netics. Genetics and Biometry Laboratory, Departmentof Anthropology and Ecology, University of Geneva.
Shaw, K. L. 2002. Conflict between nuclear and mito-chondrial DNA phylogenies of a recent species radia-tion: what mtDNA reveals and conceals about modesof speciation in Hawaiian crickets. Proceedings of theNational Academy of Sciences of the USA 99:16122–16127.
Shimodaira, H., and M. Hawegawa. 1999. Multiple com-parisons of log-likelihoods with applications to phylo-genetic inference. Molecular Biology and Evolution 16:1114–1116.
Sites, J. W., Jr., and K. A. Crandall. 1997. Testing speciesboundaries in biodiversity studies. Conservation Biol-ogy 11:1289–1297.
Sites, J. W., Jr., and J. C. Marshall. 2003. Delimiting species:a renaissance issue in systematic biology. Trends in Ecol-ogy & Evolution 18:462–470.
Slatkin, M., and W. P. Maddison. 1989. A cladistic measure
of gene flow inferred from the phylogenies of alleles.Genetics 123:603–613.
Swofford, D. L. 2002. PAUP∗ 4.0b10. Phylogenetic analysisusing parsimony. Sinauer, Sunderland, Mass.
Tajima, F. 1989. Statistical method for testing the neutralmutation hypothesis by DNA polymorphism. Genetics123:585–595.
Templeton, A. R. 1989. The meaning of species and spe-ciation. Pages 3–27 in D. Otte and J. A. Endler, eds.Speciation and its consequences. Sinauer, Sunderland,Mass.
———. 1998. Nested clade analyses of phylogeographicdata: testing hypotheses about gene flow and populationhistory. Molecular Ecology 7:381–397.
———. 2001. Using phylogeographic analyses of genetrees to test species status and processes. Molecular Ecol-ogy 10:779–791.
Templeton, A. R., and C. F. Sing. 1993. A cladistic analysisof phenotypic associations with haplotypes inferredfrom restriction endonuclease mapping. IV. Nestedanalyses with cladogram uncertainty and recombina-tion. Genetics 134:659–669.
Templeton, A. R., K. A. Crandall, and C. F. Sing. 1992. Acladistic analysis of phenotypic associations with hap-lotypes inferred from restriction endonuclease mappingand DNA sequence data. III. Cladogram estimation. Ge-netics 132:619–633.
Templeton, A. R., E. Routman, and C. A. Phillips. 1995.Separating population structure from population his-tory: a cladistic analysis of the geographical distributionof mitochondrial DNA haplotypes in the tiger salaman-der, Ambystoma tigrinum. Genetics 140:767–782.
Thompson, J. D., T. J. Gibson, F. Plewniak, F. Jeanmougin,and D. G. Higgins. 1997. The ClustalX windows inter-face: flexible strategies for multiple sequence alignmentaided by quality analysis tools. Nucleic Acids Research24:4876–4882.
Turner, R. M., J. E. Bowers, and T. L. Burgess. 1995. So-noran Desert plants: an ecological atlas. University ofArizona Press, Tucson.
Upton, D. E., and R. W. Murphy. 1997. Phylogeny of theside-blotched lizards (Phrynosomatidae: Uta) based onmtDNA sequences: support for a midpeninsular seawayin Baja California. Molecular Phylogenetics and Evo-lution 8:104–113.
Van Devender, T. R. 1990. Late Quaternary vegetation andclimate of the Sonoran Desert, United States and Mex-ico. Pages 134–163 in J. L. Betancourt, T. R. Van De-vender, and P. S. Martin, eds. Packrat middens: the last40,000 years of biotic change. University of ArizonaPress, Tucson.
Vicario, S., A. Caccone, and J. Gauthier. 2003. Xantusiid“night” lizards: a puzzling phylogenetic problem revis-
414 The American Naturalist
ited using likelihood-based Bayesian methods onmtDNA sequences. Molecular Phylogenetics and Evo-lution 26:243–261.
Wake, D. B., and E. L. Jockusch 2000. Detecting speciesborders using diverse data sets: examples from Pleth-odontid salamanders in California. Pages 95–119 in R.C. Bruce, R. G. Jaeger, and L. D. Houck, eds. The biologyof plethodontid salamaders. Kluwer Academic/Plenum,New York.
Webb, R. G. 1970. Another new night lizard (Xantusia)from Durango, Mexico. Contributions in Science (LosAngeles) 194:1–10.
Wiens, J. J. 1998. Combining data sets with different phy-logenetic histories. Systematic Biology 47:568–581.
———. 1999. Polymorphism in systematics and compar-ative biology. Annual Review of Ecology and Systematics30:327–362.
———. 2001. Character analysis in morphological phy-logenetics: problems and solutions. Systematic Biology50:688–699.
Wiens, J. J., and T. A. Penkrot. 2002. Delimiting speciesusing DNA and morphological variation and discordantspecies limits in spiny lizards (Sceloporous). SystematicBiology 51:69–91.
Zamudio, K. R., K. B. Jones, and R. H. Ward. 1997. Mo-lecular systematics of short-horned lizards: biogeogra-phy and taxonomy of a widespread species complex.Systematic Biology 46:285–305.
Zweifel, R. G., and C. H. Lowe. 1966. The ecology of apopulation of Xantusia vigilis, the desert night lizard.American Museum Novitates 2247:1–57.
Editor: Jonathan B. Losos