Embed Size (px)
Citation preview
Testing Theories: The Problem of Sampling Error
The problem of sampling error
• It is often the case—especially when making point predictions—that what we observe differs from what our theory predicts.
• There are at least three reasons why we may observe something other than what our theory predicts.– the theory is incomplete or dead wrong– the data are imprecise– sampling error
• Today we’re going to spend some time discussing the problem of sampling error, and some of the ways in which psychologists deal with it in their research.
Sampling error
• Sampling error occurs in research because we’re working with a subset of the population of interest.– Sometimes the population is sociological (e.g., US
citizens); sometimes it is an abstract-mathematical value (e.g., p(heads) = .5 for a coin flip).
• In either case, it is necessary to know how much sampling error may be present in our data, and to take those errors into account when empirically evaluating our theories.
The problem
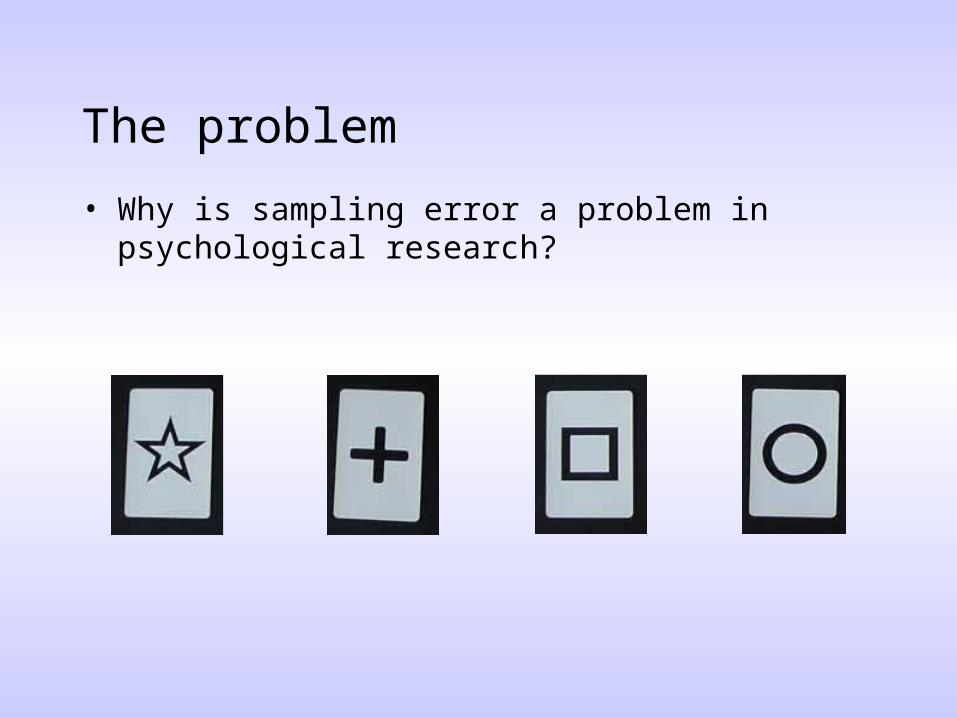
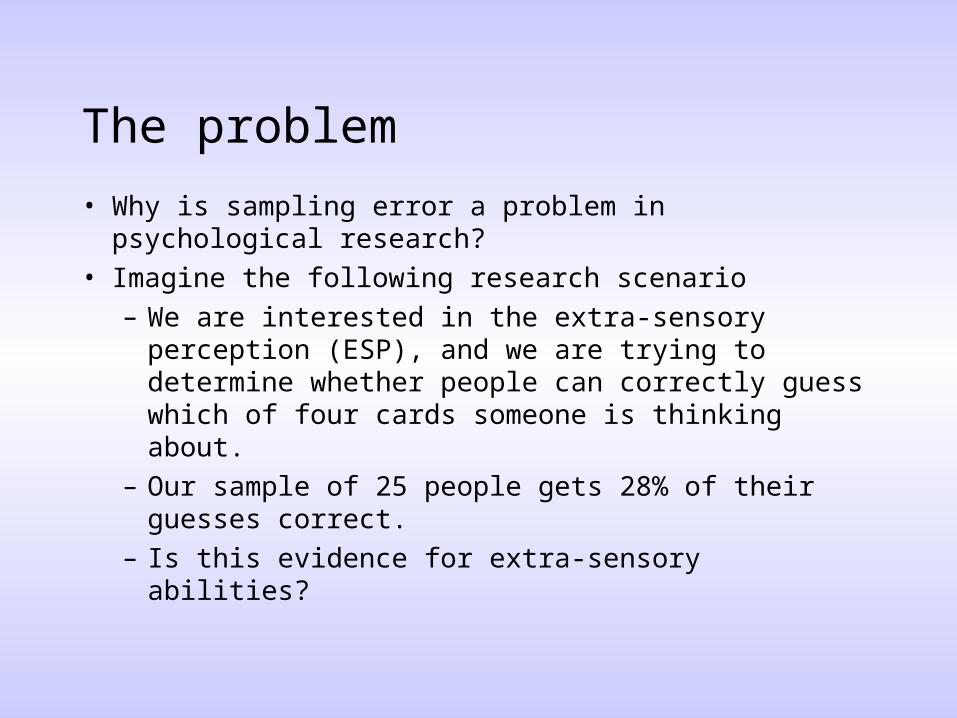
• Why is sampling error a problem in psychological research?
The problem
• Why is sampling error a problem in psychological research?
• Imagine the following research scenario– We are interested in the extra-sensory perception
(ESP), and we are trying to determine whether people can correctly guess which of four cards someone is thinking about.
– Our sample of 25 people gets 28% of their guesses correct.
– Is this evidence for extra-sensory abilities?
The problem
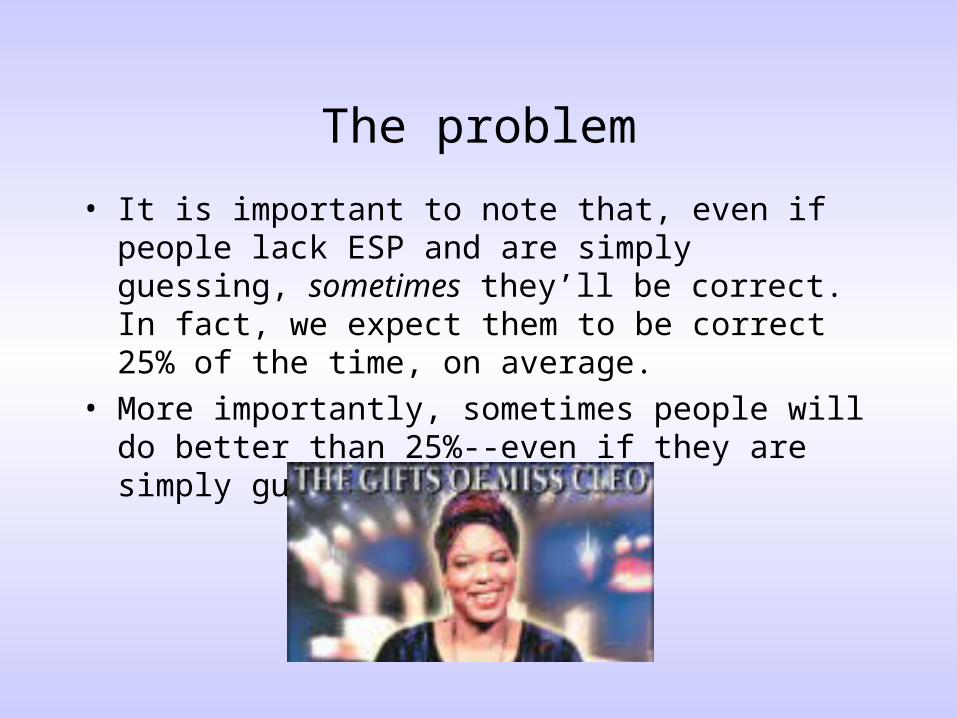
• It is important to note that, even if people lack ESP and are simply guessing, sometimes they’ll be correct. In fact, we expect them to be correct 25% of the time, on average.
• More importantly, sometimes people will do better than 25%--even if they are simply guessing.
The problem
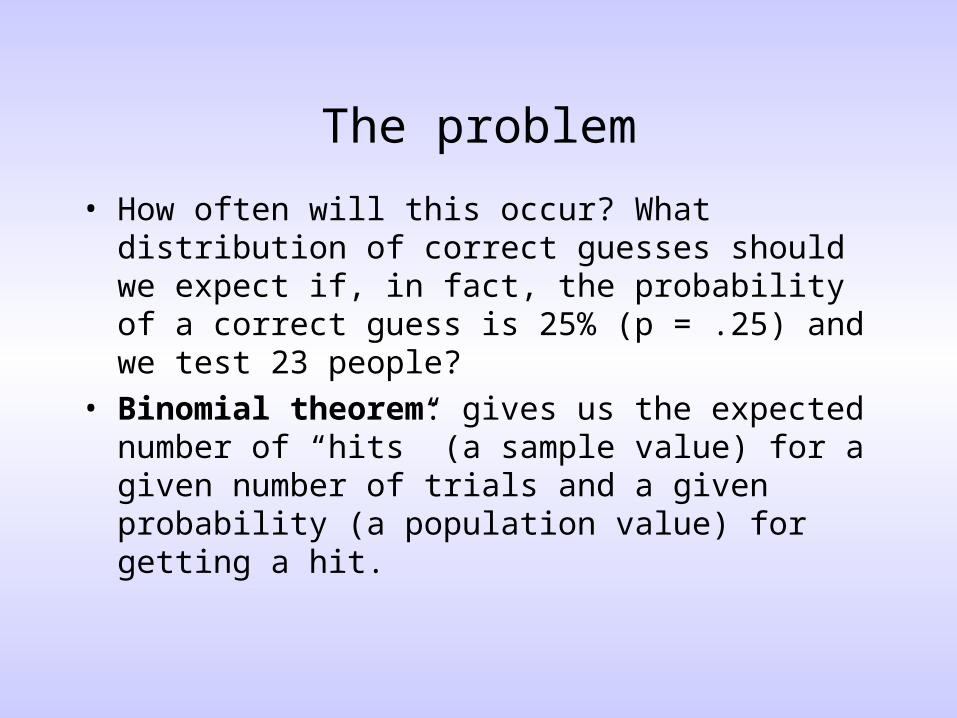
• How often will this occur? What distribution of correct guesses should we expect if, in fact, the probability of a correct guess is 25% (p = .25) and we test 23 people?
• Binomial theorem: gives us the expected number of “hits” (a sample value) for a given number of trials and a given probability (a population value) for getting a hit.
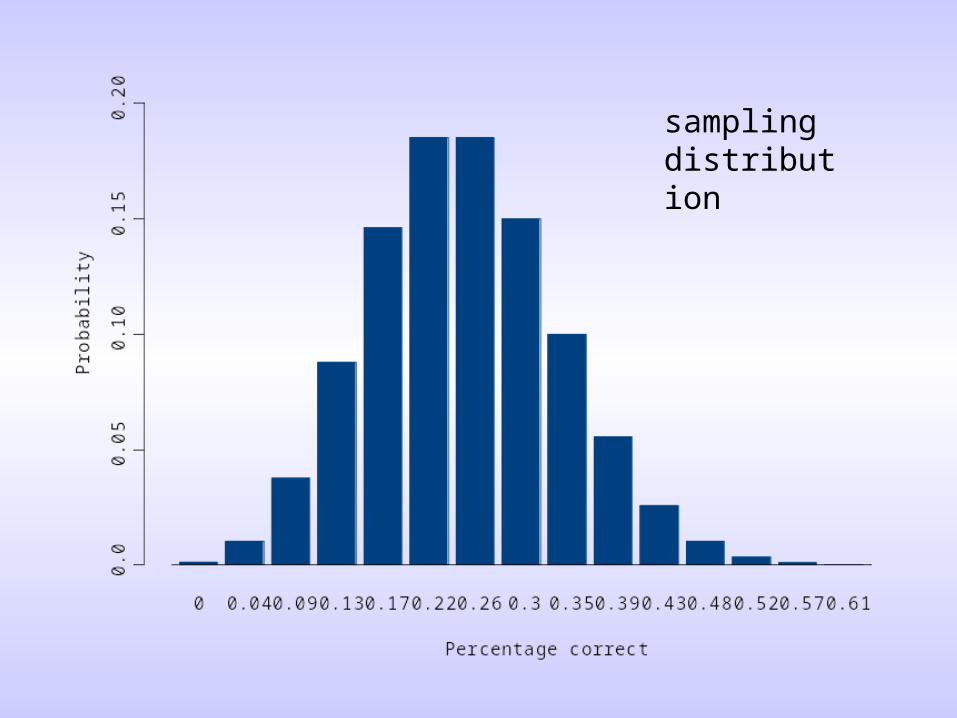
sampling distribution
How likely are the various outcomes?
• In this case we see that it would not be unusual for people to be right 30% of the time, even if they were simply guessing.
• In fact, in this situation, approximately 95% of the time we would expect people to be correct between 4% and 43% of the time.
Dealing with sampling error
• How can we deal with the problem of sampling error in psychological research?
• The most straight-forward way of controlling sampling error is by using large sample sizes.
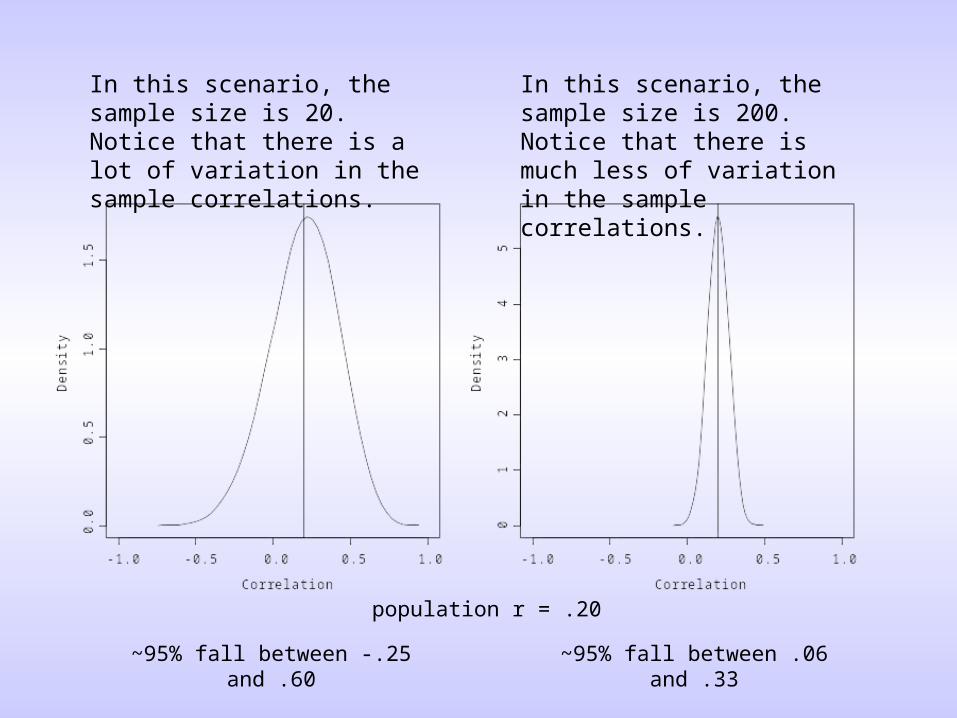
In this scenario, the sample size is 20. Notice that there is a lot of variation in the sample correlations.
In this scenario, the sample size is 200. Notice that there is much less of variation in the sample correlations.
population r = .20
~95% fall between -.25 and .60 ~95% fall between .06 and .33
Sampling distributions and point predictions
• It is often necessary to take into account sampling distributions when testing point predictions.
• For example, if our theory predicts that the correlation between television viewing and obesity should be zero when we hold exercise constant, we know that we might not observe a correlation of exactly zero due to sampling error--even if our theory is correct.
Sampling distributions and point predictions
• By constructing a sampling distribution, we can determine what range of correlations we’re likely to observe.– If the correlation we observe in our study is within
the range that we might expect given sampling error, then we might not count this as a problem for the theory.
– If, however, the correlation is much bigger than what we might expect given sampling error, we might count it against the theory.
Correlation
Den
sity
-0.4 -0.2 0.0 0.2 0.4
01
23
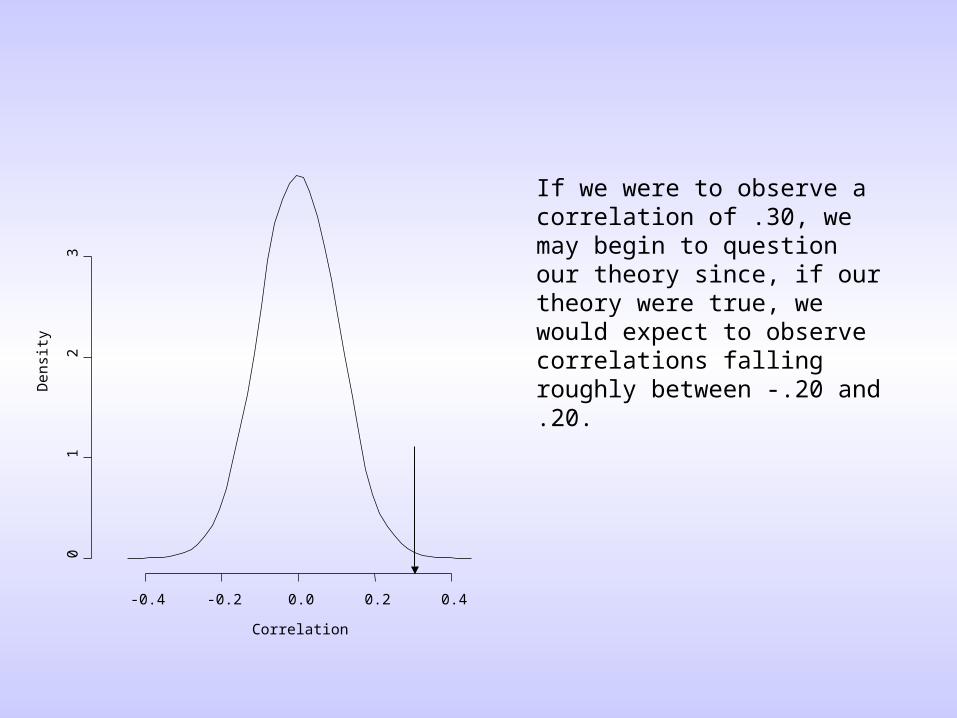
If we were to observe a correlation of .30, we may begin to question our theory since, if our theory were true, we would expect to observe correlations falling roughly between -.20 and .20.
Sampling distributions and directional predictions
• When our theory makes a directional prediction, it is very difficult to generate the appropriate sampling distribution.– If ESP works, the population value of p could be
anywhere between .26 and 1.00.• As a result, when a directional prediction is made,
researchers often test what is sometimes called the null hypothesis—the hypothesis that there is no association between variables (r = 0, mean difference = 0, p = .25, etc.)
Significance tests
• Basic logic of a null-hypothesis significance test: – The theoretically derived hypothesis (people have
ESP abilities) is that p .25. (directional)– The null hypothesis (people don’t have ESP
abilities) is that p = .25. – These two hypotheses are mutually exclusive. – If we can show that the proportion correct that we
observe in our study is unlikely if the null hypothesis is true, then that indirectly lends credence to the theoretical hypothesis.
Additional example
• We assume that a certain drug may improve people’s memory
• We randomly assign people to a drug condition or a placebo condition– theoretical hypothesis (directional): the drug group will have
better memory performance than the other group (Mdrug – Mno
drug > 0)
– null hypothesis (point prediction): the drug group will have the same performance as the control group (Mdrug – Mno drug = 0)
– If we can show that the observed difference is too large to be explained by the null hypothesis, then that may be taken as indirect support for our theoretical hypothesis.
Significance tests
• Some commonly used null-hypothesis significance tests– analysis of variance (ANOVA)– t-tests– z-tests– chi-squares
• The use of null-hypothesis significance tests is very common in psychology, but hotly debated.
Summary
• Any time we draw a sample from a population, there is likely to be some degree of sampling error present.
• Sampling error can interfere with our ability to test a theory because it will lead the values we observe to deviate from those expected even if the theory is true.
• One way to handle sampling error is to minimize it by using large sample sizes.
• When researchers cannot make point predictions, they often use significance tests and test the null hypothesis instead.
Exam Review
• What is a “level” of a categorical variable?• What kind of statistical technique is sometimes used
to quantify mean differences between groups?• What kind of statistical technique is sometimes used
to quantify the association between two binary/categorical variables?
• Does causation imply correlation?• Does correlation imply causation?
Exam Review
• Be able to define each of the following concepts and provide an example where relevant:
• Independent variable, dependent variable, random assignment, levels of a categorical variable, confound, factorial design, main effect, interaction, between-subjects design, within-subjects design, mixed design, quasi-experimental design
• What are some of the pros and cons of a between-subjects design? What are some of the pros and cons of a within-subjects design?
Exam Review
• What is the “third variable problem?” Please give a hypothetical psychological example based on something that wasn’t discussed in class.
• What are three ways of controlling for potential confounding variables?
• Be able to compute a partial correlation and a cohen’s d. (I’ll provide the formula and some of the answers to the harder math parts, so you will not need a calculator.)
Exam Review
• What is the difference between normative stability and rank-order stability?
• What are the pros and cons of cross-sectional designs? What are the pros and cons of longitudinal designs?
• If researchers find evidence for no rank-order stability in self-esteem, does that mean that there is no normative stability too?

Exam Review
• On the basis his theory, a researcher predicts that the correlation between early parental support and academic performance will be .30. He collects data from 200 children and their parents and finds the correlation to be .20. Based on our lecture, what are three potential explanations for the discrepancy between what the psychologist predicted and what he found?


![[error] – problem inom elektronikindustrin](https://img.pdfslide.net/doc/110x75/56814c6a550346895db98fbc/error-problem-inom-elektronikindustrin.jpg)


![RM Presentation Sampling & Non Sampling Error[1]](https://img.pdfslide.net/doc/110x75/577ce47b1a28abf1038e72fc/rm-presentation-sampling-non-sampling-error1.jpg)