Embed Size (px)
Citation preview

Testing to Meet Low Mercury Limits in
FGD Purge Water at a Coal-Fired Plant
EUEC 2015
I.1 Wastewater Management
Presented by - Paul Pigeon, PE, Golder Associates Inc.

Seminole Mercury Pilot Project
Acknowledgements
Co-Authors
Seminole Generating Station Technical Lead – Troy Patton
Golder Process Engineer – Rachel Hanson
Golder Field Engineer – Kristen Sealey
And
Seminole Generating Station Project Manager –Lance French
Golder Project Manager – Brian Huff
February 25, 2015 2
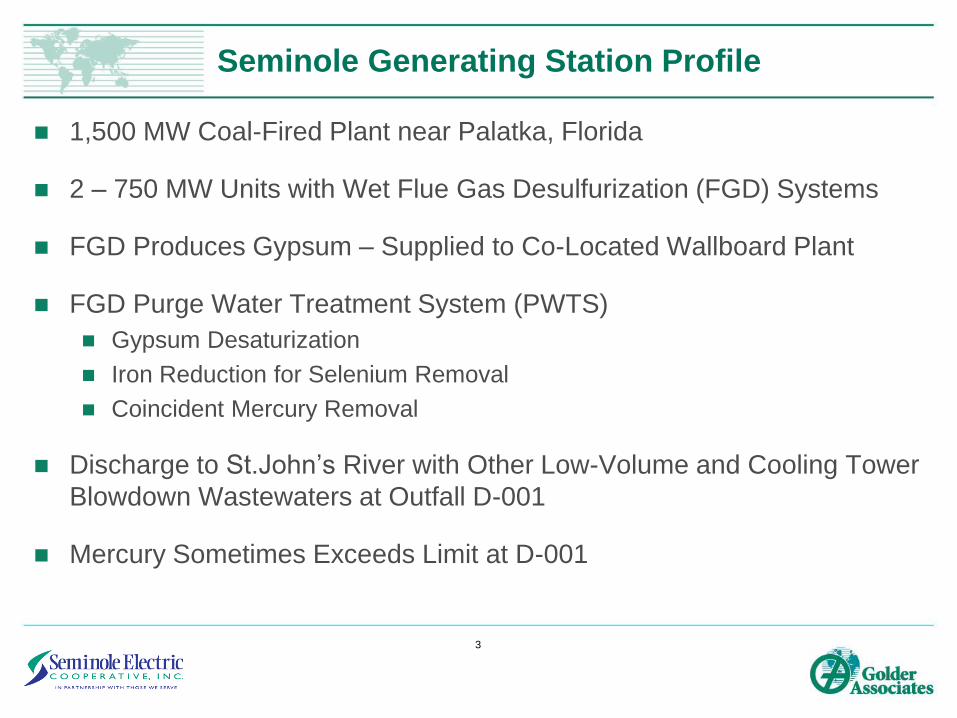
Seminole Generating Station Profile
1,500 MW Coal-Fired Plant near Palatka, Florida
2 – 750 MW Units with Wet Flue Gas Desulfurization (FGD) Systems
FGD Produces Gypsum – Supplied to Co-Located Wallboard Plant
FGD Purge Water Treatment System (PWTS)
Gypsum Desaturization
Iron Reduction for Selenium Removal
Coincident Mercury Removal
Discharge to St.John’s River with Other Low-Volume and Cooling Tower
Blowdown Wastewaters at Outfall D-001
Mercury Sometimes Exceeds Limit at D-001
3
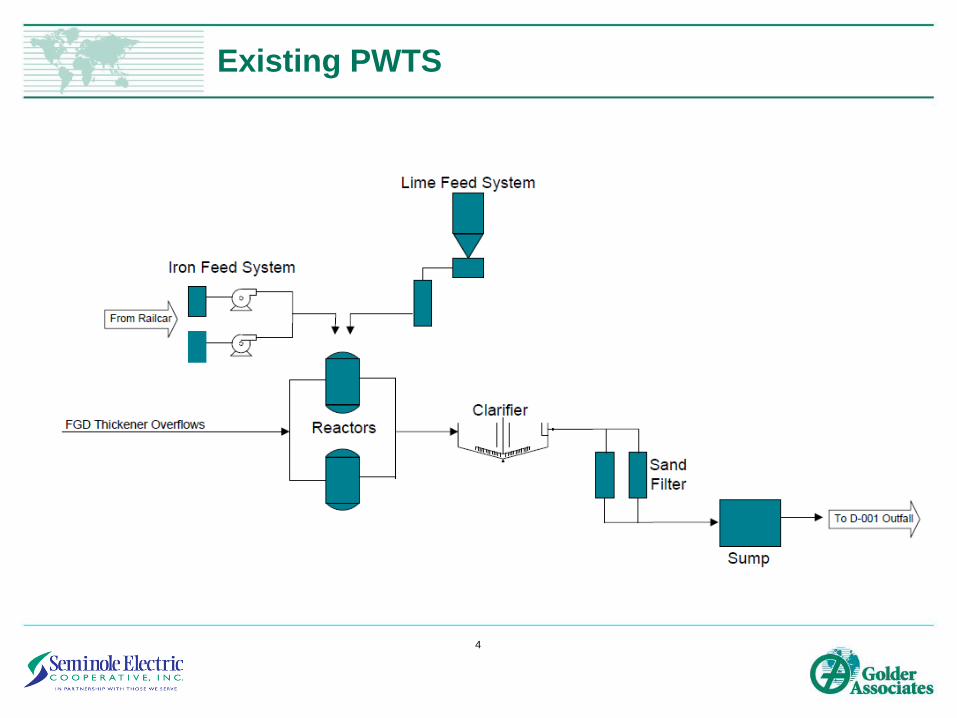
Existing PWTS
4

Project Goals
Study a PWTS Modification for Improved Mercury Removal to Meet
NPDES Permit Limit at D-001
Provide a Path Forward for Compliance with a Florida Department of
Environmental Protection Order for Mercury
Study PWTS Modification to Meet Draft EPA Effluent Limitation
Guidelines (ELGs) for PWTS effluent –
Mercury – 119 nanograms per liter (ng/L)
Selenium – 10 micrograms per liter (ug/L)
5
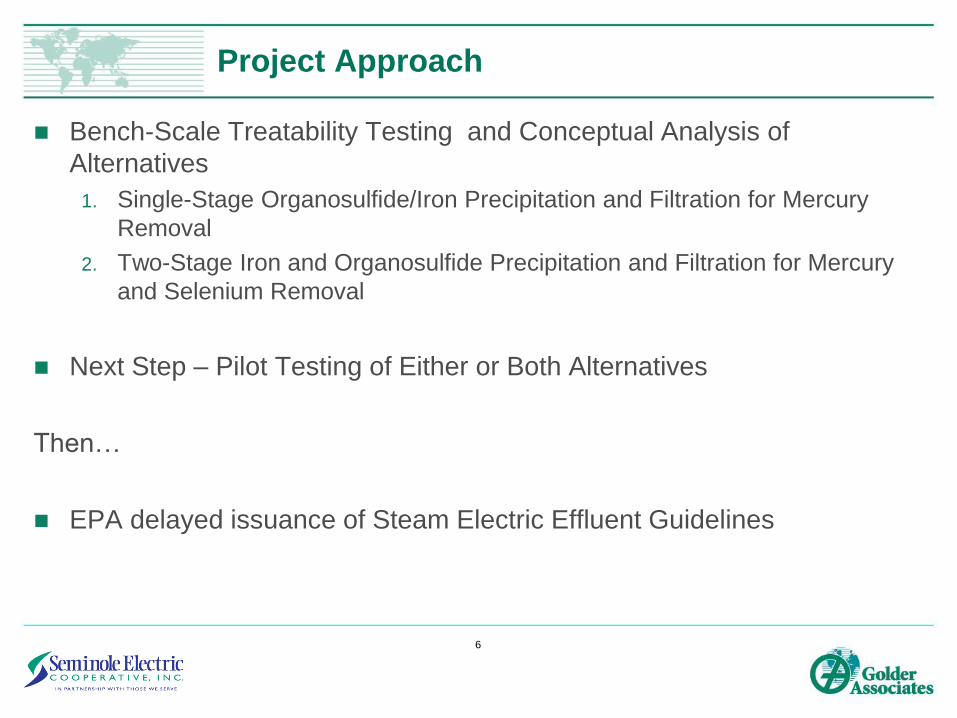
Project Approach
Bench-Scale Treatability Testing and Conceptual Analysis of
Alternatives
1. Single-Stage Organosulfide/Iron Precipitation and Filtration for Mercury
Removal
2. Two-Stage Iron and Organosulfide Precipitation and Filtration for Mercury
and Selenium Removal
Next Step – Pilot Testing of Either or Both Alternatives
Then…
EPA delayed issuance of Steam Electric Effluent Guidelines
6
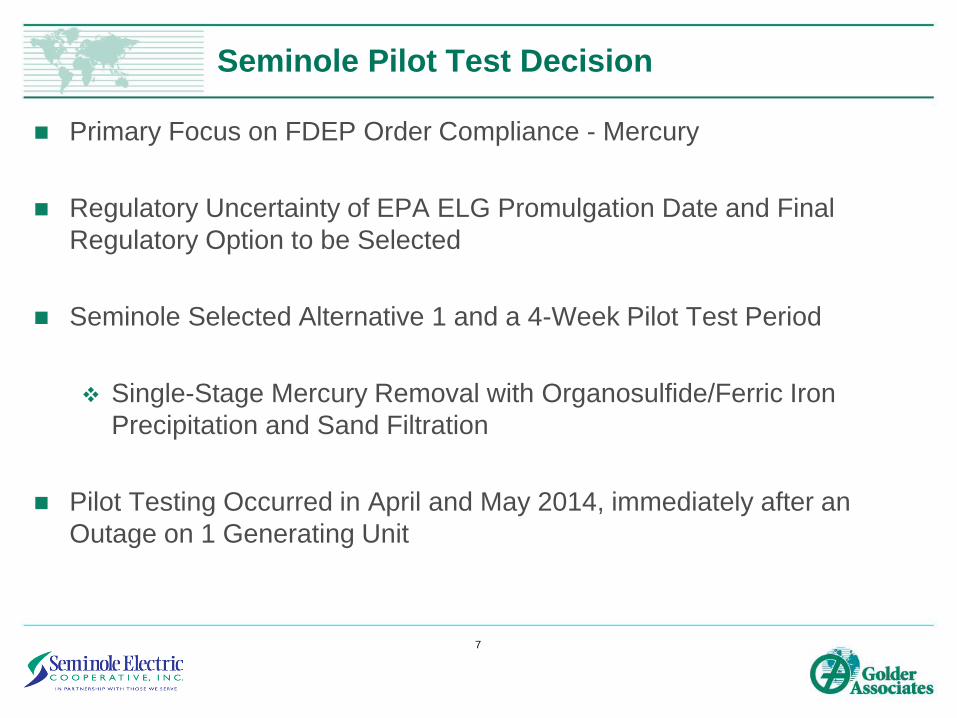
Seminole Pilot Test Decision
Primary Focus on FDEP Order Compliance - Mercury
Regulatory Uncertainty of EPA ELG Promulgation Date and Final
Regulatory Option to be Selected
Seminole Selected Alternative 1 and a 4-Week Pilot Test Period
Single-Stage Mercury Removal with Organosulfide/Ferric Iron
Precipitation and Sand Filtration
Pilot Testing Occurred in April and May 2014, immediately after an
Outage on 1 Generating Unit
7
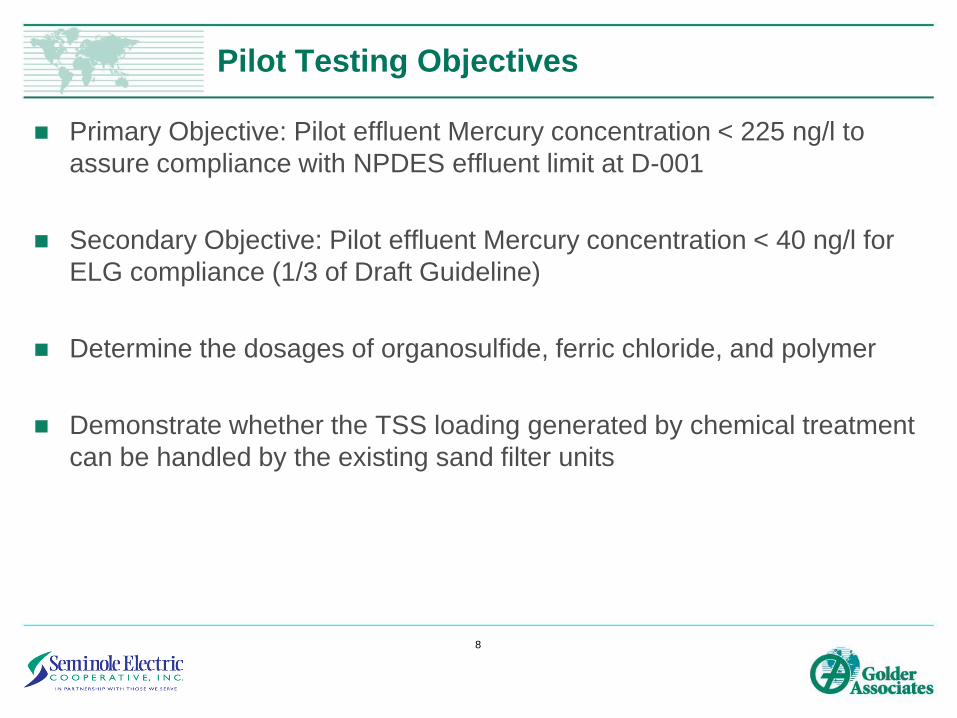
Pilot Testing Objectives
Primary Objective: Pilot effluent Mercury concentration < 225 ng/l to
assure compliance with NPDES effluent limit at D-001
Secondary Objective: Pilot effluent Mercury concentration < 40 ng/l for
ELG compliance (1/3 of Draft Guideline)
Determine the dosages of organosulfide, ferric chloride, and polymer
Demonstrate whether the TSS loading generated by chemical treatment
can be handled by the existing sand filter units
8
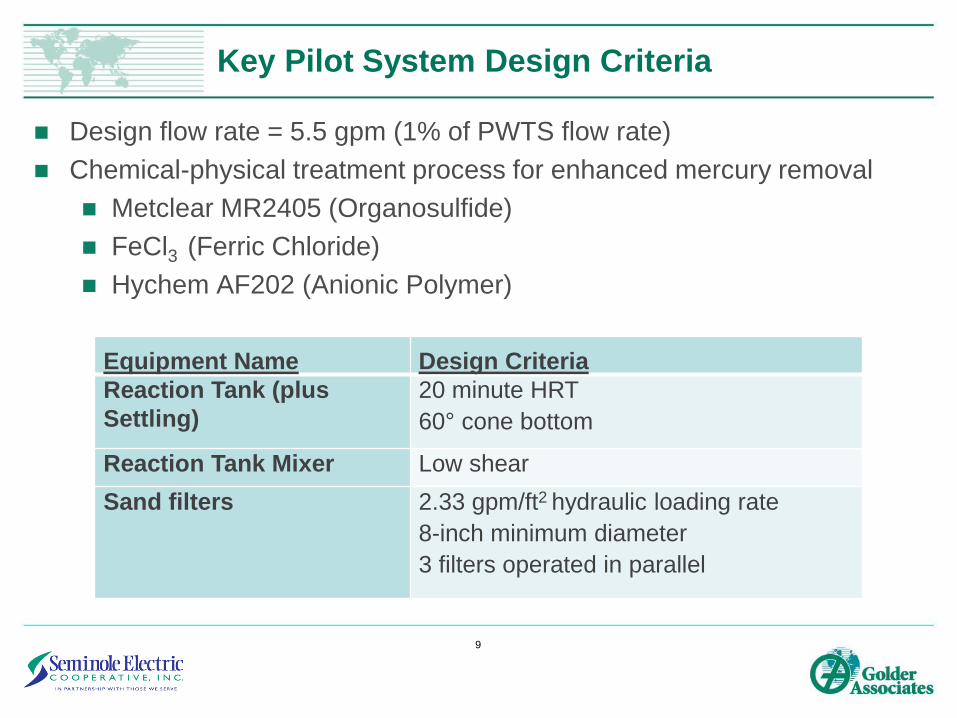
Key Pilot System Design Criteria
9
Design flow rate = 5.5 gpm (1% of PWTS flow rate)
Chemical-physical treatment process for enhanced mercury removal
Metclear MR2405 (Organosulfide)
FeCl3 (Ferric Chloride)
Hychem AF202 (Anionic Polymer)
Equipment Name Design Criteria
Reaction Tank (plus
Settling)
20 minute HRT
60° cone bottom
Reaction Tank Mixer Low shear
Sand filters 2.33 gpm/ft2 hydraulic loading rate
8-inch minimum diameter
3 filters operated in parallel
10
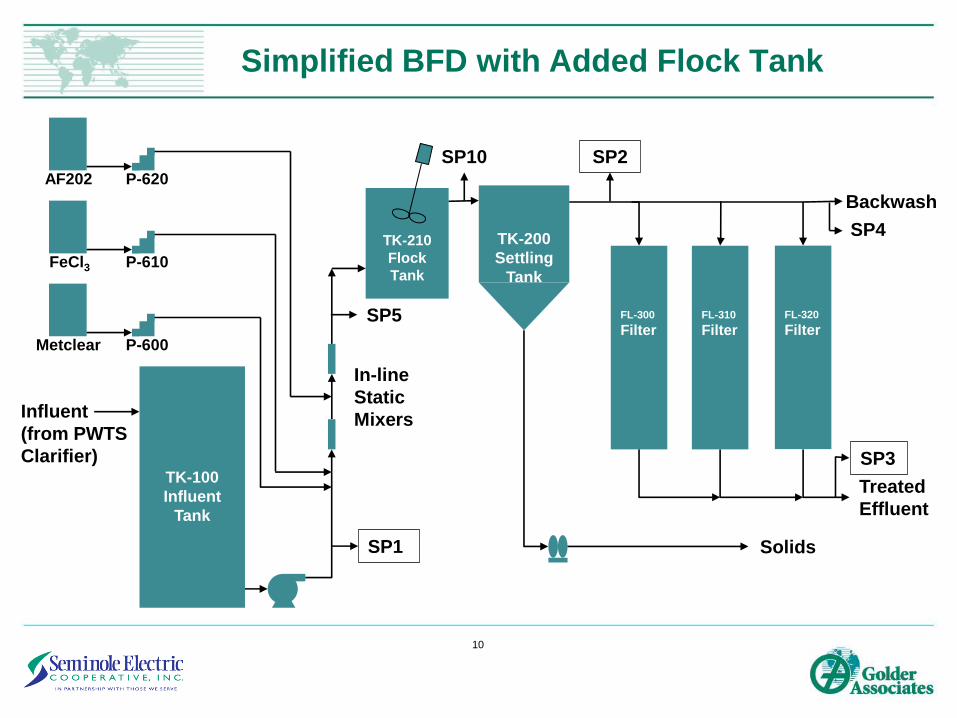
Simplified BFD with Added Flock Tank
TK-200
Settling
Tank
FL-300
Filter
Treated
Effluent
Solids
Influent
(from PWTS
Clarifier)
FL-320
FilterFL-310
FilterMetclear P-600
FeCl3 P-610
AF202 P-620
TK-210
Flock
Tank
Backwash
SP1
SP4
SP3
SP2
SP5
SP10
In-line
Static
Mixers
TK-100
Influent
Tank

Sampling Locations
Sample Port Sample Location
SP1PWTS clarifier effluent/Pilot influent
SP2Pilot sand filter influent
SP3Sand filter effluent/Pilot effluent
11
Note: Additional sample IDs were assigned for tracking solids content and
laboratory QA samples
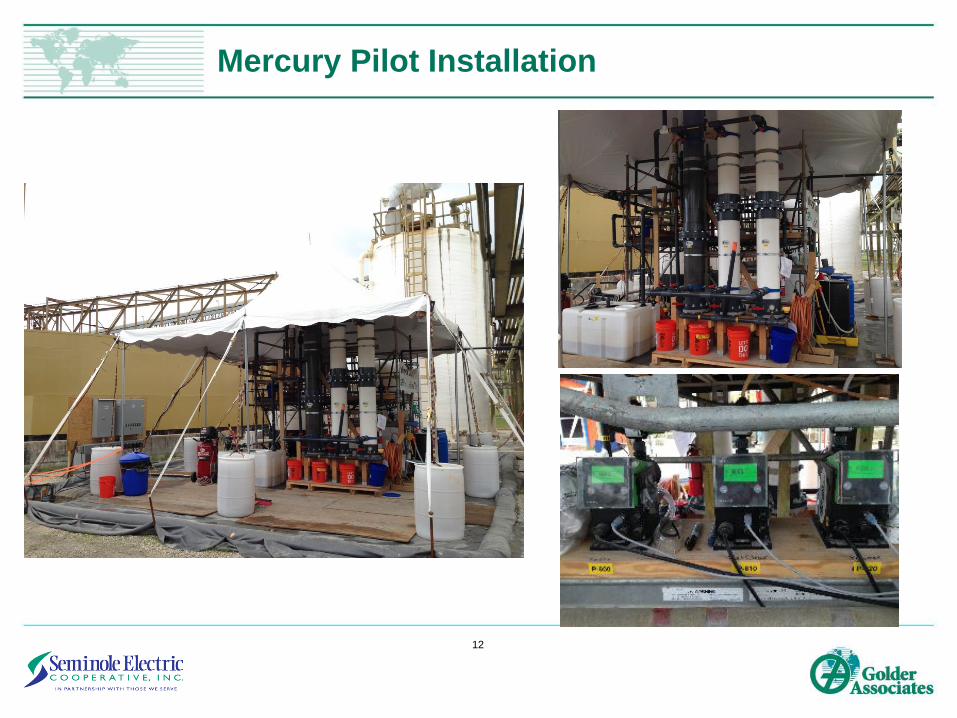
Mercury Pilot Installation
12
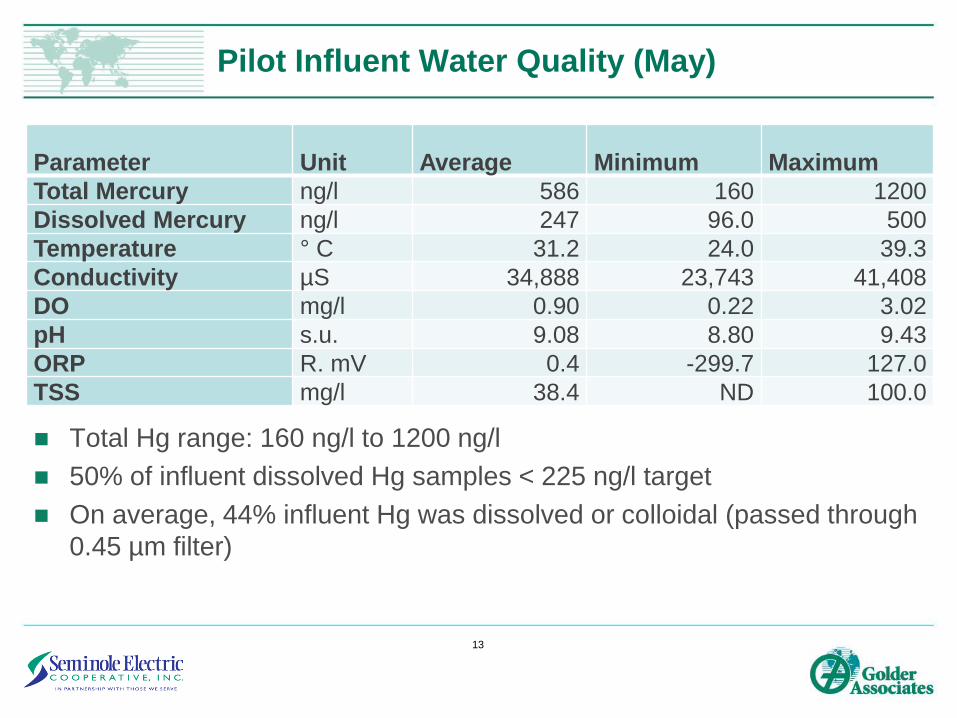
Pilot Influent Water Quality (May)
Total Hg range: 160 ng/l to 1200 ng/l
50% of influent dissolved Hg samples < 225 ng/l target
On average, 44% influent Hg was dissolved or colloidal (passed through
0.45 µm filter)
Parameter Unit Average Minimum Maximum
Total Mercury ng/l 586 160 1200
Dissolved Mercury ng/l 247 96.0 500
Temperature ° C 31.2 24.0 39.3
Conductivity µS 34,888 23,743 41,408
DO mg/l 0.90 0.22 3.02
pH s.u. 9.08 8.80 9.43
ORP R. mV 0.4 -299.7 127.0
TSS mg/l 38.4 ND 100.0
13

Total Mercury
14
0
200
400
600
800
1000
1200
1400
3-May 8-May 13-May 18-May 23-May 28-May
To
tal H
g (
ng
/L)
Date of Operations
Pilot Influent Filter Influent Filter Effluent Target for NPDES Permit Target for Proposed ELG
6-Oct 11-Oct 16-Oct 21-Oct
No Flocculation ← → With Flocculation
15 ppm Metclear
18 ppm FeCl3
35 ppm Metclear
56 ppm FeCl3
50 ppm Metclear
80 ppm FeCl3
35 ppm Metclear
25 ppm FeCl3
25 ppm Metclear
35 ppm FeCl3
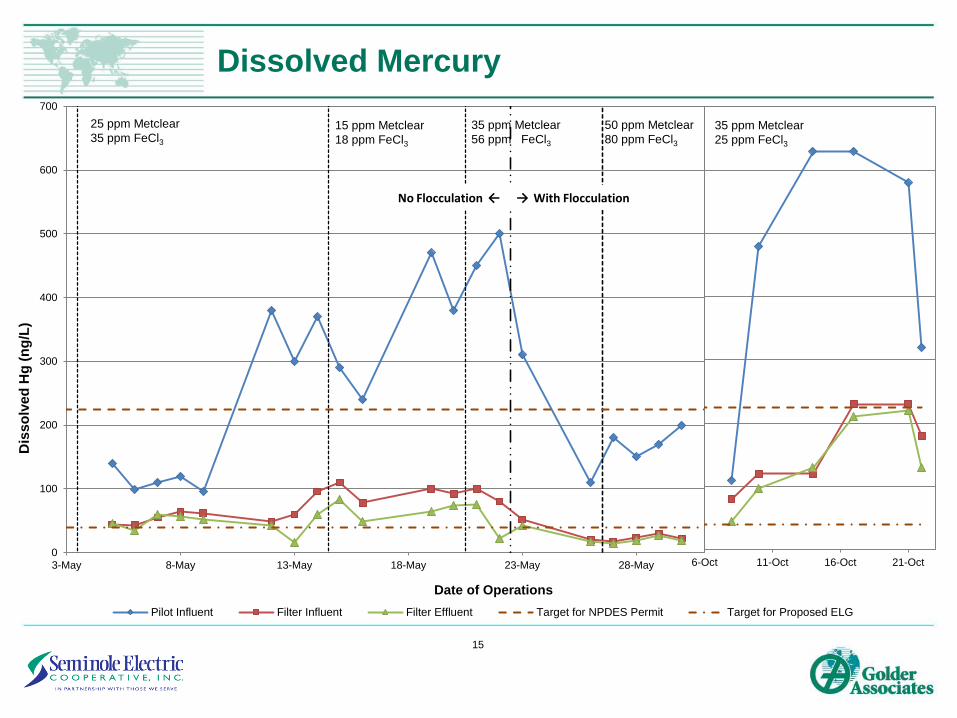
Dissolved Mercury
15
0
100
200
300
400
500
600
700
3-May 8-May 13-May 18-May 23-May 28-May
Dis
so
lve
d H
g (
ng
/L)
Date of Operations
Pilot Influent Filter Influent Filter Effluent Target for NPDES Permit Target for Proposed ELG
25 ppm Metclear
35 ppm FeCl3
6-Oct 11-Oct 16-Oct 21-Oct
15 ppm Metclear
18 ppm FeCl3
35 ppm Metclear
56 ppm FeCl3
50 ppm Metclear
80 ppm FeCl3
35 ppm Metclear
25 ppm FeCl3
No Flocculation ← → With Flocculation

Mercury Removal
16
0%
10%
20%
30%
40%
50%
60%
70%
80%
90%
100%
-8 -6 -4 -2 0 2 4 6 8 10 12 14 16 18 20 22 24 26 28 30
Pe
rce
nt
Rem
ova
l R
ela
tive
to
In
flu
en
t C
on
ce
ntr
ati
on
Days of Operation
Removal by Precipitation & Settling Removal by Filtration Total Removal
Startup 25 ppm Metclear 15 ppm 35 ppm 50 ppm
With flocculation
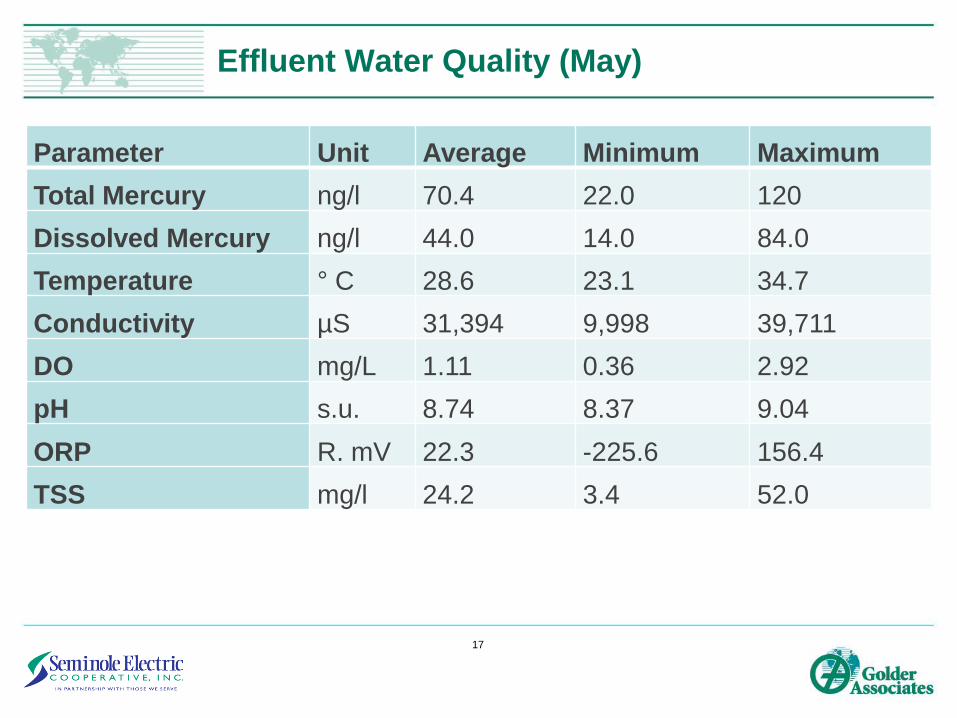
Effluent Water Quality (May)
17
Parameter Unit Average Minimum Maximum
Total Mercury ng/l 70.4 22.0 120
Dissolved Mercury ng/l 44.0 14.0 84.0
Temperature ° C 28.6 23.1 34.7
Conductivity µS 31,394 9,998 39,711
DO mg/L 1.11 0.36 2.92
pH s.u. 8.74 8.37 9.04
ORP R. mV 22.3 -225.6 156.4
TSS mg/l 24.2 3.4 52.0

Effluent Mercury Concentrations
Average effluent concentration (total Mercury)
Before Flock Tank Installation: 70.4 ng/l
After Flock Tank: 31.5 ng/l
Effluent total and dissolved Mercury concentrations tended to be
independent of the Metclear dose
Similar effluent concentrations over a range of doses prior to the
addition of flocculation tank
Effluent total and dissolved Mercury concentrations appeared to vary
slightly with the influent concentration
If present, the effect of influent concentration on effluent
concentration was weak
33% of effluent samples had dissolved Mercury < 40 ng/l
Ability to remove insoluble Mercury critical to achieve secondary
treatment goal
18

Sequential Filtration
1 sample collected May 7, 2014
At time of sample collection, pilot was more effective at removing
particulate mercury than dissolved/colloidal mercury
Average effluent dissolved mercury without flocculation was 64% of total
mercury. After flocculation was installed, dissolved portion increased to
76% of total19
Mercury Fraction Concentration (ng/l) % of Total MercuryPilot Influent
Total mercury (no filtration) 220 100%
After 0.45 µm filter (“dissolved”) 110 50%Pilot Sand Filter Effluent
Total mercury (no filtration) 77.2 100%
After 0.45 µm filter (“dissolved”) 64.9 84.1%
After 0.10 µm filter 42.9 55.6%
After 30 kDa MW filter 10.5 13.6%
After 10 kDa MW filter 8.21 10.6%
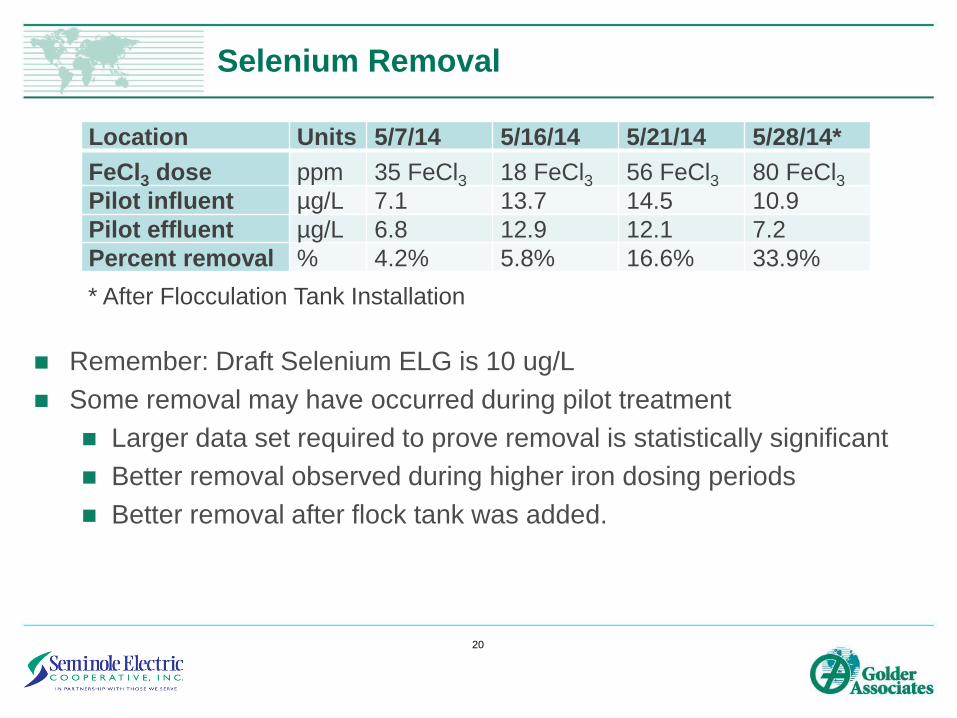
Selenium Removal
Remember: Draft Selenium ELG is 10 ug/L
Some removal may have occurred during pilot treatment
Larger data set required to prove removal is statistically significant
Better removal observed during higher iron dosing periods
Better removal after flock tank was added.
20
Location Units 5/7/14 5/16/14 5/21/14 5/28/14*
FeCl3 dose ppm 35 FeCl3 18 FeCl3 56 FeCl3 80 FeCl3Pilot influent µg/L 7.1 13.7 14.5 10.9
Pilot effluent µg/L 6.8 12.9 12.1 7.2
Percent removal % 4.2% 5.8% 16.6% 33.9%
* After Flocculation Tank Installation

Earlier – Lower Dosing Later – Higher Dosing
Typical Solids Settling Tests During Pilot
21

Solids Characteristics
Settled Solids Volume (SSV) in
reaction/flocculation tank influent
increased with increasing chemical dose
Addition of separate flocculation tank
reduced SSV in sand filter influent
Filter backwash interval doubled after flock
tank installation, even though chemical
dosing was higher than prior to flock tank
Solids passed TCLP for RCRA metals
Arsenic and barium were detected at
less than RCRA limits
No other metals were detected
22

Conclusions – Mercury Removal
Pilot testing successfully reduced effluent Mercury concentrations to
< 225 ng/l.
Pilot influent concentrations were lower than historical maximums
Pilot test process reduced effluent Mercury to < 40 ng/l after flocculation
and settling unit operations were improved.
Results obtained in October 2014 (higher effluent Mercury) need
further review (ratio of organosulfide:ferric iron may be a key)
Substantial colloidal fraction of Mercury was present
Effective chemical addition, flocculation and settling are necessary
so that sand filters (current Seminole polishing process) can be
utilized.
Tighter membrane filtration might be needed
23

Conclusions – Solids Removal
Visual observations indicated less turbid, higher quality water was
produced after the flocculation step was added.
Filter operation times increased after the addition of flocculation.
Flocculation and settling appeared to play a larger role than chemical
dosing in minimizing solids loading on the sand filters.
Sand filters hydraulic loading rate of 2.33 gpm/ft2 recommended for use
during pilot operations should result in filter operations similar to current
PWTS conditions.
24

Path Forward: Mercury Removal at Seminole
After ELGs are issued for FGD wastewater, check ability of existing
PWTS plus Organosulfide Mercury Polishing to provide reliable
compliance for Mercury AND Selenium
Conduct additional Mercury Polishing testing for:
Repeatable Mercury results
Check Selenium removal
Assess need for better filtration
If another process would be needed for Selenium, consider optional
technologies that may achieve both Mercury and Selenium removal in
one process
February 25, 2015 25

Questions?
26
Seminole Mercury Pilot Project