Embed Size (px)
Citation preview
TESTOSTERONE THERAPY AND CARDIOVASCULAR RISKS
Abraham Morgentaler, MD, FACSFounder, Men’s Health Boston
Associate Clinical Professor of UrologyBeth Israel Deaconess Medical Center
Harvard Medical School

November 6, 2013
January 29, 2014
January 31, 2014
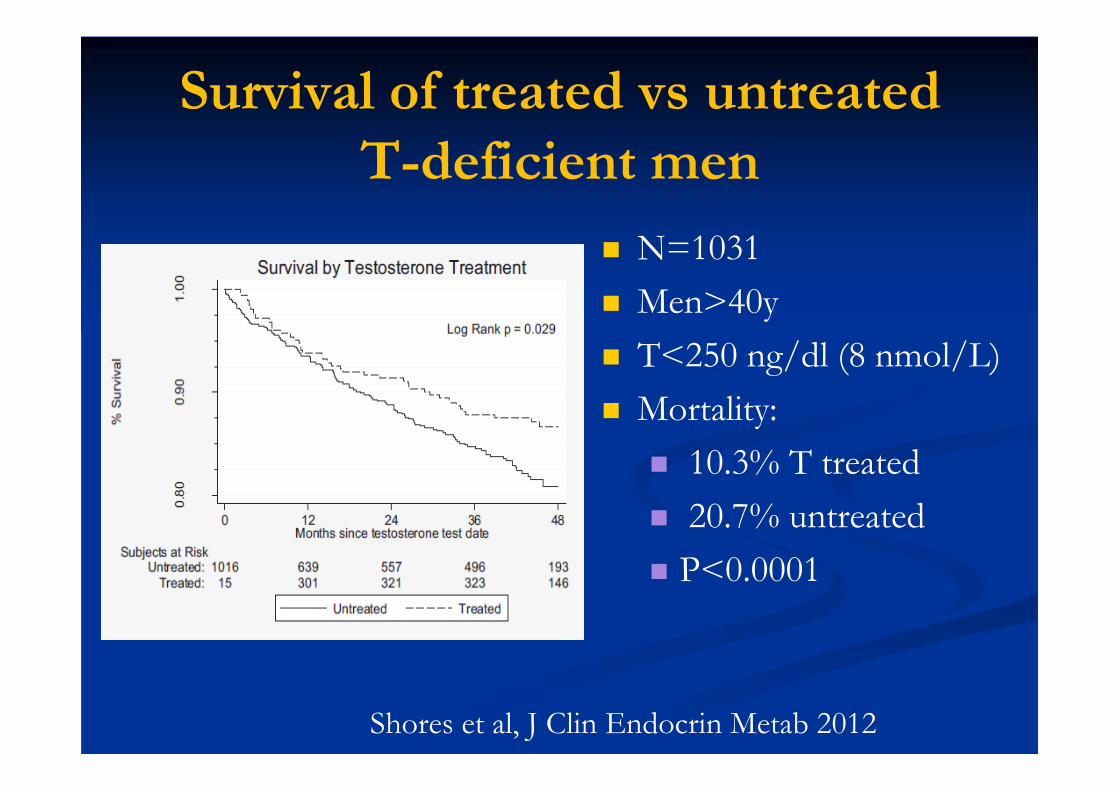
Survival of treated vs untreated T-deficient men
N=1031 Men>40y T<250 ng/dl (8 nmol/L) Mortality:
10.3% T treated 20.7% untreated P<0.0001
Shores et al, J Clin Endocrin Metab 2012

N=55,593 Insurance claims data-diagnosis codes, prescriptions No clinical info (eg, smoking, obesity, lab results) Compared rates of non-fatal MI 12 mo prior to T
Rx vs up to 90d after T Rx (until 1st refill) Primary result- increased MI rate after T Rx Comparison with men Rx PDE5i- no increase

T Rx
12 months 90 days
Pre T Rx MI RatePost T Rx MI Rate
Finkle et al, PLoS One
STUDY DESIGN
RESULTS: Post-rate/Pre- rate= 1.36 (95% CI 1.03, 1.81)CONCLUSION: T prescription associated with
36% increased rate of MI

T Rx
12 months 90 days
Pre T Rx MI RatePost T Rx MI Rate
PRE AND POST RX PERIODS ARE UNRELATED
STUDY DESIGN

T Rx
12 months 90 days
Pre T Rx MI RatePost T Rx MI Rate
PRE AND POST RX PERIODS ARE UNRELATED
NOT AN EXPERIMENTAL STUDY!•Pre Rx: How often MDs offered T Rx within 12mo of MI •Post Rx: MI rates after T Rx•These two periods have no relationship to each other•Prescribing patterns vs natural rates of MI •Comparison is meaningless

WAS MI RATE HIGH AFTER T Rx?
4.75 MI/1000 person-years: Finkle et al 13 MI/1000 person-years: NIH Heart Attack Risk
Calculator MI rate was LOW- a fraction of expected rate
No control group Unknown whether T Rx associated with MI rate
that is higher, lower, or unchanged compared with untreated men

COMPARISON WITH PDE5I
Dissimilar groups (men with low T vs men with ED) Dissimilar treatments (T vs PDE5I) Dissimilar indications for treatment Classic case of apples and oranges Comparison is non-informative

FINKLE ET AL
Pre- Rx rate: 3.48 events/1000 person-years Post-Rx rate: 4.75 events/1000 person-years Difference: 1.27 events/1000 person-years Clinical significance?
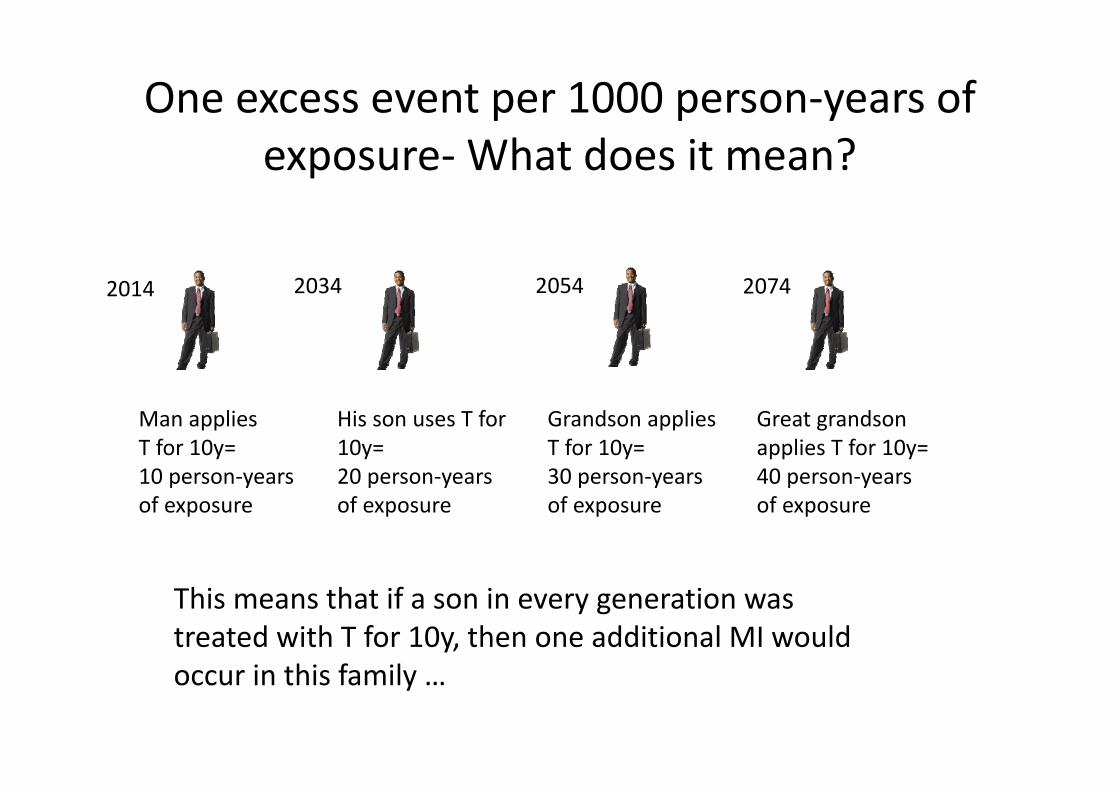
One excess event per 1000 person‐years of exposure‐What does it mean?
2014
His son uses T for 10y=20 person‐yearsof exposure
Man applies T for 10y= 10 person‐yearsof exposure
2034
Grandson applies T for 10y= 30 person‐yearsof exposure
2054 2074
Great grandson applies T for 10y=40 person‐years of exposure
This means that if a son in every generation was treated with T for 10y, then one additional MI would occur in this family …

2014
In 100 generations , by the Year 4014!
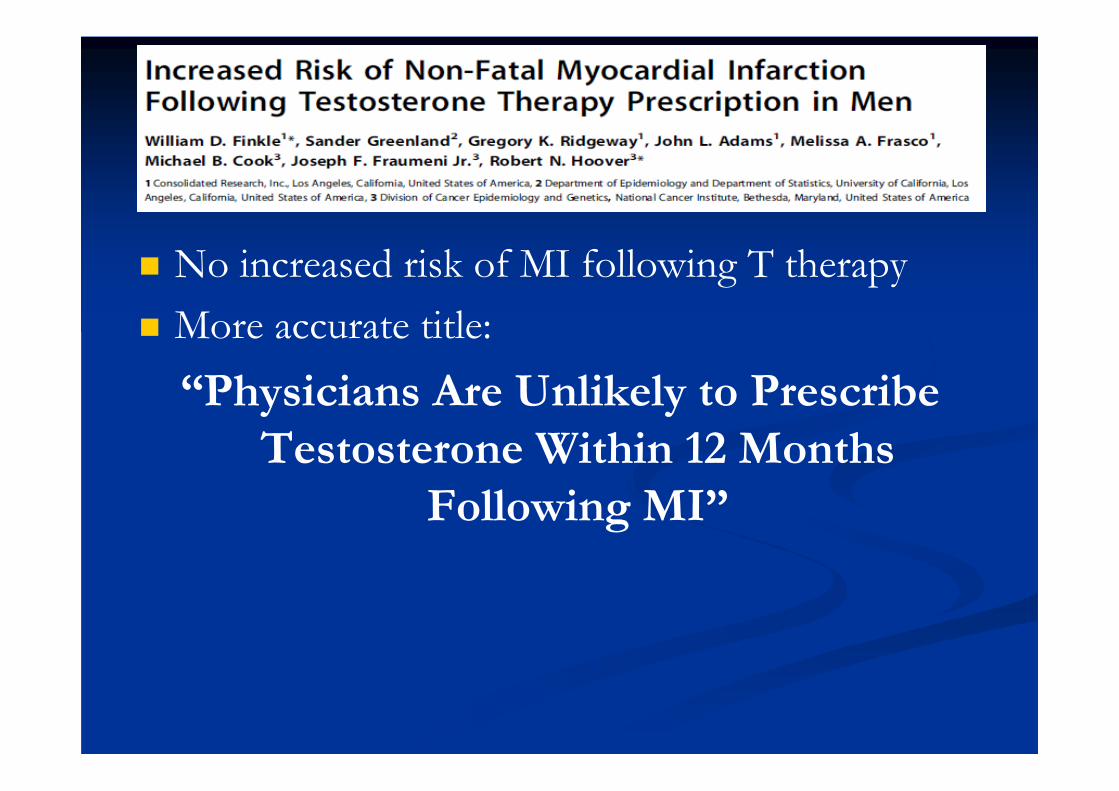
No increased risk of MI following T therapy More accurate title:
“Physicians Are Unlikely to Prescribe Testosterone Within 12 Months
Following MI”
Vigen R et al. J Am Med Assoc 310(17): 1829-1836 (2013)

Rates of death, myocardial infarction, and stroke in men treated with testosterone and untreated men
Vigen R et al. J Am Med Assoc 310(17): 1829-1836 (2013)
19.9
15.4
10.1
25.7
18.5
11.3
0
5
10
15
20
25
30
at 1 year at 2 years at 3 years
no TRT TRT

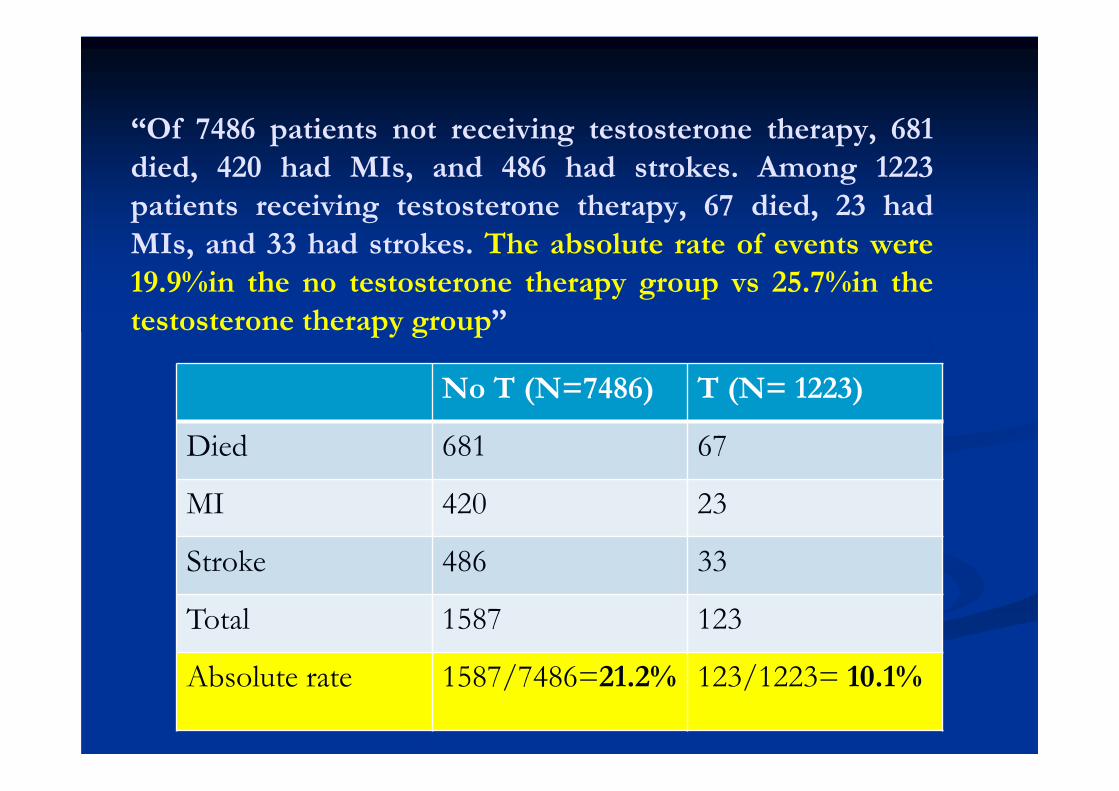
“Of 7486 patients not receiving testosterone therapy, 681died, 420 had MIs, and 486 had strokes. Among 1223patients receiving testosterone therapy, 67 died, 23 hadMIs, and 33 had strokes. The absolute rate of events were19.9%in the no testosterone therapy group vs 25.7%in thetestosterone therapy group”
“Of 7486 patients not receiving testosterone therapy, 681died, 420 had MIs, and 486 had strokes. Among 1223patients receiving testosterone therapy, 67 died, 23 hadMIs, and 33 had strokes. The absolute rate of events were19.9%in the no testosterone therapy group vs 25.7%in thetestosterone therapy group”
No T (N=7486) T (N= 1223)
Died 681 67
MI 420 23
Stroke 486 33
Total 1587 123
Absolute rate 1587/7486=21.2% 123/1223= 10.1%

Rates After Statistical Modelling Using Stabilized Inverse Propensity of Treatment Weighting Adjusting for >50 Variables*
Vigen R et al. J Am Med Assoc 310(17): 1829-1836 (2013)
19.9
15.4
10.1
25.7
18.5
11.3
0
5
10
15
20
25
30
at 1 year at 2 years at 3 years
no TRT TRT
*adjusting for: age, race, comorbidities: (prior MI, congestive heart failure, diabetes, renal failure, depression, posttraumatic stress disorder, hyperlipidemia, peripheral vascular disease, chronic pulmonary disease, chronic obstructive pulmonary disease, obstructive sleep apnea, hypertension, cerebrovascular disease, overweight, dialysis, ever smoker, alcohol, anemia, blood loss anemia, coagulation disorder, complicated diabetes, uncomplicated diabetes, drug abuse, fluid electrolyte disorder, human immunodeficiency syndrome or AIDS, hypothyroidism, liver disease, lymphoma, metastatic cancer, neurological disorder, paralysis,peptic ulcer disease, psychoses, pulmonary circulatory disorder, renal failure, rheumatoid arthritis, nonmetastatic tumor, and weight loss), and procedures (prior revascularization, prior catheterization, prior percutaneous coronary intervention [PCI], prior coronary artery bypass graft surgery, cardiac transplant, prior stress test, prior cardiac blood pool imaging, cardiac magnetic resonanceimaging, cardiac computed tomography [CT], CT coronary angiography, prior myocardial perfusion imaging,,prior transthoracic echocardiogram, and prior transesophageal echocardiogram

EXCLUDED MEN SKEW RESULTS
Once MI or stroke occurred, men were no longer in the risk-set
Irrelevant whether or not they received T
If included, this increases number of events in no-T group by 71% (1132 + 1587)

CORRECTION #2 (Mar 5, 2014):LARGE ERRORS IN DATA
In response to challenge re excluded group of 1132 men, authors reviewed data for this group and acknowledge series of errors
1132 to 128 men: error involving >1000 men 397 to 1301 men: error involving >900 men Discovery of 100 women= 9% of population!

“My room IS clean!”

World’s Experts Petition JAMA to Retract T Study
Recommendation to retract article submitted Mar 25, 2014 to JAMA editor-in-chief, Dr. Howard Bauchner
Cited “Gross data mismanagement and contamination” Study “no longer credible”Signed by: 29 Medical Societies >160 distinguished researchers/clinicians >60 full professors, 8 emeritus 9 journal editors 32 countries (all continents except Antarctica)

SOCIETIES PETITIONING JAMA TO RETRACT STUDY
American Society for Men’s Health (ASMH)
Brazilian Society of Endocrinology and Metabolism
Canadian Men's Sexual Health Council, an affiliate of the CUA
Canadian Society for the Study of Men’s Health (CSSAM)
European Society for the Study of the Aging Male (ESSAM)
European Society for Sexual Medicine (ESSM)
German Society for Men’s Health
Indonesian Andrologist Association
International Society for Men’s Health (ISMH)
International Society for Sexual Medicine (ISSM)
International Society for the Study of the Aging Male (ISSAM)
Italian Society of Andrology
Italian Society of Andrology and Sexual Medicine
Japan ASEAN Council for Men’s Health and Aging

UNPRECEDENTED GLOBAL ACTION TO REPUDIATE STUDY
Japanese Society for Men’s Health
Korean Society for Sexual Medicine and Andrology
Malaysian Men’s Health Initiative
Malaysian Society of Andrology and the Study of the Aging Male
Mens Health Initiative of British Columbia (Canada)
Mexican Association of Bone and Mineral Metabolism
Middle East Society for Sexual Medicine
Russian Society for Men’s Health
South Asian Society for Sexual Medicine
Sexual Medicine Society of North America
Latin American Society for Sexual Medicine
The Society for Men's Health, Singapore
Society for the Study of Androgen Deficiency
Society for the Study of Andrology and Sexology, Singapore (SSASS)

Meta-Analysis T and CV Risk
Largest meta-analysis to date 75 RCTs T group: 3016 men Placebo: 2448 menResult No increased CV risk with T Protective effect among men with metabolic
abnormalities
Corona et al Expert Opin Drug Safety 2014

Androgen Study Group Submission to FDA May 7, 2014
Review of literature submitted to FDA Detailed analysis of studies reporting increased
CV risks Supplemented by overview of 30y of literature
that has shown beneficial effects of higher endogenous T or T therapy
Compilation of 3 appendices, 8 tables


Malkin CJ et al. Heart 96: 18231-1825 (2010)
CUMULATIVE SURVIVAL BASED ON BIOAVAILABLE T
N=930 MEN WITH CORONARY HEART DISEASE
FOLLOWED FOR 6.9 ± 2.6 Y
MORTALITY: LOW T 21%, NORMAL T 12%
0.85
0.9
0.95
1
0 500 1000 1500 2000 2500 3000 3500Survival time
Cum
ulat
ive
Surv
ival
Bio T < 2.6 nmol/L(n=194)
Bio T < 2.6 nmol/L(n=194)
Bio T > 2.6 nmol/L(n=736)
Bio T > 2.6 nmol/L(n=736)
Log rank, p=0.007, HR 2.2 (1.2-3.9)

Low T As A Predictive Marker For Cardiovascular Mortality
N = 11,606 men (no cancer or CVD) 825 men died matched
with 1489 living men in control group
Mean follow-up 7 years “In men, endogenous testosterone
concentrations are inversely related to mortality due to cardiovascular disease and all causes”
Khaw KT, et al. Circulation. 2007;116:2694-2701.
0 2 4 6 8 10
1234
Multivariate-adjusted survival by quartile of endogenous T concentration (4 is highest)
Years of follow up
Testosterone group
.5
.6
.7
.8
.9
1.0
Cum
ulat
ive
surv
ival
1.1
Overall mortality
P < .001 for trend after adjusting for multiple variables, including age, BMI, blood pressure, cigarette smoking, etc.

Low Testosterone and Increased Mortality (N >500)
Recent Studies HR (95% CI) Nature Men, n Follow-
up, y Mortality
Shores, 2006 1.88 (1.34–2.63) Retrospective 858 8 All-cause
Laughlin, 2008 1.38 (1.02–1.85) Prospective 794 20 CVD
Khaw, 2007 2.29 (1.60–3.26) Prospective 2314 of 11,606 10 All-cause and
CVD
Haring, 2010 2.32 (1.38–3.89) Prospective 1954 7.2 All-cause
2.56 (1.15-6.52) CVD
Malkin, 2010 2.27 (1.45–3.60) Prospective 930 6.9
All-cause in men with coronary disease
Tivesten, 2009 1.65 (1.29–2.12) Prospective 3014 4.5 All-cause
Menke, 2010 1.43 (1.09–1.87) Prospective 1114 9 All-cause
Vikan, 2009 1.24 (1.01–1.54) Prospective 1568 11.2 All-cause
Corona, 2010 7.1 (1.8–28.6) Prospective 1687 4.3 CVD

No. of Studies with Beneficial or Harmful CV Effects with Higher T (Endogenous or Treated)
Cardiovascular Beneficial Harmful
Mortality
Coronary Artery Disease (CAD)
Severity CAD
Carotid Plaque/Intima Media Thickness
Fat mass/Obesity
Glycemic control
Total

No. of Studies with Beneficial or Harmful CV Effects with Higher T (Endogenous or Treated)
Cardiovascular Beneficial Harmful
Mortality 8 0
Coronary Artery Disease (CAD) 6 0
Severity CAD 4 0
Carotid Plaque/Intima Media Thickness
8 0
Fat mass/Obesity 14 0
Glycemic control 6 0
Total 46 0

Summary
No credible evidence in the scientific literature that T therapy is associated with CV risks
FDA: no evidence increased risk Literature supports beneficial effects of T
Low T associated with increased mortality Higher endogenous T is protective against CV risk T therapy improves CV risk factors

Why Is There A Controversy?
Claims of increased CV risk promoted by those who are not involved in the care of men with T deficiency : Anti-pharma advocates Media Plaintiff attorneys Anti-sex

ACCURATE REPORTING OF T RESEARCH
Androgen Study Group formed to provide accurate reporting of T research
www.androgenstudygroup.org

ACCURATE REPORTING OF T RESEARCH
Androgen Study Group formed to provide accurate reporting of T research
www.androgenstudygroup.org
“If you don't read the newspaper you are uninformed. If you do read the newspaper you are misinformed.”Mark Twain (1835-1910), US author, humorist