Embed Size (px)
Citation preview
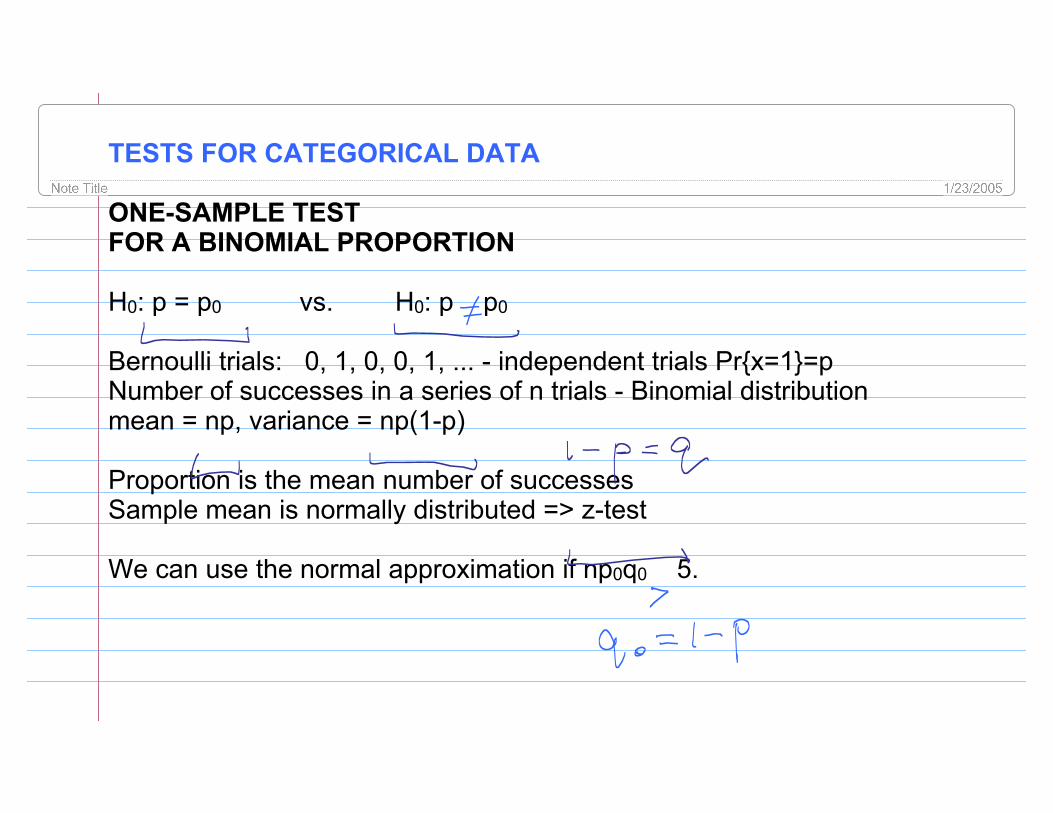
TESTS FOR CATEGORICAL DATA
ONE-SAMPLE TESTFOR A BINOMIAL PROPORTION
H0: p = p0 vs. H0: p p0
Bernoulli trials: 0, 1, 0, 0, 1, ... - independent trials Pr{x=1}=pNumber of successes in a series of n trials - Binomial distributionmean = np, variance = np(1-p)
Proportion is the mean number of successesSample mean is normally distributed => z-test
We can use the normal approximation if np0q0 5.
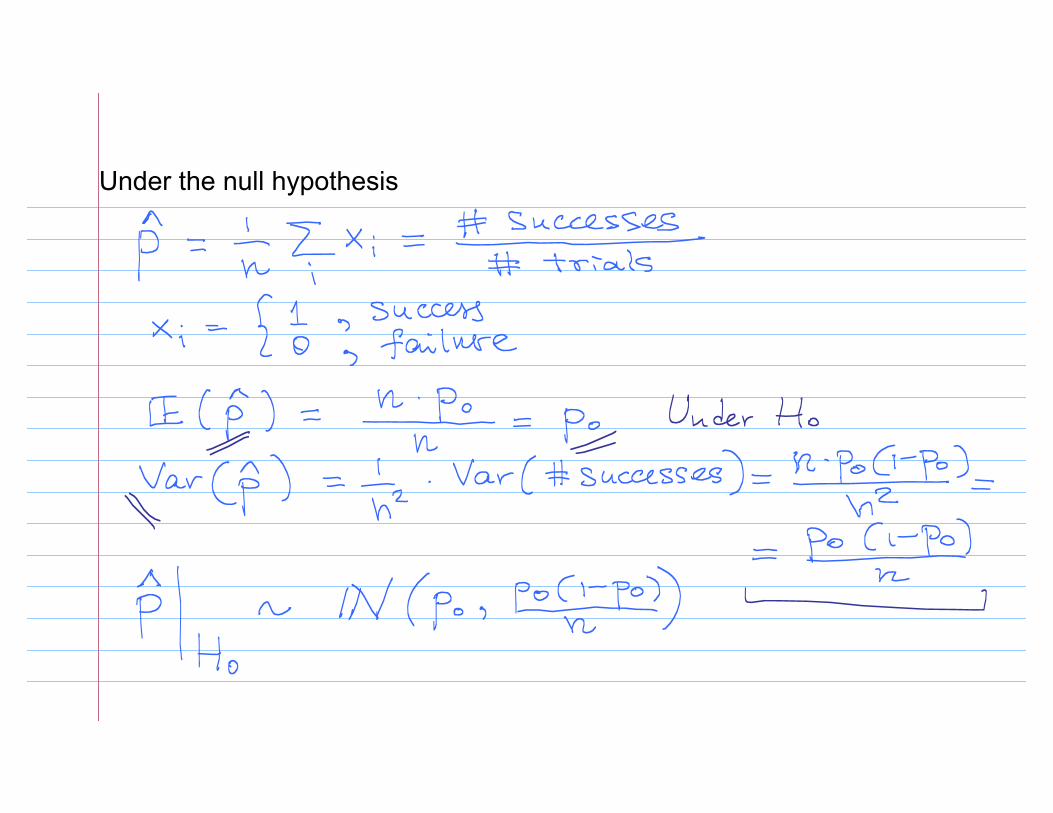
Under the null hypothesis
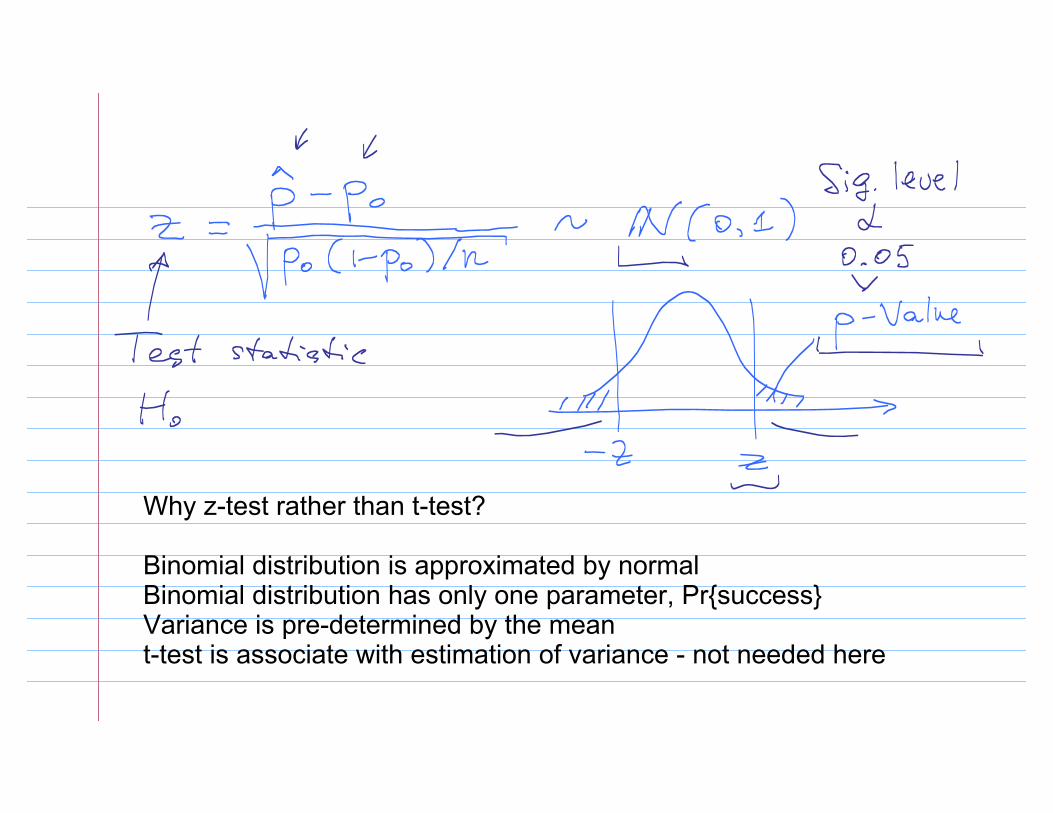
Why z-test rather than t-test?
Binomial distribution is approximated by normalBinomial distribution has only one parameter, Pr{success}Variance is pre-determined by the meant-test is associate with estimation of variance - not needed here

Cardiovascular Disease Example
Suppose the incidence rate of MI per year was 5 per 1000 among 45-54-year-old males in 1970.
5000 45-54-year-old men were followed for 1-year starting 1980. Fifteen new cases of MI were found.
Did the incidence rates of MI change from 1970 to 1980?
H0: p = 5/1000 = .005H1: p .005
np0q0 = 5000*(.005)*(.995) = 24.88 > 5 => Use the normal approximation method
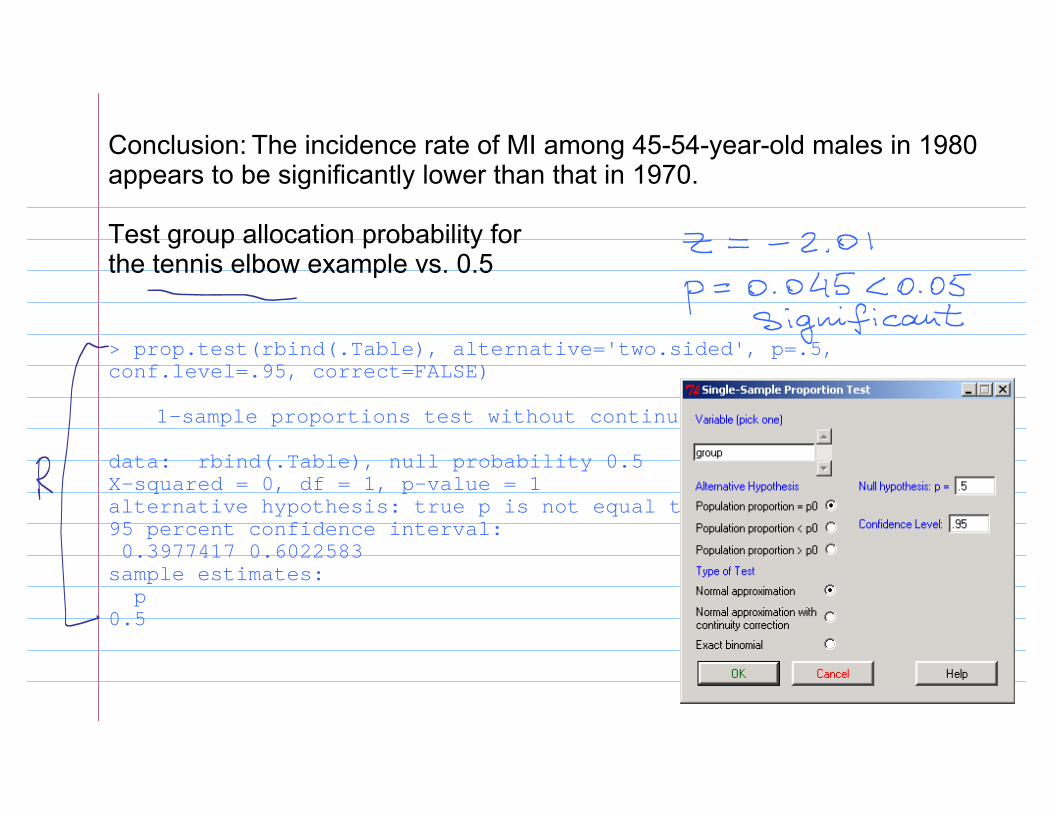
Conclusion: The incidence rate of MI among 45-54-year-old males in 1980 appears to be significantly lower than that in 1970.
Test group allocation probability for the tennis elbow example vs. 0.5
> prop.test(rbind(.Table), alternative='two.sided', p=.5, conf.level=.95, correct=FALSE)
1-sample proportions test without continuity correction
data: rbind(.Table), null probability 0.5 X-squared = 0, df = 1, p-value = 1alternative hypothesis: true p is not equal to 0.5 95 percent confidence interval: 0.3977417 0.6022583 sample estimates: p 0.5
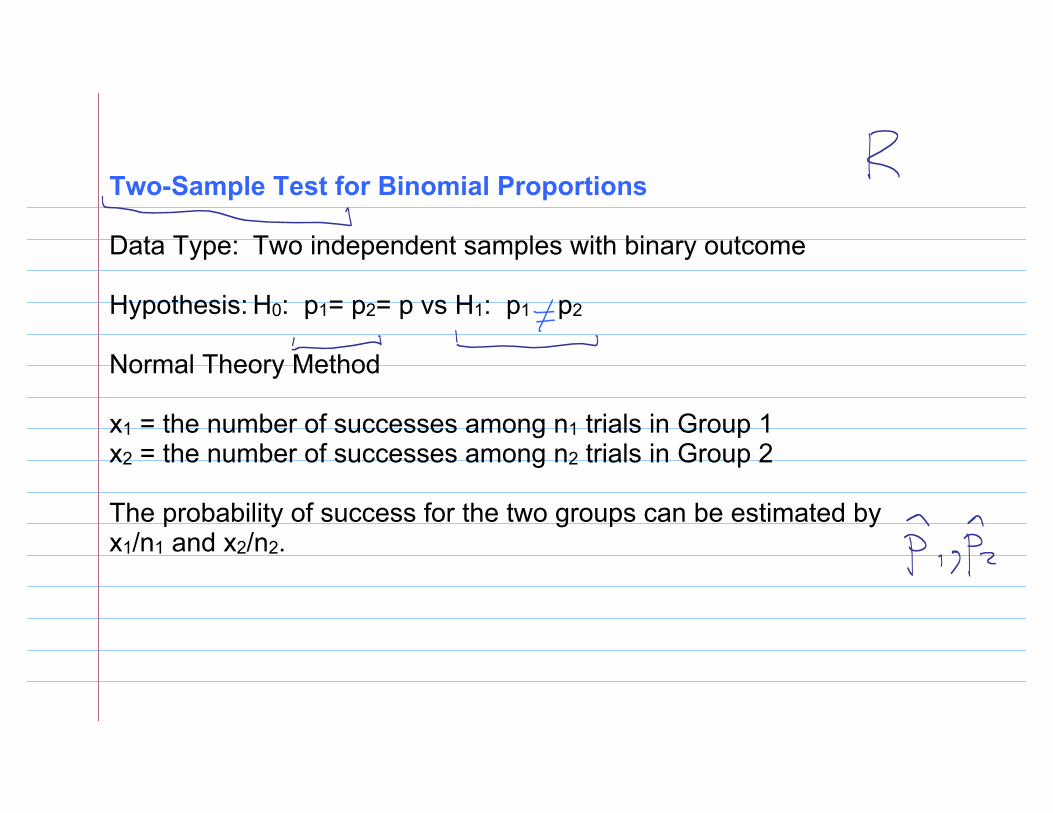
Two-Sample Test for Binomial Proportions
Data Type: Two independent samples with binary outcome
Hypothesis: H0: p1= p2= p vs H1: p1 p2
Normal Theory Method
x1 = the number of successes among n1 trials in Group 1x2 = the number of successes among n2 trials in Group 2
The probability of success for the two groups can be estimated by x1/n1 and x2/n2.
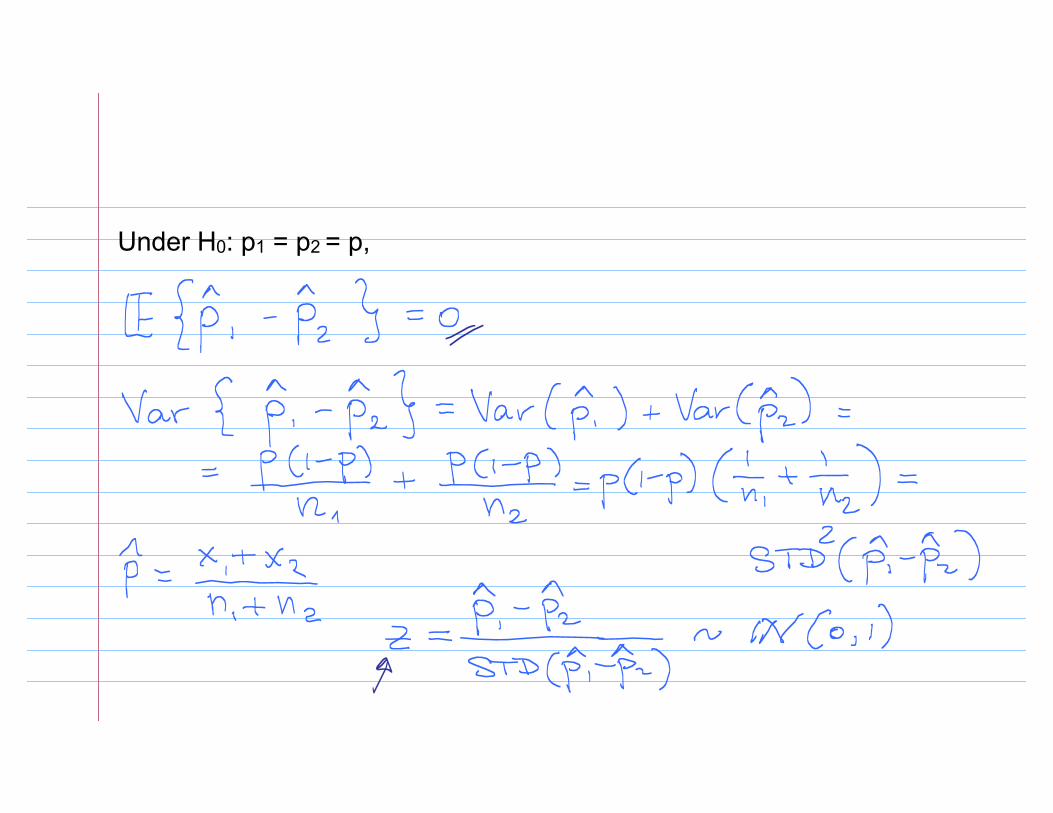
Under H0: p1 = p2 = p,
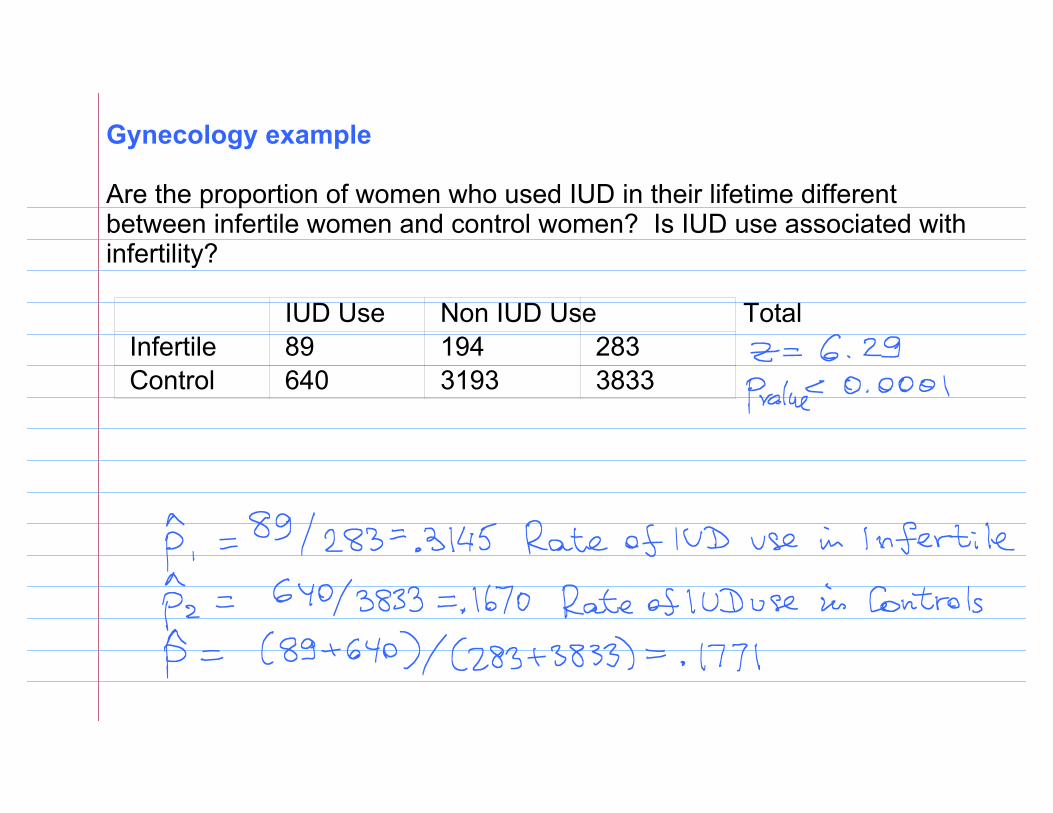
Gynecology example
Are the proportion of women who used IUD in their lifetime different between infertile women and control women? Is IUD use associated with infertility?
IUD Use Non IUD Use Total Infertile 89 194 283 Control 640 3193 3833
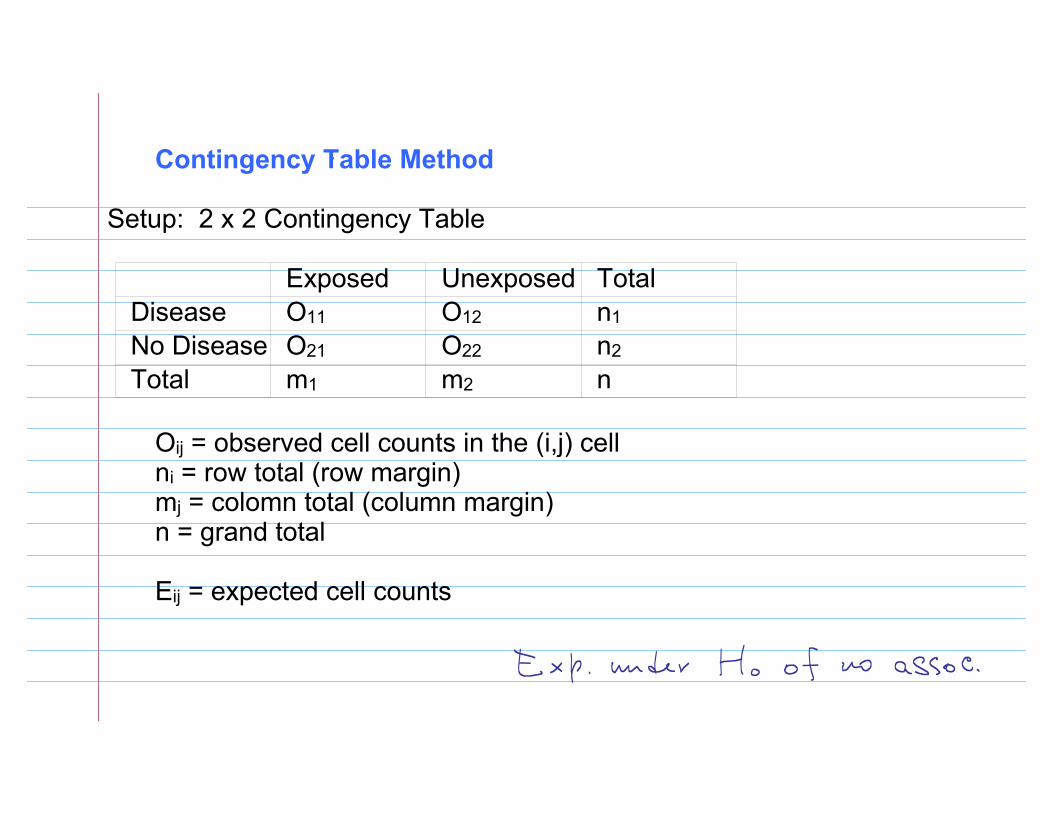
Contingency Table Method
Setup: 2 x 2 Contingency Table
Exposed Unexposed Total Disease O11 O12 n1
No Disease O21 O22 n2
Total m1 m2 n
Oij = observed cell counts in the (i,j) cellni = row total (row margin)mj = colomn total (column margin)n = grand total
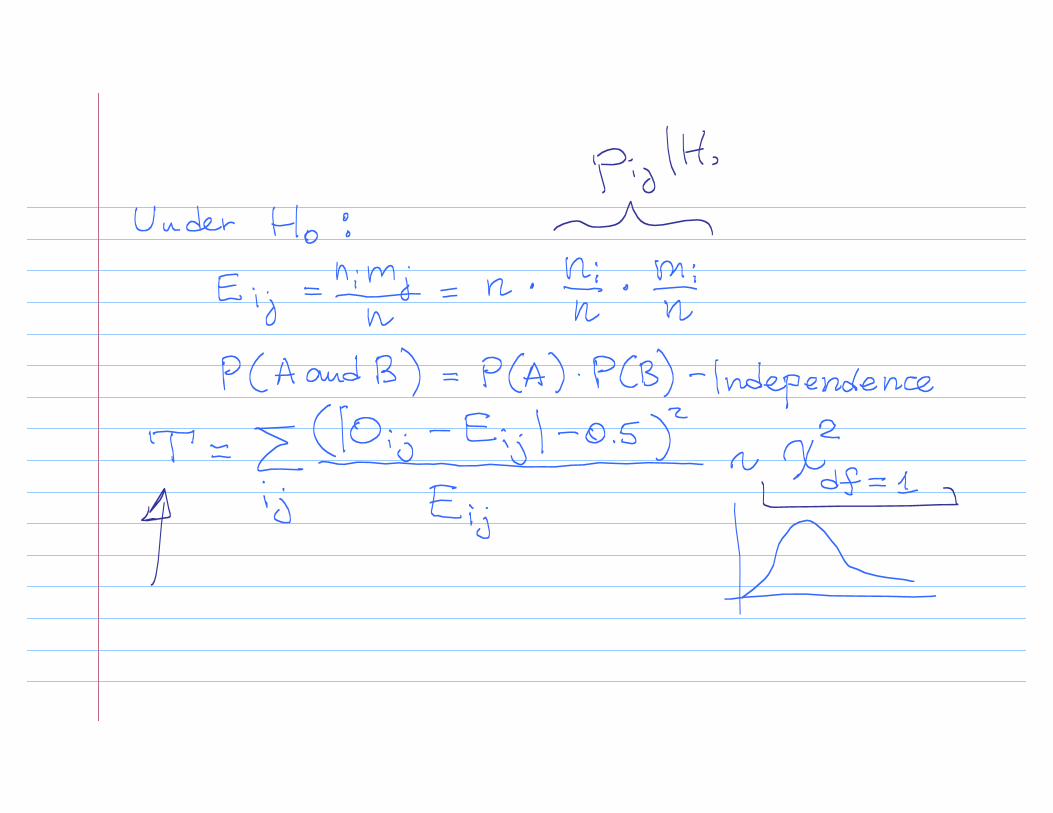
Eij = expected cell counts
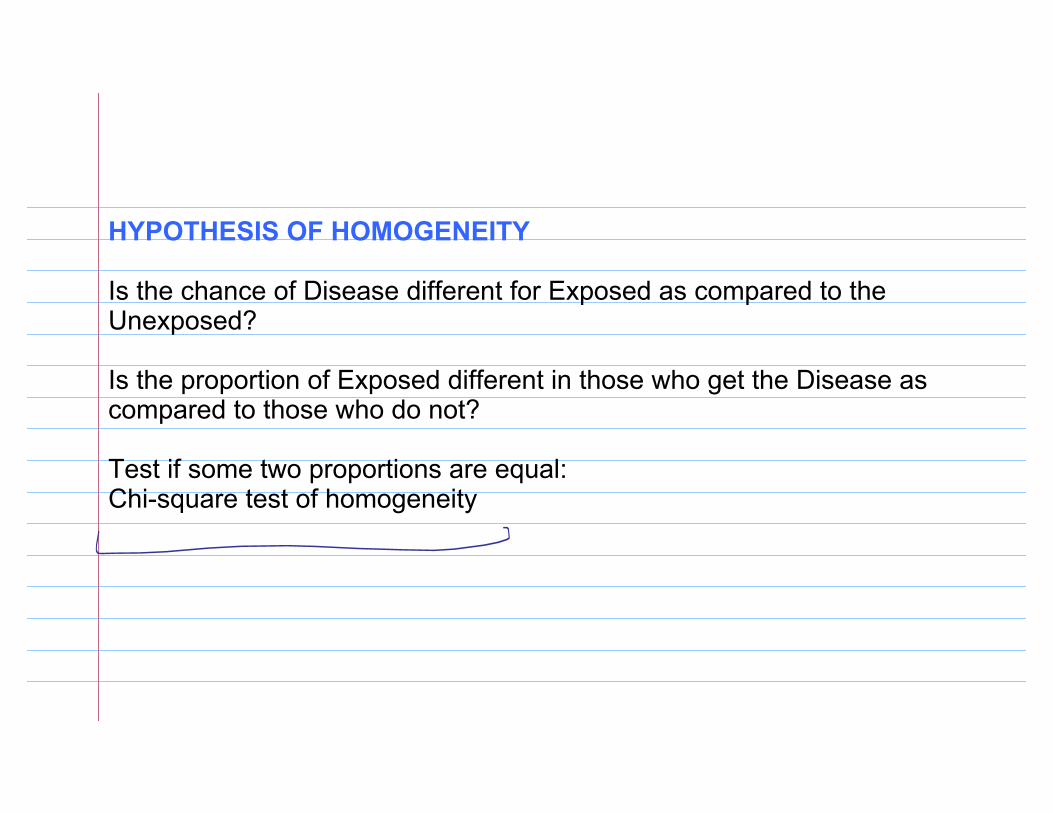
HYPOTHESIS OF HOMOGENEITY
Is the chance of Disease different for Exposed as compared to the Unexposed?
Is the proportion of Exposed different in those who get the Disease as compared to those who do not?
Test if some two proportions are equal:Chi-square test of homogeneity
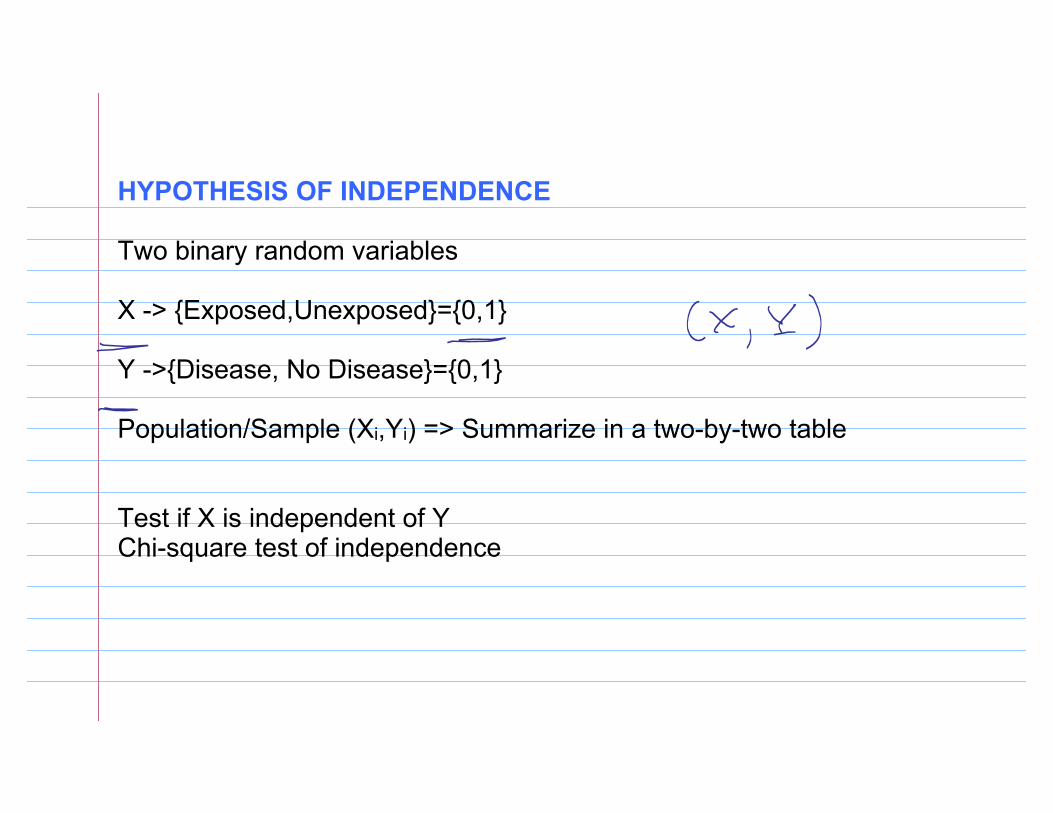
HYPOTHESIS OF INDEPENDENCE
Two binary random variables
X -> {Exposed,Unexposed}={0,1}
Y ->{Disease, No Disease}={0,1}
Population/Sample (Xi,Yi) => Summarize in a two-by-two table
Test if X is independent of YChi-square test of independence
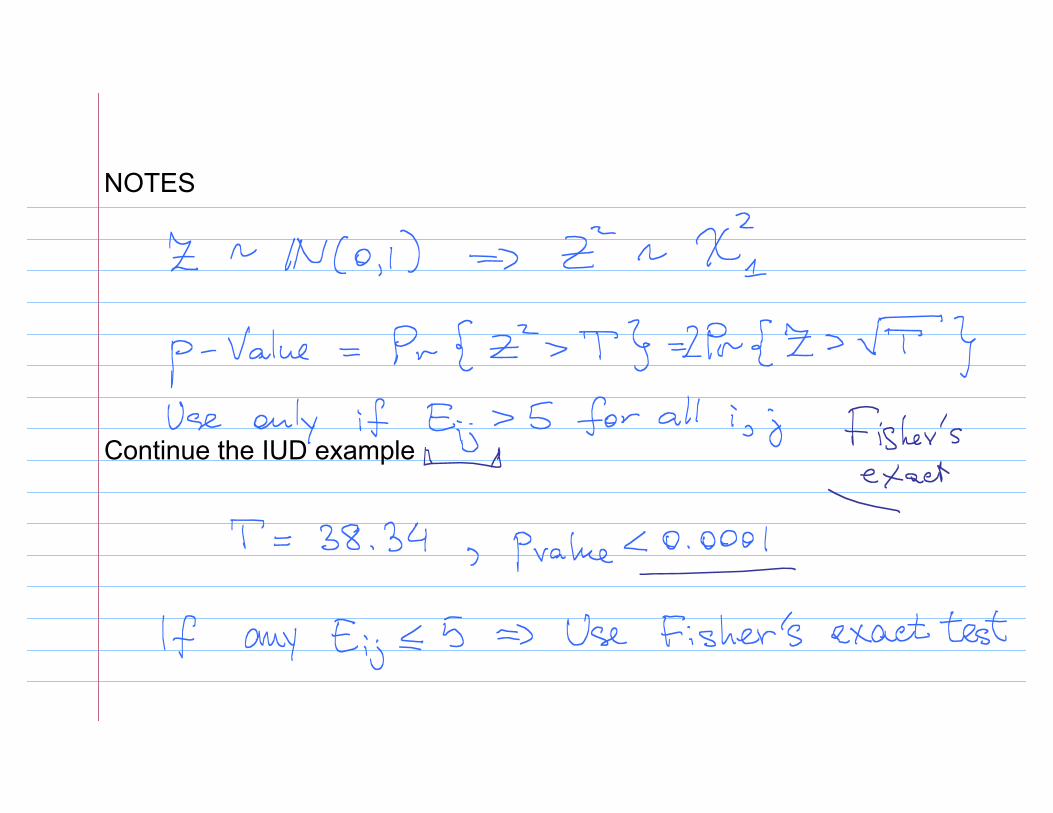
NOTES
Continue the IUD example
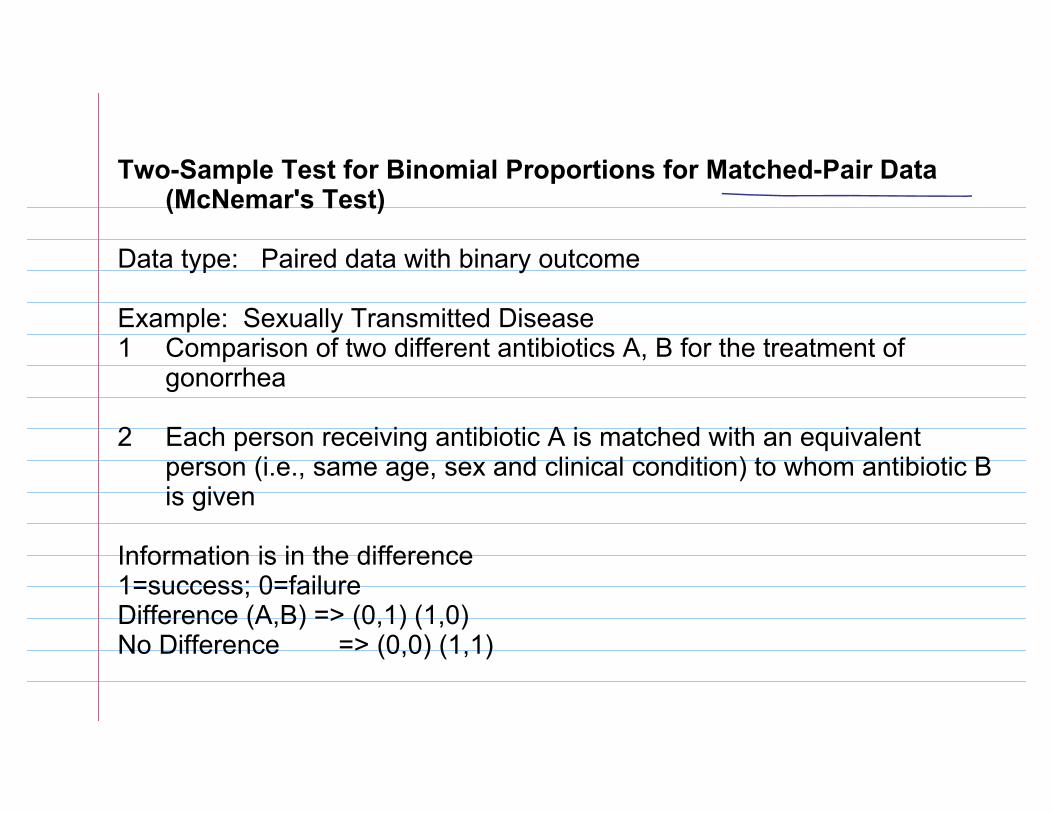
Two-Sample Test for Binomial Proportions for Matched-Pair Data (McNemar's Test)
Data type: Paired data with binary outcome
Example: Sexually Transmitted Disease 1 Comparison of two different antibiotics A, B for the treatment of
gonorrhea
2 Each person receiving antibiotic A is matched with an equivalent person (i.e., same age, sex and clinical condition) to whom antibiotic B is given
Information is in the difference1=success; 0=failureDifference (A,B) => (0,1) (1,0)No Difference => (0,0) (1,1)
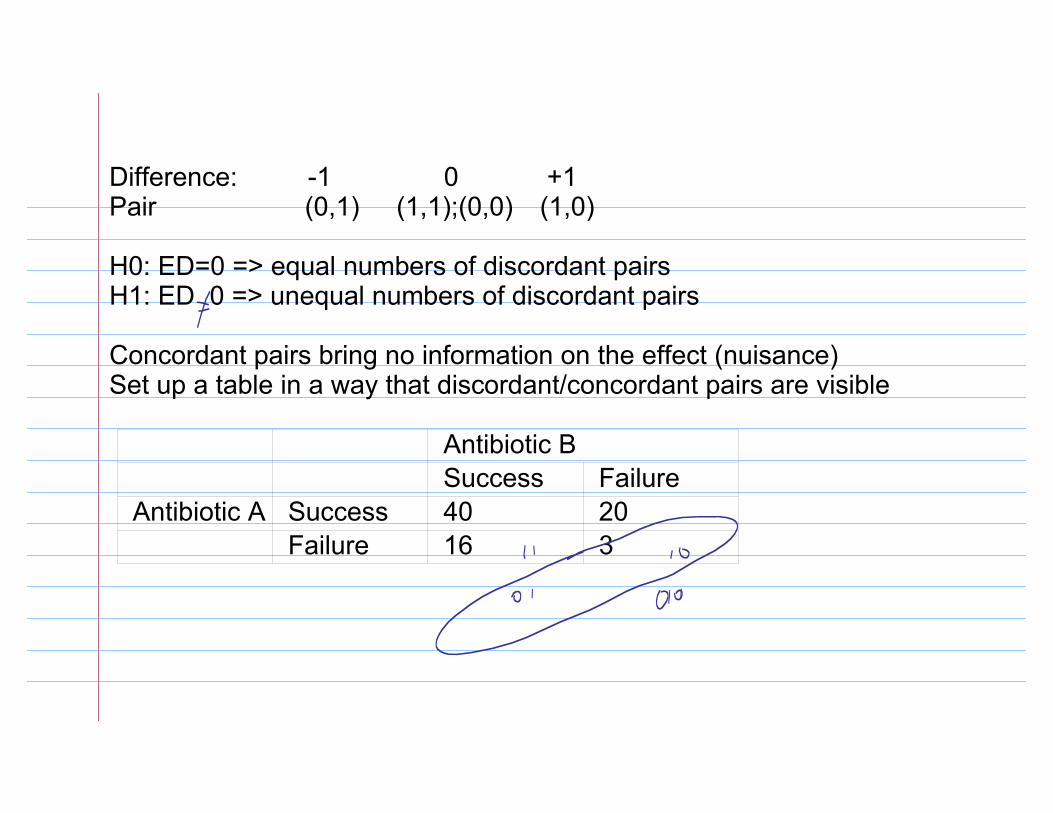
Difference: -1 0 +1Pair (0,1) (1,1);(0,0) (1,0)
H0: ED=0 => equal numbers of discordant pairsH1: ED 0 => unequal numbers of discordant pairs
Concordant pairs bring no information on the effect (nuisance)Set up a table in a way that discordant/concordant pairs are visible
Antibiotic B Success Failure Antibiotic A Success 40 20
Failure 16 3
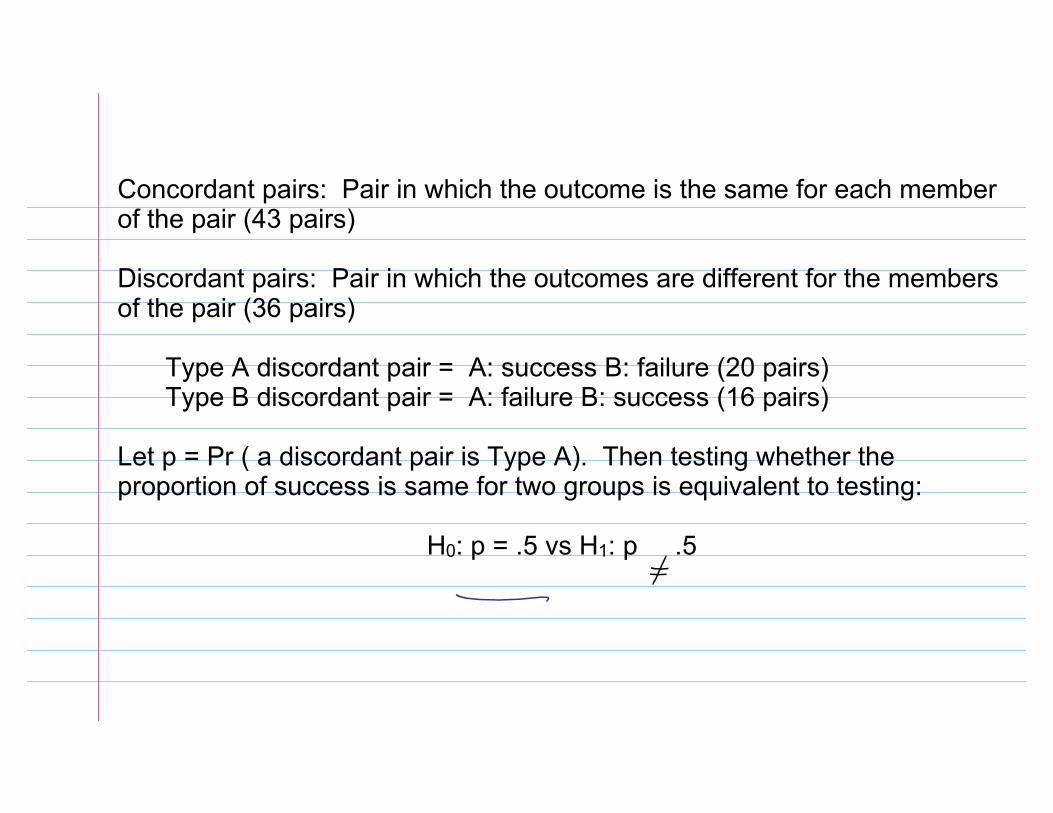
Concordant pairs: Pair in which the outcome is the same for each member of the pair (43 pairs)
Discordant pairs: Pair in which the outcomes are different for the members of the pair (36 pairs)
Type A discordant pair = A: success B: failure (20 pairs)Type B discordant pair = A: failure B: success (16 pairs)
Let p = Pr ( a discordant pair is Type A). Then testing whether the proportion of success is same for two groups is equivalent to testing:
H0: p = .5 vs H1: p .5
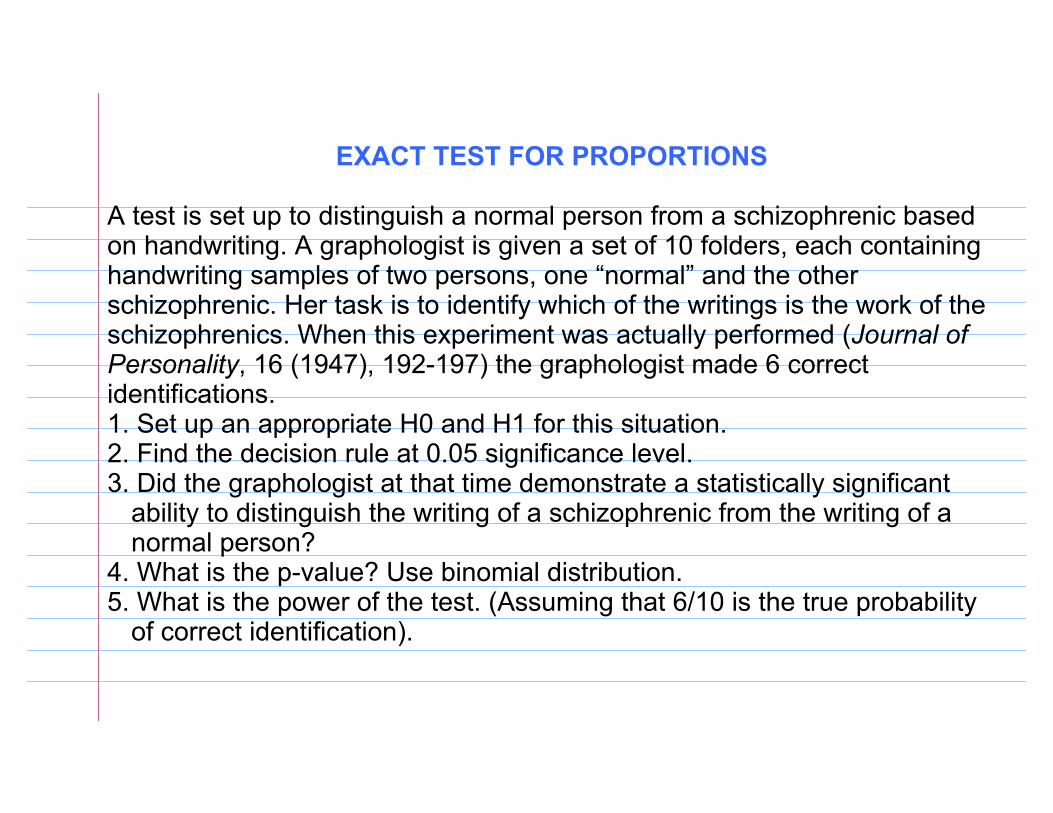
EXACT TEST FOR PROPORTIONS
A test is set up to distinguish a normal person from a schizophrenic based on handwriting. A graphologist is given a set of 10 folders, each containing handwriting samples of two persons, one “normal” and the other schizophrenic. Her task is to identify which of the writings is the work of the schizophrenics. When this experiment was actually performed (Journal of Personality, 16 (1947), 192-197) the graphologist made 6 correct identifications. 1. Set up an appropriate H0 and H1 for this situation. 2. Find the decision rule at 0.05 significance level. 3. Did the graphologist at that time demonstrate a statistically significant
ability to distinguish the writing of a schizophrenic from the writing of a normal person?
4. What is the p-value? Use binomial distribution.5. What is the power of the test. (Assuming that 6/10 is the true probability
of correct identification).
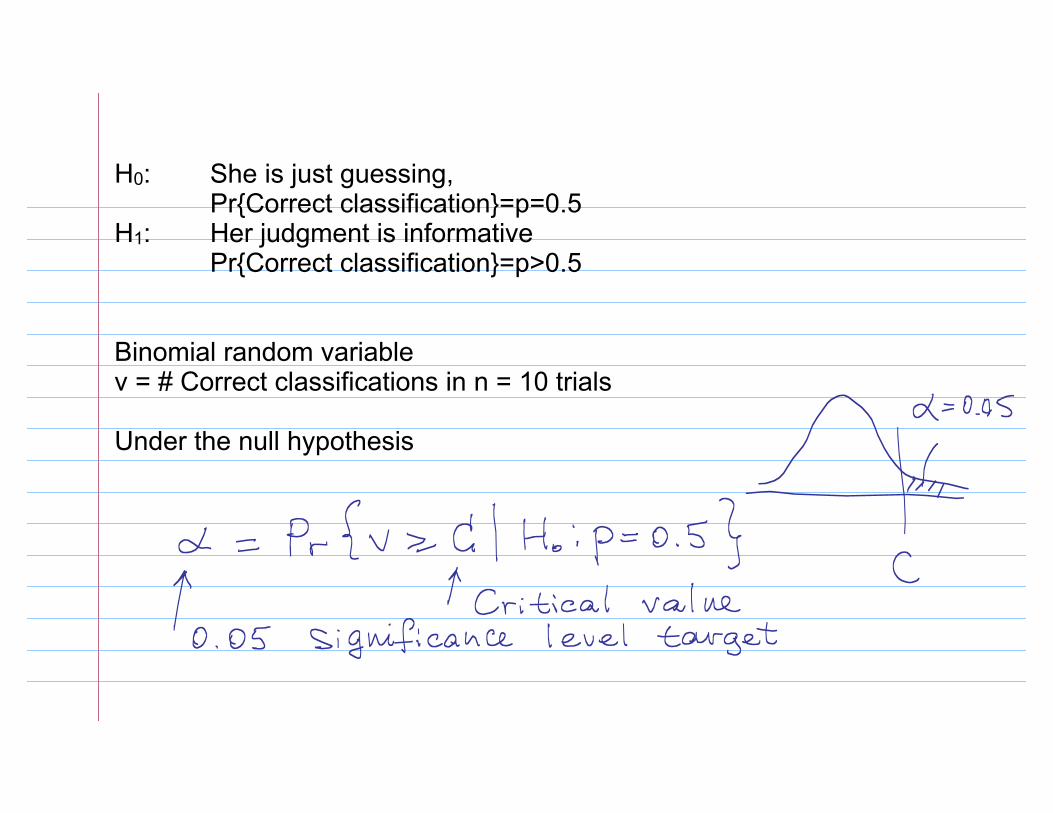
H0: She is just guessing, Pr{Correct classification}=p=0.5
H1: Her judgment is informative Pr{Correct classification}=p>0.5
Binomial random variable ν = # Correct classifications in n = 10 trials
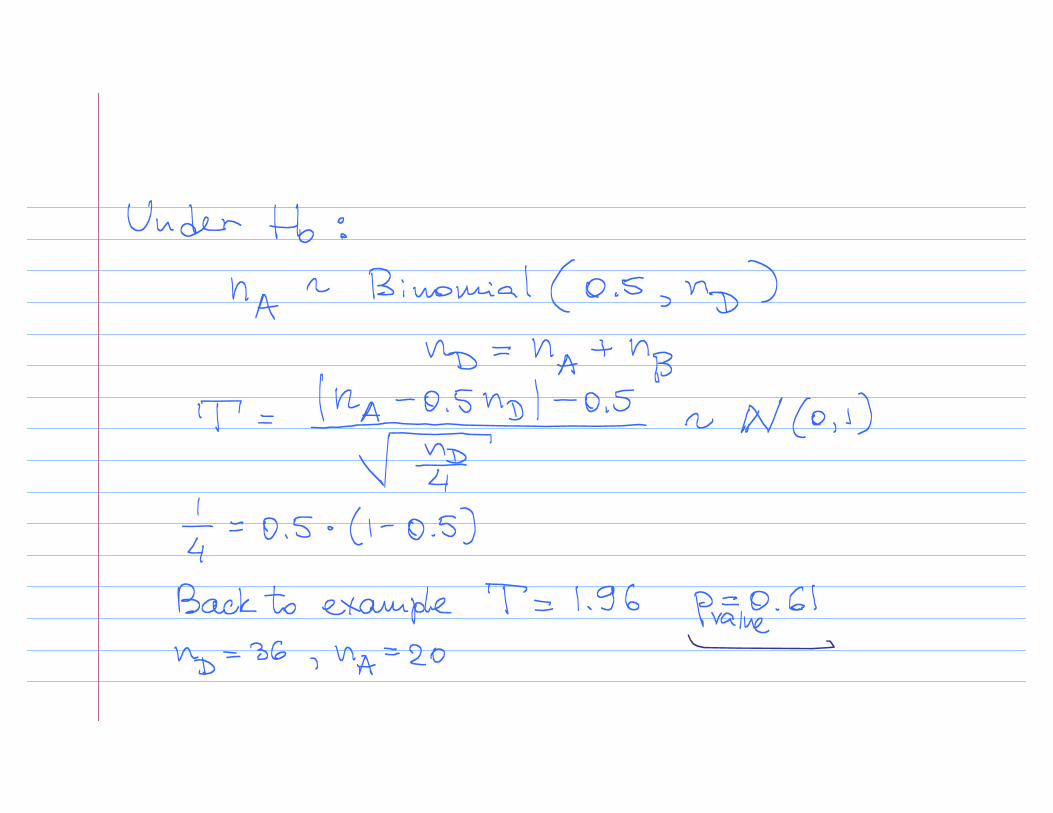
Under the null hypothesis
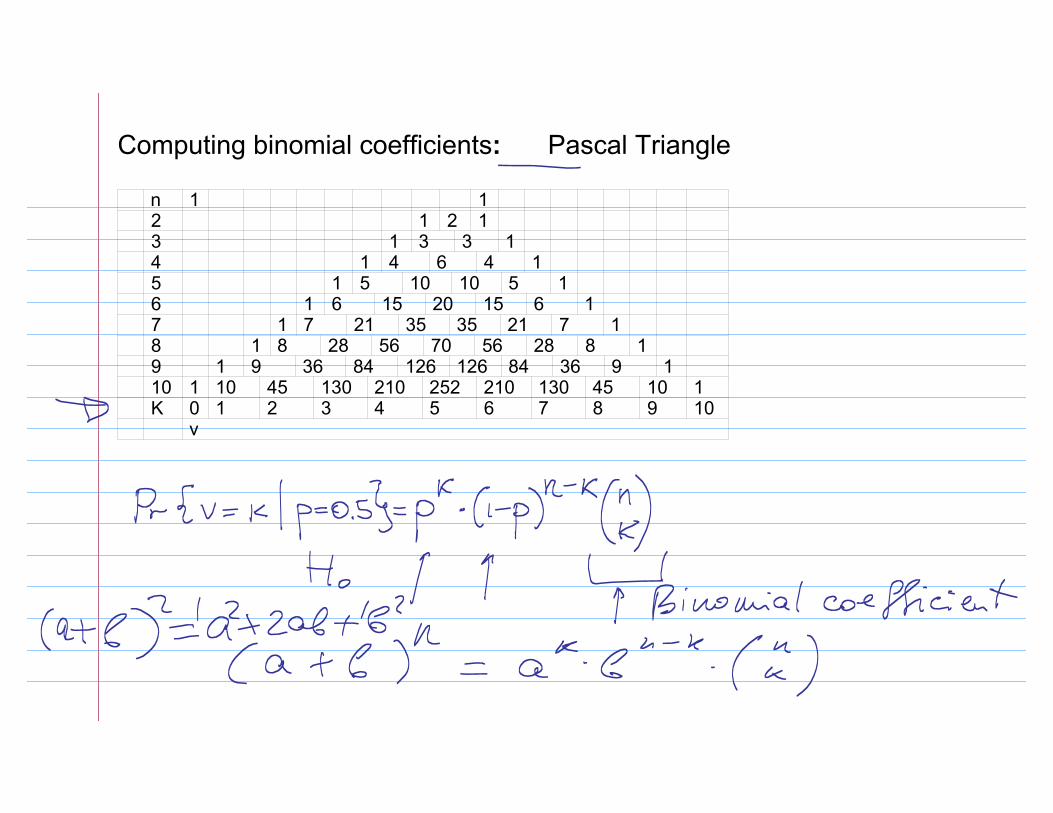
Computing binomial coefficients: Pascal Triangle
n 1 12 1 2 13 1 3 3 14 1 4 6 4 15 1 5 10 10 5 16 1 6 15 20 15 6 17 1 7 21 35 35 21 7 18 1 8 28 56 70 56 28 8 19 1 9 36 84 126 126 84 36 9 110 1 10 45 130 210 252 210 130 45 10 1K 0 1 2 3 4 5 6 7 8 9 10
ν
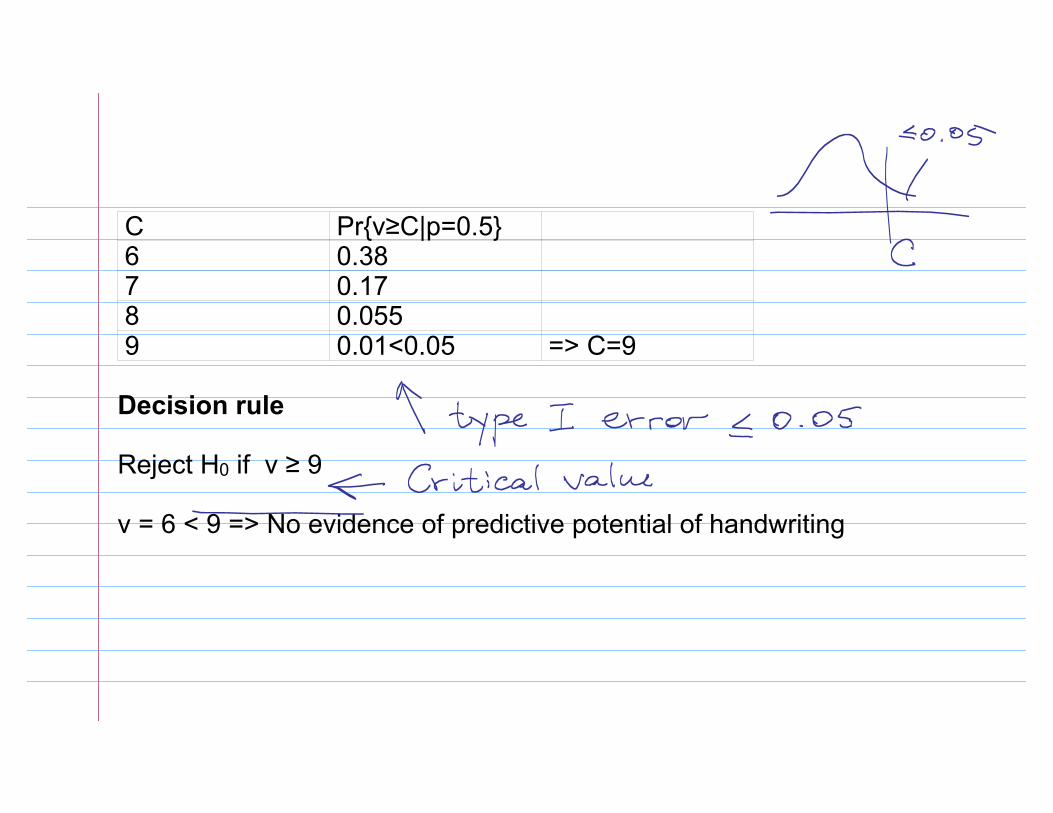
C Pr{v≥C|p=0.5}6 0.387 0.178 0.0559 0.01<0.05 => C=9
Decision rule
Reject H0 if ν ≥ 9
ν = 6 < 9 => No evidence of predictive potential of handwriting
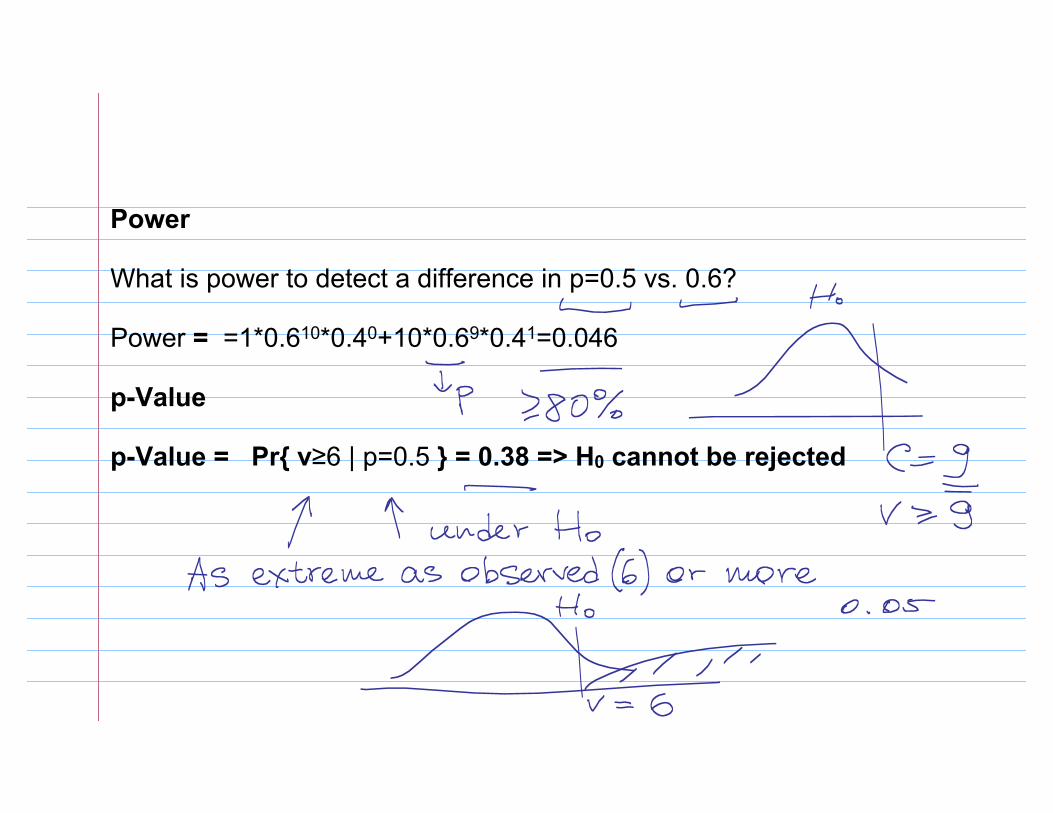
Power
What is power to detect a difference in p=0.5 vs. 0.6?
Power = =1*0.610*0.40+10*0.69*0.41=0.046
p-Value
p-Value = Pr{ v≥6 | p=0.5 } = 0.38 => H0 cannot be rejected
WHAT IS WRONG IN THIS PICTURE?
A review of a clinic's records of diabetic patients revealed approximately3,000 cases for which data on maximum weight were available. It wasfound that approximately two-thirds of the patients had been, at sometime, 11 percent or more overweight. This provides evidence of anassociation between obesity and diabetes.
=> Data provide evidence on the chance to be overweight among diabeticsAssociation can only be concluded if a similar chance is estimated innon-diabetic controls and significant differences between proportionsin diabetics vs. controls are shown.
Data on 123 consecutive unselected female patients with hyperparathyroidism at a university hospital revealed that 36 were under 45 years old and 87 were 45 years old and older. This led the author to conclude that, in women, hyperparathyroidism was more common in the menopausal and postmenopausal age groups.
=> Age may be unrelated to the disease, and the observed age distributiondoes not in itself say anything about the association and may be just ausual composition of hospital admissions. In order to establish theassociation disease risk among pre vs. post menopausal women couldbe evaluated for significant differences. Alternatively age distribution inhyperparathyroidism patients could be compared with age distributionof the population served by the hospital.
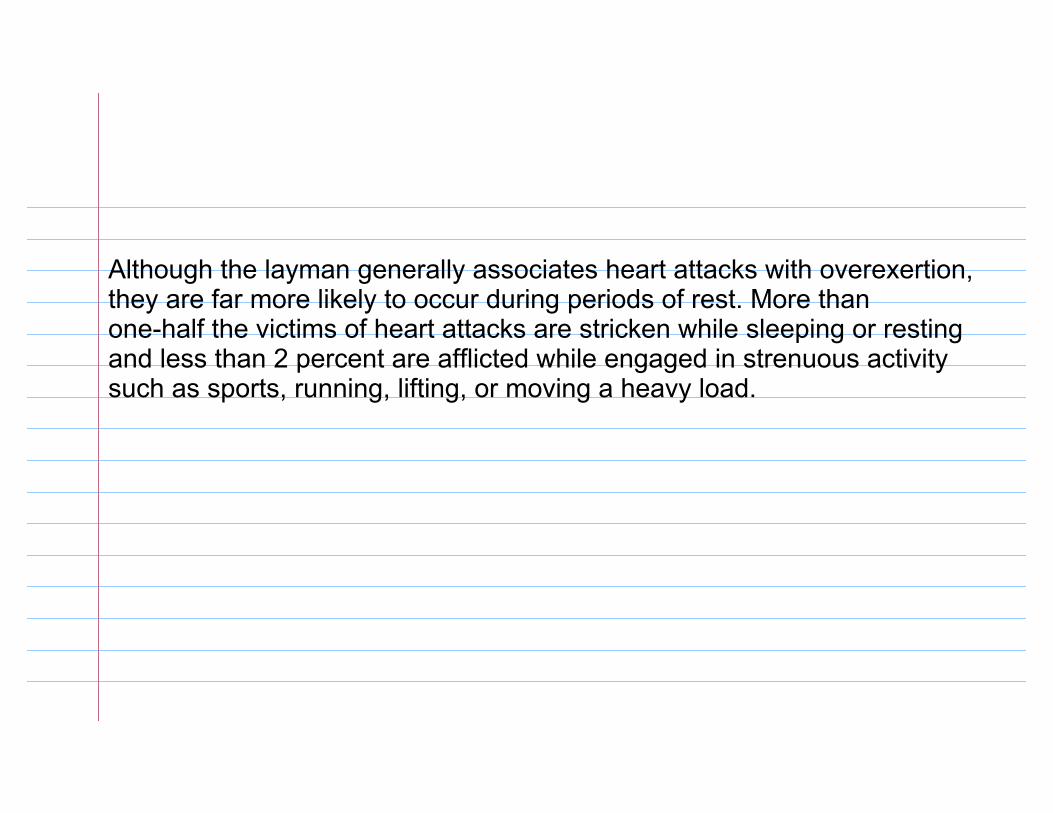
Although the layman generally associates heart attacks with overexertion,they are far more likely to occur during periods of rest. More thanone-half the victims of heart attacks are stricken while sleeping or restingand less than 2 percent are afflicted while engaged in strenuous activitysuch as sports, running, lifting, or moving a heavy load.
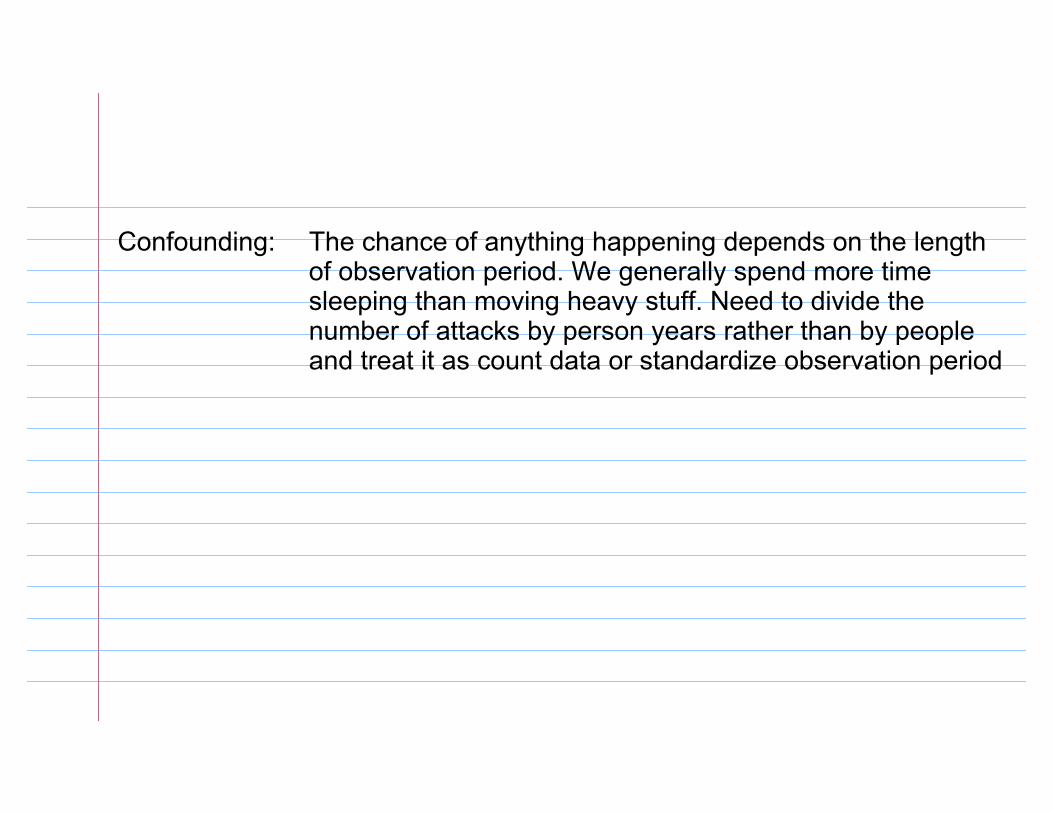
Confounding: The chance of anything happening depends on the lengthof observation period. We generally spend more timesleeping than moving heavy stuff. Need to divide thenumber of attacks by person years rather than by peopleand treat it as count data or standardize observation period
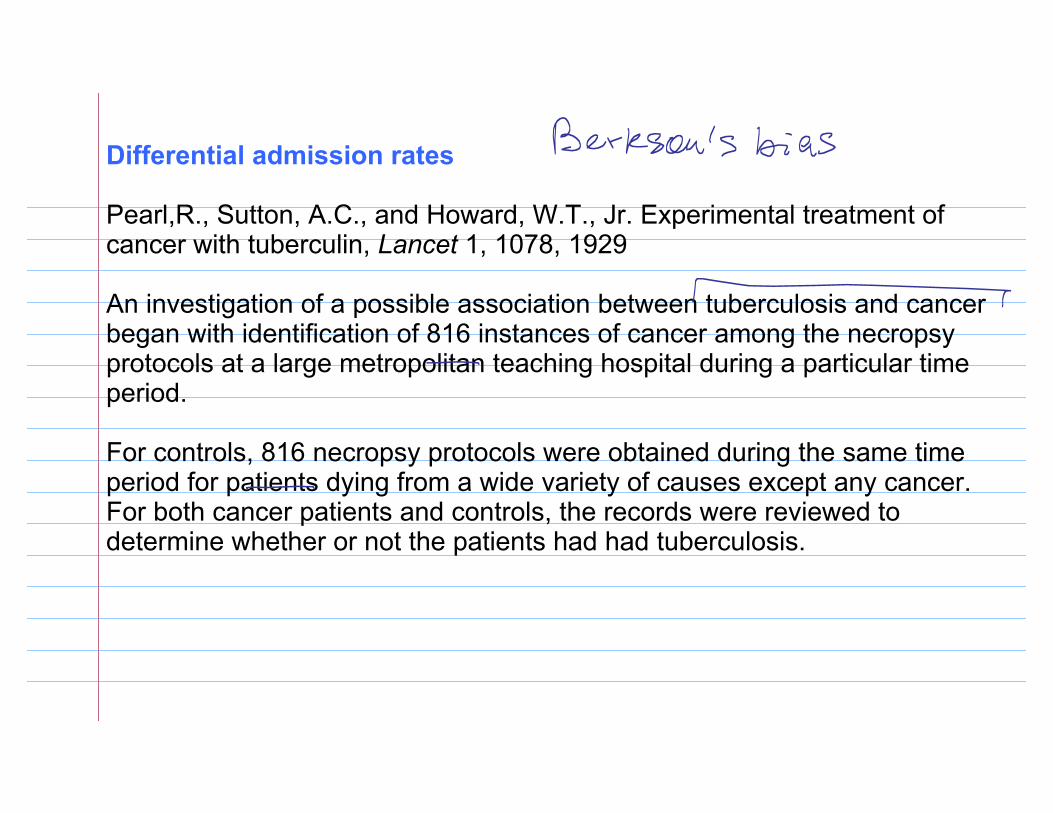
Differential admission rates
Pearl,R., Sutton, A.C., and Howard, W.T., Jr. Experimental treatment of cancer with tuberculin, Lancet 1, 1078, 1929
An investigation of a possible association between tuberculosis and cancer began with identification of 816 instances of cancer among the necropsy protocols at a large metropolitan teaching hospital during a particular time period.
For controls, 816 necropsy protocols were obtained during the same time period for patients dying from a wide variety of causes except any cancer. For both cancer patients and controls, the records were reviewed to determine whether or not the patients had had tuberculosis.
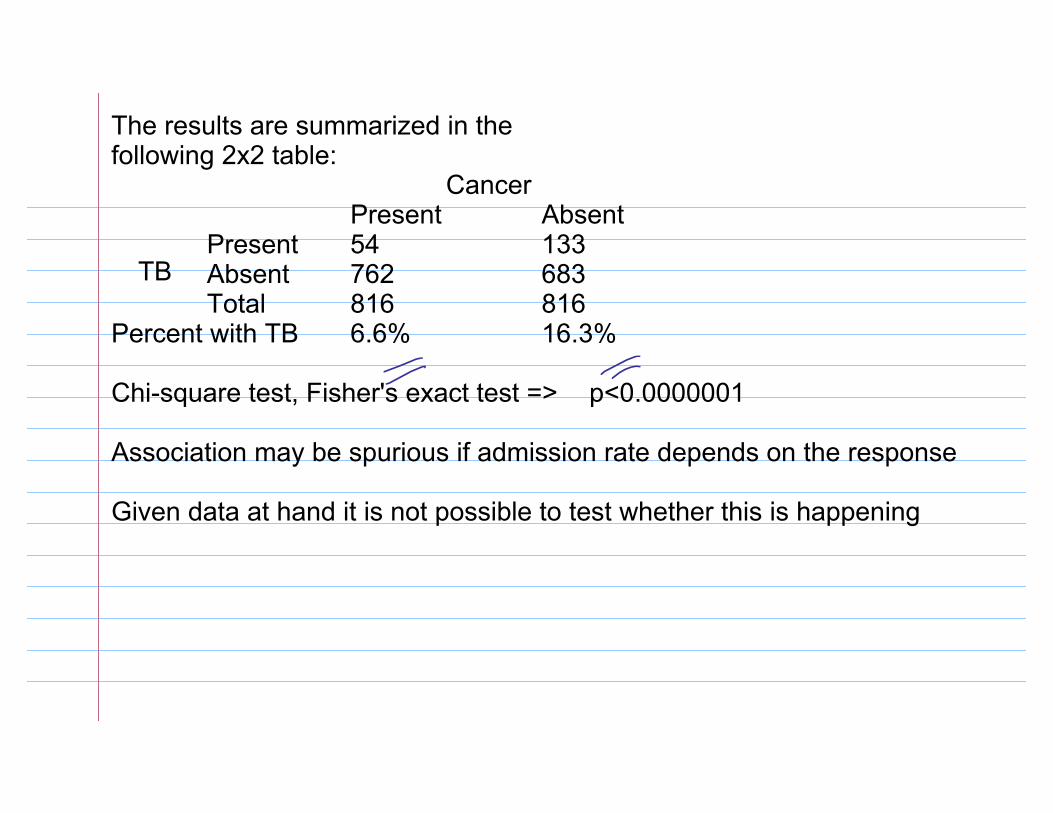
The results are summarized in the following 2x2 table:
CancerPresent Absent
Present 54 133Absent 762 683 Total 816 816
Percent with TB 6.6% 16.3%
Chi-square test, Fisher's exact test => p<0.0000001
Association may be spurious if admission rate depends on the response
Given data at hand it is not possible to test whether this is happening
TB
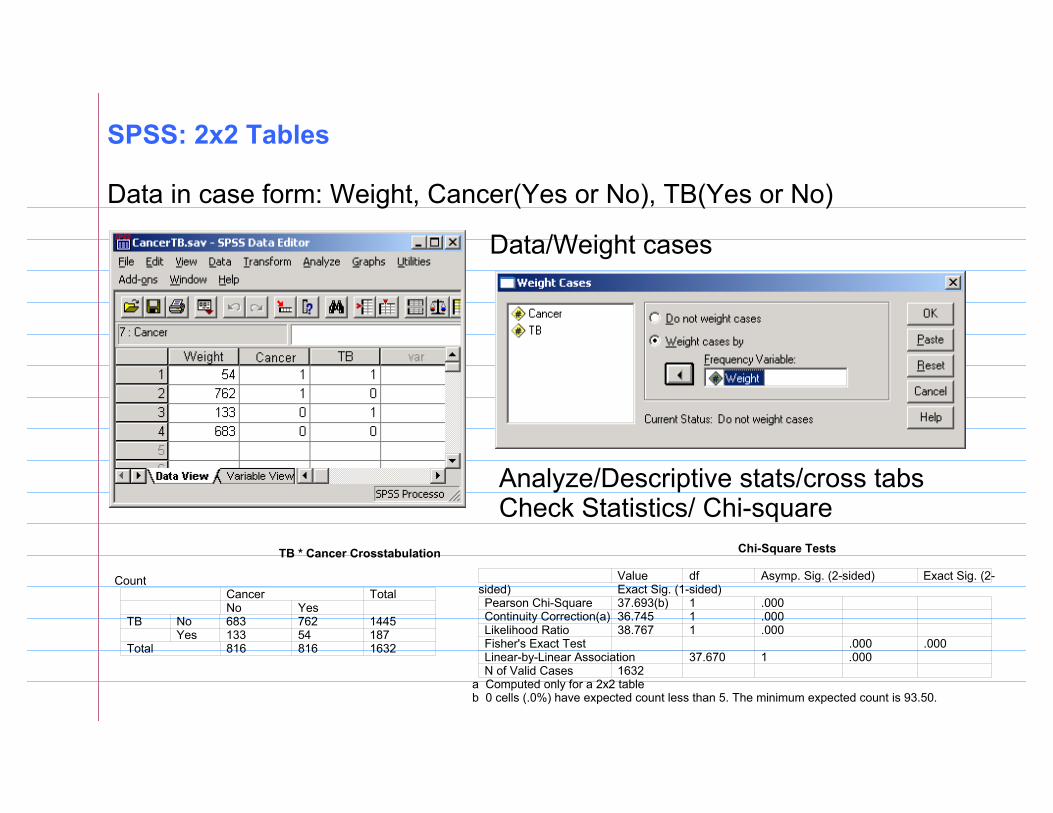
SPSS: 2x2 Tables
Data in case form: Weight, Cancer(Yes or No), TB(Yes or No)
Data/Weight cases
Analyze/Descriptive stats/cross tabsCheck Statistics/ Chi-square
TB * Cancer Crosstabulation
Count Cancer Total
No YesTB No 683 762 1445
Yes 133 54 187Total 816 816 1632
Chi-Square Tests
Value df Asymp. Sig. (2-sided) Exact Sig. (2-sided) Exact Sig. (1-sided)Pearson Chi-Square 37.693(b) 1 .000 Continuity Correction(a) 36.745 1 .000 Likelihood Ratio 38.767 1 .000 Fisher's Exact Test .000 .000Linear-by-Linear Association 37.670 1 .000 N of Valid Cases 1632
a Computed only for a 2x2 tableb 0 cells (.0%) have expected count less than 5. The minimum expected count is 93.50.
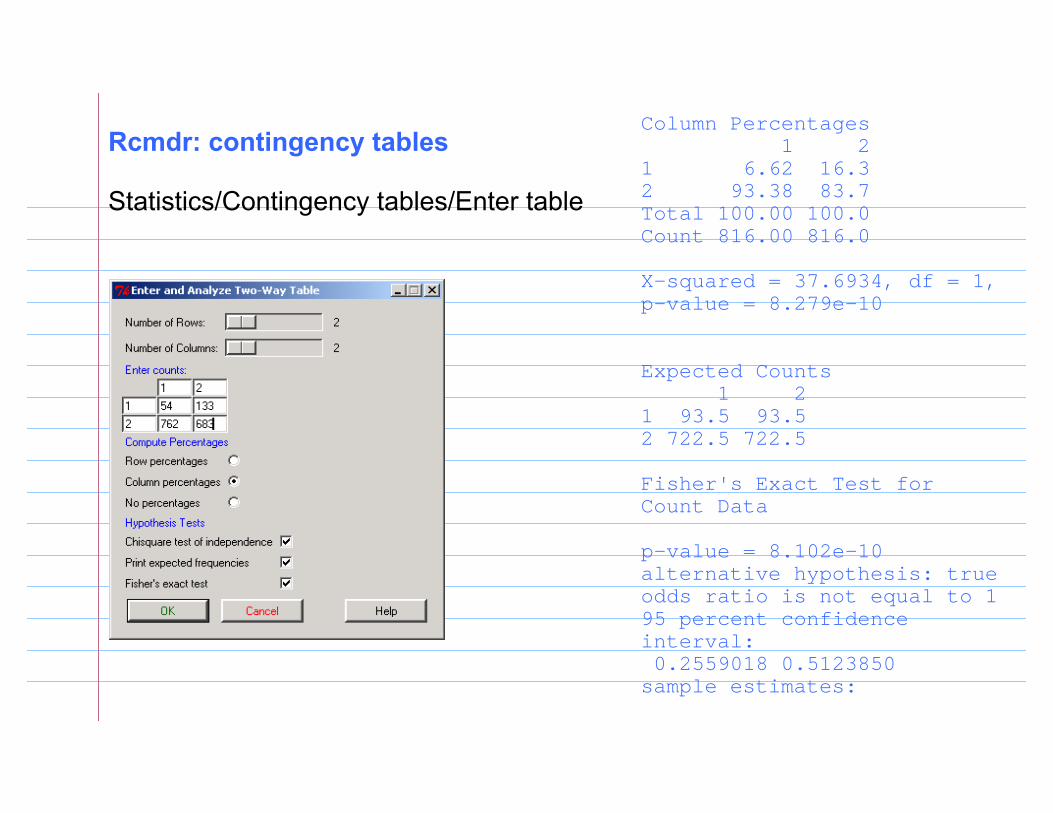
Column Percentages 1 21 6.62 16.32 93.38 83.7Total 100.00 100.0Count 816.00 816.0
X-squared = 37.6934, df = 1, p-value = 8.279e-10
Expected Counts 1 21 93.5 93.52 722.5 722.5
Fisher's Exact Test for Count Data
p-value = 8.102e-10alternative hypothesis: true odds ratio is not equal to 1 95 percent confidence interval: 0.2559018 0.5123850 sample estimates:
Rcmdr: contingency tables
Statistics/Contingency tables/Enter table
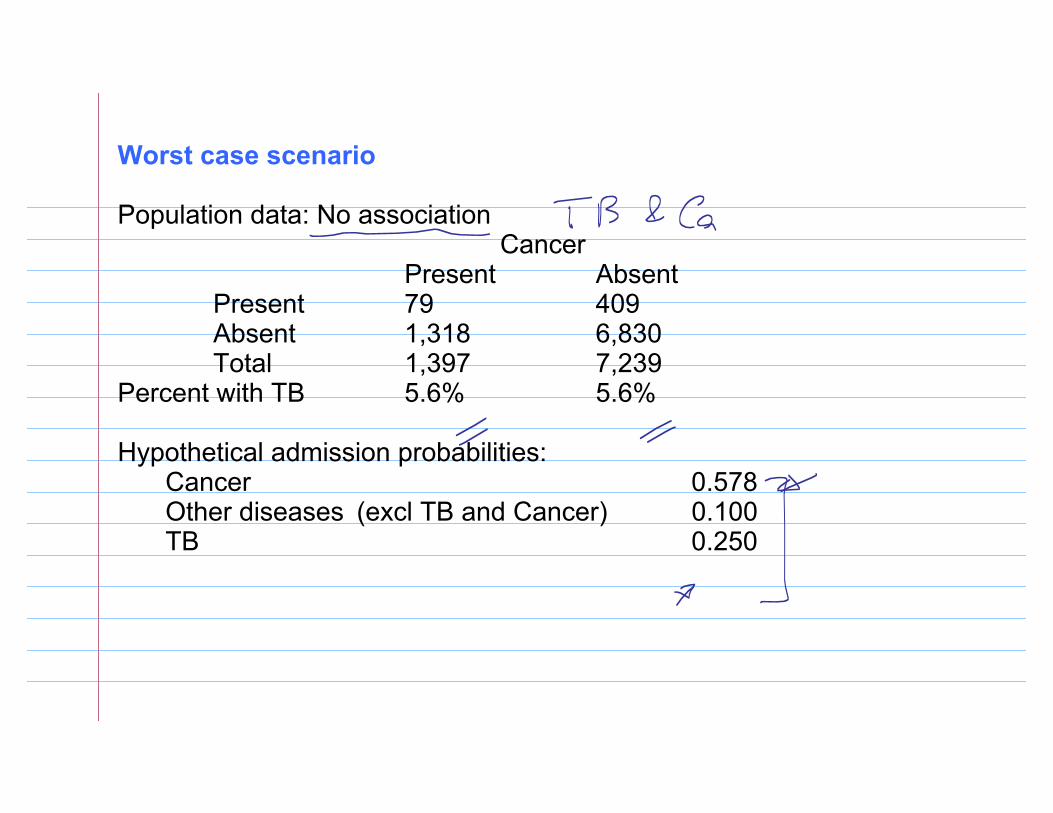
Worst case scenario
Population data: No associationCancer
Present Absent Present 79 409Absent 1,318 6,830 Total 1,397 7,239
Percent with TB 5.6% 5.6%
Hypothetical admission probabilities:Cancer 0.578Other diseases (excl TB and Cancer) 0.100TB 0.250
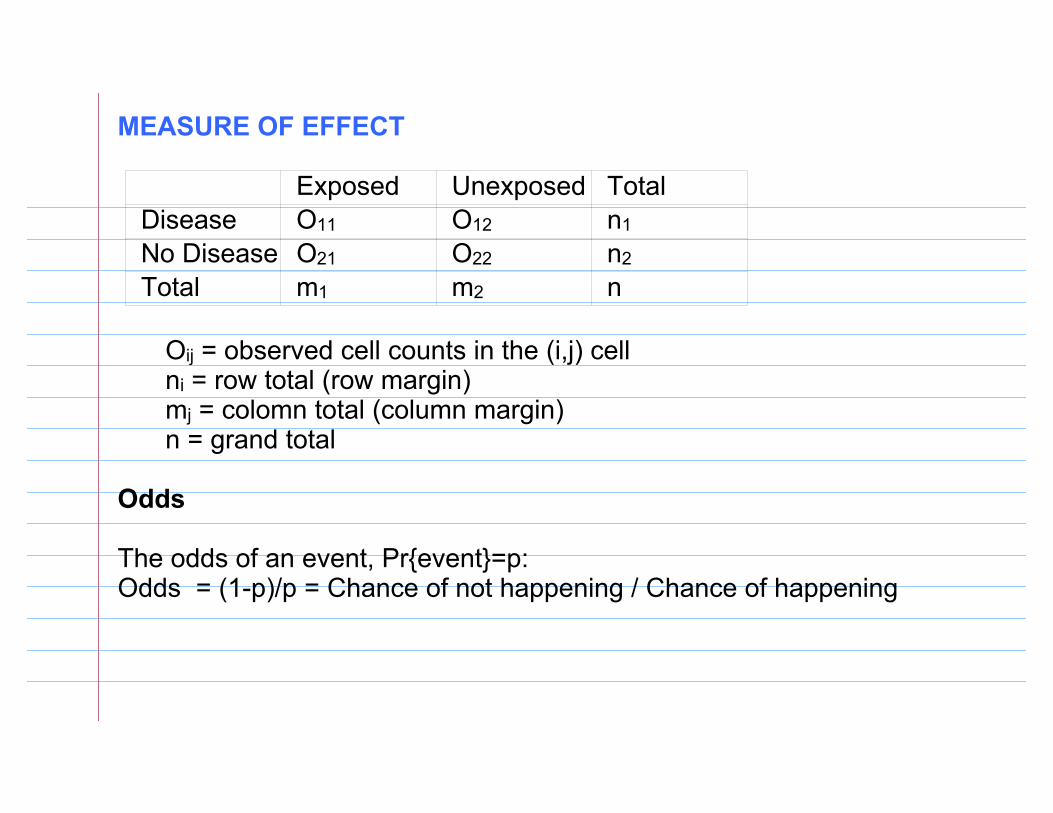
MEASURE OF EFFECT
Exposed Unexposed Total Disease O11 O12 n1
No Disease O21 O22 n2
Total m1 m2 n
Oij = observed cell counts in the (i,j) cellni = row total (row margin)mj = colomn total (column margin)n = grand total
Odds
The odds of an event, Pr{event}=p: Odds = (1-p)/p = Chance of not happening / Chance of happening
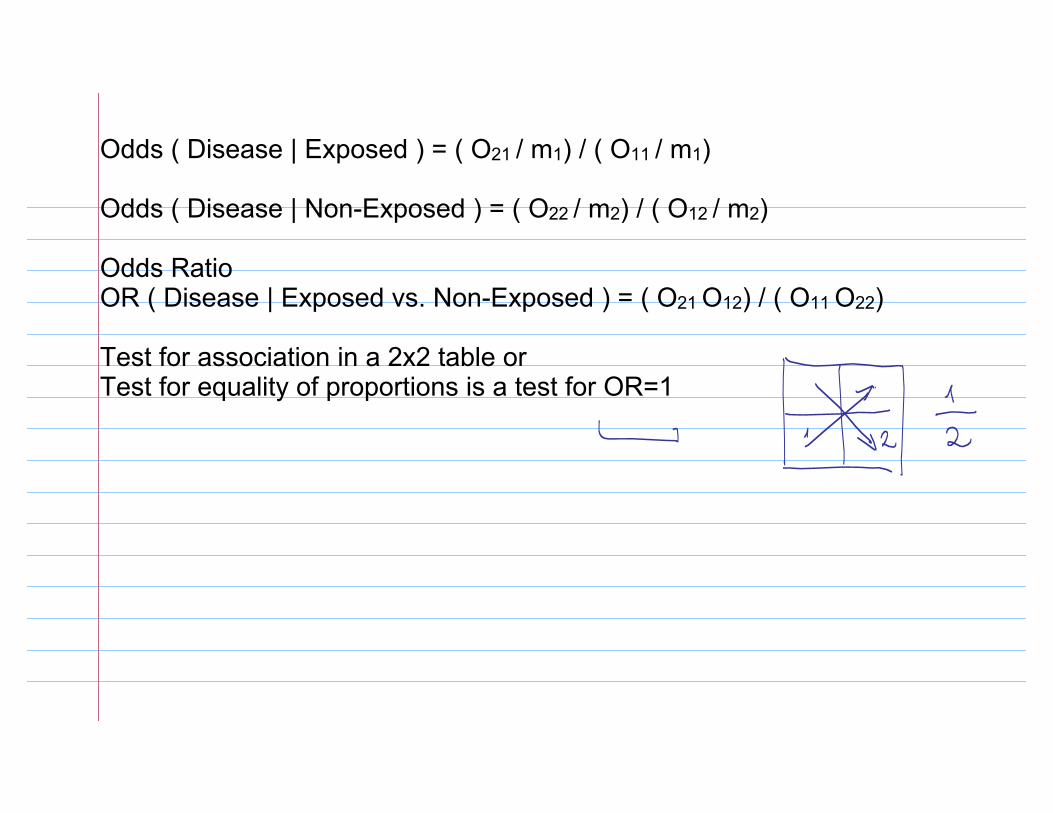
Odds ( Disease | Exposed ) = ( O21 / m1) / ( O11 / m1)
Odds ( Disease | Non-Exposed ) = ( O22 / m2) / ( O12 / m2)
Odds RatioOR ( Disease | Exposed vs. Non-Exposed ) = ( O21 O12) / ( O11 O22)
Test for association in a 2x2 table orTest for equality of proportions is a test for OR=1
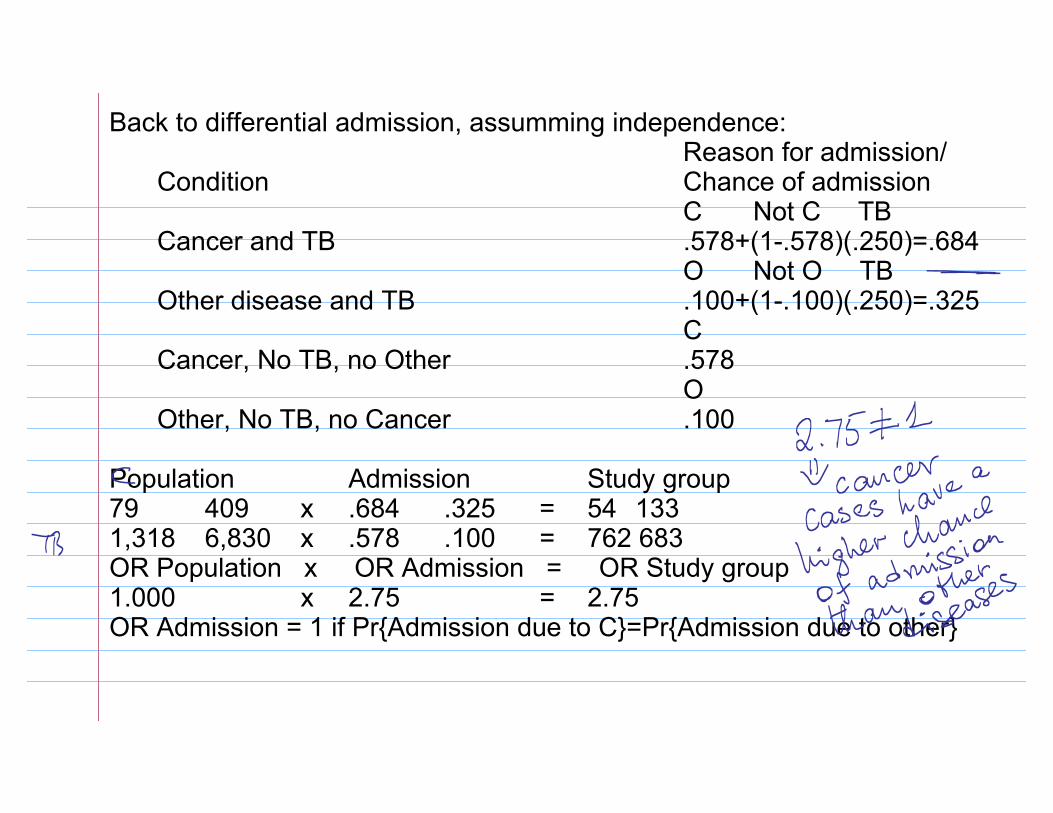
Back to differential admission, assumming independence:Reason for admission/
Condition Chance of admissionC Not C TB
Cancer and TB .578+(1-.578)(.250)=.684O Not O TB
Other disease and TB .100+(1-.100)(.250)=.325C
Cancer, No TB, no Other .578O
Other, No TB, no Cancer .100
Population Admission Study group79 409 x .684 .325 = 54 1331,318 6,830 x .578 .100 = 762 683OR Population x OR Admission = OR Study group1.000 x 2.75 = 2.75OR Admission = 1 if Pr{Admission due to C}=Pr{Admission due to other}
![Exploring Categorical Structuralismcase.edu/artsci/phil/PMExploring.pdfExploring Categorical Structuralism COLIN MCLARTY* Hellman [2003] raises interesting challenges to categorical](https://img.pdfslide.net/doc/110x75/5b04a7507f8b9a4e538e151c/exploring-categorical-categorical-structuralism-colin-mclarty-hellman-2003-raises.jpg)