Embed Size (px)
Citation preview

Tet period: 4 weeks before the first day of
Lunar New Year (4 w/e 2018/2/18)
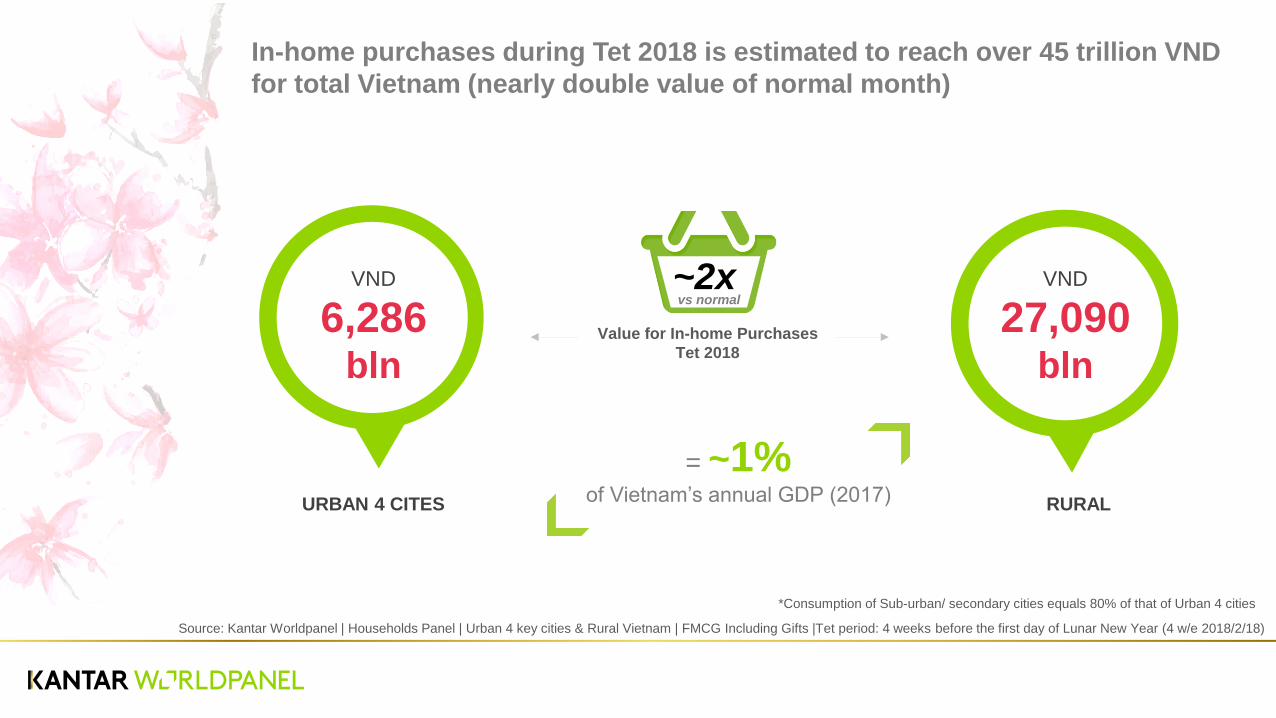
VND
6,286 bln
VND
27,090 bln
vs normal ~2x
Source: Kantar Worldpanel | Households Panel | Urban 4 key cities & Rural Vietnam | FMCG Including Gifts |Tet period: 4 weeks before the first day of Lunar New Year (4 w/e 2018/2/18)
URBAN 4 CITES RURAL
Value for In-home Purchases
Tet 2018
In-home purchases during Tet 2018 is estimated to reach over 45 trillion VND
for total Vietnam (nearly double value of normal month)
*Consumption of Sub-urban/ secondary cities equals 80% of that of Urban 4 cities
$USD
278m $USD
1,198m
= ~1% of Vietnam’s annual GDP (2017)
3.16cm
4.75cm
6.34cm
7.93cm
9.52cm
11.11cm
12.70cm
14.29cm
15.87cm
17.00cm
1.00cm 3.70cm 6.40cm 9.10cm 11.80cm 14.50cm 17.20cm 9.90cm 22.60cm 25.30cm 27.99cm 30.69cm 32.85cm 30.16cm 27.46cm 24.76cm 22.07cm 19.37cm 16.67cm 13.98cm 11.28cm 8.59cm 5.89cm 3.19cm
Content Bottom
Content Top
Heading Baseline
Left Margin Right Margin
3
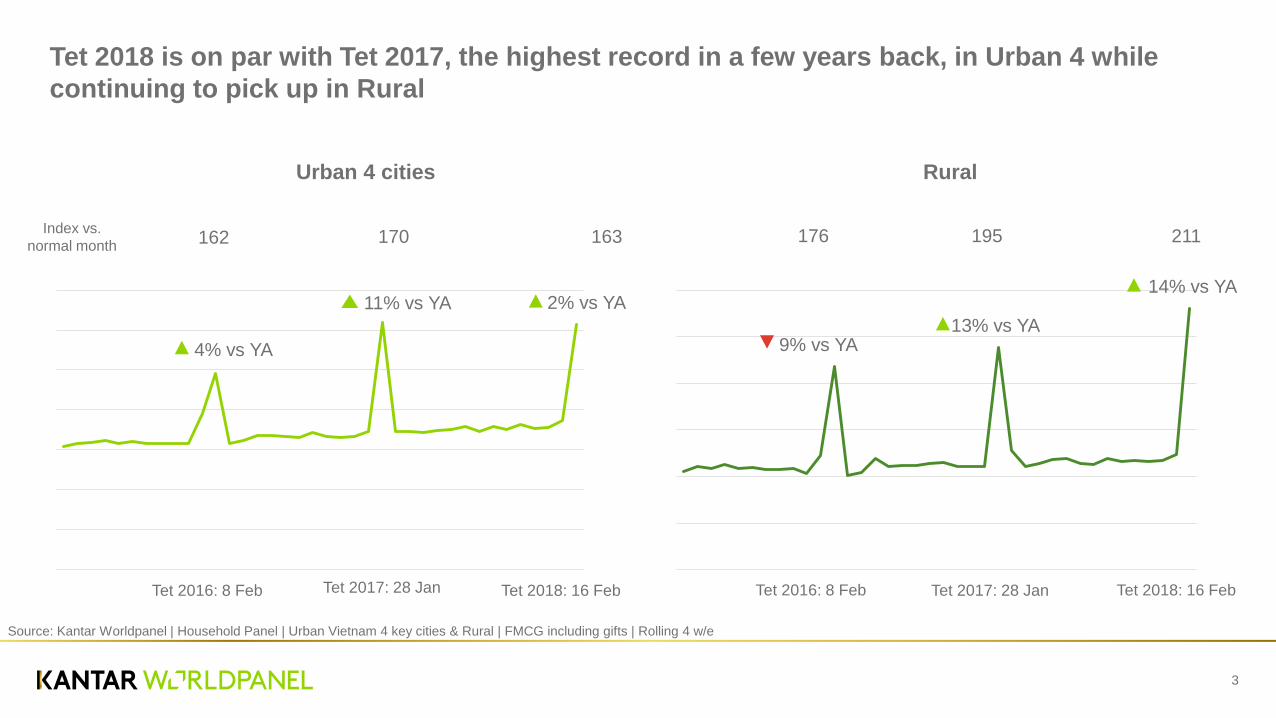
Tet 2018 is on par with Tet 2017, the highest record in a few years back, in Urban 4 while
continuing to pick up in Rural
Source: Kantar Worldpanel | Household Panel | Urban Vietnam 4 key cities & Rural | FMCG including gifts | Rolling 4 w/e
Tet 2016: 8 Feb Tet 2017: 28 Jan Tet 2018: 16 Feb Tet 2016: 8 Feb Tet 2017: 28 Jan Tet 2018: 16 Feb
Urban 4 cities Rural
4% vs YA
11% vs YA
2% vs YA
13% vs YA
14% vs YA
9% vs YA
162
170
163
176
195
211
Index vs.
normal month
4
# cate overtime
#Upsizing
Tet 2013 Tet 2014 Tet 2015 Tet 2016 Tet 2017 Tet 2018
15.0 14.8 14.3 14.6 14.6 13.5
Urban Rural
Tet 2013 Tet 2014 Tet 2015 Tet 2016 Tet 2017 Tet 2018
12.447 13.072 13.172 13.099 12.902 12.507
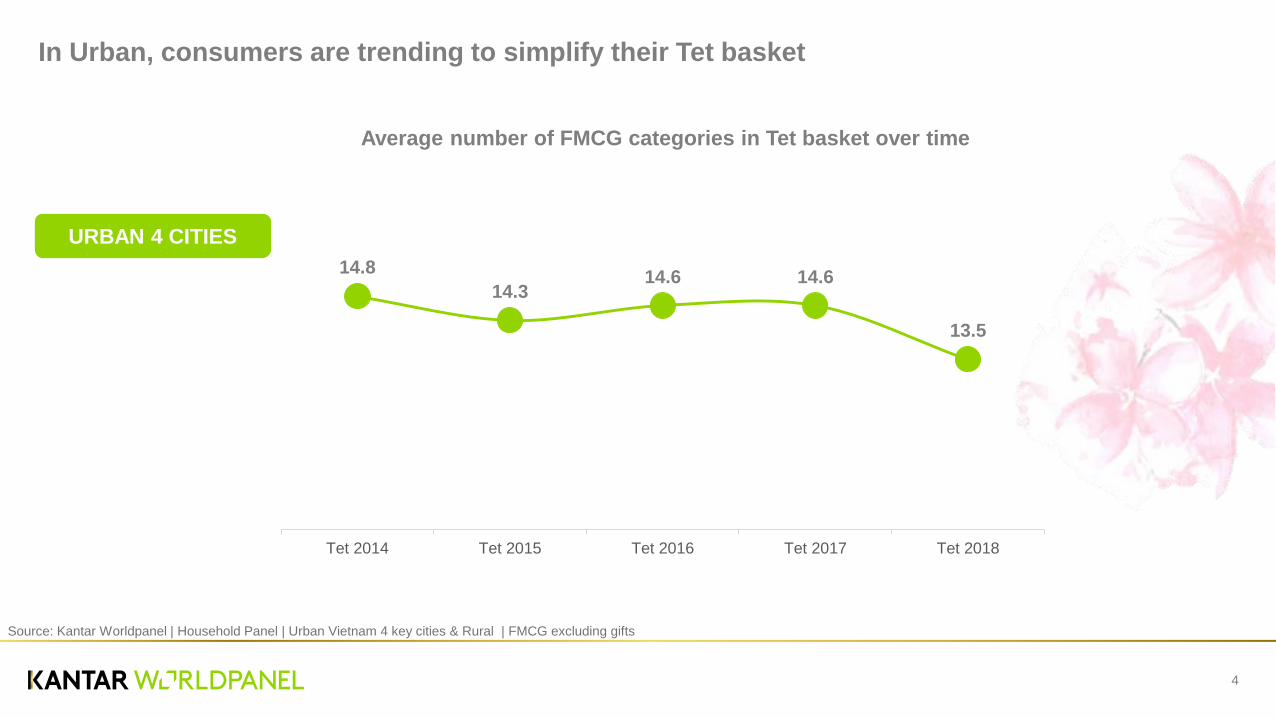
Source: Kantar Worldpanel | Household Panel | Urban Vietnam 4 key cities & Rural | FMCG excluding gifts
In Urban, consumers are trending to simplify their Tet basket
14.8
14.3 14.6 14.6
13.5
Tet 2014 Tet 2015 Tet 2016 Tet 2017 Tet 2018
Average number of FMCG categories in Tet basket over time
Upsize 43.60
Stable 20.35
Downsize 36.05
URBAN 4 CITIES
5
TRAVEL REAL
ESTATE
AUTO
SALES
ELECTRONICS
SALES
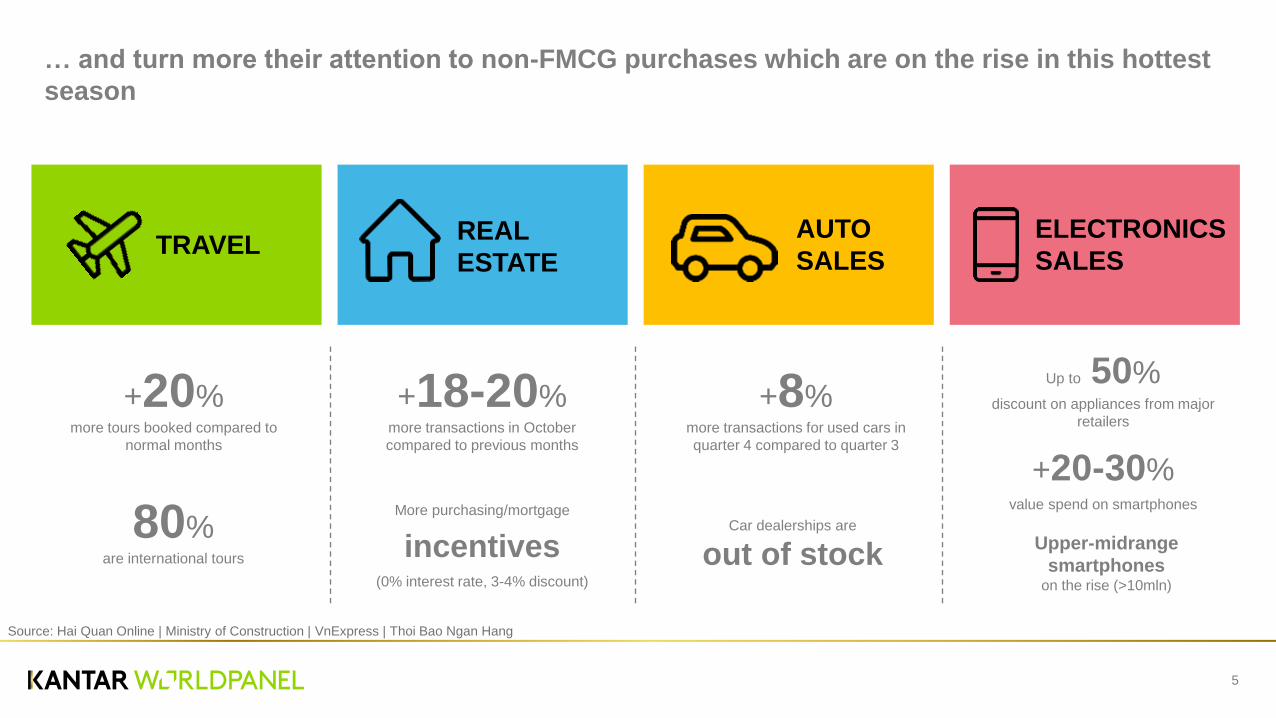
+20%
Source: Hai Quan Online | Ministry of Construction | VnExpress | Thoi Bao Ngan Hang
more tours booked compared to
normal months
80% are international tours
+8% more transactions for used cars in
quarter 4 compared to quarter 3
+18-20% more transactions in October
compared to previous months
More purchasing/mortgage incentives
(0% interest rate, 3-4% discount)
Car dealerships are
out of stock
Up to 50% discount on appliances from major
retailers
value spend on smartphones
+20-30%
Upper-midrange
smartphones on the rise (>10mln)
… and turn more their attention to non-FMCG purchases which are on the rise in this hottest
season
6
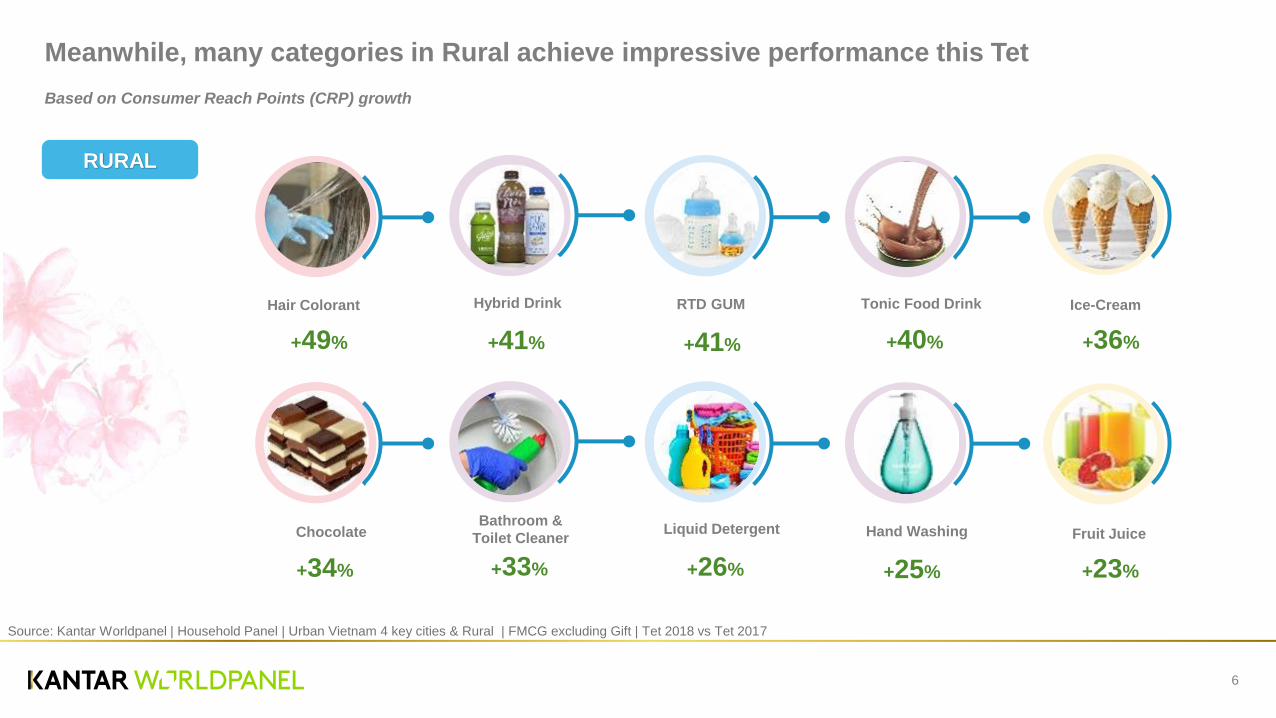
Meanwhile, many categories in Rural achieve impressive performance this Tet
RURAL
Source: Kantar Worldpanel | Household Panel | Urban Vietnam 4 key cities & Rural | FMCG excluding Gift | Tet 2018 vs Tet 2017
Based on Consumer Reach Points (CRP) growth
Hair Colorant Tonic Food Drink Hybrid Drink RTD GUM
+49% +40% +41% +41%
Ice-Cream
Chocolate Bathroom &
Toilet Cleaner Liquid Detergent
+36%
+34% +33% +26%
Hand Washing
+25%
Fruit Juice
+23%
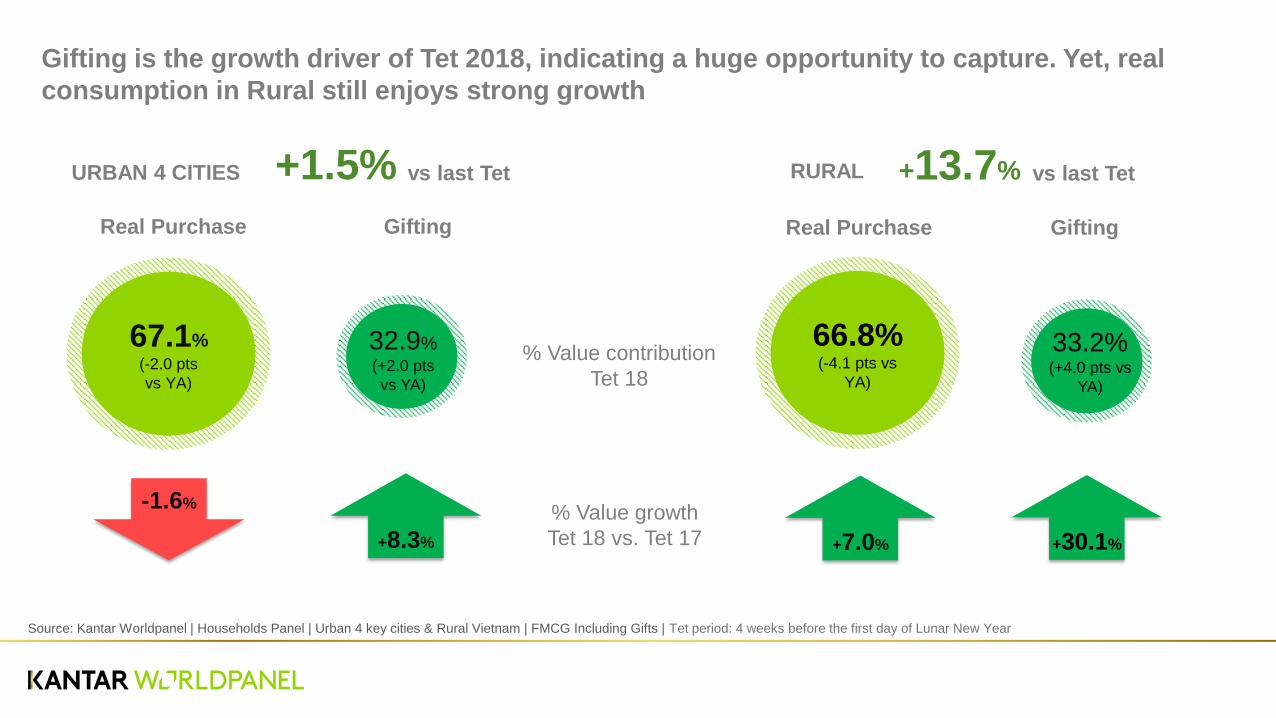
67.1%
(-2.0 pts
vs YA)
+8.3%
Gifting is the growth driver of Tet 2018, indicating a huge opportunity to capture. Yet, real
consumption in Rural still enjoys strong growth
% Value growth
Tet 18 vs. Tet 17
URBAN 4 CITIES RURAL vs last Tet
32.9% (+2.0 pts
vs YA)
66.8% (-4.1 pts vs
YA)
+30.1%
Gifting
33.2% (+4.0 pts vs
YA)
% Value contribution
Tet 18
-1.6%
Source: Kantar Worldpanel | Households Panel | Urban 4 key cities & Rural Vietnam | FMCG Including Gifts | Tet period: 4 weeks before the first day of Lunar New Year
+7.0%
Real Purchase Real Purchase
+13.7% +1.5%
Gifting
vs last Tet
8
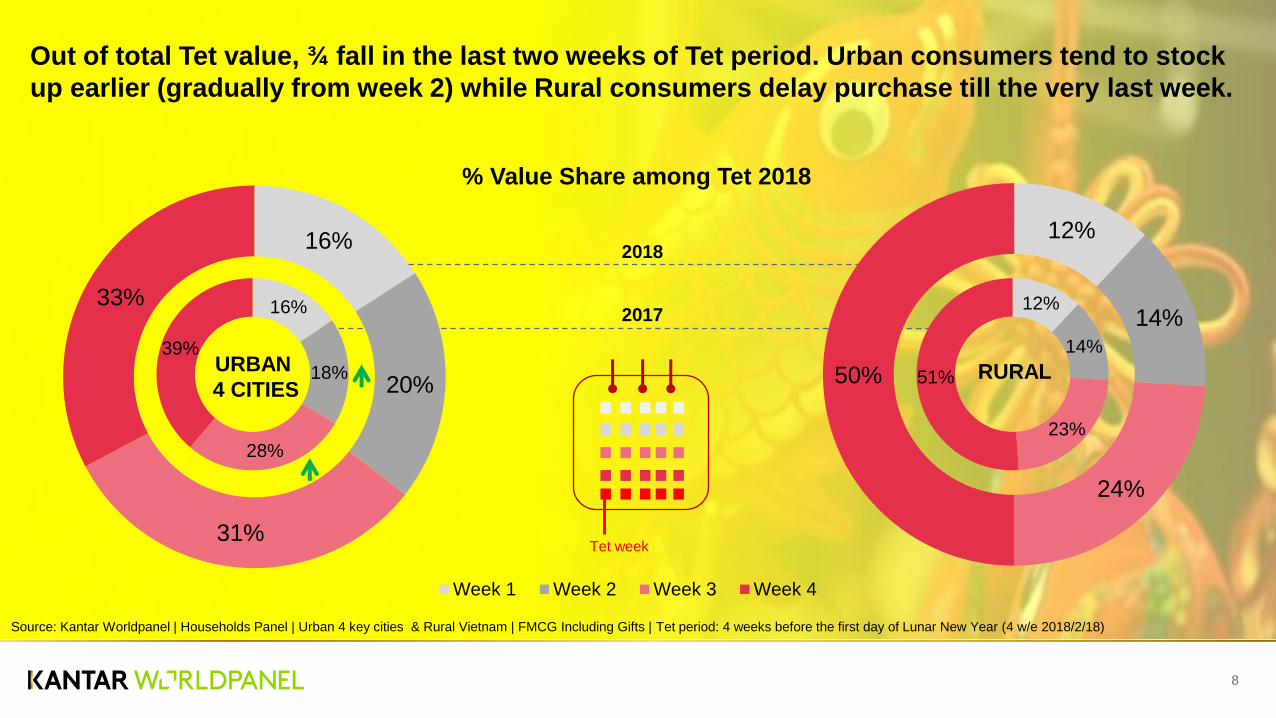
Out of total Tet value, ¾ fall in the last two weeks of Tet period. Urban consumers tend to stock
up earlier (gradually from week 2) while Rural consumers delay purchase till the very last week.
16%
20%
31%
33%
Week 1 Week 2 Week 3 Week 4
16%
18%
28%
39%
Tet week
% Value Share among Tet 2018
URBAN
4 CITIES
2018
2017
12%
14%
24%
50%
12%
14%
23%
51% RURAL
Source: Kantar Worldpanel | Households Panel | Urban 4 key cities & Rural Vietnam | FMCG Including Gifts | Tet period: 4 weeks before the first day of Lunar New Year (4 w/e 2018/2/18)
11
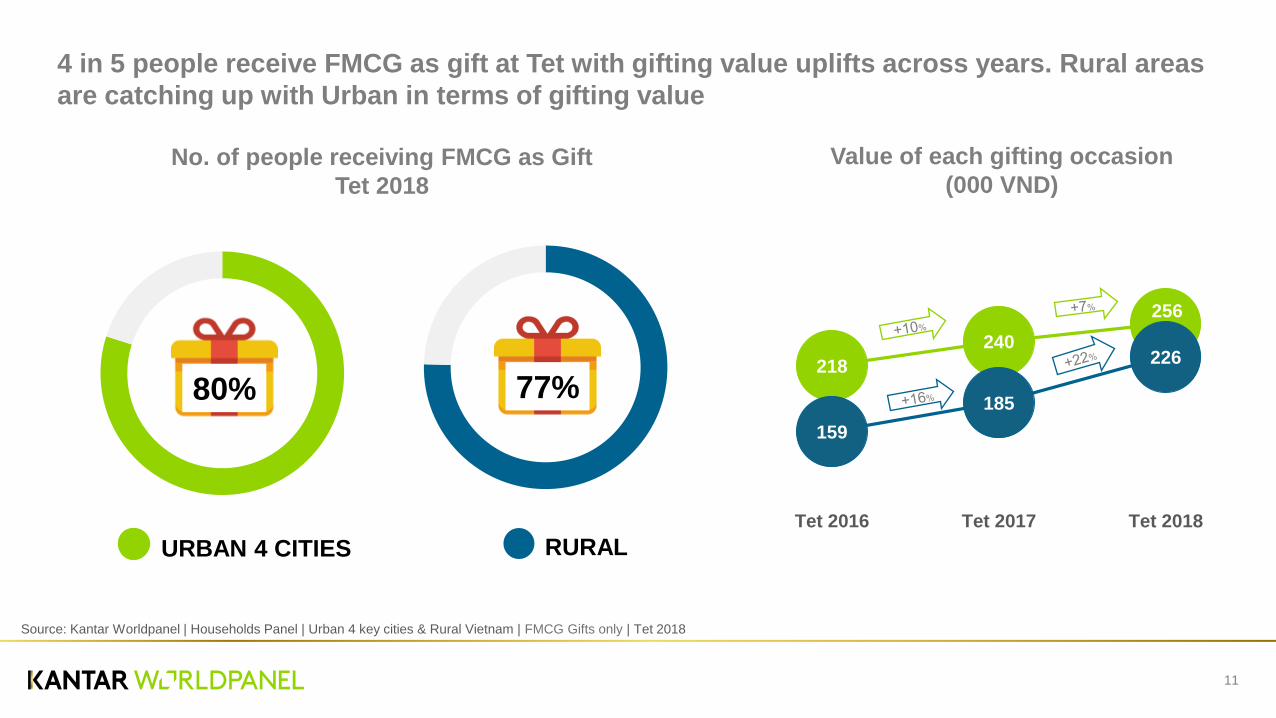
218
240
256
159
185
226
Tet 2016 Tet 2017 Tet 2018
Value of each gifting occasion
(000 VND)
4 in 5 people receive FMCG as gift at Tet with gifting value uplifts across years. Rural areas
are catching up with Urban in terms of gifting value
No. of people receiving FMCG as Gift
Tet 2018
URBAN 4 CITIES RURAL
80% 77%
Source: Kantar Worldpanel | Households Panel | Urban 4 key cities & Rural Vietnam | FMCG Gifts only | Tet 2018
3.16cm
4.75cm
6.34cm
7.93cm
9.52cm
11.11cm
12.70cm
14.29cm
15.87cm
17.00cm
1.00cm 3.70cm 6.40cm 9.10cm 11.80cm 14.50cm 17.20cm 9.90cm 22.60cm 25.30cm 27.99cm 30.69cm 32.85cm 30.16cm 27.46cm 24.76cm 22.07cm 19.37cm 16.67cm 13.98cm 11.28cm 8.59cm 5.89cm 3.19cm
Content Bottom
Content Top
Heading Baseline
Left Margin Right Margin
12
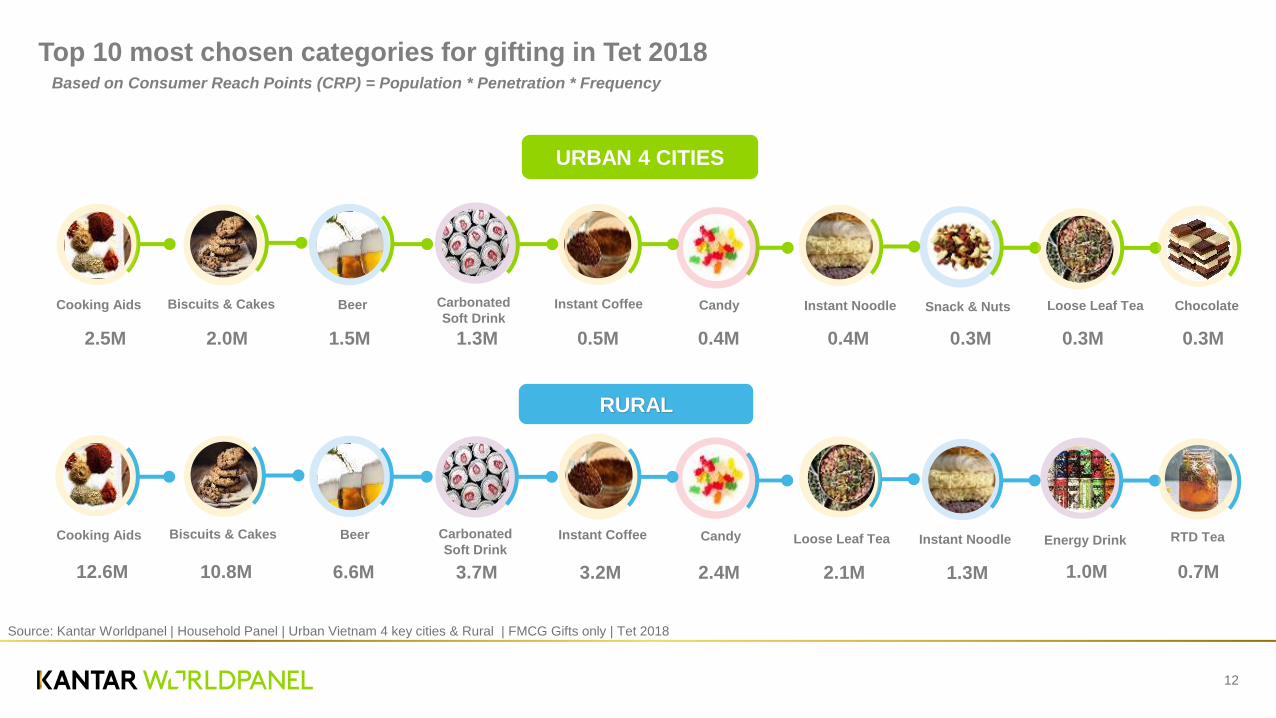
Top 10 most chosen categories for gifting in Tet 2018
URBAN 4 CITIES
2.0M
1.5M
2.5M
1.3M
0.5M
0.4M
0.4M
0.3M
0.3M
0.3M
Biscuits & Cakes Carbonated
Soft Drink Instant Coffee Instant Noodle Snack & Nuts Loose Leaf Tea Chocolate Candy
12.6M
10.8M
6.6M
3.7M
3.2M
2.4M
2.1M
1.3M
1.0M
0.7M
Beer Carbonated
Soft Drink Instant Coffee Instant Noodle Energy Drink RTD Tea Candy
RURAL
Source: Kantar Worldpanel | Household Panel | Urban Vietnam 4 key cities & Rural | FMCG Gifts only | Tet 2018
Biscuits & Cakes Cooking Aids Loose Leaf Tea
Cooking Aids Beer
Based on Consumer Reach Points (CRP) = Population * Penetration * Frequency
3.16cm
4.75cm
6.34cm
7.93cm
9.52cm
11.11cm
12.70cm
14.29cm
15.87cm
17.00cm
1.00cm 3.70cm 6.40cm 9.10cm 11.80cm 14.50cm 17.20cm 9.90cm 22.60cm 25.30cm 27.99cm 30.69cm 32.85cm 30.16cm 27.46cm 24.76cm 22.07cm 19.37cm 16.67cm 13.98cm 11.28cm 8.59cm 5.89cm 3.19cm
Content Bottom
Content Top
Heading Baseline
Left Margin Right Margin
13
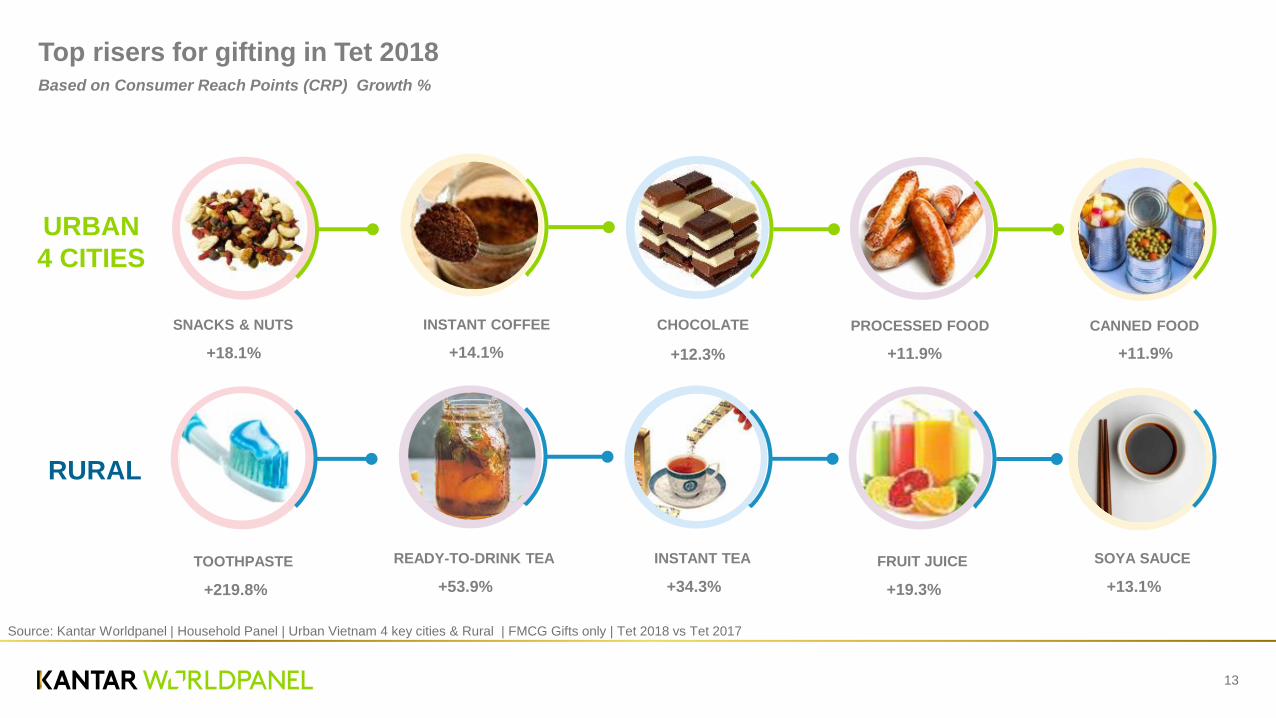
SNACKS & NUTS INSTANT COFFEE CHOCOLATE PROCESSED FOOD CANNED FOOD
TOOTHPASTE READY-TO-DRINK TEA
Based on Consumer Reach Points (CRP) Growth %
Source: Kantar Worldpanel | Household Panel | Urban Vietnam 4 key cities & Rural | FMCG Gifts only | Tet 2018 vs Tet 2017
URBAN
4 CITIES
RURAL
+18.1%
+14.1%
+12.3%
+11.9%
+11.9%
+219.8%
+53.9%
Top risers for gifting in Tet 2018
INSTANT TEA
+34.3%
FRUIT JUICE
+19.3%
SOYA SAUCE
+13.1%
16
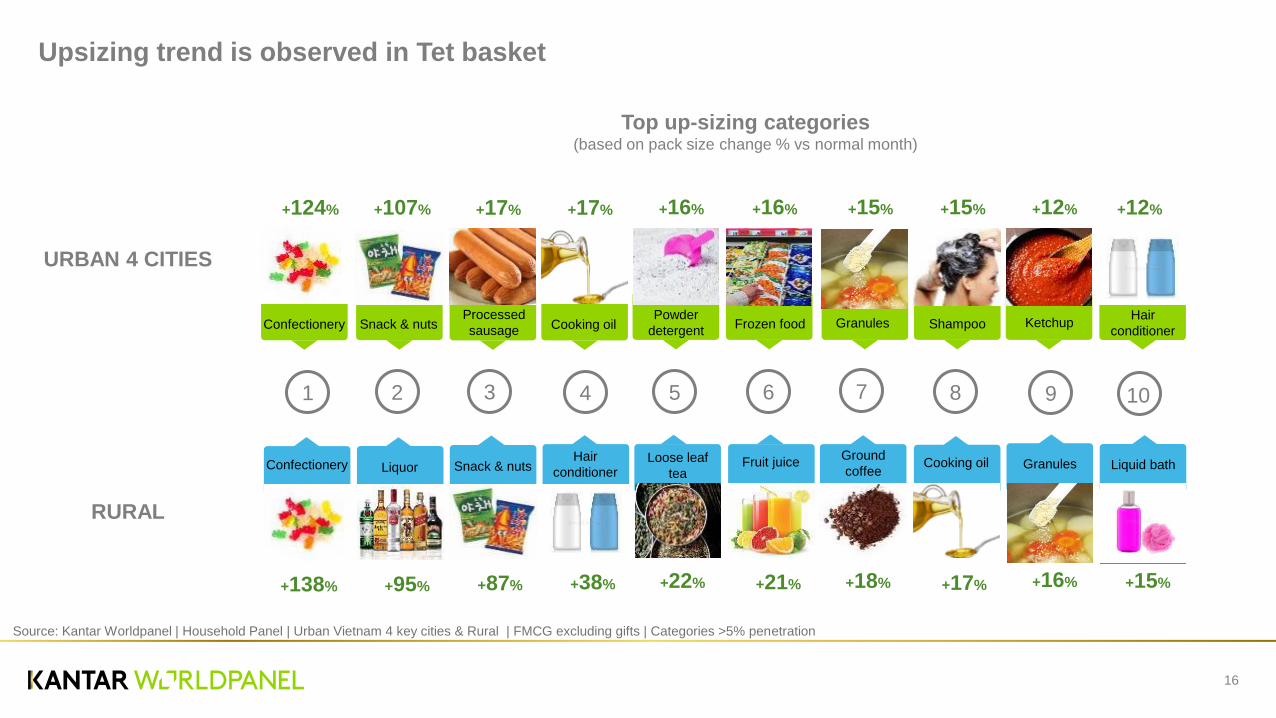
Source: Kantar Worldpanel | Household Panel | Urban Vietnam 4 key cities & Rural | FMCG excluding gifts | Categories >5% penetration
Upsizing trend is observed in Tet basket
Confectionery Snack & nuts Processed
sausage Cooking oil Powder
detergent Frozen food Granules Shampoo Ketchup
Top up-sizing categories (based on pack size change % vs normal month)
Liquor Hair
conditioner Loose leaf
tea Fruit juice
Ground
coffee Granules Confectionery Snack & nuts Cooking oil
1 2 3 4 5 6 7 8 9 10
URBAN 4 CITIES
RURAL
+124% +107% +17% +17% +16% +16% +15% +15% +12%
+95% +38% +22% +21% +18% +16% +138% +87% +17%
Hair
conditioner
+12%
Liquid bath
+15%
Handwashing Carbonated
soft drink
Powder tonic
food drink
Loose leaf
tea Fish sauce Table napkin Instant coffee
Hair
conditioner Beer
Facial
moisturizer
17
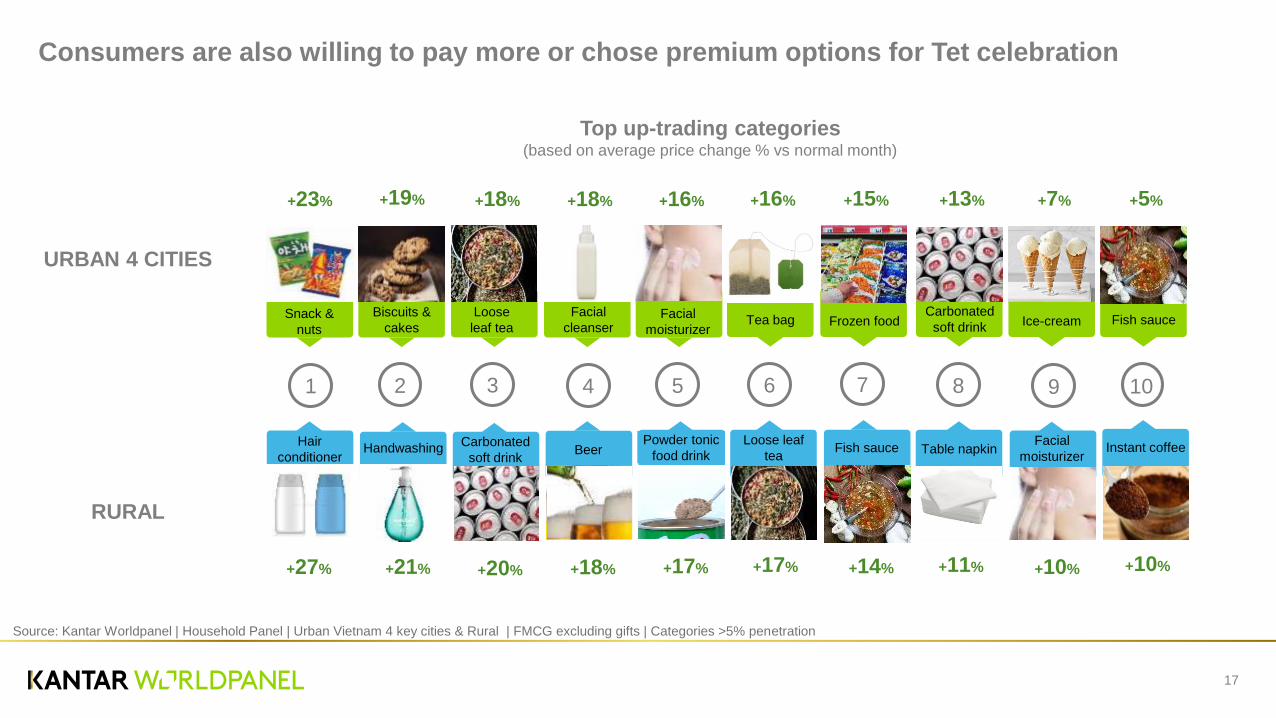
Source: Kantar Worldpanel | Household Panel | Urban Vietnam 4 key cities & Rural | FMCG excluding gifts | Categories >5% penetration
Consumers are also willing to pay more or chose premium options for Tet celebration
Loose
leaf tea Snack &
nuts
Facial
cleanser Facial
moisturizer Tea bag Frozen food
Carbonated
soft drink Ice-cream Fish sauce
Top up-trading categories (based on average price change % vs normal month)
Biscuits &
cakes
1 2 3 4 5 6 7 8 9 10
URBAN 4 CITIES
RURAL
+18% +23% +18% +16% +16% +15% +13% +7% +5% +19%
+21% +20% +17% +17% +14% +11% +10% +27% +18% +10%
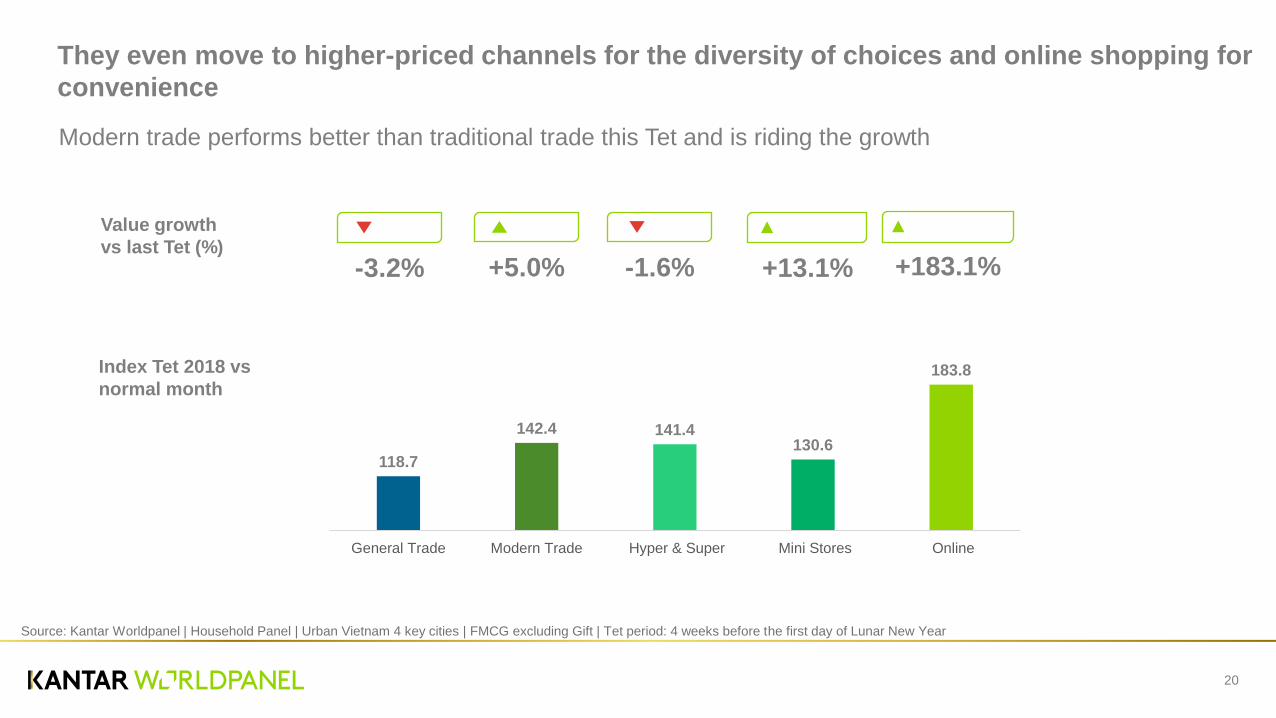
20
Index Tet 2018 vs
normal month
-3.2%
-1.6%
+5.0%
+13.1%
+183.1%
Value growth
vs last Tet (%)
Source: Kantar Worldpanel | Household Panel | Urban Vietnam 4 key cities | FMCG excluding Gift | Tet period: 4 weeks before the first day of Lunar New Year
They even move to higher-priced channels for the diversity of choices and online shopping for
convenience
Modern trade performs better than traditional trade this Tet and is riding the growth
118.7
142.4 141.4 130.6
183.8
General Trade Modern Trade Hyper & Super Mini Stores Online
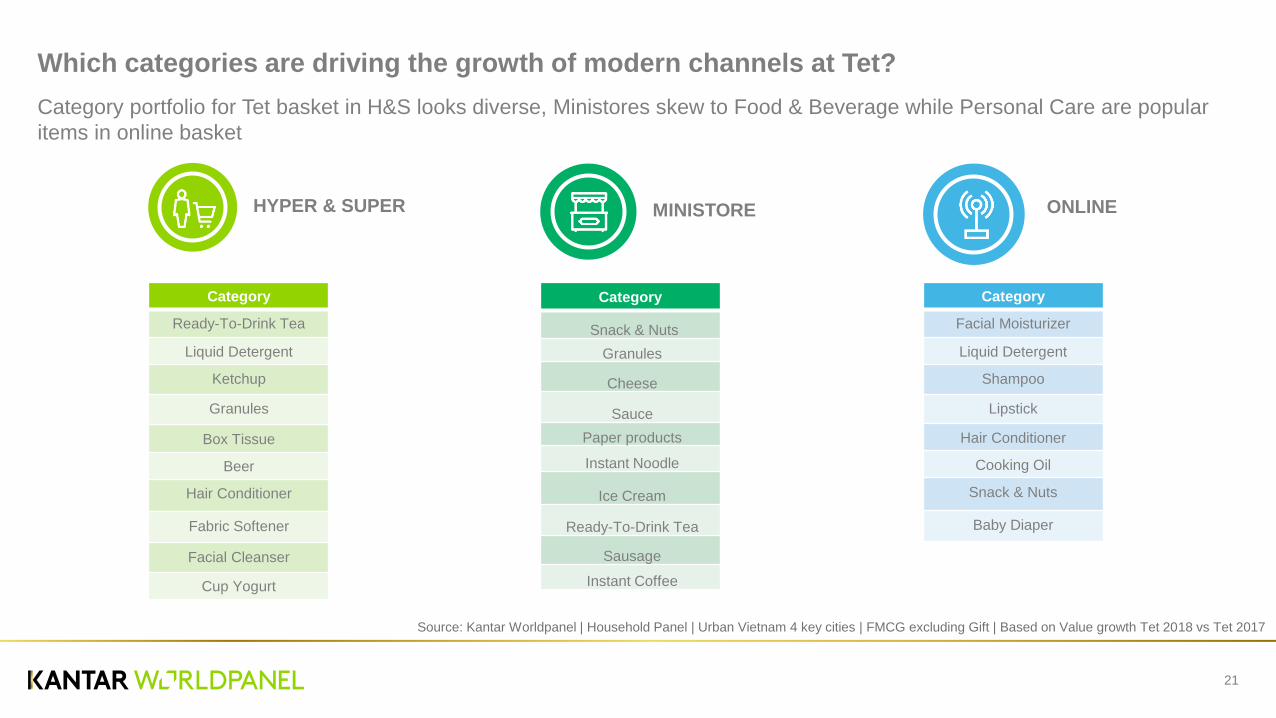
Which categories are driving the growth of modern channels at Tet?
Category portfolio for Tet basket in H&S looks diverse, Ministores skew to Food & Beverage while Personal Care are popular
items in online basket
21
HYPER & SUPER MINISTORE ONLINE
Category
Ready-To-Drink Tea
Liquid Detergent
Ketchup
Granules
Box Tissue
Beer
Hair Conditioner
Fabric Softener
Facial Cleanser
Cup Yogurt
Category
Snack & Nuts
Granules
Cheese
Sauce
Paper products
Instant Noodle
Ice Cream
Ready-To-Drink Tea
Sausage
Instant Coffee
Category
Facial Moisturizer
Liquid Detergent
Shampoo
Lipstick
Hair Conditioner
Cooking Oil
Snack & Nuts
Baby Diaper
Source: Kantar Worldpanel | Household Panel | Urban Vietnam 4 key cities | FMCG excluding Gift | Based on Value growth Tet 2018 vs Tet 2017
23
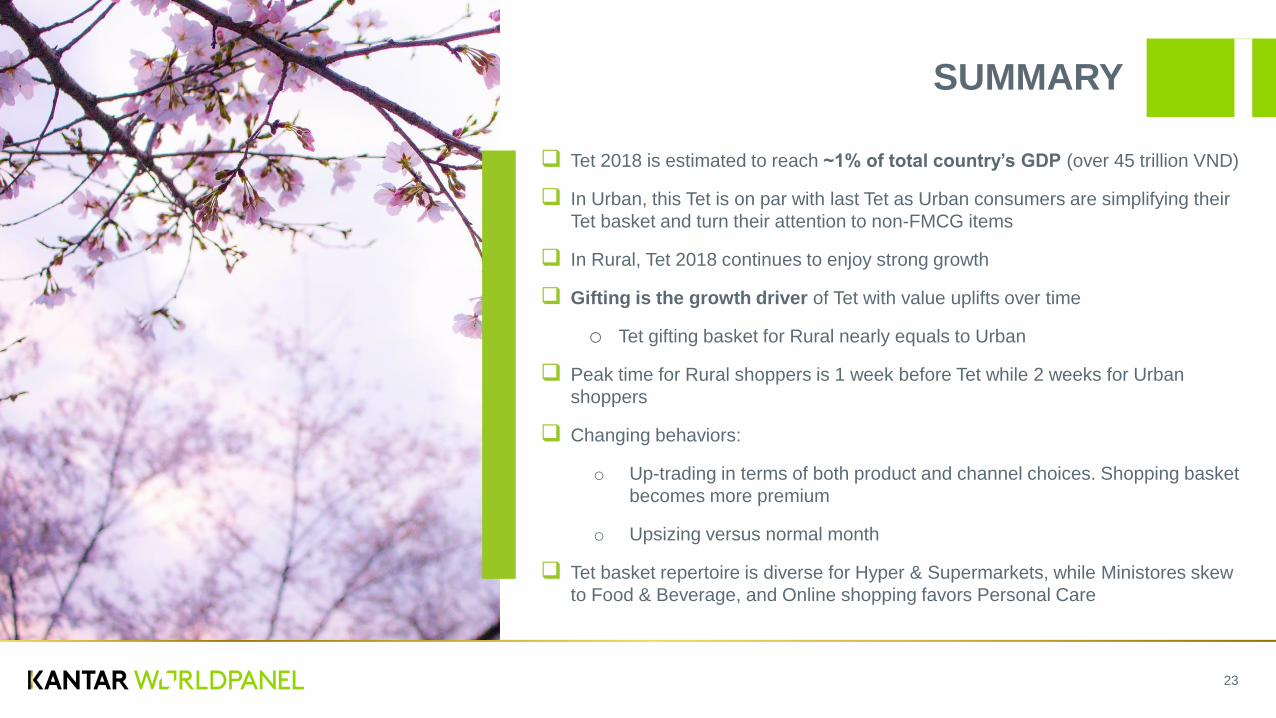
SUMMARY
Tet 2018 is estimated to reach ~1% of total country’s GDP (over 45 trillion VND)
In Urban, this Tet is on par with last Tet as Urban consumers are simplifying their
Tet basket and turn their attention to non-FMCG items
In Rural, Tet 2018 continues to enjoy strong growth
Gifting is the growth driver of Tet with value uplifts over time
o Tet gifting basket for Rural nearly equals to Urban
Peak time for Rural shoppers is 1 week before Tet while 2 weeks for Urban
shoppers
Changing behaviors:
o Up-trading in terms of both product and channel choices. Shopping basket
becomes more premium
o Upsizing versus normal month
Tet basket repertoire is diverse for Hyper & Supermarkets, while Ministores skew
to Food & Beverage, and Online shopping favors Personal Care

Kantar Worldpanel is the global expert in shoppers’ behavior.
Through continuous monitoring, advanced analytics and tailored
solutions, Kantar Worldpanel inspires successful decisions by brand
owners, retailers, market analysts and government organizations
globally.
With over 60 years’ experience, a team of 3,500, and services
covering 60 countries directly or through partners, Kantar Worldpanel
turns purchase behavior into competitive advantage in markets as
diverse as FMCG, impulse products, fashion, baby,
telecommunications and entertainment, among many others.
For further information, please visit us at
www.kantarworldpanel.com.vn
Contact us
Nguyen Thi Nhu Ngoc
Associate Marketing Manager
Email: [email protected]
Tel: +84 8 39306631 | Fax: +84 8 39306632 | Mob: +84 (0)988 445
401
Kantar Worldpanel Vietnam | 58 Vo Van Tan St., Dist. 3, Ho Chi Minh
City, Vietnam
About Kantar Worldpanel


![[ TET Presentation ]](https://img.pdfslide.net/doc/110x75/557e7486d8b42a4d108b47f0/-tet-presentation-.jpg)