Embed Size (px)
Citation preview

Texas A&M University-Corpus Christi
Division of Research, Commercialization & Outreach Presentation: Alpine-Casparis Municipal Advisory Board
June 19, 2013 1/7
Texas A&M University-Corpus Christi Division of Research, Commercialization & Outreach Office of Research Development Presentation:
The Lone Star Unmanned Aircraft Systems Center of Excellence & Innovation To: Alpine-Casparis Municipal Airport Advisory Board Date: June 19, 2013 We appreciate this opportunity to appear before the advisory board of the Alpine-Casparis Municipal Airport. My name is Ron George. I am senior research development officer at Texas A&M University-Corpus Christi. I am accompanied by Luis Cifuentes, Vice President for Research, Commercialization & Outreach at TAMUCC and Matt Nelson with Camber Corporation, a private-sector company that ably assisted the university and its statewide team with its proposal to the Federal Aviation Administration’s unmanned aircraft systems test-site program.
The U.S. Congress mandated in February 2012 that FAA develop a system of test sites for unmanned aircraft systems, or UAS. The legislation requires that six test sites be designated across the United States and that they be sufficiently diverse as to climate and topography to provide FAA with research and test data sufficient for the development of policies, procedures, rules and regulations that will enable integration of UAS into the national airspace.
For your convenience, I have attached a copy of the federal legislation to this presentation as Attachment 1.
Congress enacted this law because FAA seemed to be slow in addressing market demand. UAS operations are not permitted in our national airspace, except for limited purposes in highly restricted airspace and only by public entities. UAS may not be used for commercial purposes. FAA does permit UAS flights at altitudes up to 400 feet by hobbyists for non-commercial purposes; provided, that such operations do not interfere with general or commercial aviation.
UAS market demand has been building for a variety of reasons, but perhaps the most significant is the winding down of military operations in Iraq and Afghanistan, where UAS have played a significant role. UAS technologies developed over the past decade have applications and market value far beyond their military applications. Private-sector companies worldwide are eager to develop and sell these products, especially in the United States, where UAS technological development is far advanced. Entrepreneurs across the nation have been creating airframes and payloads of every conceivable size and industrial application. Some domestic government agencies already have put these technologies to use, most notably in border security but also in monitoring wildfires and for search and rescue operations in Alaska.
FAA, however, has taken a cautious approach to UAS integration, which is typical of this risk-averse agency. Safety is its primary and fundamental concern and mission. With literally tens of thousands of UAS vehicles poised to take flight, FAA wants to be sure that technological and airspace-management solutions are in place that will keep people and property safe in the air and on the ground. These agency concerns are immediately apparent in FAA’s solicitation for test-site contract proposals released in February of this year. We have attached the solicitation to this presentation as Attachment 2, but here is a quick summary of FAA requirements.
Texas A&M University-Corpus Christi
Division of Research, Commercialization & Outreach Presentation: Alpine-Casparis Municipal Advisory Board
June 19, 2013 2/7
• Our test-site team is required to have at least five years within the past seven years of aviation research and development experience.
• Our team is required to have at least one year of UAS experience within the past five years.
• Our proposed test ranges must not include Class B airspace, where major airport operations occur.
• Proposed UAS test ranges must have launch and recovery sites within them. • Our proposed test ranges “must be sufficient for FAA safety and efficiency
determinations to protect persons and property on the ground.” • Our proposed UAS test ranges must be feasible; viz., FAA must believe that we’re
capable of managing the test ranges we propose.
And that, as they say, is only the beginning.
• Our team must show that its research goals, objectives and capacities align with FAA R&D objectives, which are as follows:
o UAS system safety and data gathering; o aircraft certification; o command and control link issues; o control station layout and certification; o ground and airborne sense and avoid research; o environmental impacts associated with UAS operations in the national airspace.
• Our team must show that our research capacities support FAA’s overarching goal: “Safely integrating UAS into the NAS.”
• Our team must show that it possesses or has access to sufficient aviation infrastructure to conduct ground and flight operations that will enable FAA to reach its R&D objectives.
• Our team must show that it has in place airspace-management and safety plans, standard operating procedures and command and control facilities capable of providing FAA the data it needs for rule-making while – and this is of critical importance – ensuring safety on the ground and in the air.
FAA requirements for the test-site program are extremely detailed and rigorous, as you can see from the attached solicitation (DTFACT-13-R-00002). Now, for a surprise: This contract is not funded, at least not for the current fiscal year and perhaps not for the next. It’s likely that the agency is using this lack of funding as a discriminator, so that only seriously capable applicants will apply; those willing – without federal financial support – to take on the mission and its financial burdens; which, by the way, includes considerable resources even to apply for the test-site program.
Well, it may have been a discriminator but not much of one, because 50 teams from 37 states, including Texas, have submitted proposals to this program. The more competitive teams have invested millions of dollars in cash, time and effort developing their proposals. Pre-submission competition was intense as teams across the country sought to improve their chances by soliciting the best and brightest UAS researchers and most knowledgeable consultants and subject-matter experts. Consultants for this competition have had a field day, but no one is begrudging them a cent, because we’re all looking upon our expenditures as an investment in future economic development.
Early in the spring, the Association for Unmanned Vehicle Systems International (AUVSI) released an economic-impact study projecting how the UAS industry would develop once these
Texas A&M University-Corpus Christi
Division of Research, Commercialization & Outreach Presentation: Alpine-Casparis Municipal Advisory Board
June 19, 2013 3/7
aircraft are integrated into the national airspace. The results are astounding, not only for the United States generally but also for Texas. We have attached the AUVSI study to this presentation as Attachment 3, but here’s a summary.
• Nationally: 2015-2018 o $13.6 billion total economic impact o 34,000 manufacturing jobs o 70,000 indirect and induced jobs
• Nationally: 2019-2025 o $82.1 billion cumulative economic impact o 103,776 total job creation
• Tax revenue to states, 2015-2025: $482 million • Loss due to UAS integration delay: $10 billion annually • Texas:
o Direct annual spending by 2025: $426.16 million o Annual economic impact (2025): $802 million o Direct employment (2025): 4,247 o Total employment impact (2025): 8,256 o 2015-2018:
Direct employment: 958 => 3,018 Total employment: 1,863 => 5,867 Total direct spending: $96 million => $302.87 million Total economic impact: $181 million => $570 million
It is clear from the AUVSI study and the highly competitive field for this unfunded FAA contract that the test sites are viewed as magnets for UAS industrial growth. That’s how we see it, and that’s why Texas has committed significant time, effort and financial resources to proposal development.
To be honest, Texas has been playing a come-from-behind game since the spring of 2012. The state had not geared up as others had in advance of this FAA proposal competition. TAMUCC has been operating UAS for research purposes in authorized airspace over Padre Island since 2011, but it wasn’t until one of our scientists was contacted unofficially by an FAA employee that we seriously considered submitting a proposal. Quite frankly, we had no idea what we were getting into, but once we took the bait, we were hooked, and we’ve been bearing down on this project ever since.
Thing is, Texas airspace is pure gold for this program. TAMUCC’s authorized airspace comprises 450 square miles over South Texas ranchland, the Intracoastal Waterway, Padre Island National Seashore and the Gulf of Mexico. FAA has renewed our certificate of authorization (COA) because we’ve operated safely and in strict compliance with FAA regulations. In short, we’ve done no harm with our aircraft, and we’ve contributed to scientific knowledge with our research.
TAMUCC’s COA is not the only golden airspace in Texas for UAS research, development and testing. We have been all over the country in pursuit of this contract – private meetings, industry conventions, scientific conferences – and we’ve heard from many experts that Texas is ideal because of our weather, diverse climate and topography and relatively uncluttered airspace.

Texas A&M University-Corpus Christi
Division of Research, Commercialization & Outreach Presentation: Alpine-Casparis Municipal Advisory Board
June 19, 2013 4/7
Our aircraft at TAMUCC is a relatively small American Aerospace RS-16 – wingspan 13 feet, weight 85 pounds, payload 25 pounds, ceiling, 15,000 feet – modified by our private-sector partner for research, which has generated a great deal of interest in the oil and gas industry, for instance, and among state agencies such as the General Land Office and Parks and Wildlife. The national seashore welcomes our research operations and sees potential for using UAS technologies in its surveillance of the park, especially invaluable, delicate ecosystems on its western shore. Small UAS such as ours, not the high-flying vehicles configured for military use, will be the most likely industry growth area, according to knowledgeable folks we’ve met along the way. Applications are numerous: precision agriculture, pipeline and platform monitoring, wildlife and livestock monitoring, surveying, refinery inspection, shipping monitoring – all of which can be accomplished effectively and efficiently with UAS.
TAMUCC has land-use agreements with private-property owners and a South Texas airport from which we launch chase-plane operations; and, we have an agreement with the national seashore that requires that we notify its headquarters of scheduled missions. Our standard operating procedures require that we be in contact with air-traffic control towers in Corpus Christi and Kingsville and the U.S. Dept. of Homeland Security. In other words, every aspect of our UAS operations is carefully monitored for compliance with FAA regulations; if they weren’t, we would lose our COA.
TAMUCC is not going to get rich from this research, but we believe we are carving a niche for ourselves that will enable us to leverage funded research from public and private sources, which will benefit our students and the economic development of Texas. Our principal mission is educational, and our service to the community is economic. As an FAA test-site, our research will serve an important national purpose.
Among other things, and by no means least important, is the development of policies and procedures regarding UAS operations and personal privacy. TAMUCC is currently exploring ways to engage our faculty in legal and ethical research that will lead to model policies that will protect personal privacy while permitting the kind of technological and industrial growth that will benefit the state and national economy, especially by creating high-paying jobs for our graduates. FAA has announced its intention to develop policies and procedures that will prohibit invasions of privacy by UAS operations in the national airspace.
TAMUCC and its UAS test-site team have invested heavily in this project. I hope you will agree how important it is, in this extremely competitive environment, that specifics of our proposal not be made public until the selection process is complete. Final submissions were due to the FAA on May 6. We are now in the post-submission phase of the competition, during which the FAA will conduct site visits and likely will require oral presentations of competition finalists. We are in high gear preparing for this phase of the selection process, and that includes gathering as much intelligence as we can on our competition – and, believe me, they are looking just as hard for information about our proposal, too. FAA has said it will designate its UAS test sites – six among 50 applicants from 37 states – no later than Dec. 31. Until that announcement is made, specific plans of the Lone Star UAS Center of Excellence & Innovation must remain under wraps.
All of which is not say we cannot be responsive to questions raised by this board in a correspondence with my office dated May 6, 2013. Operational specifics in the following answers relate to current standard operating procedures in TAMUCC authorized airspace.
Texas A&M University-Corpus Christi
Division of Research, Commercialization & Outreach Presentation: Alpine-Casparis Municipal Advisory Board
June 19, 2013 5/7
Q: How will ground movement be monitored?
A: UAS ground movement on taxiways and runways is always monitored by ground visual observers as directed by the FAA. Ground control stations (GCS) receive metadata or GPS data from the aircraft. These data provide current aircraft position and speed.
Q: What are the proposed hours of operation?
A: The Lone Star UAS Team has identified ideal operating hours per day according to weather and aviation traffic data collected over a 10-year period. The team concluded that the preferred mission time is Monday-Friday from 10 a.m. to 4 p.m. This schedule reflects the maximum operational hours. It does not reflect the number of actual operational days or hours needed to meet the research goals and objectives of the Lone Star UAS Test Site. This time period minimizes potential hazardous visibility and wind conditions. Weekend and nighttime (midnight to 4 a.m.) operations also are viable as permitted by the FAA.
Q: Will there be a chase plane to accompany the UAS during takeoff and landing?
A: FAA requires visual observers during all UAS operations. The visual observer must be within one mile of the unmanned aircraft at all times. This visual observer is permitted to be on the ground at the launch and recovery site as well as in a chase plane. The Lone Star UAS Team has used chase planes in order to adhere to the FAA regulations for visual observers. Chase aircraft support of unmanned air vehicle flight has one objective: “the safety of non-participating aircraft flying to the rear and above, below or on both sides of the UAV.” Chase aircraft must be flown only by FAA certified/approved pilots.
Q: At what altitudes will the UAS fly?
A: UAS can fly at altitudes from surface to 60,000 feet above mean sea level (MSL). Specifics for UAS operations in this area are not available because there is no airspace authorized for use by UAS. What we have proposed must remain confidential until the site-selection process is complete.
Q: How will the UAS be separated from other aircraft in the area?
A: Direct and continuous contact with the controlling FAA facility, adjacent facilities, DOD ATC and outreach is maintained through direct communications, according to FAA regulations.
General aviation, commercial aviation and range flights may be separated by several standard means. The primary means for separating range flight activity is procedural. Separation by a single parameter or combination of the parameters of time, space and altitude maintains safe separation.
• Space separation refers to specific aircraft location within a range. This space is defined as the aircraft’s operational area or mission profile for that activity.
Texas A&M University-Corpus Christi
Division of Research, Commercialization & Outreach Presentation: Alpine-Casparis Municipal Advisory Board
June 19, 2013 6/7
• When aircraft are in transit, a range operations officer or ATC representative can separate the aircraft from others by time allocation. Time separation is defined by the distance gained through controlled arrival and departures or checkpoints.
• Aircraft can operate in the same horizontal space but vertically separated through block altitude stratification.
Q: What are the procedures in the event of loss of radio link with the UAS?
A: Lost-link incidents are generally managed by establishing loiter areas close enough for ground pilots to visually acquire and intercept the aircraft in order to regain positive control. Unmanned aircraft carry a preprogrammed emergency mission that directs the aircraft to return to the loiter area in the event of lost link. Since loiter areas are near the LRS, observers can maintain visual contact with the loitering aircraft.
The range operations lead and pilot-in-command immediately contact controlling agencies once a lost link incident has been identified to provide information required for de-confliction within the range. Controlling agencies include range operations for the test site, approach and departure control and a radio call over the common-range frequency for general aviation. The pilot-in-command is responsible for regaining positive control of the aircraft. Once positive control is gained, the pilot-in-command makes the appropriate radio call to controlling agencies that positive control has been reestablished.
Q: Will the operation of the UAS affect the ability of other aircraft in our area to operate safely?
A: No. A notice to airmen (NOTAM) is filed with the FAA and local ATC facilities identifying UAS operations in the test site. Every pilot is encouraged by the FAA to check all local area NOTAMs prior to flight.
Q: What are the dimensions of the UAS?
A: Examples of UAS sizes for small, medium and large aircraft are as follows.
• Small o Length: 2’11” o Wingspan: 4’6” o Weight” 4 lbs
• Medium o Length: 15’ 7” o Wingspan: 22’ 5” o Weight: 584 lbs
• Large o Length: 36’ o Wingspan: 66’ o Weight: 10,498 lbs
Q: Does the UAS have a tracking system?
A: Yes. UAS flight computers transmit metadata to ground control station (GCS) computers. These data tell operators exactly where the aircraft is located. The data can
Texas A&M University-Corpus Christi
Division of Research, Commercialization & Outreach Presentation: Alpine-Casparis Municipal Advisory Board
June 19, 2013 7/7
be exported to third parties to enhance situational awareness on the test site. Larger UAS have Mode C transponders, which are the same as those in commercial U.S. passenger aircraft. These transponders meet all FAA requirements.
Q: Does the UAS have a collision avoidance system?
A: No, a major research goal of the test-site program to develop ground and airborne sense-and-avoid systems.
Q: What types of restrictions will be imposed in this area? Not only are there facilities in Marfa and Alpine, but there are numerous private strips that could be impacted by any flight restrictions that might be imposed by the Federal Aviation Administration.
A: No restrictions will be placed on the area by the Lone Star UAS Center of Excellence & Innovation. As stated above, NOTAMs are filed with the FAA and local ATC facilities identifying UAS operations.
Now, to answer a question that wasn’t asked: Why Alpine?
The Lone Star UAS Test Site airspace integration/management team carefully reviewed and evaluated each proposed test range within the test site. Evaluation criteria included:
• population densities; • visual flight rules/instrument flight rules (VFR/IFR) arrival and departures, airways and
military training routes; • wildlife areas; • public-gathering venues; • suitability for supporting research goals and objectives.
Care was taken to avoid densely-populated areas, manufacturing facilities, power plants and heavy-traffic areas for commercial and general aviation. This analysis identified sparsely populated areas of Texas. The design of the proposed COA around Alpine-Casparis Municipal Airport avoids populated areas around the city of Alpine and adheres to the FAA’s rules for flying over state and federal lands. Once we are no longer competition-sensitive, detailed maps and other documents related to our proposal will be available for public inspection.
Again, we appreciate this opportunity to address the advisory board of Alpine-Casparis Municipal Airport. On behalf of Dr. Cifuentes, Mr. Nelson and myself, thank you for your kind attention. We are at your disposal to answer questions from the board and from the public.
Respectfully submitted,
Ronald E. George Senior Research Development Officer Texas A&M University-Corpus Christi 361.825.5731 [email protected]
126 STAT. 72 PUBLIC LAW 112–95—FEB. 14, 2012
(e) USE OF DESIGNEES.—The Administrator may use designees to carry out subsection (a) to the extent practicable in order to minimize the burdens on pilots.
(f) REPORT TO CONGRESS.— (1) IN GENERAL.—Not later than 1 year after the date
of enactment of this Act, and annually thereafter, the Adminis-trator shall submit to the Committee on Transportation and Infrastructure of the House of Representatives and the Com-mittee on Commerce, Science, and Transportation of the Senate a report on the issuance of improved pilot licenses under this section.
(2) EXPIRATION.—The Administrator shall not be required to submit annual reports under this subsection after the date on which the Administrator has issued improved pilot licenses under this section to all pilots.
Subtitle B—Unmanned Aircraft Systems
SEC. 331. DEFINITIONS.
In this subtitle, the following definitions apply: (1) ARCTIC.—The term ‘‘Arctic’’ means the United States
zone of the Chukchi Sea, Beaufort Sea, and Bering Sea north of the Aleutian chain.
(2) CERTIFICATE OF WAIVER; CERTIFICATE OF AUTHORIZA-TION.—The terms ‘‘certificate of waiver’’ and ‘‘certificate of authorization’’ mean a Federal Aviation Administration grant of approval for a specific flight operation.
(3) PERMANENT AREAS.—The term ‘‘permanent areas’’ means areas on land or water that provide for launch, recovery, and operation of small unmanned aircraft.
(4) PUBLIC UNMANNED AIRCRAFT SYSTEM.—The term ‘‘public unmanned aircraft system’’ means an unmanned aircraft system that meets the qualifications and conditions required for operation of a public aircraft (as defined in section 40102 of title 49, United States Code).
(5) SENSE AND AVOID CAPABILITY.—The term ‘‘sense and avoid capability’’ means the capability of an unmanned aircraft to remain a safe distance from and to avoid collisions with other airborne aircraft.
(6) SMALL UNMANNED AIRCRAFT.—The term ‘‘small unmanned aircraft’’ means an unmanned aircraft weighing less than 55 pounds.
(7) TEST RANGE.—The term ‘‘test range’’ means a defined geographic area where research and development are con-ducted.
(8) UNMANNED AIRCRAFT.—The term ‘‘unmanned aircraft’’ means an aircraft that is operated without the possibility of direct human intervention from within or on the aircraft.
(9) UNMANNED AIRCRAFT SYSTEM.—The term ‘‘unmanned aircraft system’’ means an unmanned aircraft and associated elements (including communication links and the components that control the unmanned aircraft) that are required for the pilot in command to operate safely and efficiently in the national airspace system.
Applicability.
49 USC 40101 note.
VerDate Mar 15 2010 07:45 Mar 06, 2012 Jkt 019139 PO 00095 Frm 00062 Fmt 6580 Sfmt 6581 E:\PUBLAW\PUBL095.112 GPO1 PsN: PUBL095dkra
use
on D
SK
HT7
XV
N1P
RO
D w
ith P
UB
LIC
LA
WS
126 STAT. 73 PUBLIC LAW 112–95—FEB. 14, 2012
SEC. 332. INTEGRATION OF CIVIL UNMANNED AIRCRAFT SYSTEMS INTO NATIONAL AIRSPACE SYSTEM.
(a) REQUIRED PLANNING FOR INTEGRATION.— (1) COMPREHENSIVE PLAN.—Not later than 270 days after
the date of enactment of this Act, the Secretary of Transpor-tation, in consultation with representatives of the aviation industry, Federal agencies that employ unmanned aircraft sys-tems technology in the national airspace system, and the unmanned aircraft systems industry, shall develop a com-prehensive plan to safely accelerate the integration of civil unmanned aircraft systems into the national airspace system.
(2) CONTENTS OF PLAN.—The plan required under para-graph (1) shall contain, at a minimum, recommendations or projections on—
(A) the rulemaking to be conducted under subsection (b), with specific recommendations on how the rulemaking will—
(i) define the acceptable standards for operation and certification of civil unmanned aircraft systems;
(ii) ensure that any civil unmanned aircraft system includes a sense and avoid capability; and
(iii) establish standards and requirements for the operator and pilot of a civil unmanned aircraft system, including standards and requirements for registration and licensing; (B) the best methods to enhance the technologies and
subsystems necessary to achieve the safe and routine oper-ation of civil unmanned aircraft systems in the national airspace system;
(C) a phased-in approach to the integration of civil unmanned aircraft systems into the national airspace system;
(D) a timeline for the phased-in approach described under subparagraph (C);
(E) creation of a safe (F) airspace designation for cooperative manned and
unmanned flight operations in the national airspace system;
(G) establishment of a process to develop certification, flight standards, and air traffic requirements for civil unmanned aircraft systems at test ranges where such sys-tems are subject to testing;
(H) the best methods to ensure the safe operation of civil unmanned aircraft systems and public unmanned aircraft systems simultaneously in the national airspace system; and
(I) incorporation of the plan into the annual NextGen Implementation Plan document (or any successor docu-ment) of the Federal Aviation Administration. (3) DEADLINE.—The plan required under paragraph (1)
shall provide for the safe integration of civil unmanned aircraft systems into the national airspace system as soon as prac-ticable, but not later than September 30, 2015.
(4) REPORT TO CONGRESS.—Not later than 1 year after the date of enactment of this Act, the Secretary shall submit to Congress a copy of the plan required under paragraph (1).
Deadline.
49 USC 40101 note.
VerDate Mar 15 2010 07:45 Mar 06, 2012 Jkt 019139 PO 00095 Frm 00063 Fmt 6580 Sfmt 6581 E:\PUBLAW\PUBL095.112 GPO1 PsN: PUBL095dkra
use
on D
SK
HT7
XV
N1P
RO
D w
ith P
UB
LIC
LA
WS
126 STAT. 74 PUBLIC LAW 112–95—FEB. 14, 2012
(5) ROADMAP.—Not later than 1 year after the date of enactment of this Act, the Secretary shall approve and make available in print and on the Administration’s Internet Web site a 5-year roadmap for the introduction of civil unmanned aircraft systems into the national airspace system, as coordi-nated by the Unmanned Aircraft Program Office of the Adminis-tration. The Secretary shall update the roadmap annually. (b) RULEMAKING.—Not later than 18 months after the date
on which the plan required under subsection (a)(1) is submitted to Congress under subsection (a)(4), the Secretary shall publish in the Federal Register—
(1) a final rule on small unmanned aircraft systems that will allow for civil operation of such systems in the national airspace system, to the extent the systems do not meet the requirements for expedited operational authorization under sec-tion 333 of this Act;
(2) a notice of proposed rulemaking to implement the rec-ommendations of the plan required under subsection (a)(1), with the final rule to be published not later than 16 months after the date of publication of the notice; and
(3) an update to the Administration’s most recent policy statement on unmanned aircraft systems, contained in Docket No. FAA–2006–25714. (c) PILOT PROJECTS.—
(1) ESTABLISHMENT.—Not later than 180 days after the date of enactment of this Act, the Administrator shall establish a program to integrate unmanned aircraft systems into the national airspace system at 6 test ranges. The program shall terminate 5 years after the date of enactment of this Act.
(2) PROGRAM REQUIREMENTS.—In establishing the program under paragraph (1), the Administrator shall—
(A) safely designate airspace for integrated manned and unmanned flight operations in the national airspace system;
(B) develop certification standards and air traffic requirements for unmanned flight operations at test ranges;
(C) coordinate with and leverage the resources of the National Aeronautics and Space Administration and the Department of Defense;
(D) address both civil and public unmanned aircraft systems;
(E) ensure that the program is coordinated with the Next Generation Air Transportation System; and
(F) provide for verification of the safety of unmanned aircraft systems and related navigation procedures before integration into the national airspace system. (3) TEST RANGE LOCATIONS.—In determining the location
of the 6 test ranges of the program under paragraph (1), the Administrator shall—
(A) take into consideration geographic and climatic diversity;
(B) take into consideration the location of ground infra-structure and research needs; and
(C) consult with the National Aeronautics and Space Administration and the Department of Defense.
Consultation.
Standards.
Termination date.
Deadline.
Deadline. Federal Register, publication.
Deadlines. Publication. Web posting.
VerDate Mar 15 2010 07:45 Mar 06, 2012 Jkt 019139 PO 00095 Frm 00064 Fmt 6580 Sfmt 6581 E:\PUBLAW\PUBL095.112 GPO1 PsN: PUBL095dkra
use
on D
SK
HT7
XV
N1P
RO
D w
ith P
UB
LIC
LA
WS
126 STAT. 75 PUBLIC LAW 112–95—FEB. 14, 2012
(4) TEST RANGE OPERATION.—A project at a test range shall be operational not later than 180 days after the date on which the project is established.
(5) REPORT TO CONGRESS.— (A) IN GENERAL.—Not later than 90 days after the
date of the termination of the program under paragraph (1), the Administrator shall submit to the Committee on Commerce, Science, and Transportation of the Senate and the Committee on Transportation and Infrastructure and the Committee on Science, Space, and Technology of the House of Representatives a report setting forth the Administrator’s findings and conclusions concerning the projects.
(B) ADDITIONAL CONTENTS.—The report under subpara-graph (A) shall include a description and assessment of the progress being made in establishing special use airspace to fill the immediate need of the Department of Defense—
(i) to develop detection techniques for small unmanned aircraft systems; and
(ii) to validate the sense and avoid capability and operation of unmanned aircraft systems.
(d) EXPANDING USE OF UNMANNED AIRCRAFT SYSTEMS IN ARCTIC.—
(1) IN GENERAL.—Not later than 180 days after the date of enactment of this Act, the Secretary shall develop a plan and initiate a process to work with relevant Federal agencies and national and international communities to designate permanent areas in the Arctic where small unmanned aircraft may operate 24 hours per day for research and commercial purposes. The plan for operations in these permanent areas shall include the development of processes to facilitate the safe operation of unmanned aircraft beyond line of sight. Such areas shall enable over-water flights from the surface to at least 2,000 feet in altitude, with ingress and egress routes from selected coastal launch sites.
(2) AGREEMENTS.—To implement the plan under paragraph (1), the Secretary may enter into an agreement with relevant national and international communities.
(3) AIRCRAFT APPROVAL.—Not later than 1 year after the entry into force of an agreement necessary to effectuate the purposes of this subsection, the Secretary shall work with rel-evant national and international communities to establish and implement a process, or may apply an applicable process already established, for approving the use of unmanned aircraft in the designated permanent areas in the Arctic without regard to whether an unmanned aircraft is used as a public aircraft, a civil aircraft, or a model aircraft.
SEC. 333. SPECIAL RULES FOR CERTAIN UNMANNED AIRCRAFT SYS-TEMS.
(a) IN GENERAL.—Notwithstanding any other requirement of this subtitle, and not later than 180 days after the date of enactment of this Act, the Secretary of Transportation shall determine if certain unmanned aircraft systems may operate safely in the national airspace system before completion of the plan and rule-making required by section 332 of this Act or the guidance required by section 334 of this Act.
Deadline. Determination.
49 USC 40101 note.
Deadline.
Deadline. Plans.
Deadline.
VerDate Mar 15 2010 07:45 Mar 06, 2012 Jkt 019139 PO 00095 Frm 00065 Fmt 6580 Sfmt 6581 E:\PUBLAW\PUBL095.112 GPO1 PsN: PUBL095dkra
use
on D
SK
HT7
XV
N1P
RO
D w
ith P
UB
LIC
LA
WS
126 STAT. 76 PUBLIC LAW 112–95—FEB. 14, 2012
(b) ASSESSMENT OF UNMANNED AIRCRAFT SYSTEMS.—In making the determination under subsection (a), the Secretary shall deter-mine, at a minimum—
(1) which types of unmanned aircraft systems, if any, as a result of their size, weight, speed, operational capability, proximity to airports and populated areas, and operation within visual line of sight do not create a hazard to users of the national airspace system or the public or pose a threat to national security; and
(2) whether a certificate of waiver, certificate of authoriza-tion, or airworthiness certification under section 44704 of title 49, United States Code, is required for the operation of unmanned aircraft systems identified under paragraph (1). (c) REQUIREMENTS FOR SAFE OPERATION.—If the Secretary
determines under this section that certain unmanned aircraft sys-tems may operate safely in the national airspace system, the Sec-retary shall establish requirements for the safe operation of such aircraft systems in the national airspace system.
SEC. 334. PUBLIC UNMANNED AIRCRAFT SYSTEMS.
(a) GUIDANCE.—Not later than 270 days after the date of enact-ment of this Act, the Secretary of Transportation shall issue guid-ance regarding the operation of public unmanned aircraft systems to—
(1) expedite the issuance of a certificate of authorization process;
(2) provide for a collaborative process with public agencies to allow for an incremental expansion of access to the national airspace system as technology matures and the necessary safety analysis and data become available, and until standards are completed and technology issues are resolved;
(3) facilitate the capability of public agencies to develop and use test ranges, subject to operating restrictions required by the Federal Aviation Administration, to test and operate unmanned aircraft systems; and
(4) provide guidance on a public entity’s responsibility when operating an unmanned aircraft without a civil airworthiness certificate issued by the Administration. (b) STANDARDS FOR OPERATION AND CERTIFICATION.—Not later
than December 31, 2015, the Administrator shall develop and imple-ment operational and certification requirements for the operation of public unmanned aircraft systems in the national airspace system.
(c) AGREEMENTS WITH GOVERNMENT AGENCIES.— (1) IN GENERAL.—Not later than 90 days after the date
of enactment of this Act, the Secretary shall enter into agree-ments with appropriate government agencies to simplify the process for issuing certificates of waiver or authorization with respect to applications seeking authorization to operate public unmanned aircraft systems in the national airspace system.
(2) CONTENTS.—The agreements shall— (A) with respect to an application described in para-
graph (1)— (i) provide for an expedited review of the applica-
tion;
Deadline.
Deadline.
Deadline.
49 USC 40101 note.
Determination.
VerDate Mar 15 2010 07:45 Mar 06, 2012 Jkt 019139 PO 00095 Frm 00066 Fmt 6580 Sfmt 6581 E:\PUBLAW\PUBL095.112 GPO1 PsN: PUBL095dkra
use
on D
SK
HT7
XV
N1P
RO
D w
ith P
UB
LIC
LA
WS
126 STAT. 77 PUBLIC LAW 112–95—FEB. 14, 2012
(ii) require a decision by the Administrator on approval or disapproval within 60 business days of the date of submission of the application; and
(iii) allow for an expedited appeal if the application is disapproved; (B) allow for a one-time approval of similar operations
carried out during a fixed period of time; and (C) allow a government public safety agency to operate
unmanned aircraft weighing 4.4 pounds or less, if oper-ated—
(i) within the line of sight of the operator; (ii) less than 400 feet above the ground; (iii) during daylight conditions; (iv) within Class G airspace; and (v) outside of 5 statute miles from any airport,
heliport, seaplane base, spaceport, or other location with aviation activities.
SEC. 335. SAFETY STUDIES.
The Administrator of the Federal Aviation Administration shall carry out all safety studies necessary to support the integration of unmanned aircraft systems into the national airspace system.
SEC. 336. SPECIAL RULE FOR MODEL AIRCRAFT.
(a) IN GENERAL.—Notwithstanding any other provision of law relating to the incorporation of unmanned aircraft systems into Federal Aviation Administration plans and policies, including this subtitle, the Administrator of the Federal Aviation Administration may not promulgate any rule or regulation regarding a model aircraft, or an aircraft being developed as a model aircraft, if—
(1) the aircraft is flown strictly for hobby or recreational use;
(2) the aircraft is operated in accordance with a community- based set of safety guidelines and within the programming of a nationwide community-based organization;
(3) the aircraft is limited to not more than 55 pounds unless otherwise certified through a design, construction, inspection, flight test, and operational safety program adminis-tered by a community-based organization;
(4) the aircraft is operated in a manner that does not interfere with and gives way to any manned aircraft; and
(5) when flown within 5 miles of an airport, the operator of the aircraft provides the airport operator and the airport air traffic control tower (when an air traffic facility is located at the airport) with prior notice of the operation (model aircraft operators flying from a permanent location within 5 miles of an airport should establish a mutually-agreed upon operating procedure with the airport operator and the airport air traffic control tower (when an air traffic facility is located at the airport)). (b) STATUTORY CONSTRUCTION.—Nothing in this section shall
be construed to limit the authority of the Administrator to pursue enforcement action against persons operating model aircraft who endanger the safety of the national airspace system.
(c) MODEL AIRCRAFT DEFINED.—In this section, the term ‘‘model aircraft’’ means an unmanned aircraft that is—
(1) capable of sustained flight in the atmosphere;
49 USC 40101 note.
49 USC 40101 note.
Deadline.
VerDate Mar 15 2010 07:45 Mar 06, 2012 Jkt 019139 PO 00095 Frm 00067 Fmt 6580 Sfmt 6581 E:\PUBLAW\PUBL095.112 GPO1 PsN: PUBL095dkra
use
on D
SK
HT7
XV
N1P
RO
D w
ith P
UB
LIC
LA
WS
126 STAT. 78 PUBLIC LAW 112–95—FEB. 14, 2012
(2) flown within visual line of sight of the person operating the aircraft; and
(3) flown for hobby or recreational purposes.
Subtitle C—Safety and Protections
SEC. 341. AVIATION SAFETY WHISTLEBLOWER INVESTIGATION OFFICE.
Section 106 (as amended by this Act) is further amended by adding at the end the following:
‘‘(t) AVIATION SAFETY WHISTLEBLOWER INVESTIGATION OFFICE.—
‘‘(1) ESTABLISHMENT.—There is established in the Federal Aviation Administration (in this subsection referred to as the ‘Agency’) an Aviation Safety Whistleblower Investigation Office (in this subsection referred to as the ‘Office’).
‘‘(2) DIRECTOR.— ‘‘(A) APPOINTMENT.—The head of the Office shall be
the Director, who shall be appointed by the Secretary of Transportation.
‘‘(B) QUALIFICATIONS.—The Director shall have a dem-onstrated ability in investigations and knowledge of or experience in aviation.
‘‘(C) TERM.—The Director shall be appointed for a term of 5 years.
‘‘(D) VACANCIES.—Any individual appointed to fill a vacancy in the position of the Director occurring before the expiration of the term for which the individual’s prede-cessor was appointed shall be appointed for the remainder of that term. ‘‘(3) COMPLAINTS AND INVESTIGATIONS.—
‘‘(A) AUTHORITY OF DIRECTOR.—The Director shall— ‘‘(i) receive complaints and information submitted
by employees of persons holding certificates issued under title 14, Code of Federal Regulations (if the certificate holder does not have a similar in-house whistleblower or safety and regulatory noncompliance reporting process) and employees of the Agency con-cerning the possible existence of an activity relating to a violation of an order, a regulation, or any other provision of Federal law relating to aviation safety;
‘‘(ii) assess complaints and information submitted under clause (i) and determine whether a substantial likelihood exists that a violation of an order, a regula-tion, or any other provision of Federal law relating to aviation safety has occurred; and
‘‘(iii) based on findings of the assessment conducted under clause (ii), make recommendations to the Administrator of the Agency, in writing, regarding fur-ther investigation or corrective actions. ‘‘(B) DISCLOSURE OF IDENTITIES.—The Director shall
not disclose the identity of an individual who submits a complaint or information under subparagraph (A)(i) unless—
‘‘(i) the individual consents to the disclosure in writing; or
Recommenda- tions.
VerDate Mar 15 2010 07:45 Mar 06, 2012 Jkt 019139 PO 00095 Frm 00068 Fmt 6580 Sfmt 6581 E:\PUBLAW\PUBL095.112 GPO1 PsN: PUBL095dkra
use
on D
SK
HT7
XV
N1P
RO
D w
ith P
UB
LIC
LA
WS

Unmanned Aircraft Systems Test Site Selection
SCREENING INFORMATION REQUESTDTFACT-13-R-00002
AMENDMENT 04 - March 20, 2013
Date: February 14, 2013
Paperwork Reduction Act - OMB No. 2120-0595
DTFACT-13-R-00002Amendment 04March 20, 2013
Page 2 of 70
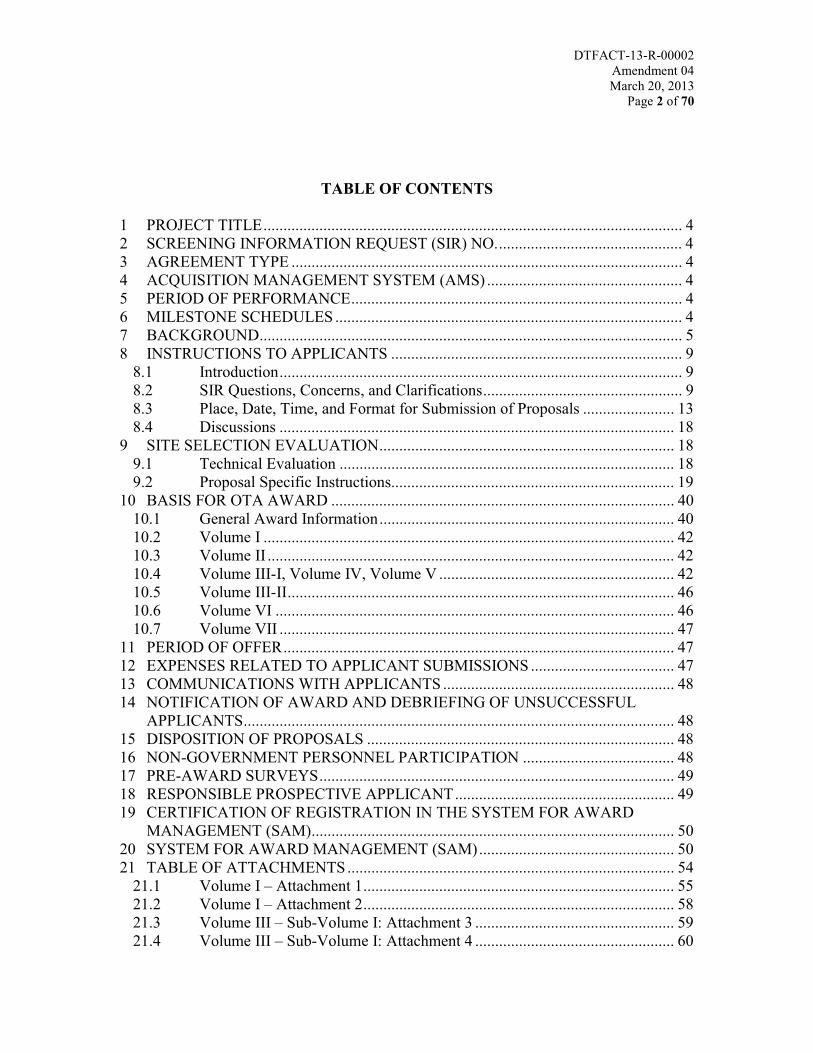
TABLE OF CONTENTS
1 PROJECT TITLE......................................................................................................... 4 2 SCREENING INFORMATION REQUEST (SIR) NO............................................... 4 3 AGREEMENT TYPE .................................................................................................. 4 4 ACQUISITION MANAGEMENT SYSTEM (AMS) ................................................. 4 5 PERIOD OF PERFORMANCE................................................................................... 4 6 MILESTONE SCHEDULES ....................................................................................... 4 7 BACKGROUND.......................................................................................................... 5 8 INSTRUCTIONS TO APPLICANTS ......................................................................... 9
8.1 Introduction..................................................................................................... 9 8.2 SIR Questions, Concerns, and Clarifications.................................................. 9 8.3 Place, Date, Time, and Format for Submission of Proposals ....................... 13 8.4 Discussions ................................................................................................... 18
9 SITE SELECTION EVALUATION.......................................................................... 18 9.1 Technical Evaluation .................................................................................... 18 9.2 Proposal Specific Instructions....................................................................... 19
10 BASIS FOR OTA AWARD ...................................................................................... 40 10.1 General Award Information.......................................................................... 40 10.2 Volume I ....................................................................................................... 42 10.3 Volume II ...................................................................................................... 42 10.4 Volume III-I, Volume IV, Volume V ........................................................... 42 10.5 Volume III-II................................................................................................. 46 10.6 Volume VI .................................................................................................... 46 10.7 Volume VII ................................................................................................... 47
11 PERIOD OF OFFER.................................................................................................. 47 12 EXPENSES RELATED TO APPLICANT SUBMISSIONS .................................... 47 13 COMMUNICATIONS WITH APPLICANTS .......................................................... 48 14 NOTIFICATION OF AWARD AND DEBRIEFING OF UNSUCCESSFUL
APPLICANTS............................................................................................................ 48 15 DISPOSITION OF PROPOSALS ............................................................................. 48 16 NON-GOVERNMENT PERSONNEL PARTICIPATION ...................................... 48 17 PRE-AWARD SURVEYS......................................................................................... 49 18 RESPONSIBLE PROSPECTIVE APPLICANT....................................................... 49 19 CERTIFICATION OF REGISTRATION IN THE SYSTEM FOR AWARD
MANAGEMENT (SAM)........................................................................................... 50 20 SYSTEM FOR AWARD MANAGEMENT (SAM)................................................. 50 21 TABLE OF ATTACHMENTS.................................................................................. 54
21.1 Volume I – Attachment 1.............................................................................. 55 21.2 Volume I – Attachment 2.............................................................................. 58 21.3 Volume III – Sub-Volume I: Attachment 3 .................................................. 59 21.4 Volume III – Sub-Volume I: Attachment 4 .................................................. 60
DTFACT-13-R-00002Amendment 04March 20, 2013
Page 3 of 70
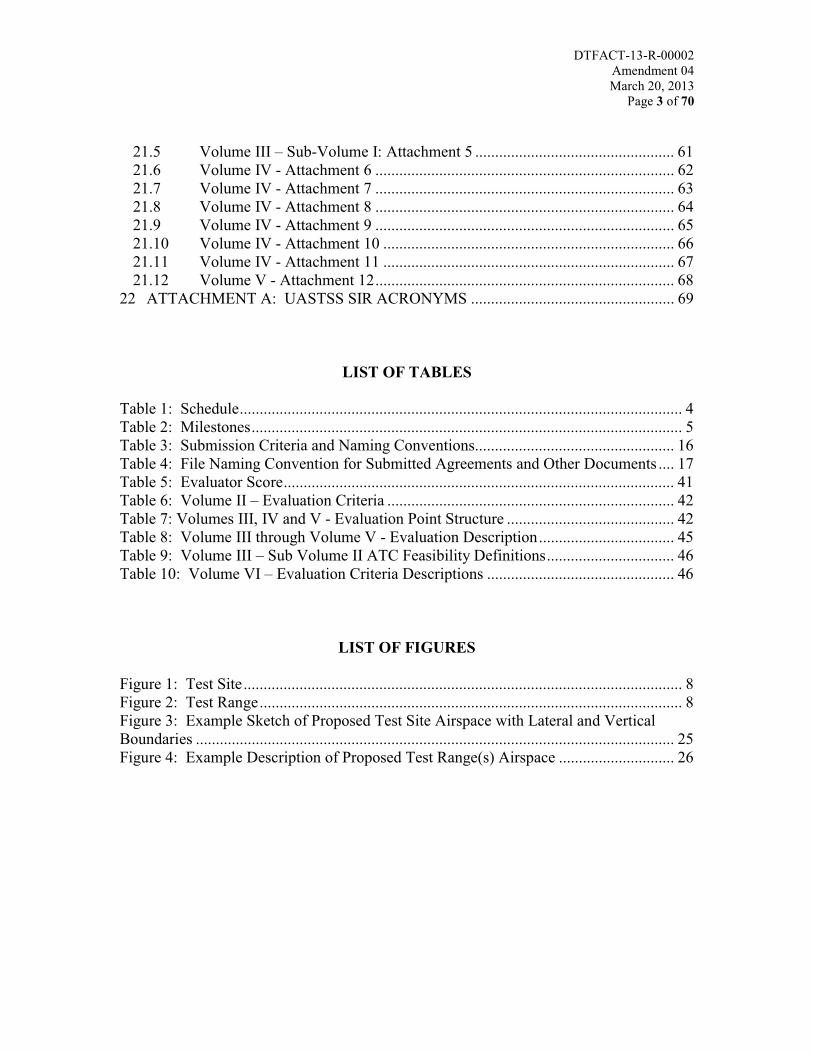
21.5 Volume III – Sub-Volume I: Attachment 5 .................................................. 61 21.6 Volume IV - Attachment 6 ........................................................................... 62 21.7 Volume IV - Attachment 7 ........................................................................... 63 21.8 Volume IV - Attachment 8 ........................................................................... 64 21.9 Volume IV - Attachment 9 ........................................................................... 65 21.10 Volume IV - Attachment 10 ......................................................................... 66 21.11 Volume IV - Attachment 11 ......................................................................... 67 21.12 Volume V - Attachment 12........................................................................... 68
22 ATTACHMENT A: UASTSS SIR ACRONYMS ................................................... 69
LIST OF TABLES
Table 1: Schedule............................................................................................................... 4 Table 2: Milestones............................................................................................................ 5 Table 3: Submission Criteria and Naming Conventions.................................................. 16 Table 4: File Naming Convention for Submitted Agreements and Other Documents .... 17 Table 5: Evaluator Score.................................................................................................. 41 Table 6: Volume II – Evaluation Criteria ........................................................................ 42 Table 7: Volumes III, IV and V - Evaluation Point Structure .......................................... 42 Table 8: Volume III through Volume V - Evaluation Description.................................. 45 Table 9: Volume III – Sub Volume II ATC Feasibility Definitions................................ 46 Table 10: Volume VI – Evaluation Criteria Descriptions ............................................... 46
LIST OF FIGURES
Figure 1: Test Site.............................................................................................................. 8 Figure 2: Test Range.......................................................................................................... 8 Figure 3: Example Sketch of Proposed Test Site Airspace with Lateral and Vertical Boundaries ........................................................................................................................ 25 Figure 4: Example Description of Proposed Test Range(s) Airspace ............................. 26
DTFACT-13-R-00002Amendment 04March 20, 2013
Page 4 of 70
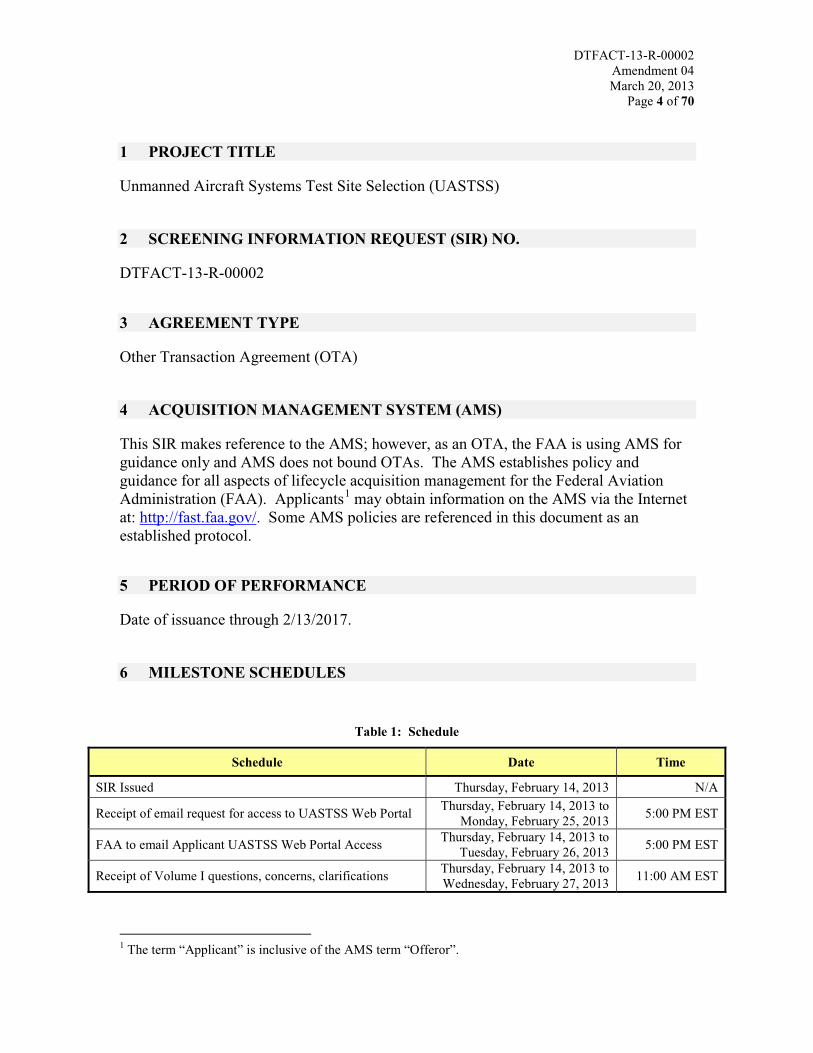
1 PROJECT TITLE
Unmanned Aircraft Systems Test Site Selection (UASTSS)
2 SCREENING INFORMATION REQUEST (SIR) NO.
DTFACT-13-R-00002
3 AGREEMENT TYPE
Other Transaction Agreement (OTA)
4 ACQUISITION MANAGEMENT SYSTEM (AMS)
This SIR makes reference to the AMS; however, as an OTA, the FAA is using AMS for guidance only and AMS does not bound OTAs. The AMS establishes policy and guidance for all aspects of lifecycle acquisition management for the Federal Aviation Administration (FAA). Applicants1 may obtain information on the AMS via the Internet at: http://fast.faa.gov/. Some AMS policies are referenced in this document as an established protocol.
5 PERIOD OF PERFORMANCE
Date of issuance through 2/13/2017.
6 MILESTONE SCHEDULES
Table 1: Schedule
Schedule Date Time
SIR Issued Thursday, February 14, 2013 N/A
Receipt of email request for access to UASTSS Web Portal Thursday, February 14, 2013 toMonday, February 25, 2013 5:00 PM EST
FAA to email Applicant UASTSS Web Portal Access Thursday, February 14, 2013 toTuesday, February 26, 2013 5:00 PM EST
Receipt of Volume I questions, concerns, clarifications Thursday, February 14, 2013 toWednesday, February 27, 2013 11:00 AM EST
1 The term “Applicant” is inclusive of the AMS term “Offeror”.
DTFACT-13-R-00002Amendment 04March 20, 2013
Page 5 of 70
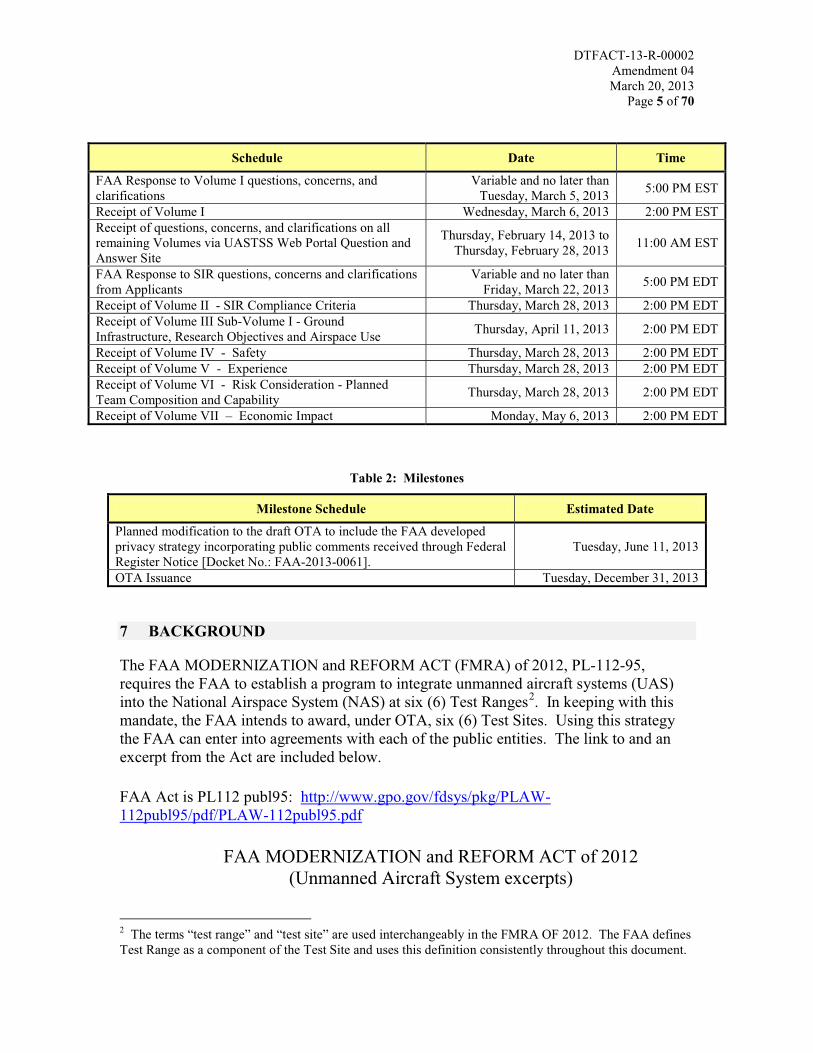
Schedule Date Time
FAA Response to Volume I questions, concerns, and clarifications
Variable and no later thanTuesday, March 5, 2013 5:00 PM EST
Receipt of Volume I Wednesday, March 6, 2013 2:00 PM ESTReceipt of questions, concerns, and clarifications on all remaining Volumes via UASTSS Web Portal Question and Answer Site
Thursday, February 14, 2013 toThursday, February 28, 2013 11:00 AM EST
FAA Response to SIR questions, concerns and clarifications from Applicants
Variable and no later thanFriday, March 22, 2013 5:00 PM EDT
Receipt of Volume II - SIR Compliance Criteria Thursday, March 28, 2013 2:00 PM EDTReceipt of Volume III Sub-Volume I - Ground Infrastructure, Research Objectives and Airspace Use Thursday, April 11, 2013 2:00 PM EDT
Receipt of Volume IV - Safety Thursday, March 28, 2013 2:00 PM EDTReceipt of Volume V - Experience Thursday, March 28, 2013 2:00 PM EDTReceipt of Volume VI - Risk Consideration - Planned Team Composition and Capability Thursday, March 28, 2013 2:00 PM EDT
Receipt of Volume VII – Economic Impact Monday, May 6, 2013 2:00 PM EDT
Table 2: Milestones
Milestone Schedule Estimated Date
Planned modification to the draft OTA to include the FAA developed privacy strategy incorporating public comments received through Federal Register Notice [Docket No.: FAA-2013-0061].
Tuesday, June 11, 2013
OTA Issuance Tuesday, December 31, 2013
7 BACKGROUND
The FAA MODERNIZATION and REFORM ACT (FMRA) of 2012, PL-112-95,requires the FAA to establish a program to integrate unmanned aircraft systems (UAS) into the National Airspace System (NAS) at six (6) Test Ranges2. In keeping with this mandate, the FAA intends to award, under OTA, six (6) Test Sites. Using this strategy the FAA can enter into agreements with each of the public entities. The link to and an excerpt from the Act are included below.
FAA Act is PL112 publ95: http://www.gpo.gov/fdsys/pkg/PLAW-112publ95/pdf/PLAW-112publ95.pdf
FAA MODERNIZATION and REFORM ACT of 2012(Unmanned Aircraft System excerpts)
2 The terms “test range” and “test site” are used interchangeably in the FMRA OF 2012. The FAA defines Test Range as a component of the Test Site and uses this definition consistently throughout this document.
DTFACT-13-R-00002Amendment 04March 20, 2013
Page 6 of 70
TITLE III—SAFETYSubtitle B—Unmanned Aircraft Systems
The specific language from Section 332(c) of the FAA Modernization and Reform Act of 2012 (Public Law 112–95, 112th Congress) is provided for reference.
(c) PILOT PROJECTS.—(1) ESTABLISHMENT.—Not later than 180 days after the date of enactment of this Act, the Administrator shall establish a program to integrate unmanned aircraft systems into the national airspace system at 6 Test Ranges. The program shall terminate 5 years after the date of enactment of this Act.(2) PROGRAM REQUIREMENTS.—In establishing the program under paragraph (1), the Administrator shall—
(A) safely designate airspace for integrated manned and unmanned flight operations in the national airspace system;(B) develop certification standards and air traffic requirements for unmanned flight operations at Test Ranges;(C) coordinate with and leverage the resources of the National Aeronautics and Space Administration and the Department of Defense;(D) address both civil and public unmanned aircraft systems;(E) ensure that the program is coordinated with the Next Generation Air Transportation System; and(F) provide for verification of the safety of unmanned aircraft systems and related navigation procedures before integration into the national airspace system.
(3) TEST RANGE LOCATIONS.—In determining the location of the 6 Test Ranges of the program under paragraph (1), the Administrator shall—
(A) take into consideration geographic and climatic diversity;(B) take into consideration the location of ground infrastructure and research needs; and(C) consult with the National Aeronautics and Space Administration and the Department of Defense.
(4) TEST RANGE OPERATION.—A project at a Test Range shall be operational not later than 180 days after the date on which the project is established.(5) REPORT TO CONGRESS.—
(A) IN GENERAL.—Not later than 90 days after the date of the termination of the program under paragraph (1), the Administrator shall submit to the Committee on Commerce, Science, and Transportation of the Senate and the Committee on Transportation
DTFACT-13-R-00002Amendment 04March 20, 2013
Page 7 of 70
and Infrastructure and the Committee on Science, Space, and Technology of the House of Representatives a report setting forth the Administrator’s findings and conclusions concerning the projects.(B) ADDITIONAL CONTENTS.—The report under subparagraph (A) shall include a description and assessment of the progress being made in establishing special use airspace to fill the immediate need of the Department of Defense— (i) to develop detection techniques for small unmanned aircraft systems; and (ii) to validate the sense and avoid capability and operation of unmanned aircraft systems.
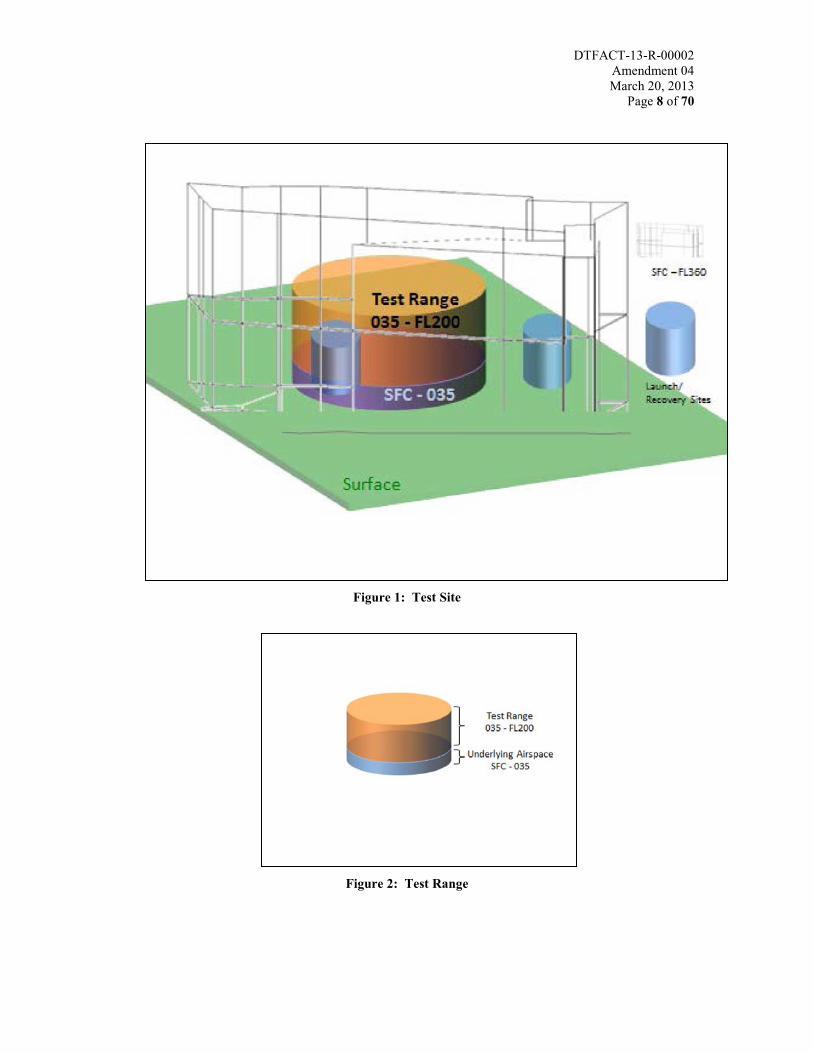
The terms Test Site and Test Range are defined as follows:
1. Test Site includes the defined range airspace and any/all ground infrastructure to include launch/recovery location(s). These launch/recovery locations do not necessarily have to be located in the underlying range airspace. See ExampleFigure 1: Test Site.
2. Test Range implies only the airspace and the area specifically underlying that airspace that may extend to the surface, where operation(s) are conducted. See Example Figure 2: Test Range.
DTFACT-13-R-00002Amendment 04March 20, 2013
Page 8 of 70
Figure 1: Test Site
Figure 2: Test Range
DTFACT-13-R-00002Amendment 04March 20, 2013
Page 9 of 70
8 INSTRUCTIONS TO APPLICANTS
8.1 Introduction8.1.1 The FAA is conducting a Site Selection process with the intention to authorize
and designate six (6) UAS Test Sites in accordance with Congressional mandate.
8.1.2 As a result, the FAA plans to award OTAs to those entities for which the Administrator has issued an Order designating them a UAS Test Site Operator.
8.1.3 Submissions are presumed to represent an entity’s best efforts to respond to SIR requirements, including the scope requirements defined in Article 2 of the draft OTA. Inconsistencies within the entire proposal submission must be fully explained. A significant inconsistency, if unexplained, raises a fundamental question of the Applicant’s understanding of the relevant regulatory and technical environment, as well as of the ability to meet and perform the requirements. This may be grounds for either rejection of the submission or a basis for a determination of Non-Compliance. Failure to submit any of the information requested by this SIR may be cause for unfavorable consideration.
8.2 SIR Questions, Concerns, and Clarifications8.2.1 All questions from potential Applicants relevant to SIR content must be submitted
through the UASTSS Web Portal. All other inquiries on this SIR, or to receive assistance, must be made directly to the FAA Contracting Officer rather than through intermediaries. The following COs are the sole points of contact for this SIR:
Contracting Officer (CO)FAA William J. Hughes Technical CenterAttn: Anne Marie Ternay, AAQ-630Atlantic City International Airport, NJ 08405Phone: (609) 485-6990Email: [email protected]
Supervisory Contracting Officer (if above CO is unavailable): FAA Technical CenterAttn: Debra Stueber, AAQ-630Atlantic City International Airport, NJ 08405Phone: (609) 485-4115Email: [email protected]
8.2.2 The Applicant must submit a request for access to the UASTSS Web Portal to the CO via email by the designated due date on Table 1: Schedule:
Email: [email protected] email subject should read:
“Establishment of UASTSS Web Portal Account – (insert Public Entity Name)
DTFACT-13-R-00002Amendment 04March 20, 2013
Page 10 of 70
The email should read as follows:“Please establish an UASTSS Web Portal Account for:
Public Entity Name:Contact Title: (e.g. Dr. Mr., Mrs., Ms., etc.)Contact Name:Contact Position: (e.g. President, Director, etc.) Email:Phone Number:”
Note: The Public Entity Name established for the Web Portal may not be changed at any time during this solicitation. The FAA will only accept one Point of Contact for this solicitation. All communication from the Applicant must be through this appointed individual.
8.2.3 Access instructions to the UASTSS Web Portal will be provided by the FAA via an automatically generated email from [email protected] to the Applicant by the designated due date.
8.2.4 If an Applicant does not receive access instructions to the UASTSS Web Portal by the designated date shown in Table 1: Schedule , the Applicant must notify via email the CO at:
Email: [email protected] email subject should read:
“Web Portal Account Instructions not Received – (insert Public Entity Name)”
The email should read as follows:“This is to notify the FAA that access instructions to the UASTSS Web Portal have not been received. The Applicant should attach evidence of the original email including time stamp and the following original information:Public Entity Name:Contact Name:Email:Phone Number:”
8.2.5 The Applicant is responsible for developing a working knowledge of the UASTSS Web Portal prior to submission designated due dates. The Applicant must use a Microsoft Explorer web browser to access the web portal. Firefox, Safari or other browsers cannot be used. This includes the Question Submission Form; Volume I Identification of Applicant Form and the Applicant Discrete Secure Volume Submission Folders. Test documents may be uploaded to the Volume Submission Folders and deleted by the Applicant before the Volume designated due date.
8.2.6 The Web Portal Home Page has your Five Letter Designator (XXXXX) below the “Questions and Concerns” area. This designator is unique to the Applicant and
DTFACT-13-R-00002Amendment 04March 20, 2013
Page 11 of 70
must be used in the file naming conventions for submissions as shown in Table 3and Table 4.
8.2.7 On the Web Portal Home Page on the left side, there is an option for “Site Help”. Click on this option and you will be directed to detailed instructions on the features of and using the UASTSS Web Portal.
8.2.8 If the Applicant is unable to gain access to the UASTSS Web Portal the Applicantmust notify via email the CO at:
Email: [email protected] email subject should read:
“Issue with UASTSS Web Portal Access – (insert Public Entity Name)”The email should read as follows:
“This is to notify the FAA of the following issue with respect to the UASTSS Web Portal Access by (insert Public Entity Name) Describe the nature of the issue Include the following information:
Public Entity Name:Contact Name:Email:Phone Number:”
8.2.9 In the event of a UASTSS Web Portal outage, the FAA will notify Applicants via email from the [email protected] or [email protected].
8.2.10 In the event that an Applicant finds that one of the features on the UASTSS Web Portal is not functioning or there is an outage on which the FAA has not advised the Applicants, the Applicant must notify via email the Contracting Officer at:
Email: [email protected] email subject should read:“Functionality or outage with UASTSS Web Portal – (insert Public Entity Name)”The email should read as follows:“This is to notify the FAA that the UASTSS Web Portal is not functioning (specify problem) or is unavailable as of (insert date and time).
Public Entity Name:Contact Name:Email:Phone Number:”
8.2.11 All SIR questions, concerns and clarifications must be submitted via the UASTSS Web Portal Question Submission Forms described in 8.3 Place, Date, Time, and Format for Submission of Proposals.
DTFACT-13-R-00002Amendment 04March 20, 2013
Page 12 of 70
8.2.12 The author of each question will only be seen by the Government. The FAA intends to make all questions, concerns and clarifications visible (without the author’s identification or any proprietary information) to Applicants through the UASTSS Web Portal. Identifying information will be redacted prior to posting on the UASTSS Web Portal. Questions and associated answers determined to be proprietary (non-redactable) will be viewable only to the Applicant via their discrete web site.
8.2.13 User activity on the Web Portal is logged for security purposes. In the event that, an Applicant is able to access another entity’s data/files, the Applicant shall immediately notify the CO via email. Accessing, viewing and/or opening the data/files of other entities could result in the Applicant’s proposal being rejected.
If the Applicant is able to access another entity’s data/files, the Applicant must notify via email the CO at:
Email: [email protected] email subject should read:
“Unauthorized access to entity on UASTSS Web Portal– (insert Public Entity Name)”
The email should read as follows:“This is to notify the FAA that (insert Public Entity Name) has a document(s) on its Web Portal which is not a document(s) originated by the Applicant. The document(s) is located in: (provide location of document on the Web Portal) and the file name is: (provide file name).”
In the event that the FAA needs to contact me regarding this email, I can be reached at the following telephone number: (Provide telephone number).”
8.2.14 Each question submitted to the FAA will be assigned a unique identification number. These numbers will not be sequential on the Applicant’s site and the FAA Public Questions and Answers sites.
8.2.15 A question is submitted by clicking on the SAVE&CLOSE button. That action will take the applicant back to the prior page. The Applicant should not use the browser arrows to navigate in the UASTSS Web Portal.
8.2.16 If an Applicant needs further clarification on a previously submitted question, the Applicant should refer to that question by its identification number. Applicantsmust review previous questions to ensure that the same question or questions have not already been addressed.
8.2.17 It is the intention of the FAA to respond to all written inquiries in writing.Answers will be provided prior to the required date for Volume submittal of the Applicants’ proposal via the UASTSS Web Portal.

DTFACT-13-R-00002Amendment 04March 20, 2013
Page 13 of 70
8.2.18 The FAA reserves the right to not answer any question(s) received outside of the timeframes set out above. Furthermore, Applicants must note that the proposal due date will not be extended on the basis of questions received.
8.2.19 The FAA will not provide verbal responses to Applicant questions, concerns, or clarification requests initiated via Applicant telephone calls or in any other manner than described above.
8.2.20 The Applicant understands that in the event that an Applicant withdraws from the selection process or a Volume submission is not made by the designated due date, access to the UASTSS Web Portal may be terminated.
8.3 Place, Date, Time, and Format for Submission of Proposals8.3.1 Questions, concerns, and clarifications relevant to Volumes I through VII must be
submitted by the designated due dates in Table 1: Schedule via the UASTSS Web Portal “My Questions” submission form.
8.3.2 Each question, concern, or clarification must be submitted separately. The Applicant must submit a question using the “SUBMIT” button before closing the “My Questions” form, or the question will not be submitted.
8.3.3 Answers to the questions, concerns, and clarifications relevant to Volumes I through Volume VII will be posted to the UASTSS Web Portal “PublicAnswers”. Questions and their associated answers determined to be proprietary will be viewable only to the Applicant via their discrete web site. Answers will be posted by the designated due dates in Table 1: Schedule.
8.3.4 All Applicants must submit Volume I - Attachment 2 and Volumes II through VIIsubmissions via the Applicant discrete secure Volume Submission Folders.
8.3.5 Proposals must be submitted in accordance with the staggered scheduleestablished in Table 1: Schedule.
8.3.6 Prior to 2:00 PM EST/EDT (as applicable) on the submission dates, Applicantsare permitted to edit documents posted to their Applicant Volume Submission Folders however, at 2:01PM EST/EDT (as applicable) on the submission dates,all assigned Applicant sites for the appropriate Volume will be locked down and become read only sites.
8.3.7 The FAA will not accept any submission made by facsimile, telex, telegraph, or similar devices; nor will paper copies be accepted.
8.3.8 If the CO or her designated representative(s) does not receive a proposal by the specified date and time, it will not be evaluated. Applicants assume full responsibility for ensuring that proposals are submitted not later than the date and time specified in Table 1: Schedule.
8.3.9 DELETED
DTFACT-13-R-00002Amendment 04March 20, 2013
Page 14 of 70
8.3.10 Proposals must be complete and conform to the instructions in this SIR;incomplete proposals or proposals which contain any deviations may result in the exclusion of such proposals from further consideration. General statements that the Applicant understands the requirements of the work to be performed, or simple rephrasing or restating of the FAA’s requirements, will not be considered adequate and will result in lower assessments or may be cause for rejection of the proposal in its entirety.
8.3.11 All proposals will be initially screened for completeness, accuracy and timeliness. Alternate proposals are not authorized, and the FAA will not evaluate any alternate proposal received.
8.3.12 It is the Applicant’s responsibility to ensure the completeness of the proposal. The evaluation of proposals will only be conducted on the basis of the information contained in the written proposal. The Government will not assume that an Applicant possesses any capabilities not specified in the written proposal.
8.3.13 It is the Applicant’s responsibility to ensure their required response information is provided within the relevant Volumes as the Government requested. The Government will not be responsible for looking elsewhere within the proposal for information that is required as part of a particular Volume.
8.3.14 The FAA will only evaluate information relative to each section. Applicants must restrict responses to information relative to that Volume and subsidiary Section. The Applicant must respond to each Volume in the order identified by the FAA for each topic and subtopic.
8.3.15 The Applicant must submit a response to this SIR by the following electronic means:
8.3.15.1 Electronic upload to the Applicant discrete secure Volume Submission Folders on the UASTSS Web Portal. The Applicant’s submission must be completely uploaded to the Folders by the time specified in the SIR.
Note: When uploading a document to a Volume Submission Folder be certain that the “Overwrite existing files” box is checked.
8.3.15.2 Except where noted otherwise, all submissions must be submitted as docx files (Microsoft® Word 2010 Office Open XML Document format). If the Applicant has an earlier version of Microsoft® Word, the following is a hyperlink to instructions for converting files to the docx format: http://www.microsoft.com/en-us/download/details.aspx?id=3.
8.3.15.3 Electronic submissions will be the only means by which proposals will be accepted by the FAA.
8.3.15.4 The FAA may decline to consider electronic Submissions that do not: include all required information, follow the required submission format, and versions, or meet all of the terms, conditions and provisions of the SIR.
DTFACT-13-R-00002Amendment 04March 20, 2013
Page 15 of 70
8.3.15.5 The FAA may decline to consider Submissions that do not follow the naming convention defined in Table 3 and Table 4.
8.3.15.6 Word documents must be in Read Only mode (with no password) by utilizing the “Protect Document” feature.
8.3.15.7 For all Microsoft Word submissions: Pages must be 8-1/2 x 11 inches. The font type must be Times New Roman and size 12-point with a single linespace. The exception is for embedded charts, graphs and pictures for which the font size must be no less than 8-point. All Top, Bottom, Left and Right Margins are to be 1”. Foldouts are permissible but count as two (2) pages each (i.e. 11 x 17 inches).
8.3.16 Where signatures or PDFs are required, the electronic format must be a scanned,searchable PDF.
8.3.17 The proposal must be signed by an official who is legally authorized to negotiate on behalf of the Applicant and who is legally authorized to enter into an Agreement. Volume I, Attachment 2, Certification of Applicant must be submitted and will certify this authority for information contained within all Volumes submitted.
8.3.18 Labeling – An electronic cover sheet must be provided for each document over two pages submitted, which clearly identifies each Volume number and document file name prescribed in Table 3 and Table 4, solicitation number, and the Applicant's name. This sheet must be part of each submitted Volume, as opposed to a separate file and will not count against any page limitations. Electronic auto generated and linked Table of Contents, Table of Tables, Table of Graphs, and Table of Figures must be provided and will not count against any page limitations. Each section within a Volume must be consecutively numbered.
8.3.19 A list of Acronyms must be provided at the end of each Volume III-VII which will not count against any page limitations. The naming conventions for these submissions are provided in Table 3.
8.3.20 Within each Applicant’s electronic submission, all proposal Volumes and sections within each Volume must be clearly identified. Discrete Applicant Web Portal Sites consist of Volume Submission Folders.
8.3.21 Failure to comply with the requirements of this section may result in the Applicant’s proposal being rejected.
8.3.22 The Applicant’s proposal must comply with Table 3 and Table 4.
DTFACT-13-R-00002Amendment 04March 20, 2013
Page 16 of 70
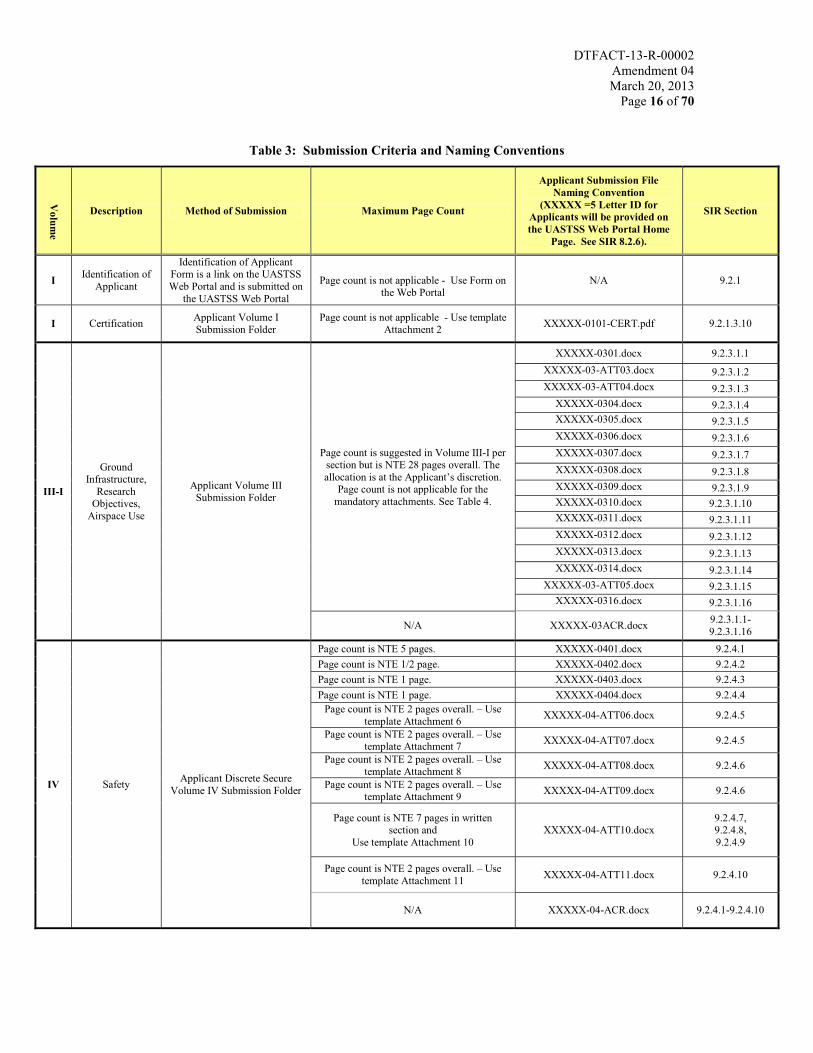
Table 3: Submission Criteria and Naming Conventions
Volum
e
Description Method of Submission Maximum Page Count
Applicant Submission File Naming Convention
(XXXXX =5 Letter ID for Applicants will be provided on the UASTSS Web Portal Home
Page. See SIR 8.2.6).
SIR Section
I Identification of Applicant
Identification of ApplicantForm is a link on the UASTSS Web Portal and is submitted on
the UASTSS Web Portal
Page count is not applicable - Use Form on the Web Portal
N/A 9.2.1
I Certification Applicant Volume I Submission Folder
Page count is not applicable - Use templateAttachment 2 XXXXX-0101-CERT.pdf 9.2.1.3.10
III-I
Ground Infrastructure,
Research Objectives,
Airspace Use
Applicant Volume III Submission Folder
Page count is suggested in Volume III-I per section but is NTE 28 pages overall. The allocation is at the Applicant’s discretion.
Page count is not applicable for the mandatory attachments. See Table 4.
XXXXX-0301.docx 9.2.3.1.1XXXXX-03-ATT03.docx 9.2.3.1.2XXXXX-03-ATT04.docx 9.2.3.1.3
XXXXX-0304.docx 9.2.3.1.4XXXXX-0305.docx 9.2.3.1.5XXXXX-0306.docx 9.2.3.1.6XXXXX-0307.docx 9.2.3.1.7XXXXX-0308.docx 9.2.3.1.8XXXXX-0309.docx 9.2.3.1.9XXXXX-0310.docx 9.2.3.1.10XXXXX-0311.docx 9.2.3.1.11XXXXX-0312.docx 9.2.3.1.12XXXXX-0313.docx 9.2.3.1.13XXXXX-0314.docx 9.2.3.1.14
XXXXX-03-ATT05.docx 9.2.3.1.15XXXXX-0316.docx 9.2.3.1.16
N/A XXXXX-03ACR.docx 9.2.3.1.1-9.2.3.1.16
IV Safety Applicant Discrete Secure Volume IV Submission Folder
Page count is NTE 5 pages. XXXXX-0401.docx 9.2.4.1Page count is NTE 1/2 page. XXXXX-0402.docx 9.2.4.2Page count is NTE 1 page. XXXXX-0403.docx 9.2.4.3Page count is NTE 1 page. XXXXX-0404.docx 9.2.4.4
Page count is NTE 2 pages overall. – Use template Attachment 6 XXXXX-04-ATT06.docx 9.2.4.5
Page count is NTE 2 pages overall. – Use template Attachment 7 XXXXX-04-ATT07.docx 9.2.4.5
Page count is NTE 2 pages overall. – Use template Attachment 8 XXXXX-04-ATT08.docx 9.2.4.6
Page count is NTE 2 pages overall. – Use template Attachment 9 XXXXX-04-ATT09.docx 9.2.4.6
Page count is NTE 7 pages in written section and
Use template Attachment 10XXXXX-04-ATT10.docx
9.2.4.7,9.2.4.8,9.2.4.9
Page count is NTE 2 pages overall. – Use template Attachment 11 XXXXX-04-ATT11.docx 9.2.4.10
N/A XXXXX-04-ACR.docx 9.2.4.1-9.2.4.10
DTFACT-13-R-00002Amendment 04March 20, 2013
Page 17 of 70
Volum
e
Description Method of Submission Maximum Page Count
Applicant Submission File Naming Convention
(XXXXX =5 Letter ID for Applicants will be provided on the UASTSS Web Portal Home
Page. See SIR 8.2.6).
SIR Section
V Experience Applicant Volume V Submission Folder
Page count is NTE 5 pages in written section and NTE 7 pages overall. – Use
templateAttachment 12
XXXXX-05-ATT12.docx 9.2.5
N/A XXXXX-05-ACR.docx 9.2.5
VI
Risk Consideration –Planned Team
Composition and Capabilities
Applicant Volume VI Submission Folder
Page count is NTE 2 pages. XXXXX-0601.docx 9.2.6.1
Page count is NTE 1 page. XXXXX-0602.docx 9.2.6.2
N/A XXXXX-0603.docx 9.2.6.3
N/A XXXXX-06-ACR.docx 9.2.6.1-9.2.6.3
VII Economic Impact Applicant Volume VII Submission Folder
Page count is NTE 8 pages. XXXXX-0701.docx 9.2.7
N/A XXXXX-07-ACR.docx 9.2.7
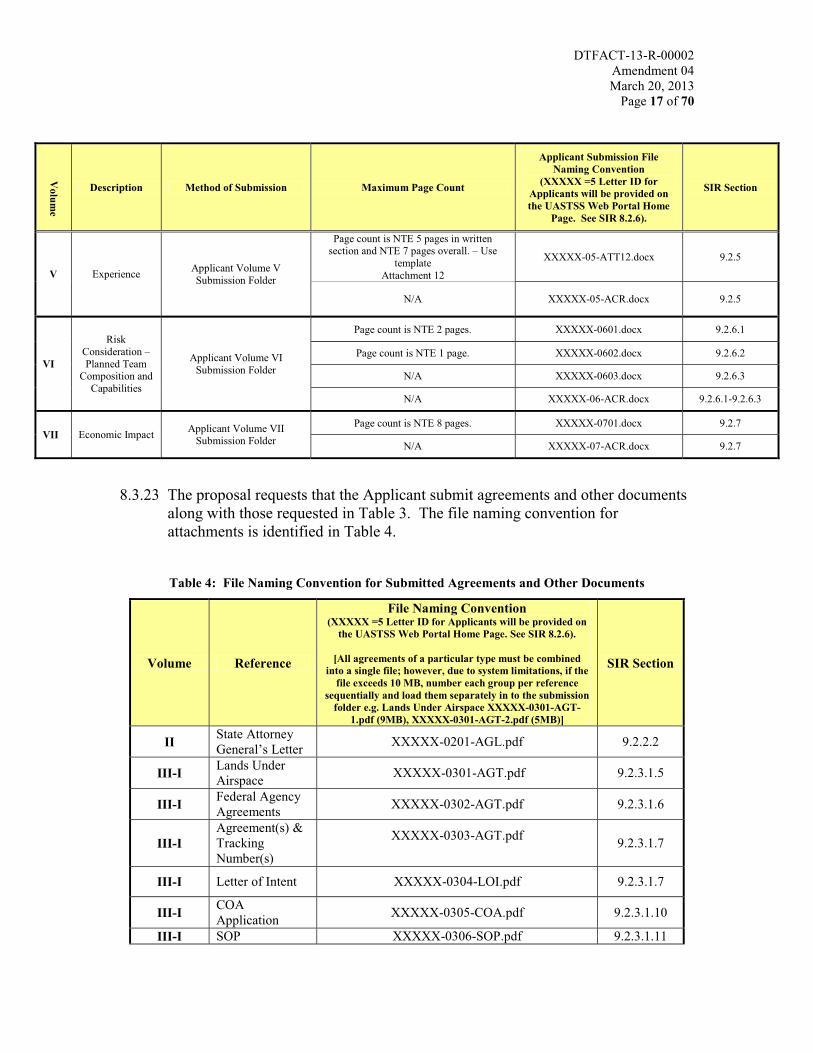
8.3.23 The proposal requests that the Applicant submit agreements and other documents along with those requested in Table 3. The file naming convention for attachments is identified in Table 4.
Table 4: File Naming Convention for Submitted Agreements and Other Documents
Volume Reference
File Naming Convention(XXXXX =5 Letter ID for Applicants will be provided on
the UASTSS Web Portal Home Page. See SIR 8.2.6).
[All agreements of a particular type must be combined into a single file; however, due to system limitations, if the
file exceeds 10 MB, number each group per reference sequentially and load them separately in to the submission
folder e.g. Lands Under Airspace XXXXX-0301-AGT-1.pdf (9MB), XXXXX-0301-AGT-2.pdf (5MB)]
SIR Section
II State Attorney General’s Letter XXXXX-0201-AGL.pdf 9.2.2.2
III-I Lands Under Airspace XXXXX-0301-AGT.pdf 9.2.3.1.5
III-I Federal Agency Agreements XXXXX-0302-AGT.pdf 9.2.3.1.6
III-IAgreement(s) & Tracking Number(s)
XXXXX-0303-AGT.pdf 9.2.3.1.7
III-I Letter of Intent XXXXX-0304-LOI.pdf 9.2.3.1.7
III-I COA Application XXXXX-0305-COA.pdf 9.2.3.1.10
III-I SOP XXXXX-0306-SOP.pdf 9.2.3.1.11

DTFACT-13-R-00002Amendment 04March 20, 2013
Page 18 of 70
Volume Reference
File Naming Convention(XXXXX =5 Letter ID for Applicants will be provided on
the UASTSS Web Portal Home Page. See SIR 8.2.6).
[All agreements of a particular type must be combined into a single file; however, due to system limitations, if the
file exceeds 10 MB, number each group per reference sequentially and load them separately in to the submission
folder e.g. Lands Under Airspace XXXXX-0301-AGT-1.pdf (9MB), XXXXX-0301-AGT-2.pdf (5MB)]
SIR Section
III-I Environmental Studies XXXXX-0307-ENV.pdf 9.2.3.1.12.1
III-I Local Facility Agreement(s) XXXXX-0308-AGT.pdf 9.2.3.1.15.1
VI Teaming Agreements XXXXX-0601-AGT.pdf 9.2.6
VI Letters of Intent XXXXX-0602-LOI.pdf 9.2.6.2VII Attestations XXXXX-0701-ATT.pdf 9.2.7
8.4 DiscussionsThe FAA may enter discussions with one or more Applicants regarding their submission(s) without entering into discussions with others or all Applicants. The scope of these discussions may explore, but not be limited to, various topics, options, issues, and/or opportunities that result from this SIR, and are in the best interest of the FAA UAS Test Site Selection process.
9 SITE SELECTION EVALUATION
A Site Selection Evaluation Board (SSEB) was formed for this selection process due to the nature of the solicitation. The membership of the SSEB consists of executives and leaders throughout the agency that have an interest in the Test Site Selection process. The SSEB will make award recommendations to the Site Selection Official (SSO). The CO serves as the business advisor to the SSO. The SSO, using sound business judgment, will review the recommendations, instructing the SSEB where necessary if additional information or analysis is required. The SSO will submit final recommendations to the Administrator who will, after due consideration, issue one or more Orders designating each UAS Test Site Operator.
9.1 Technical Evaluation The desired outcome of the technical evaluation is to identify a series of potential Test Sites to the SSO. Per the FMRA of 2012, consideration of geographic diversity, climatic diversity, and location of ground infrastructure and research needs are specificallymandated. Determination of the Test Sites will include:
• Overall ranking (inclusive of Volumes III – VI);• Geographic diversity;

DTFACT-13-R-00002Amendment 04March 20, 2013
Page 19 of 70
• Climatic diversity;• The location of ground infrastructure; and • Research needs.
The combined attributes of all the Test Sites should provide an environment and opportunities to test UAS. Each Test Site would not necessarily need to be identical, nor would each Test Site need to have all attributes. However, these attributes should be present in the aggregate of all the Test Sites.
9.2 Proposal Specific Instructions9.2.1 Volume I – Identification of Applicant
The FAA’s UAS Integration Office web site contains a broad range of information on UAS and can be accessed through the following URL: http://www.faa.gov/about/initiatives/uas/.
9.2.1.1 Applicants must complete Volume I in its entirety. There are two submissions:Attachment 1 – Identification of Applicant and Attachment 2 – Certification.
9.2.1.2 Attachment 1 – The Identification of Applicant form is completed via a link named “Identification Form” on the UASTSS Web Portal.
9.2.1.3 Attachment 1 – The Identification of Applicant form includes Applicantinformation, Test Range Information, and Team Member Information.
9.2.1.3.1 Federal Agencies may not act as Applicant (proponent) or Team Members (partners) on proposals.
9.2.1.3.2 The location attributable to the Team Members are those sites correlated to the assets (personnel or aircraft or stations; etc.) that will be employed. The location does not mean corporate headquarters or divisional offices unless said offices are co-located with the assets intended to be used. An Applicant is to use the asset's ultimate location.
9.2.1.3.3 The Volume I Identification of Applicant form is the ONLY formcompleted via the UASTSS Web Portal. This is the only Volume submission that is not uploaded into a Volume submission folder.
9.2.1.3.4 The Applicant can save all information; close the form; and return to the form later to change or complete the information.
9.2.1.3.5 Additional Range Locations and Team Members can be added by clicking the button on the bottom left of the respective tab.
9.2.1.3.6 Attachment 1 requires the entry of the latitude and longitude coordinate(s) of the centerpoint(s) of any airspace to be included as part of the range(s). The format for the entry is Decimal Degrees to four decimal places based on the WGS84 reference system, for example: longitude -97.1971, latitude 32.3971. Enter latitude first and longitude second.

DTFACT-13-R-00002Amendment 04March 20, 2013
Page 20 of 70
9.2.1.3.7 A Test Range location and/or Team Member can be deleted by using the drop down arrow to the left of the Test Range Name and Team Member Name respectively.
9.2.1.3.8 The Applicant must submit the form using the SAVE button on the bottom right corner of the form on the Team Member Information tab. A click on the SAVE button will verify that all information has been properly entered into the required fields. If the CLOSE button is used before the SAVE button, the information on the form will not be saved.
9.2.1.3.9 The form will automatically be changed to a read only view at 2:01 PM EST on the designated due date in Table 1.
9.2.1.3.10 Applicants must also complete Attachment 2 Certification of Applicant.This attachment must be completed, signed, scanned, and uploaded to the Volume I submission folder using the naming convention designated in Table 3. (XXXXX-0101-CERT.pdf).
9.2.1.4 The Volume I submission will be assessed to ensure that all required information was provided and assigned a complete/incomplete assessment.
9.2.1.5 An overall evaluation of the Volume I submissions will be made to determine if there is a sufficient number of Applicants responding to the SIR.
9.2.1.6 As required by the FMRA of 2012 the FAA will evaluate climatic and geographic diversity using FAA Geographical Information System (GIS) tools and other resources. This tool may also be used in the Technical Evaluation Report (TER).
9.2.1.7 Responses to Volume I, Attachment 1 will assist the Technical Evaluation Team (TET) Lead in the determination of the number of necessary evaluators. Based upon the number of responses, the technical evaluation may be broken into separate evaluation groups predicated on assigned attributes.
9.2.2 Volume II – SIR Compliance Criteria
An Applicant must be compliant with all elements identified in Volume II. If at any time, in any Volume submission, the Applicant is found non-compliant with the SIR requirements contained in this Volume II, the FAA will disqualify the Applicant from competition.
9.2.2.1 As stated in 9.2.1.3.1, Federal Agencies may not act as Applicant or Team Members on proposals submitted.
9.2.2.2 The Applicant must be a public entity and have the ability to qualify for a COA
“A public entity is defined as follows:(A) any State or local government;(B) any department, agency, special purpose district, or other instrumentality of a State or States or local government; and

DTFACT-13-R-00002Amendment 04March 20, 2013
Page 21 of 70
(C) the National Railroad Passenger Corporation, and any commuter authority.”3
Public Entity Validation: The Applicant must provide a letter from the State Attorney General’s Office confirming that the Applicant is a Public Entity. This letter is to be submitted in Submission Volume Folder II by the designated due date. (XXXXX-0201-AGL.pdf)
9.2.2.3 The Applicant’s Team must have a minimum of five (5) years, within the past 7 years, of aviation research and development (R&D) experience.
9.2.2.4 The Applicant’s Team must have at least one (1) year of UAS experience within the last five (5) years. The one year of UAS experience may be counted as part of the five (5) years R&D experience identified in Section 9.2.2 3.
9.2.2.5 The Applicant’s airspace must not include, or abut, any Class B airspace. Any airspace proposed by the Applicant must allow for operations for launch and recovery within the confines of the proposed Test Site airspace. Must either own, or have land use agreements for the proposed launch and recovery site.
Note: This Section will be validated against the airspace(s) submitted in response to Volume III.
9.2.2.6 The Applicant’s Test Range(s) submitted in Volume III must be sufficient for FAA safety and efficiency determinations to protect persons and property on the ground.
9.2.2.7 The Applicant must be found Feasible or Feasible with Limitations as defined in Volume III.
9.2.3 Volume III – Ground Infrastructure, Research Objectives, and Airspace Use and ATC Feasibility Study
Each proposed UAS Test Site will have airspace (range(s)) and associated land and ground infrastructure (combined Test Site) within which UAS research operations will be conducted. In this Volume the FAA will be assessing Test Site proposals relative to safety, impact on NAS efficiency, environmental concerns, and the ability to manage off-nominal (e.g., not normal operations) situations to determine the viability of the Test Site for UAS research goals and UAS opportunities. While preserving opportunities toaccommodate unique entrepreneurial efforts, the FAA believes that Test Sites need to include focal areas to ensure that research is accomplished in each of the areas identified as a major obstacle to UAS NAS integration. These focal areas include, but are not limited to: UAS system safety and data gathering; UAS aircraft certification; UAS command and control link issues; UAS control station layout and certification; UAS ground and airborne sense and avoid research; and, any environmental impacts associatedwith the operation of UAS in the NAS.
3 Vartinelli v. Stapleton, 2009 U.S. Dist. LEXIS 88553 ( E.D. Mich. Aug. 3, 2009)
DTFACT-13-R-00002Amendment 04March 20, 2013
Page 22 of 70
Volume III contains Sub-Volumes I and II. Sub-Volume I represents airspace definition evaluated and scored against research centric objectives and requirements. Sub-Volume II are factors considered in an independent Air Traffic Control (ATC) Feasibility Study.
The following will be used to evaluate Sub-Volume I:
� How well research goals align with the overarching goal of safely integrating UAS into the NAS;
� If the Applicant has a diverse set of research goals (broad in scope) or focused research objective(s) (narrow, but deep in scope);
� If the goals are realistic and achievable and aligned to the Applicant's proposal; and
� The completeness and thoroughness of the narrative.
The independent ATC Feasibility Study assessment in Volume III Sub-Volume II will be based on the Applicant’s submissions in Volume III Sub Volume I. Sub Volume II has no submission requirement for the Applicant. The result of the Feasibility Study assessment by the FAA will be the determination that the airspace being proposed for the Test Site is either Feasible; Feasible with Limitations; or Not Feasible. If the proposed airspace is Feasible with Limitations, the Test Site is eligible for award contingent upon the Applicant agreeing to specific OTA requirements for compliance. Test Site proposals with airspace that is determined to be Not Feasible will be ineligible for award.
9.2.3.1 Sub-Volume I - Ground Infrastructure, Research Objectives, and Airspace Use
Proposed and surrounding airspace will be assessed to include airspace for movement to and from the range(s), to include Special Activity Airspace (SAA). The FAA will consider the following factors including, but not limited to:
9.2.3.1.1 What are the research goals and objectives for the proposed UAS Test Site? (XXXXX-0301.docx). NTE 2 pages.
Note: Does the Applicant have well-defined research goals? How well do the research goals align with the overarching goal of safely integrating UAS into the NAS? Does the Applicant have a diverse set of research goals (broad in scope) or focused research objective(s) (narrow, but deep in scope)? Are the goals realistic and achievable and aligned to the proposal? The completeness and thoroughness of the narrative impacts the value of the score.
9.2.3.1.2 Provide the Airspace Use Plan that describes how you will safely integrate UAS into the NAS. (XXXXX-03-ATT03.docx). NTE 8 pages.
Note: Does the Applicant have a well-defined Airspace Use Plan that indicates the Applicant can safely and efficiently coordinate flight operations with controlling facilities? Overall, does the Airspace Use Plan safely allow for operational test andevaluation? Does the Airspace Use Plan support proposed research activities; and,

DTFACT-13-R-00002Amendment 04March 20, 2013
Page 23 of 70
how is it adaptable to changes over time, including research, airspace, ground infrastructure, and UAS types and operations?
9.2.3.1.2.1 Describe plans for communicating with the FAA to include controlling and adjacent facilities with respect to airspace activation, sectorization,and emergency events such as lost communication, lost-link, “fly-away”,and in-flight mishap (avionics failure, payload loss, control function loss, bird strike, etc.).
9.2.3.1.2.2 Describe plans for providing protection of UAS Test Site operations to ensure non-interference with other types of operations within the proposed Test Range airspace. Other types of operations may include,but are not limited to VFR/IFR flights, flight schools, gliders, parachuting, controlled firing, Commercial Space, laser operations, balloons, adjacent airports, and instrument approach and/or departure procedures. Plans should include:
a. Procedures to handle “fly-away” aircraft within the proposed Test Range airspace during UAS flight operations; andb. Considerations for avoidance of wild fowl migration patterns (if any).
9.2.3.1.2.3 Describe plans to prevent UAS from flying into surrounding airspace outside of the proposed Test Range airspace boundary(ies) to include scenarios such as protection from “fly-away” aircraft and lost-link.
9.2.3.1.2.4 Describe plans for ensuring de-confliction of multiple flight paths in the event of two or more aircraft operating simultaneously within the proposed Test Range airspace to include multiple UAS. Plan details may address the following elements:
a. Entire route of flight for each UAS from launch to final recovery;b. Spectrum de-confliction;c. Lost-link maneuvers for all UAS being flown;d. Any changes in mode of communication or control of all UAS (for example, change of ground control station or change from piloted to remotely piloted control); ande. Procedures for all aircraft to follow in the event of a “fly-away”.
9.2.3.1.2.5 Describe plans for operational mitigation of obstacles, to include terrain (Line Of Sight obstacle, spectrum obstacle, and physical obstacle), wind farms, transmission towers, and tethering operations.
9.2.3.1.2.6 Describe plans to avoid and prevent loss of life or damage to persons or property on the ground in or in the vicinity of the proposed Test Range airspace. Plans should include:
DTFACT-13-R-00002Amendment 04March 20, 2013
Page 24 of 70
a. Identify all flight termination points if not included as normal recovery points;
b. Describe all UAS flight termination plans, including off-nominal events; and
c. Procedures to notify persons including local law enforcement officials when UAS will execute an unplanned flight termination procedure
9.2.3.1.2.7 Describe plans for community education and outreach to inform the local communities of activities to address concerns for noise, and other environmental issues.
9.2.3.1.2.8 Describe plans for evaluating environment effects, such as airport traffic patterns, instrument flight procedures, helicopter ingress and/or egress routes, and noise considerations.
9.2.3.1.3 Airspace definition and characterization.(XXXXX-03-ATT04.docx). NTE 3 pages, not including graphics. Graphics limited to one range(s) per page.
9.2.3.1.3.1 The Applicant must operate within domestic airspace and define it using the following format: What does the proposed airspace look like? [Latitude and longitude points for the notional airspace example shown in Figure 2 are provided in the decimal degrees format to four decimal places based on the WGS84 reference system. For example: latitudexx.yyyy, longitude -xx(x).yyyy. Provide latitude first and longitude second for each point.] What are the proposed floor and ceiling (altitudes) of the range(s)? Include any proposed airspace stratification. [Altitude ceilings and floors above 17,999 feet in the notional example are shown by flight level (e.g. flight level (FL)180 for 18,000 feet). Except when noted, all altitudes are above mean sea level (MSL).] Submission must include airspace boundaries defined by altitude, latitude and longitude, a graphical depiction on current FAA visual flight rules (VFR) Sectional chart (as of date of SIR issuance), and optionally, may include a 3D depiction of the proposed and surroundingairspace. Use of cartographic supplements in addition to aeronautical charts is encouraged.
Note: Does the submittal follow the format provided?
See examples in Figure 3 and Figure 4.

DTFACT-13-R-00002Amendment 04March 20, 2013
Page 25 of 70
Figure 3: Example Sketch of Proposed Test Site Airspace with Lateral and Vertical Boundaries
Figure 4 provides an example for describing the Test Range(s) airspace including lateral plan and vertical profile views.
DTFACT-13-R-00002Amendment 04March 20, 2013
Page 26 of 70
Figure 4: Example Description of Proposed Test Range(s) Airspace
9.2.3.1.3.2 Describe how the proposed airspace will support the research goals identified in 9.2.3.1.1. What are the planned types of operational elements such as UAS platform(s), flight paths, altitudes, loitering areas, types of maneuvers, launch and recovery process, maritime capability, and climatic diversity (if any), and UAS performance characteristics such as speeds, e.g., supersonic, subsonic, very slow <90kts, etc.
Note: Does the proposed airspace appear to be capable of supporting the research goals? For example, if the research includes the need to use high(er)-altitude, high(er)-speed aircraft, does the airspace appear capable of handling these types of operations? A description that demonstrates that the Applicantunderstands how the proposed airspace identified will achieve the research goals and objectives identified in 9.2.3.1.1 warrants a higher score. The completeness and thoroughness of the narrative impacts the value of the score.
9.2.3.1.3.3 What is the anticipated number of concurrent UAS operations within the Test Site (maximum, median, and average per frequency of use)? Based on the size of the range(s), does this meet requirements for planned concurrent operations to support proposed research?
Note: Does the proposed airspace appear to be capable of supporting the research goals? For example, if the research includes the need to handle the anticipated number of concurrent UAS/aircraft operations, does the proposed airspace appear to be capable of supporting that?
A description that demonstrates that the Applicant understands how the proposed airspace identified will achieve the research goals and objectives identified in 9.2.3.1.1 warrants a higher score. The completeness and thoroughness of the narrative impacts the value of the score.
9.2.3.1.3.4 What are the proposed hours/days/seasons/frequency of operations?
Note: Use of the Test Site must be commensurate with the proposed research activities. For example, access to the range(s) must be more than simply two (2) hours after midnight on a weekly basis. Those Applicants that present a schedule that completely meets both identified research activities AND provides for the most use of the range(s) would receive the highest score. The completeness and thoroughness of the narrative impacts the value of the score.
9.2.3.1.4 Describe how any unique characteristics of the proposed location (e.g., terrain; prevailing weather conditions; proximity to water; environmental factors affecting ground and airspace) are factors for achieving the research goals identified in 9.2.3.1.1). (XXXXX-0304.docx.). NTE 1 page.
DTFACT-13-R-00002Amendment 04March 20, 2013
Page 27 of 70
Note: A description that demonstrates that the Applicant understands how the unique characteristics of the proposed location will achieve the research goals and objectives identified in 9.2.3.1.1 warrants a higher score. The completeness and thoroughness of the narrative impacts the value of the score.
9.2.3.1.5 What Federal, State, and/or Tribal Lands exist underneath the proposed airspace? Provide a graphical chart. Are there existing agreement(s) or agreement(s) in process between the Applicant and the land owner for use? If yes, provide the agreement tracking number(s) and a copy of the agreement(s) as an attachment. What percentage of the land underlying the proposed Test Site is owned by the Applicant? Do land use agreement(s) (other than those previously identified) exist for any portion of the land not owned by the Applicant that require such agreement(s)? If a land use agreement(s) exists, provide a copy of the agreement(s) as an attachment (other than those previously identified). If land use agreement(s) do not exist, define agreement status (i.e. planned, in process, currently negotiated but not executed, etc.).
(XXXXX-0305.docx). NTE 2 pages, not including graphics. Graphics limited to one range(s) per page. (XXXXX-0301-AGT.pdf)
Note: Resources such as http://nationalatlas.gov/printable/fedlands.html#list may be used to support the proposal.
If land use agreements are in place, are there any restrictions? Further, what, if any liability is contained in these agreements? The highest score would be achieved where the Applicant has agreements, is held harmless from a liability perspective, and/or owns the land.
Note: A description that demonstrates that the Applicant understands how the land ownership or lease characteristics of the proposed location will achieve the research goals and objectives identified in 9.2.3.1.1 warrants a higher score. The completeness and thoroughness of the narrative impacts the value of the score.
9.2.3.1.6 Are there any existing or in process agreements with any Federal Agency [FAA, Department of Defense (DoD), National Aeronautics and Space Administration (NASA)] facilities to provide surveillance and/or communication services to the Test Site operator? If yes, describe them and provide a copy of the agreement. (See Table 4 for naming convention for agreements).(XXXXX-0306.docx.). NTE 1 page.(XXXXX-0302-AGT.pdf)
Note: A description that demonstrates that the Applicant understands how the surveillance and/or communication services identified in an agreement will achievethe research goals and objectives identified in 9.2.3.1.1 warrants a higher score. The completeness and thoroughness of the narrative impacts the value of the score.
DTFACT-13-R-00002Amendment 04March 20, 2013
Page 28 of 70
9.2.3.1.7 If an Applicant has any fully executed agreement(s) with federal agencies for UAS operations, they must be submitted as part of the proposal for UAS Test Sites. Applicants without a current agreement may submit a signed letter of intent (between both parties) to enter into such an agreement with their proposal. This will not prohibit Federal Agencies from using the Test Ranges for research once the ranges are established. Attach agreement(s).
What, if any, existing SAA is/are being proposed for use (provide graphical chart if any)? Are there existing agreement(s) or agreement(s) in process between theApplicant and the controlling agency for use of the existing airspace? If yes, provide the agreement tracking number(s) and a copy of the agreement(s) as an attachment. (See Table 4 for the naming convention of agreements and Letters of Intent.) Graphics limited to one range(s) per page and are not counted against suggested page counts.(XXXXX-0307.docx). NTE 1 page.(XXXXX-0303-AGT.pdf)(XXXXX-0304-LOI.pdf)
Note: A description that demonstrates that the Applicant understands how the proposed airspace identified in an agreement will achieve the research goals and objectives identified in 9.2.3.1.1 warrants a higher score. The completeness and thoroughness of the narrative impacts the value of the score.
If an Applicant has an existing, fully executed agreement for the use of airspace, and access to that airspace is not limited, this would receive a higher score than a proposal that does not use existing airspace with limited access. If the Applicanthas no agreement(s), this would be scored similar to one with limited access as the time to complete all required coordination could be lengthy.
In addition, resources such as http://sua.faa.gov/sua/siteFrame.app may be used to evaluate the proposal
9.2.3.1.8 Does any Applicant or Team Member have an(y) existing UAS COA(s) and/or UAS Certificate(s) of Airworthiness/Experimental Category (CA/EC)? If yes, provide the FAA issued number(s) and date(s) of issuance.
(XXXXX-0308.docx). NTE ¼ page.
Note: When was the COA issued? Is this a COA that has been renewed? If so, when was the original issued? An Applicant or Team Member that has held a COA, including renewals of the same COA would receive a higher score than a COA that has been issued for the first time. A description that demonstrates that the Applicant understands how the COA will achieve the research goals and objectives identified in 9.2.3.1.1 warrants a higher score. The completeness and thoroughness of the narrative impacts the value of the score.
DTFACT-13-R-00002Amendment 04March 20, 2013
Page 29 of 70
9.2.3.1.9 Does any Applicant or Team Member have an(y) expired UAS COA(s) and/or UAS CA/EC? If yes, provide the FAA issued number(s) and date(s) of issuance. (XXXXX-0309.docx). NTE ¼ page.
Note: The Applicant or Team Member may have a COA that just expired and was not renewed (no longer required, or combined into a new COA or UAS CA/EC, or rescinded). Those Applicants or Team Member that have an existing, current COA and one or more expired COAs will presumably have more experience and may receive a higher score. A description that demonstrates that the Applicant understands how a COA will achieve the research goals and objectives identified in 9.2.3.1.1 warrants a higher score. The completeness and thoroughness of the narrative impacts the value of the score.
9.2.3.1.10 Does any Applicant or Team Member have UAS COA(s) and/or UAS CA/EC application(s) in process? If yes, provide the date(s) submitted and a copy of the entire submission(s) as an attachment. (XXXXX-0310.docx). NTE ¼ page. (XXXXX-0305-COA.pdf)
Note: Those Applicants or Team Member that have a COA in process, predicated on previous COAs would receive a higher score than Applicant’s or Team Member that have never held a COA but have one in process. If the Applicant or Team Member has never held a COA and is not currently in the process of obtaining one, the Applicant would receive an unsatisfactory score.
9.2.3.1.11 Do UAS SOP and operational contingency plans exist for the Test Site in addition to content provided in the Airspace Use Plan? If so, provide a copy as an attachment.
(XXXXX-0311.docx). NTE 2 pages(XXXXX-0306-SOP.pdf). Ensure the effective date is listed.
Note: Ensure that SOPs have an effective date and either a next review/cancellation date. Has the Applicant addressed protocols on how and when to modify SOPs? Are fully executed agreements for contingency plan resources drafted, in place, or agreed to? Does the plan include off-site resources? Are the operational contingency plans developed for off-nominal and emergency situations in addition to those described in the Airspace Use Plan?
A description that demonstrates that the Applicant understands how the contingency planning will achieve the research goals and objectives identified in 9.2.3.1.1warrants a higher score. The completeness and thoroughness of the narrative impacts the value of the score.
9.2.3.1.12 National Environmental Policy Act (NEPA) compliance http://www.epa.gov/compliance/nepa/(XXXXX-0312.docx). NTE 2 pages.
DTFACT-13-R-00002Amendment 04March 20, 2013
Page 30 of 70
Note: Applicants that present completed environmental study(s) receive a higher score than Applicants with ongoing study(s). Findings of no significant impact (FONSI) are considered completed studies. Applicants conducting an environmental study(s) would receive a higher score than an Applicant that has not started one. Any Applicant that proposes airspace where known environmental concerns exist would receive the lowest score. Applicants with study(s) in progress would receive a higher score than those that have not started them.
A description that reflects the Applicant’s understanding of how the completed environmental studies will achieve the research goals and objectives identified in Section 9.2.3.1.1 warrants a higher score. The completeness and thoroughness of the narrative impacts the value of the score.
9.2.3.1.12.1 Do environmental studies (NEPA compliance) exist for the entire volume of the proposed Test Site? If yes, provide a copy of the each of the studies as an attachment. If no, are any studies in process? If yes, provide the reference number for the in process studies.(XXXXX-0307-ENV.pdf)
9.2.3.1.12.2 Are there any anticipated environmental issues caused by the Test Site(including local/State jurisdiction)? If anticipated, what is the likelihood that an environmental assessment is needed and can be completed within 180 days of OTA award?
9.2.3.1.13 If applicable, describe mitigation plans and identify resources for conducting Hazardous Materials (HAZMAT) operating procedures. (XXXXX-0313.docx). NTE 1 page.
Note: Applicants that provide plans and identify resources necessary for conducting HAZMAT operations will receive a higher score.
9.2.3.1.14 Declare if there are any local/State statute limitations that apply to the types of research being proposed.(XXXXX-0314.docx). NTE 1 page.
Note: Applicants that declare there are no local/State statutes limiting aircraft operations within the proposed Test Site area would be scored highest. Applicantsthat completely address all current and potential limitations and define how they will not affect Test Site operations would also receive the highest score. Applicantsthat completely address all current and potential limitations that could affect Test Site operations and include disclosure of any restrictions or limitations would receive a lower score.
9.2.3.1.15 Describe existing and planned Test Site infrastructure for conducting the proposed research including:(XXXXX-03-ATT05.docx). NTE 3 pages.
DTFACT-13-R-00002Amendment 04March 20, 2013
Page 31 of 70
9.2.3.1.15.1 Describe if the Applicant or any Team Member has existing fullyexecuted agreement(s) (e.g. Letters of Agreements (LOAs)) with the local facility (e.g. airport)? Attach copy of fully executed agreement(s).(XXXXX-0308-AGT.pdf)
9.2.3.1.15.2 Describe if the Applicant or any Team Member has approvals for existing Frequency Spectrum from Federal Communications Commission (FCC) or National Telecommunications and Information Administration (NTIA)? Provide allocation(s).
9.2.3.1.15.3 Describe all Communications, Navigation, and Surveillance (CNS) infrastructure planned to support the research defined in 9.2.3.1.1.
9.2.3.1.15.4 Physical/information security.
9.2.3.1.15.5 Hangars/buildings.
Note: This includes buildings for staff, for engineering modifications, ground control station, etc.
9.2.3.1.15.6 Describe the Test Site proximity to transportation infrastructure (e.g. are paved, gravel, or cleared roads available from the local highway to the Test Site?)
9.2.3.1.15.7 Describe if the Test Site includes a serviceable aerodrome(s), the associated attributes, and the availability of use [including Aircraft Rescue & Fire Fighting (ARFF)].
Note: Applicants that address all of the aforementioned items may receive a higher score than those that only cover a subset. Applicants that do not address any of those items could receive the lowest score. The Test Site infrastructure presented must match the proposed research activities.
9.2.3.1.16 Define how civil and/or public aircraft (manned and/or UAS) operations are supported by the proposed research goals and objectives. (XXXXX-0316.docx). NTE 2 pages.
9.2.3.1.16.1 Including potential research on mixed (manned and unmanned, public and civil) operations.
9.2.3.1.16.2 Including potential international vendors.
Note: The highest score would be received by an Applicant that can fully support research and test activities for both public and civil operations, mixed operations, and international vendors. Applicants not addressing all of these elements would receive a lower score based on how many of these elements are addressed and how this is covered in their research proposals. Applicants must ensure that access to the Test Site is provided equitably to any potential user. This extends to the use of the Test Site beyond the proposed Applicant’s Team Members.
Maximum Volume total available points: 40.
DTFACT-13-R-00002Amendment 04March 20, 2013
Page 32 of 70
9.2.3.2 Sub Volume II – Air Traffic Control (ATC) Feasibility Assessment
To determine the feasibility of using the proposed airspace identified by the Applicantto accomplish the defined UAS research goals, the FAA will perform an independent Air Traffic Control (ATC) Feasibility Assessment based on other volume submissions and independent sources/tools. The result of the assessment will be the determination that the airspace being proposed for the Test Site is either Feasible; Feasible with Limitations or Not Feasible. If the proposed airspace is Feasible with Limitations, the Test Site is eligible for award contingent upon the Applicant agreeing to specific OTA requirements for compliance. Test Site proposals with airspace that is determined to be Not Feasible will be ineligible for award.
Published FAA orders, rules, regulations, and procedures applicable to assessing the proposed utilization of airspace for UAS operations are readily available. Publications include, but are not limited to the following:
Order 1050.1 - Environmental Impacts: Policies and Procedureshttp://www.faa.gov/regulations_policies/orders_notices/index.cfm/go/document.information/documentID/13975
Order 7400.2 – Procedures for Handling Airspace Mattershttp://www.faa.gov/air_traffic/publications/atpubs/AIR/index.htm
Order 8260.19 - Flight Procedures and Airspacehttp://www.faa.gov/regulations_policies/orders_notices/index.cfm/go/document.information/documentID/888468
FAA Regulations - Title 14 CFRhttp://www.faa.gov/regulations_policies/faa_regulations/
Notice N 8900.207 - UAS Operational Approval http://www.faa.gov/regulations_policies/orders_notices/index.cfm/go/document.information/documentID/1020678
Federal Register – Notices and Proposed Rules https://www.federalregister.gov/
Considerations for the independent ATC Feasibility Assessment may include, but are not limited to the following:
9.2.3.2.1 Traffic density and mix within the proposed and surrounding Test Site airspace:
9.2.3.2.1.1 Traffic density: The historical air traffic operations within the proposed airspace and the affected NAS airspace volumes (e.g. en route sectors and terminal areas (if any)). The seasonal volumes, peak/non-
DTFACT-13-R-00002Amendment 04March 20, 2013
Page 33 of 70
peak/average traffic counts per day, by hour, by altitude, etc., traffic flows present, flow densities or rates, and flow characteristics (parallel, merging, diverging, etc.)
9.2.3.2.1.2 Traffic mix: Traffic in two sets of categories:
1. Type: turbojet, turboprop, or prop; commercial, general aviation (GA), or military.
2. Flights operating under VFR vs. instrument flight rules (IFR).
9.2.3.2.2 Within the proposed Test Site airspace and the surrounding airspace in order to assess potential impact of both nominal and off-nominal operations (e.g., a test range UAS “fly away”) on NAS safety and efficiency:
9.2.3.2.2.1 Airspace Classes.
9.2.3.2.2.2 SAA including Memorandums of Agreement (MOAs) and Restricted Areas.
9.2.3.2.2.3 Victor and Jet Routes, Q and T Routes, TK Routes, and other known routes such as Military Training Routes (MTRs).
9.2.3.2.2.4 Standard Instrument Departures (SIDs) and Standard Terminal Arrivals (STARs).
9.2.3.2.2.5 The impact to air traffic operations (e.g. traffic efficiency and traffic flows).
9.2.3.2.2.6 The local operational considerations (e.g. LOA; SOPs; Traffic Management Initiatives (TMIs); local procedures such as gliders and special operations).
9.2.3.2.2.7 ATC facility(ies) involved (Air Route Traffic Control Center (ARTCC); Terminal Radar Approach Control (TRACON); and/or Control Tower).
9.2.3.2.2.8 Airports affected by the proposed Test Site.
9.2.3.2.2.9 ATC contingency routes.
9.2.3.2.2.10 Surveillance and detection capabilities.
9.2.3.2.2.11 UAS pilot 2-way communications with ATC.
9.2.3.2.2.12 UAS contingency and emergency procedures.
9.2.3.2.2.13 UAS COA(s) currently active for the area.
9.2.3.2.2.14 Future airport construction within the next five years.
9.2.3.2.3 The surface characteristics underlying the proposed airspace including:
9.2.3.2.3.1 Population density: Confirming that none of the proposed airspace overlies any congested areas identified on FAA VFR Sectional charts.
DTFACT-13-R-00002Amendment 04March 20, 2013
Page 34 of 70
9.2.3.2.3.2 Loiter areas: Identifying items on the FAA VFR Sectional chart listed as no loitering areas, such as water sanitation and processing facilities.
9.2.3.2.3.3 Major interstate highways: Identifying heavily traveled roads to be avoided by UAS flight operations.
9.2.3.2.3.4 Federal and Tribal lands: Identifying and considering special provisions for airspace over lands such as National Parks, Native American lands, maritime sanctuaries, etc.
9.2.3.2.3.5 Public venues: Identifying major public venues to be avoided when populated.
9.2.3.2.3.6 Notice to Airmen (NOTAM) FDC 9/5151 Special Notice: Sporting Events. The FAA classifies the airspace defined in this NOTAM as 'National Defense Airspace'. All aircraft operations are prohibited within a 3 nautical mile (NM) radius up to and including 3000 FT above ground level (AGL) of any stadium having a seating capacity of 30,000 or more people.
9.2.3.2.3.7 Energy plants: Identifying and considering special provisions for airspace over power plants and other major energy facilities within 10NM.
9.2.3.2.3.8 Chemical plants and structures: Identifying and considering special provisions for airspace over structures such as petroleum refineries and above-ground pipelines within 10NM.
9.2.3.2.3.9 Underlying waterways/bodies of water: Identifying and considering special provisions for airspace overlying any heavily utilized large bodies of water or waterways within a 10NM radius of the proposed airspace.
9.2.4 Volume IV – Safety
The FAA will evaluate the reasonableness of the number of incidents correlated to the hours and number of flight operations. The FAA will verify that the Team Members identified in Volume IV match those of Volume VI to ensure consistency. Further, the Applicant’s identified resources must be available for this selection process.
9.2.4.1 Provide the processes and procedures planned for use to approve and monitor projects prior to conducting operational test and evaluation. These procedures and processes demonstrate your understanding of the certification requirements for the safe conduct of operations within the Test Site(s). (XXXXX-0401.docx). NTE 5 pages.
Note: The FAA will evaluate the reasonableness of the processes and procedures. A higher score will be received by those submissions that thoroughly address all system and aircraft elements; and, the methodology used for data collection and reporting.
DTFACT-13-R-00002Amendment 04March 20, 2013
Page 35 of 70
9.2.4.2 Describe the Test Site proximity to areas that may require protection ofpersons or property on the ground. Are Standard Operating Procedures (SOPs) defined that ensure the protection of persons or property? (XXXXX-0402.docx). NTE ½ page.
Note: A description that demonstrates that the Applicant understands how Test Site proximity affords protection to persons or property on the ground warrants a higher score. A description that demonstrates that the Applicant understands how the research goals and objectives identified in 9.2.3.1.1 will be achieved warrants a higher score. The completeness and thoroughness of the narrative impacts the value of the score.
9.2.4.3 Describe the visual observer capability (ground or chase plane) as required for UAS operations. (XXXXX-0403.docx). NTE 1 page.
Note: A description that demonstrates that the Applicant understands the visual and/or Visual Line-of-Sight (VLOS) procedures for UAS operations at the location proposed by the Applicant will achieve the research goals and objectives under 9.2.3.1.1 warrants a higher score. The completeness and thoroughness of the narrative impacts the value of the score.
9.2.4.4 If the Applicant has a plan to conduct Beyond-Visual Line-of-Sight (BVLOS) operations, what is the proposal to conduct such operations? (XXXXX-0404.docx). NTE 1 page.
Note: The Applicant must provide specific examples on how the BVLOS operations and the use of mitigation(s) at the proposed location (identified under 9.2.3.1 3 will be safely conducted. A description that demonstrates that the Applicant understands how research in BVLOS operations will safely achieve the research goals and objectives identified in 9.2.3.1.1 warrants a higher score. The completeness and thoroughness of the narrative impacts the value of the score.
9.2.4.5 Provide existing safety record with manned aircraft to-date (complete Attachment 6 (XXXXX-04-ATT06.docx) NTE 2 pages and Attachment 7 (XXXXX-04-ATT07.docx) NTE 2 pages.
Note: Longer safety records are worth more than shorter safety records. The number of accidents/incidents must be weighed carefully, dependent on the type of operations. If the Applicant conducts test flight research on airframes, it is expected that there would be a higher accident rate. This is normal in the development of aircraft, engines, and/or airframes and the rate decreases over time.
9.2.4.6 Provide existing safety record with UAS to-date, if applicable (include optionally piloted aircraft here) [complete Attachments 8 (XXXXX-04-ATT08.docx) NTE 2 pages and Attachment 9 NTE 2 pages (XXXXX-04-ATT09.docx)].

DTFACT-13-R-00002Amendment 04March 20, 2013
Page 36 of 70
Note: Longer safety records are worth more than shorter safety records. The number of accidents/incidents must be weighed carefully, dependent on the type of operations. If the Applicant conducts test flight research on airframes, it is expected that there would be a higher accident rate. This is normal in the development of aircraft, engines, and/or airframes and the rate decreases over time.
Note: The highest score would be for Teams with multiple Members having multiple existing aviation safety records, followed by those with safety records not associated with aviation. The highest score would be for a Team Member with a long established aviation safety record. Those without any experience would receive an “Unsatisfactory” evaluation for this section. There is a potential that a single Applicant could have more experience than some entire teams.
9.2.4.7 Describe previous experience developing a safety risk management culture in an organization; include specific experience in developing and maintaining a safety risk mitigation process for range access for civil and public manned aircraft and UAS [complete Attachment 10 (XXXXX-04-ATT10.docx) NTE 7pages written plus 2 pages for the Attachment].
Note: The highest score could be for teams with multiple Members demonstratingexperience in the development of aviation related safety risk management processes/culture(s), followed by those with safety risk management not associated with aviation. The highest score could be for a Team where a single Team Member demonstrates a very large experience in the development of aviation related safetyrisk management processes/culture(s), followed by those with safety risk management not associated with aviation. The FAA will cross reference (for consistency) the experience contained in the ratings/certifications tables. Those without any experience would receive an “Unsatisfactory” evaluation for this section.
9.2.4.8 Describe any experience in establishing internal process for assembling and conducting a safety review board [complete Attachment 10 (XXXXX-04-ATT10.docx)].
Note: The highest score could be for Teams with multiple Members demonstrating experience in conducting aviation related safety review boards, followed by those with safety review boards not associated with aviation. The highest score could be for a Team where a single Team Member demonstrates vast experience in the aviation related safety review boards. Those without any experience would receive an “Unsatisfactory” evaluation for this section.
9.2.4.9 Describe Applicant’s and/or Team Member’s Safety Management Processes and Outcomes for UAS, Manned and Other [complete Attachment 10(XXXXX-04-ATT10.docx)].
Note: The highest score could be for Teams with multiple Members having multiple existing aviation safety records, followed by those with safety records not associated with aviation. The highest score could be for a Team Member with a long established aviation safety record. Those without any experience would receive an
DTFACT-13-R-00002Amendment 04March 20, 2013
Page 37 of 70
“Unsatisfactory” evaluation for this section. There is a potential that a single Applicant could have more experience than some entire teams.
9.2.4.10 List all Team Members that have originated Safety Risk Management System (SRMS) processes. [Complete Attachment 11 (XXXXX-04-ATT11.docx)NTE 2 pages].
Note: Teams that have multiple FAA approved processes would be scored the highest in the section. DoD and NASA approved processes would be scored the next highest in the section. If the Applicant’s Team has initiated FAA processes, it will receive a lower score than one that has an FAA approved process. If the Applicant’s Team has never initiated SRMS processes, that would receive the lowest rating.
9.2.5 Volume V – Experience (Applicant and Team Members)Experience is recorded on Attachment 12.(XXXXX-05-ATT12.docx). NTE 5 written pages plus 2 pages for Attachment.
9.2.5.1 Experience in operating manned aircraft (hours and types/classifications) [complete Attachment 12 (XXXXX-05-ATT12.docx)]
Note: More experience is better than less experience. No experience is “Unsatisfactory” unless the Applicant presents significant UAS aircraft experience. Manned aircraft experience is one of the methods that is currently used as the basis for licensing pilots; therefore, Team Members must be able to demonstrate some experience.
9.2.5.2 Experience in operating UAS aircraft (hours and types) [Complete Attachment 12 (XXXXX-05-ATT12.docx)].
Note: In general, UAS experience is better than manned aircraft experience. The more UAS experience, the higher the score would be. As this score is of equal importance to manned, a balance could be achieved where one Applicant gets a combined score of items 9.2.5.1 and 9.2.5.2 lower than an Applicant with significant UAS experience but little manned experience.
9.2.5.3 The certification and licensing of all flight crew members, including visual observers [complete Attachment 12 (XXXXX-05-ATT12.docx)].
Note: An Applicant with multiple flight crew certifications and licenses score higher than one with only a few licensed flight crew members. As there is no current UAS specific license, UAS pilots are required to have traditional manned licenses. Some flight crew members may only have military experience with UAS. Military experience is an equivalent to civil license; however, it is important that flight crew members demonstrate a certification for the type(s) of UAS proposed research at the Test Site.
9.2.5.4 Describe the ability to obtain frequency spectrum approval and current experience in completing the application process, if any [complete Attachment 12 (XXXXX-05-ATT12.docx)].

DTFACT-13-R-00002Amendment 04March 20, 2013
Page 38 of 70
Note: If the Applicant or Team Member has the ability to obtain frequency spectrum approval and has current experience in completing the application process, the proposal would receive the highest score. Applicants or Team Members that have applied, but not received approval would have a lower score; and, Applicants or Team Members that have not applied would receive a lower score if they demonstrate the understanding of how to complete the application process. Applicants or Team Members that have not done any of the above could receive an “Unsatisfactory” score.
9.2.5.5 The Applicant’s Team must have a minimum of five (5) years, within the past 7 years, of aviation research and development (R&D) experience.
The Applicant’s Team must have at least one (1) year of UAS experience within the last five (5) years. The one year of UAS experience may be counted as part of the five (5) years R&D experience.
Note: Does the Applicant include the one year of UAS experience as part of the five (5) year experience requirement? The total number of years would score the highest if the Applicant includes current UAS experience in multiple instances within the last 7 years.
9.2.6 Volume VI – Risk Consideration – Planned Team Composition, and Capabilities
The Applicant is required to provide teaming agreements as submissions in Volume VI.
Submit copies of all the teaming agreements. The submissions must agree with the list of UAS Test Site Team Members provided in Attachment 1.
(XXXXX-0601-AGT.pdf)
9.2.6.1 Provide diagram of Proposed Organizational Structure.(XXXXX-0601.docx). NTE 2 pages.
9.2.6.2 List any planned relationships where agreements have not been finalized and provide a Letter of Intent signed by, at a minimum, the prospective partner. (XXXXX-0602.docx.). NTE 1 page.(XXXXX-0602-LOI.pdf)
9.2.6.3 Identify any Conflict of Interest(s) and their Mitigation(s), as applicable. See AMS T3.1.7-3 Disclosure By Applicants Or Contractors Participating In FAA Acquisitions and AMS Clause 3.1.7-4 Organizational Conflict of Interest - Mitigation Plan Required, for guidance.(XXXXX-0603.docx).
9.2.7 Volume VII - Economic Impact Assessment
An Economic Impact Assessment (EIA) is broadly defined as changes in jobs, income, and economic activity (output or value added) resulting from an investment in a particular project or set of projects. The EIA can measure a broad variety of impacts, such as direct impacts on individual plants or whole firms, as well as measuring indirect impacts on consumers and suppliers within a community or region. The projected
DTFACT-13-R-00002Amendment 04March 20, 2013
Page 39 of 70
economic impact of a Test Site award provides the SSEB, SSO and the Administrator insight as to the importance of the award to a geographic area. The Applicant must provide an EIA which reflects the Test Site’s economic impact over the life of the OTA to the relevant community.
Both quantitative and qualitative characterizations of the economic impact should be discussed. The economic impact should identify and explain the data or studies on which estimates are based with enough detail to permit independent assessment of the results. Models and modeling approaches used in the EIA should be described, and major assumptions such as economic growth projections and job multipliers should be clearly stated. The economic impact of an individual component may vary over the term of the OTA. The FAA is requesting that the quantitative economic impacts be in annual (at a minimum) projections over the life of the OTA. To gauge the relative project impact on the local economy, a baseline comparison for the projection is requested. All financial projections should be discounted to the present value using a 3 percent and 7 percent discount rate.
Best practices for an EIA include:� Defining which impacts would be clearly linked to the Test Site award;� Relying more on direct and indirect impacts, and less on induced/multiplier
effects;� Defining which impacts are additive and avoid double counting; � Considering any opportunity costs to the Test Site award; and� Assessing offsetting impacts in addition to positive ones.
The following are some suggested components that the EIA may include:
� Private Sector Job Creation - Direct jobs associated with the Test Site including identification of the
number of positions, labor categories, and salaries.- Indirect jobs created at suppliers who make the materials used at the Test
Site.- Induced jobs created elsewhere in the community as increases in
income resulting from the creation of the Test Site lead to additional increases in spending by workers and firms.
� New Construction- At the Test Site (including financing sources)- Elsewhere in the community (including financing sources) with
explanation of the relationship to the Test Site� Rehabilitation of Existing Infrastructure
- At the Test Site - Elsewhere in the community
� Expansion of and impact on existing businesses.
DTFACT-13-R-00002Amendment 04March 20, 2013
Page 40 of 70
� Plans for locating near and leveraging existing research institutes, community colleges, and/or training centers while meeting the safety requirements to provide protections for persons and property on the ground.
� Plans to attract business investment for complementary assets throughout the supply chain (e.g., component manufacturers, launch pad equipment providers, etc.) with estimates of the expected results.
� Other economic impacts that the Team Members may have on the community, including local, state and federal government revenues.
� Revenue impact for the public entity (Test Site Operator) and the community resulting from new job creation.
� Attestations of support from local business community and broader aviation and aerospace and defense industry. File naming convention (XXXXX-0701-ATT.pdf). Attestations are to be combined into a single file; however, due to system limitations, if the file exceeds 10 MB, number each group of attestations sequentially and load them separately onto the site e.g. XXXXX-0702-ATT.pdf.
The response must include a summary and a discussion of qualitative and quantitative Economic Impact components of the UAS Test Site on the community. (XXXXX-0701.docx): NTE 8 pages (Attestations are not included in the page count).
10 BASIS FOR OTA AWARD
10.1 General Award Information10.1.1 OTA awards will be issued to Applicants determined to meet and/or exceed the
specific Congressional mandate under FMRA of 2012 and the requirements contained in Volumes II through VII and for whom the Administrator has issued an Order designating that Applicant a UAS Test Site Operator. The evaluation of proposals will be based on comparing the value of the differences in the submissions of all Applicants based on strengths, weaknesses, and risks, deficiencies, and ambiguities.
An Applicant must be compliant with all elements identified in Volume II. If at any time, in any Volume submission, the Applicant is found non-compliant with the SIR requirements contained in this Volume II, the FAA will disqualify the Applicant from competition (i.e. No-Go).
10.1.2 Applicant’s submission will be evaluated. The SSO will submit final recommendations to the Administrator, who will, after due consideration, issue one or more Orders designating each UAS Test Site Operator.
10.1.3 Determination of the Test Sites will include:
• Overall ranking (inclusive of Volumes III – VI);• Geographic diversity;• Climatic diversity;

DTFACT-13-R-00002Amendment 04March 20, 2013
Page 41 of 70
• The location of ground infrastructure; and • Research needs.
Table 5: Evaluator Score
Volume Description Evaluator Score Sheet Ratings TET Roll Up Structure4
I Identification of Applicant Complete/Incomplete Complete/Incomplete
II SIR Compliance Criteria Go/No-GoGoNo-Go (Applicant Ineligible for Award)
III-IGround Infrastructure, Research Objectives, and Airspace Use
Adjectival Rating and Weighting:
Excellent (100%)Good (86%)Satisfactory (70%)Unsatisfactory (0%)
Evaluator Score Sheet Ratings Averaged:Excellent (93-100%)Good (80-92%)Satisfactory (60-79%) Unsatisfactory (0-59%)
IV Safety
V Experience
III-II ATC Feasibility Study
FeasibleFeasible with Limitations
Not Feasible (No-Go)
Airspace EligibleAirspace Eligible with considerationsApplicant Ineligible for Award
VI
Risk Consideration –Planned Team Composition and Capabilities
High/Medium/Low Risk Overall High/Medium/Low Risk
VII Economic Impact N/A
The FAA will not assign a specific weight or score to Economic Impact information submitted by Applicants. Rather, the FAA reserves the right to consider this economic information in making Test Site selections based upon the totality of information received in the Applicant submissions.
NOTES
� Review of inconsistencies between Volumes and Sections and Omissions.� Applicants must have also successfully demonstrated geographic and climatic diversity and have
presented a sound research plan consistent with the minimum areas identified in the FMRA of 2012 and the FAA’s Request for Comments.
4 Fractional scores will be rounded up to the next whole number.
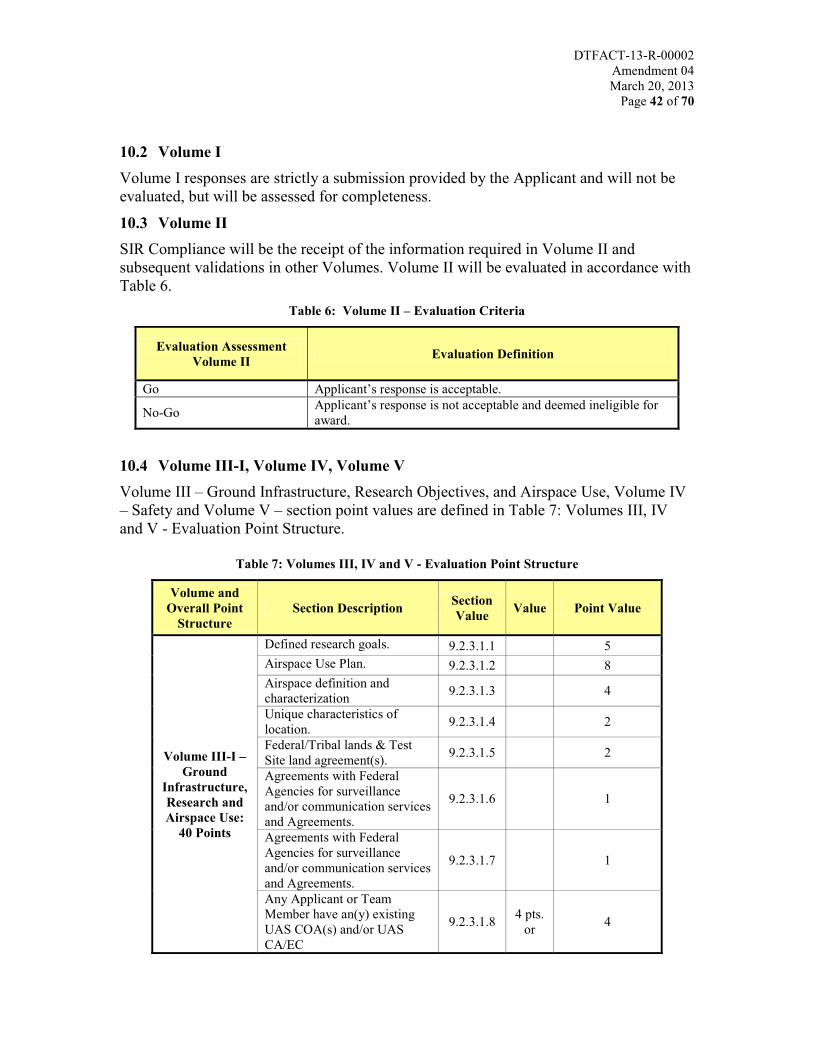
DTFACT-13-R-00002Amendment 04March 20, 2013
Page 42 of 70
10.2 Volume IVolume I responses are strictly a submission provided by the Applicant and will not be evaluated, but will be assessed for completeness.
10.3 Volume IISIR Compliance will be the receipt of the information required in Volume II and subsequent validations in other Volumes. Volume II will be evaluated in accordance with Table 6.
Table 6: Volume II – Evaluation Criteria
Evaluation AssessmentVolume II Evaluation Definition
Go Applicant’s response is acceptable.
No-Go Applicant’s response is not acceptable and deemed ineligible for award.
10.4 Volume III-I, Volume IV, Volume VVolume III – Ground Infrastructure, Research Objectives, and Airspace Use, Volume IV – Safety and Volume V – section point values are defined in Table 7: Volumes III, IV and V - Evaluation Point Structure.
Table 7: Volumes III, IV and V - Evaluation Point Structure
Volume and Overall Point
StructureSection Description Section
Value Value Point Value
Volume III-I –Ground
Infrastructure,Research and Airspace Use:
40 Points
Defined research goals. 9.2.3.1.1 5Airspace Use Plan. 9.2.3.1.2 8Airspace definition and characterization 9.2.3.1.3 4
Unique characteristics of location. 9.2.3.1.4 2
Federal/Tribal lands & Test Site land agreement(s). 9.2.3.1.5 2
Agreements with Federal Agencies for surveillance and/or communication services and Agreements.
9.2.3.1.6 1
Agreements with Federal Agencies for surveillance and/or communication services and Agreements.
9.2.3.1.7 1
Any Applicant or Team Member have an(y) existingUAS COA(s) and/or UAS CA/EC
9.2.3.1.8 4 pts.or 4
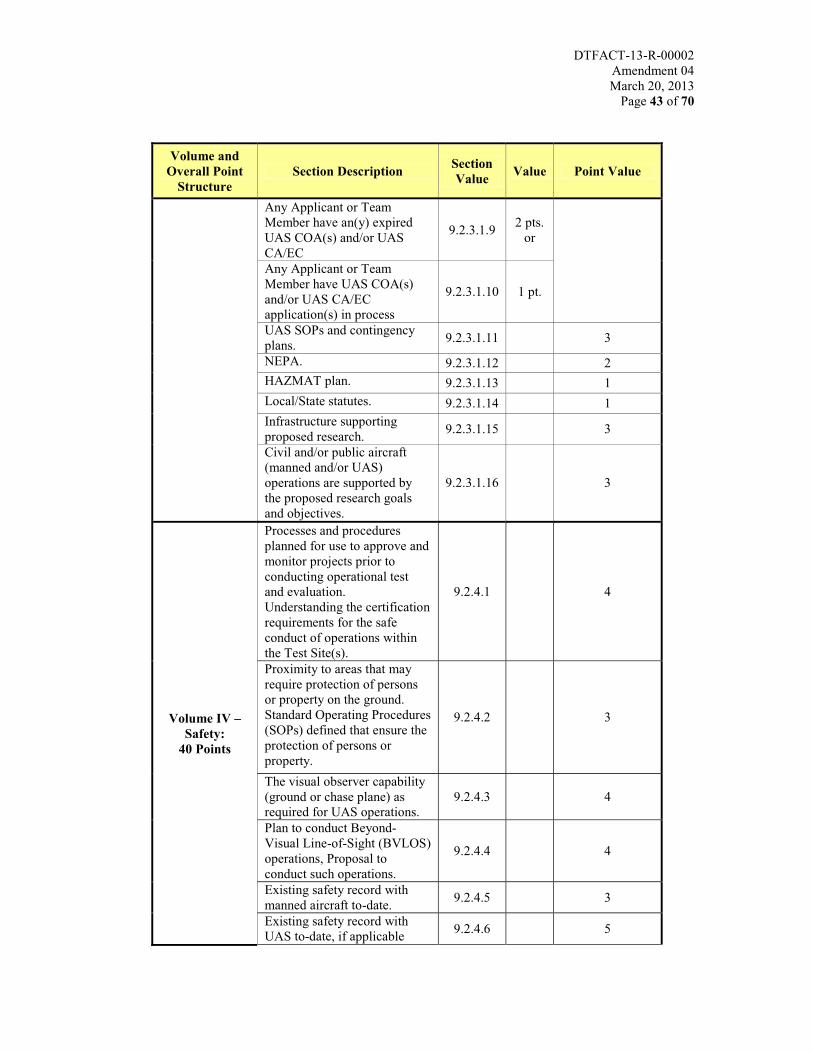
DTFACT-13-R-00002Amendment 04March 20, 2013
Page 43 of 70
Volume and Overall Point
StructureSection Description Section
Value Value Point Value
Any Applicant or Team Member have an(y) expired UAS COA(s) and/or UAS CA/EC
9.2.3.1.9 2 pts. or
Any Applicant or TeamMember have UAS COA(s) and/or UAS CA/EC application(s) in process
9.2.3.1.10 1 pt.
UAS SOPs and contingency plans. 9.2.3.1.11 3
NEPA. 9.2.3.1.12 2HAZMAT plan. 9.2.3.1.13 1Local/State statutes. 9.2.3.1.14 1Infrastructure supporting proposed research. 9.2.3.1.15 3
Civil and/or public aircraft (manned and/or UAS) operations are supported by the proposed research goals and objectives.
9.2.3.1.16 3
Volume IV –Safety:
40 Points
Processes and procedures planned for use to approve and monitor projects prior to conducting operational test and evaluation. Understanding the certification requirements for the safe conduct of operations within the Test Site(s).
9.2.4.1 4
Proximity to areas that may require protection of persons or property on the ground. Standard Operating Procedures (SOPs) defined that ensure the protection of persons or property.
9.2.4.2 3
The visual observer capability (ground or chase plane) as required for UAS operations.
9.2.4.3 4
Plan to conduct Beyond-Visual Line-of-Sight (BVLOS) operations, Proposal to conduct such operations.
9.2.4.4 4
Existing safety record with manned aircraft to-date. 9.2.4.5 3
Existing safety record with UAS to-date, if applicable 9.2.4.6 5
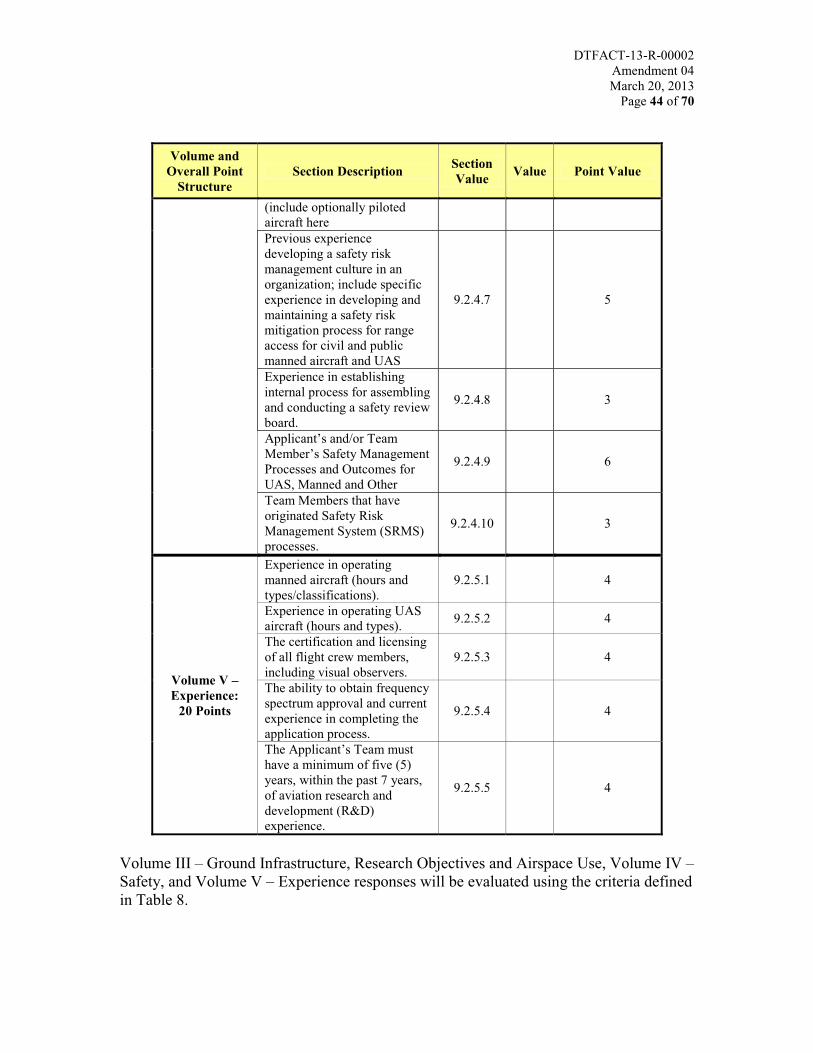
DTFACT-13-R-00002Amendment 04March 20, 2013
Page 44 of 70
Volume and Overall Point
StructureSection Description Section
Value Value Point Value
(include optionally piloted aircraft herePrevious experience developing a safety risk management culture in an organization; include specific experience in developing and maintaining a safety risk mitigation process for range access for civil and public manned aircraft and UAS
9.2.4.7 5
Experience in establishing internal process for assembling and conducting a safety review board.
9.2.4.8 3
Applicant’s and/or Team Member’s Safety Management Processes and Outcomes for UAS, Manned and Other
9.2.4.9 6
Team Members that have originated Safety Risk Management System (SRMS) processes.
9.2.4.10 3
Volume V –Experience:
20 Points
Experience in operating manned aircraft (hours and types/classifications).
9.2.5.1 4
Experience in operating UAS aircraft (hours and types). 9.2.5.2 4
The certification and licensing of all flight crew members, including visual observers.
9.2.5.3 4
The ability to obtain frequency spectrum approval and current experience in completing the application process.
9.2.5.4 4
The Applicant’s Team must have a minimum of five (5) years, within the past 7 years, of aviation research and development (R&D) experience.
9.2.5.5 4
Volume III – Ground Infrastructure, Research Objectives and Airspace Use, Volume IV –Safety, and Volume V – Experience responses will be evaluated using the criteria defined in Table 8.
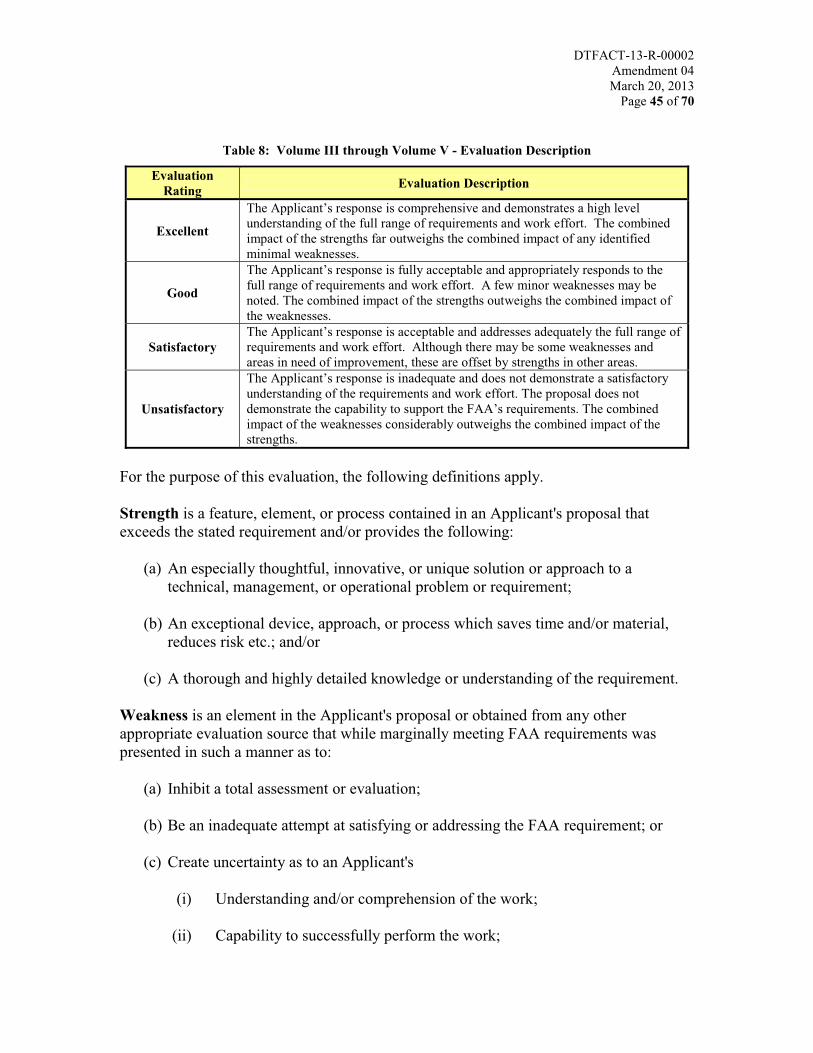
DTFACT-13-R-00002Amendment 04March 20, 2013
Page 45 of 70
Table 8: Volume III through Volume V - Evaluation Description
Evaluation Rating Evaluation Description
Excellent
The Applicant’s response is comprehensive and demonstrates a high level understanding of the full range of requirements and work effort. The combined impact of the strengths far outweighs the combined impact of any identified minimal weaknesses.
Good
The Applicant’s response is fully acceptable and appropriately responds to the full range of requirements and work effort. A few minor weaknesses may be noted. The combined impact of the strengths outweighs the combined impact of the weaknesses.
SatisfactoryThe Applicant’s response is acceptable and addresses adequately the full range of requirements and work effort. Although there may be some weaknesses and areas in need of improvement, these are offset by strengths in other areas.
Unsatisfactory
The Applicant’s response is inadequate and does not demonstrate a satisfactory understanding of the requirements and work effort. The proposal does not demonstrate the capability to support the FAA’s requirements. The combined impact of the weaknesses considerably outweighs the combined impact of the strengths.
For the purpose of this evaluation, the following definitions apply.
Strength is a feature, element, or process contained in an Applicant's proposal that exceeds the stated requirement and/or provides the following:
(a) An especially thoughtful, innovative, or unique solution or approach to a technical, management, or operational problem or requirement;
(b) An exceptional device, approach, or process which saves time and/or material, reduces risk etc.; and/or
(c) A thorough and highly detailed knowledge or understanding of the requirement.
Weakness is an element in the Applicant's proposal or obtained from any other appropriate evaluation source that while marginally meeting FAA requirements was presented in such a manner as to:
(a) Inhibit a total assessment or evaluation;
(b) Be an inadequate attempt at satisfying or addressing the FAA requirement; or
(c) Create uncertainty as to an Applicant's
(i) Understanding and/or comprehension of the work;
(ii) Capability to successfully perform the work;
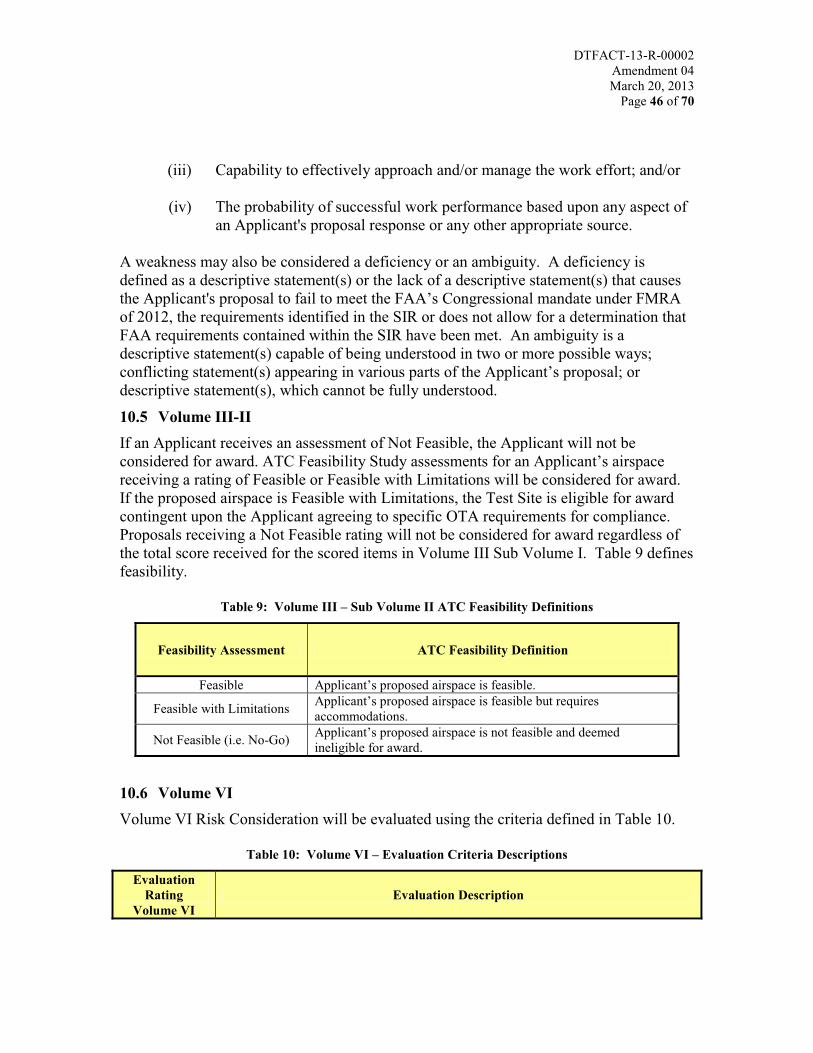
DTFACT-13-R-00002Amendment 04March 20, 2013
Page 46 of 70
(iii) Capability to effectively approach and/or manage the work effort; and/or
(iv) The probability of successful work performance based upon any aspect of an Applicant's proposal response or any other appropriate source.
A weakness may also be considered a deficiency or an ambiguity. A deficiency is defined as a descriptive statement(s) or the lack of a descriptive statement(s) that causes the Applicant's proposal to fail to meet the FAA’s Congressional mandate under FMRA of 2012, the requirements identified in the SIR or does not allow for a determination thatFAA requirements contained within the SIR have been met. An ambiguity is a descriptive statement(s) capable of being understood in two or more possible ways;conflicting statement(s) appearing in various parts of the Applicant’s proposal; ordescriptive statement(s), which cannot be fully understood.
10.5 Volume III-IIIf an Applicant receives an assessment of Not Feasible, the Applicant will not be considered for award. ATC Feasibility Study assessments for an Applicant’s airspacereceiving a rating of Feasible or Feasible with Limitations will be considered for award. If the proposed airspace is Feasible with Limitations, the Test Site is eligible for award contingent upon the Applicant agreeing to specific OTA requirements for compliance.Proposals receiving a Not Feasible rating will not be considered for award regardless of the total score received for the scored items in Volume III Sub Volume I. Table 9 definesfeasibility.
Table 9: Volume III – Sub Volume II ATC Feasibility Definitions
Feasibility Assessment ATC Feasibility Definition
Feasible Applicant’s proposed airspace is feasible.
Feasible with Limitations Applicant’s proposed airspace is feasible but requires accommodations.
Not Feasible (i.e. No-Go) Applicant’s proposed airspace is not feasible and deemed ineligible for award.
10.6 Volume VIVolume VI Risk Consideration will be evaluated using the criteria defined in Table 10.
Table 10: Volume VI – Evaluation Criteria Descriptions
Evaluation Rating
Volume VIEvaluation Description
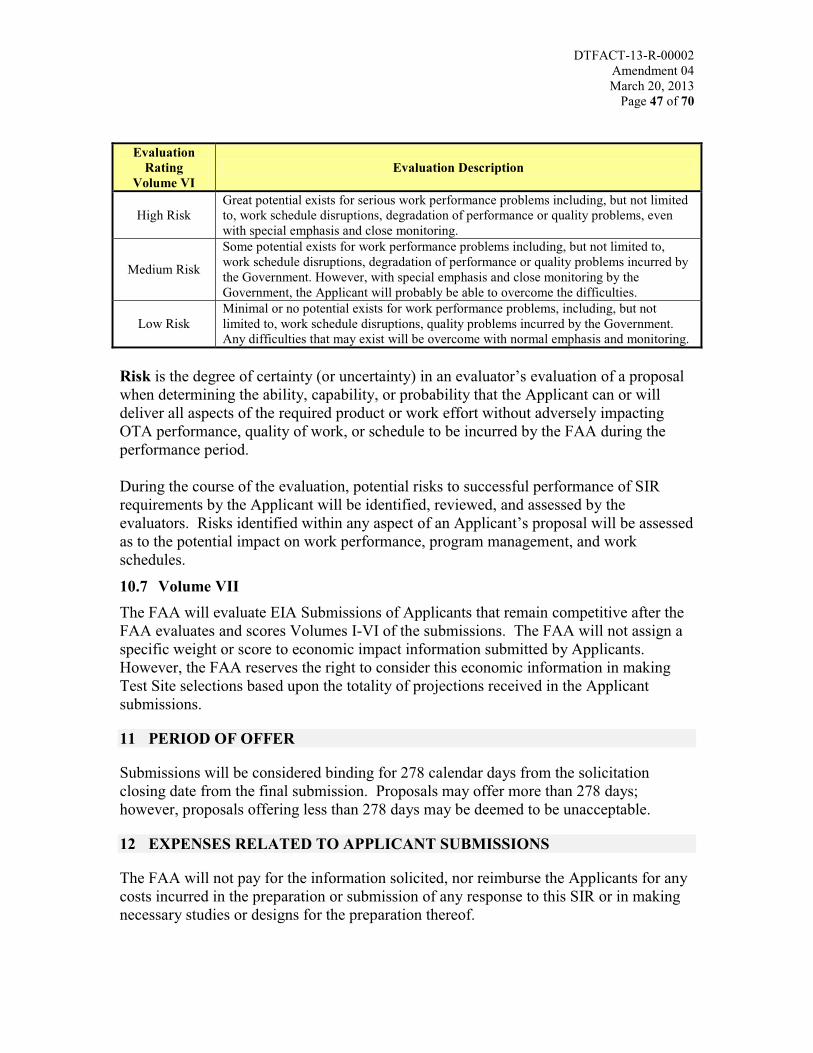
DTFACT-13-R-00002Amendment 04March 20, 2013
Page 47 of 70
Evaluation Rating
Volume VIEvaluation Description
High RiskGreat potential exists for serious work performance problems including, but not limited to, work schedule disruptions, degradation of performance or quality problems, even with special emphasis and close monitoring.
Medium Risk
Some potential exists for work performance problems including, but not limited to, work schedule disruptions, degradation of performance or quality problems incurred by the Government. However, with special emphasis and close monitoring by the Government, the Applicant will probably be able to overcome the difficulties.
Low RiskMinimal or no potential exists for work performance problems, including, but not limited to, work schedule disruptions, quality problems incurred by the Government. Any difficulties that may exist will be overcome with normal emphasis and monitoring.
Risk is the degree of certainty (or uncertainty) in an evaluator’s evaluation of a proposal when determining the ability, capability, or probability that the Applicant can or will deliver all aspects of the required product or work effort without adversely impacting OTA performance, quality of work, or schedule to be incurred by the FAA during the performance period.
During the course of the evaluation, potential risks to successful performance of SIR requirements by the Applicant will be identified, reviewed, and assessed by the evaluators. Risks identified within any aspect of an Applicant’s proposal will be assessed as to the potential impact on work performance, program management, and work schedules.
10.7 Volume VII The FAA will evaluate EIA Submissions of Applicants that remain competitive after the FAA evaluates and scores Volumes I-VI of the submissions. The FAA will not assign a specific weight or score to economic impact information submitted by Applicants. However, the FAA reserves the right to consider this economic information in making Test Site selections based upon the totality of projections received in the Applicant submissions.
11 PERIOD OF OFFER
Submissions will be considered binding for 278 calendar days from the solicitation closing date from the final submission. Proposals may offer more than 278 days; however, proposals offering less than 278 days may be deemed to be unacceptable.
12 EXPENSES RELATED TO APPLICANT SUBMISSIONS
The FAA will not pay for the information solicited, nor reimburse the Applicants for any costs incurred in the preparation or submission of any response to this SIR or in making necessary studies or designs for the preparation thereof.
DTFACT-13-R-00002Amendment 04March 20, 2013
Page 48 of 70
13 COMMUNICATIONS WITH APPLICANTS
The FAA expects to have communications with potential Applicants throughout the siteselection process. These communications will be conducted in accordance with AMS 3.2.2.3.1.2.2, Communications with Applicants.
14 NOTIFICATION OF AWARD AND DEBRIEFING OF UNSUCCESSFUL APPLICANTS
Written notice of award to unsuccessful Applicants will be provided within three (3) business days of the OTA issuance. Successful or unsuccessful Applicants may request a debriefing by providing a written request within three (3) business days after receiving the notice of the OTA award(s) via email to the Contracting Officer at:
Email: [email protected] email subject should read:
“Request for Debriefing– (insert Public Entity Name)The email should read as follows:
“In accordance with Section 14.0 NOTIFICATION OF AWARD AND DEBRIEFING OF UNSUCCESSFUL OFFERORS (insert Public Entity Name) is requesting a debriefing. Please contact the individual listed below to schedule a mutually agreeable date.
Public Entity Name:Contact Name:Contact Telephone Number:Contact Email Address:”
Debriefings will be conducted only after completion of site selection activities and award of all OTAs. All Applicants who notify the Contracting Officer at [email protected] within three (3) business days of receipt of the award notification are entitled to a debriefing. The FAA will make every effort to provide adebriefing at the earliest possible date convenient for both parties.
15 DISPOSITION OF PROPOSALS
Proposals from unsuccessful Applicants will not be returned. The original proposal will be retained in the official SIR Web Portal.
16 NON-GOVERNMENT PERSONNEL PARTICIPATION
(a) Applicants are advised that employees of firms identified in paragraph (b) are serving as support service and technical advisors in the site selection process. All non-Government employees are required to sign non-disclosure of information agreements. The exclusive responsibility for site selection remains with the FAA. Any objection to disclosure of information to these non-Government employees
DTFACT-13-R-00002Amendment 04March 20, 2013
Page 49 of 70
must be provided in writing no later than 14 calendar days after the SIR release and must include a detailed statement with the basis of the objection. This objection must be emailed and addressed to the Contracting Officer at:
Email: [email protected] email subject should read:
“Objection to disclosure of info to non-Government Personnel– (insert Public Entity Name)
The email should read as follows:“In accordance with Section 16.0 NON-GOVERNMENT PERSONNEL PARTICIPATION (insert Public Entity Name) is submitting a statement. The Applicant should attach detailed statement with the basis of the objection and the following information:
Public Entity Name:Contact Name:Email:Phone Number:”
(b) The support service and technical advisors include: Science Applications International Corporation (SAIC); the MITRE Corporation’s Center for Advanced Aviation System Development (CAASD) the Federally Funded Research and Development Center (FFRDC); Information Innovators, Inc.; DIGITALiBIZ, Inc.; and New Mexico State University (NMSU). Therefore, said parties will not be eligible to be an Applicant or Team Member for any of the OTAs that result from this SIR.
17 PRE-AWARD SURVEYS
A pre-award survey is an evaluation of a prospective Applicant’s capability to perform a proposed OTA and is used as a means for assisting the CO in making a determination that an Applicant is a responsible prospective Applicant. The FAA reserves the right to conduct a pre-award survey on any Applicant or proposed Team Member. If a pre-award survey is conducted, it does not mean that an Applicant has been selected for award.
18 RESPONSIBLE PROSPECTIVE APPLICANT
Notwithstanding the evaluation methodology outlined in this SIR, an Applicant will also be found responsible by the CO prior to the award of any resultant OTA. As a minimum, to be determined responsible a prospective Applicant must: have adequate financialresources to perform the OTA, or the ability to obtain those resources; have a satisfactory record of integrity and business ethics; have a satisfactory performance record; have the necessary organization, experience, accounting and operational controls; and/or, beotherwise qualified and eligible to receive an award under applicable laws and regulations.
DTFACT-13-R-00002Amendment 04March 20, 2013
Page 50 of 70
19 CERTIFICATION OF REGISTRATION IN THE SYSTEM FOR AWARD MANAGEMENT (SAM)
In order to be issued an OTA, registration in System for Award Management (SAM) is required.
In accordance with SAM requirements, Applicants must certify that they are registered (or have submitted their request) in SAM and have entered all mandatory information including the DUNS or DUNS + 4 Number. This certification is included in Volume I, Attachment 2.
20 SYSTEM FOR AWARD MANAGEMENT (SAM)
In order to be issued an OTA, registration in SAM is required.
(a) Definitions.
"Data Universal Numbering System (DUNS) number" means the 9-digit number assigned by Dun and Bradstreet, Inc. (D&B) to identify unique business entities.
"Data Universal Numbering System +4 (DUNS+4) number" means the DUNS number assigned by D&B plus a 4-character suffix that may be assigned by a business concern. (D&B has no affiliation with this 4-character suffix.) This 4-character suffix may be assigned at the discretion of the business concern to establish additional SAM records for identifying alternative Electronic Funds Transfer (EFT) accounts for the same parent concern.
"Registered in the SAM database" means that the Contractor has entered all mandatory information, including the DUNS number or the DUNS+4 number, into the Central Contractor Registration (CCR) database.
"System for Award Management (SAM) Database" means the primary Government repository for Contractor information required for the conduct of business with the Government.
(b) By submission of an offer, the Applicant acknowledges the requirement that a prospective awardee shall be registered in the SAM database prior to award, during performance, and through final payment of any contract, basic agreement, basic ordering agreement, or blanket purchasing agreement resulting from this solicitation.
(c) If the Applicant has a DUNS number, it must be provided in Volume I –Attachment 2 and reflect the Applicant’s name and address that is providing the
DTFACT-13-R-00002Amendment 04March 20, 2013
Page 51 of 70
offer. The DUNS number will be used by the Contracting Officer to verify that the Applicant is registered in the SAM database.
(d) If the Applicant does not have a DUNS number, it should contact Dun and Bradstreet directly to obtain one.
(i) An Applicant may obtain a DUNS number:
a) If located within the United States, by calling Dun andBradstreet at 1-866-705-5711 or via the Internet at http://fedgov.dnb.com/webform; or
b) If located outside the United States, by contacting the local Dun and Bradstreet office.
(ii) The Applicant should be prepared to provide the following information:
a) Company legal business.
b) Tradestyle, doing business, or other name by which your entity is commonly recognized.
c) Company Physical Street Address, City, State, and ZIP Code.
d) Company Mailing Address, City, State and ZIP Code (if different from physical street address).
e) Company Telephone Number.
f) Date the company was started.
g) Number of employees at your location.
h) Chief executive officer/key manager.
i) Line of business (industry).
j) Company Headquarters name and address (reporting relationship within your entity).
(e) Processing time, which normally takes 48 hours, should be taken into consideration when registering. Applicants who are not registered should consider applying for registration immediately upon receipt of this solicitation.

DTFACT-13-R-00002Amendment 04March 20, 2013
Page 52 of 70
(f) The Contractor is responsible for the accuracy and completeness of the data within the SAM database, and for any liability resulting from the Government's reliance on inaccurate or incomplete data. To remain registered in the SAM database after the initial registration, the Contractor is required to review and update on an annual basis from the date of initial registration or subsequent updates its information in the SAM database to ensure it is current, accurate and complete. Updating information in the SAM does not alter the terms and conditions of this contract and is not a substitute for a properly executed contractual document.
(g) If a Contractor has legally changed its business name, "doing business as" name, or division name (whichever is shown on the contract), or has transferred the assets used in performing the contract, but has not completed the necessary requirements regarding novation and change-of-name agreements in AMS Procurement Guidance, the Contractor shall provide the responsible Contracting Officer a minimum of one business day's written notification of its intention to:
(i) change the name in the SAM database;
(ii) comply with the requirements of AMS regarding novation and change-of-name agreements; and
(iii) agree in writing to the timeline and procedures specified by the responsible Contracting Officer. The Contractor must provide the Contracting Officer with the notification, sufficient documentation to support the legally changed name.
(h) If the Contractor fails to comply with the requirements of paragraph (g) of this clause, or fails to perform the agreement at paragraph (g) iii of this clause, and, in the absence of a properly executed novation or change-of-name agreement, the SAM information that shows the Contractor to be other than the Contractor indicated in the contract will be considered to be incorrect information within the meaning of the "Suspension of Payment" paragraph of the electronic funds transfer (EFT) clause of this contract.
(i) The Contractor shall not change the name or address for EFT payments or manual payments, as appropriate, in the SAM record to reflect an assignee for the purpose of assignment of claims. Assignees shall be separately registered in the SAM database. Information provided to the Contractor's SAM record that indicates payments, including those made by EFT, to an ultimate recipient other than that Contractor will be considered to be incorrect information within the meaning of the "Suspension of payment" paragraph of the EFT clause of this contract.

DTFACT-13-R-00002Amendment 04March 20, 2013
Page 53 of 70
(j) Applicants may obtain information on registration and annual confirmation requirements via the internet at http://www.ccr.gov/ or by calling 269-961-5757.

DTFACT-13-R-00002Amendment 04March 20, 2013
Page 54 of 70
21 TABLE OF ATTACHMENTS
Volume Attachment Number Attachment Name
I 1 (Sample) Identification of ApplicantI 2 Volume I – Certification of Applicant
III 3 Volume III – Section 9.2.3.1.2 – Airspace Use PlanIII 4 Volume III – Section 9.2.3.1.3 – Airspace Definition and CharacterizationIII 5 Volume III – Section 9.2.3.1.15 – Test Site InfrastructureIV 6 Form for Submission of Volume IV – Experience in Manned Operations IV 7 Form for Submission of Volume IV –Manned Incidents IV 8 Form for Submission of Volume IV - Experience in Unmanned OperationsIV 9 Form for Submission of Volume IV - Unmanned IncidentsIV 10 Form for Submission of Volume IV – Safety ManagementIV 11 Form for Submission of Volume IV - Safety Risk Management ProcessesV 12 Form for Submission of Volume V - Experience

DTFACT-13-R-00002Amendment 04March 20, 2013
Page 55 of 70
21.1 Volume I – Attachment 1ATTACHMENT 1 – IDENTIFICATION OF APPLICANT
NOTE: FOR THIS ATTACHMENT 1 ONLY, THE FORM IS RESIDENT ON THE UASTSS WEB PORTAL. THIS WILL INSURE THE INTEGRITY OF THE DATA ENTRIES ON THE FORM. THERE ARE THREE TABS TO THE FORM WHICH NEED TO BE COMPLETED. SEE INSTRUCTIONS IN SECTION 9.2.1 VOLUME 1 FOR MORE INFORMATION ABOUT THIS FORM.
SAMPLETAB 1: Applicant Information Tab
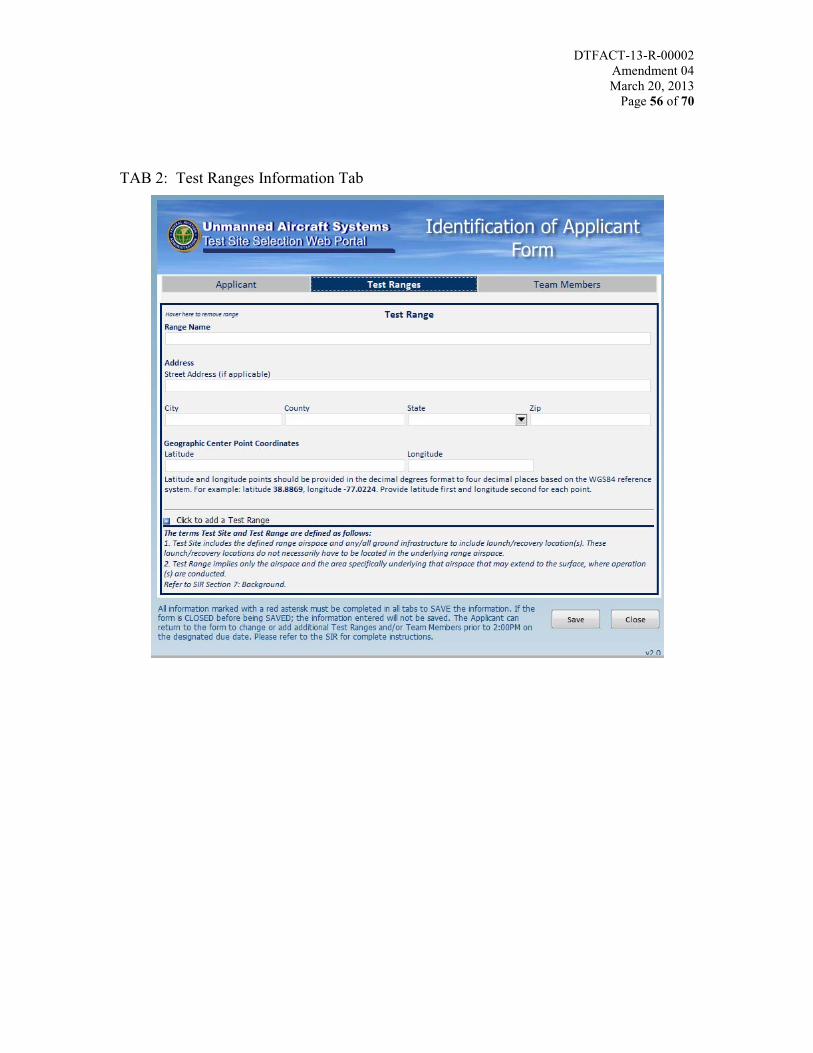
DTFACT-13-R-00002Amendment 04March 20, 2013
Page 56 of 70
TAB 2: Test Ranges Information Tab
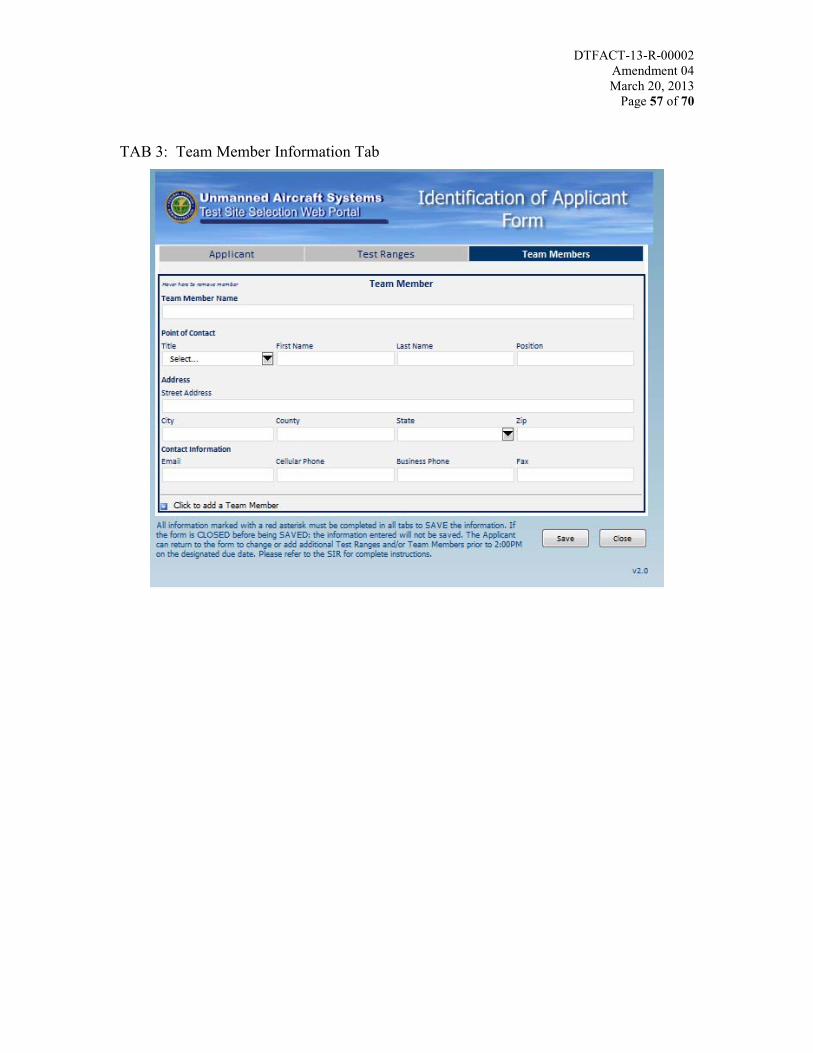
DTFACT-13-R-00002Amendment 04March 20, 2013
Page 57 of 70
TAB 3: Team Member Information Tab
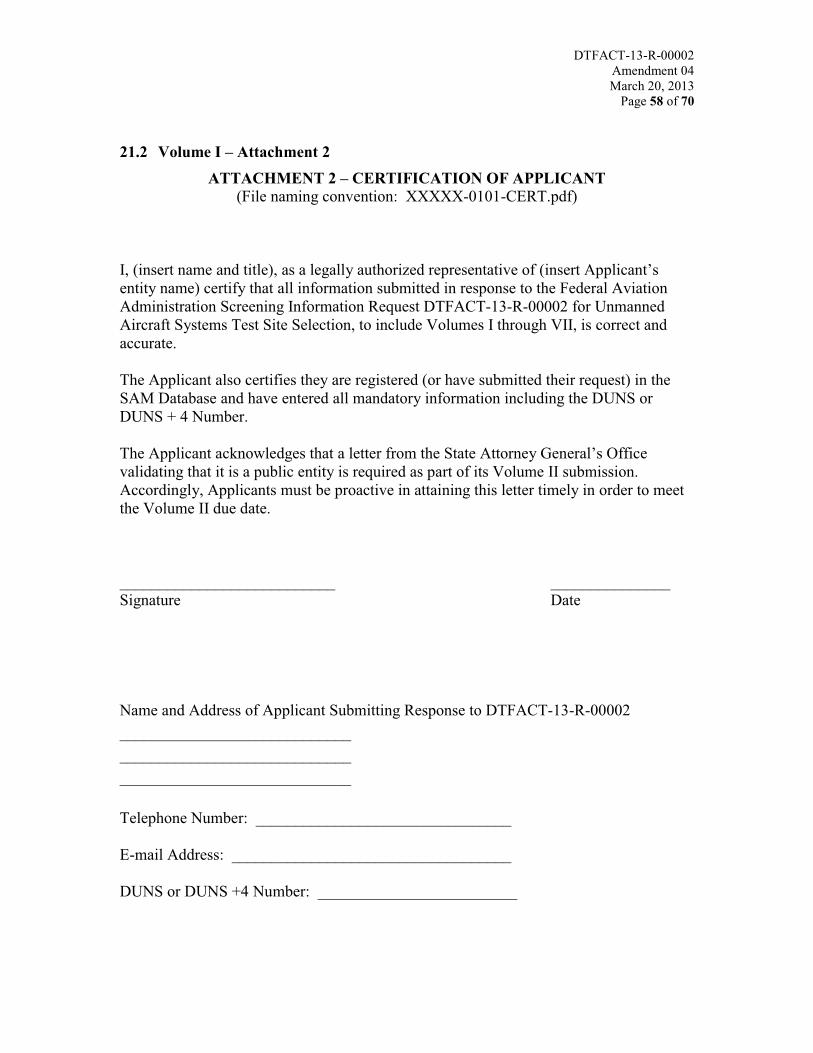
DTFACT-13-R-00002Amendment 04March 20, 2013
Page 58 of 70
21.2 Volume I – Attachment 2ATTACHMENT 2 – CERTIFICATION OF APPLICANT
(File naming convention: XXXXX-0101-CERT.pdf)
I, (insert name and title), as a legally authorized representative of (insert Applicant’s entity name) certify that all information submitted in response to the Federal Aviation Administration Screening Information Request DTFACT-13-R-00002 for Unmanned Aircraft Systems Test Site Selection, to include Volumes I through VII, is correct and accurate.
The Applicant also certifies they are registered (or have submitted their request) in the SAM Database and have entered all mandatory information including the DUNS or DUNS + 4 Number.
The Applicant acknowledges that a letter from the State Attorney General’s Office validating that it is a public entity is required as part of its Volume II submission. Accordingly, Applicants must be proactive in attaining this letter timely in order to meet the Volume II due date.
___________________________ _______________Signature Date
Name and Address of Applicant Submitting Response to DTFACT-13-R-00002_______________________________________________________________________________________
Telephone Number: ________________________________
E-mail Address: ___________________________________
DUNS or DUNS +4 Number: _________________________

DTFACT-13-R-00002Amendment 04March 20, 2013
Page 59 of 70
21.3 Volume III – Sub-Volume I: Attachment 3Form for Submission of Volume III – Section 9.2.3.1.2
Airspace Use Plan(File naming convention: XXXXX-03-ATT03.docx)
Applicant:UAS Test Site Selection SIR DTFACT-13–R-00002Attachment 3 - Section 9.2.3.1.2 Airspace Use Plan
(Not To Exceed 8 Pages) Section 9.2.3.1.2.1:
Section 9.2.3.1.2.2:
Section 9.2.3.1.2.3:
Section 9.2.3.1.2.4:
Section 9.2.3.1.2.5:
Section 9.2.3.1.2.6:
Section 9.2.3.1.2.7:
Section 9.2.3.1.2.8:
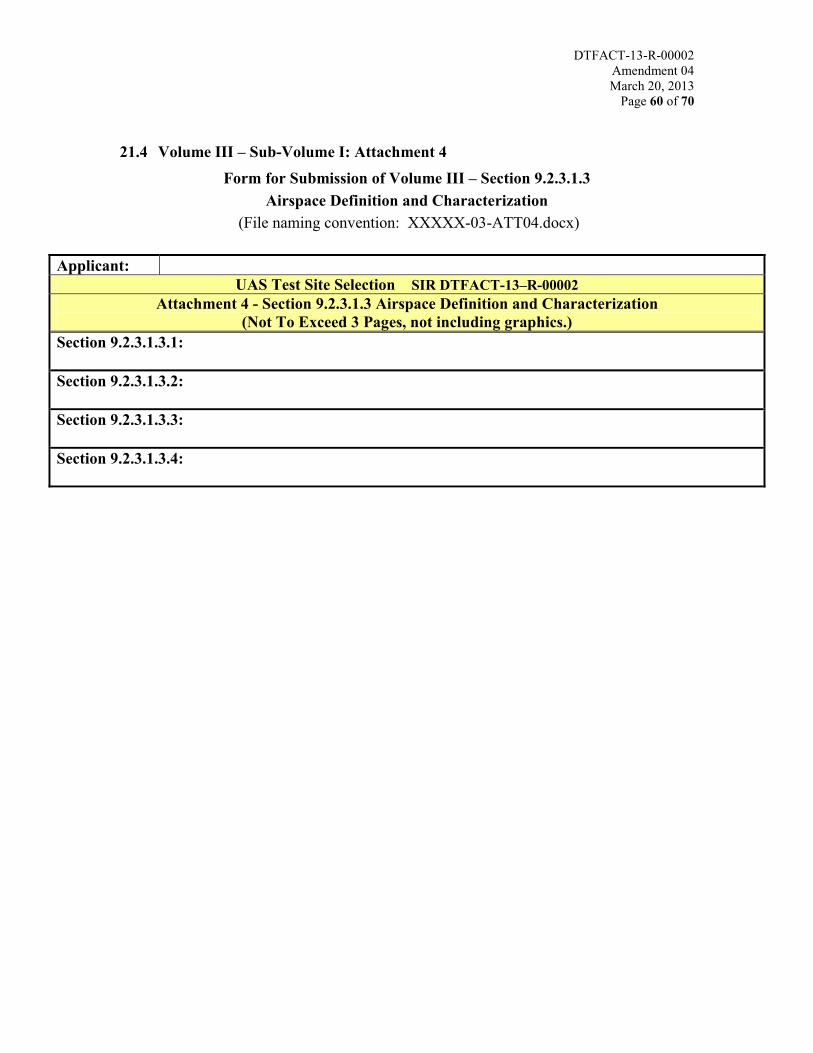
DTFACT-13-R-00002Amendment 04March 20, 2013
Page 60 of 70
21.4 Volume III – Sub-Volume I: Attachment 4Form for Submission of Volume III – Section 9.2.3.1.3
Airspace Definition and Characterization(File naming convention: XXXXX-03-ATT04.docx)
Applicant:UAS Test Site Selection SIR DTFACT-13–R-00002
Attachment 4 - Section 9.2.3.1.3 Airspace Definition and Characterization(Not To Exceed 3 Pages, not including graphics.)
Section 9.2.3.1.3.1:
Section 9.2.3.1.3.2:
Section 9.2.3.1.3.3:
Section 9.2.3.1.3.4:
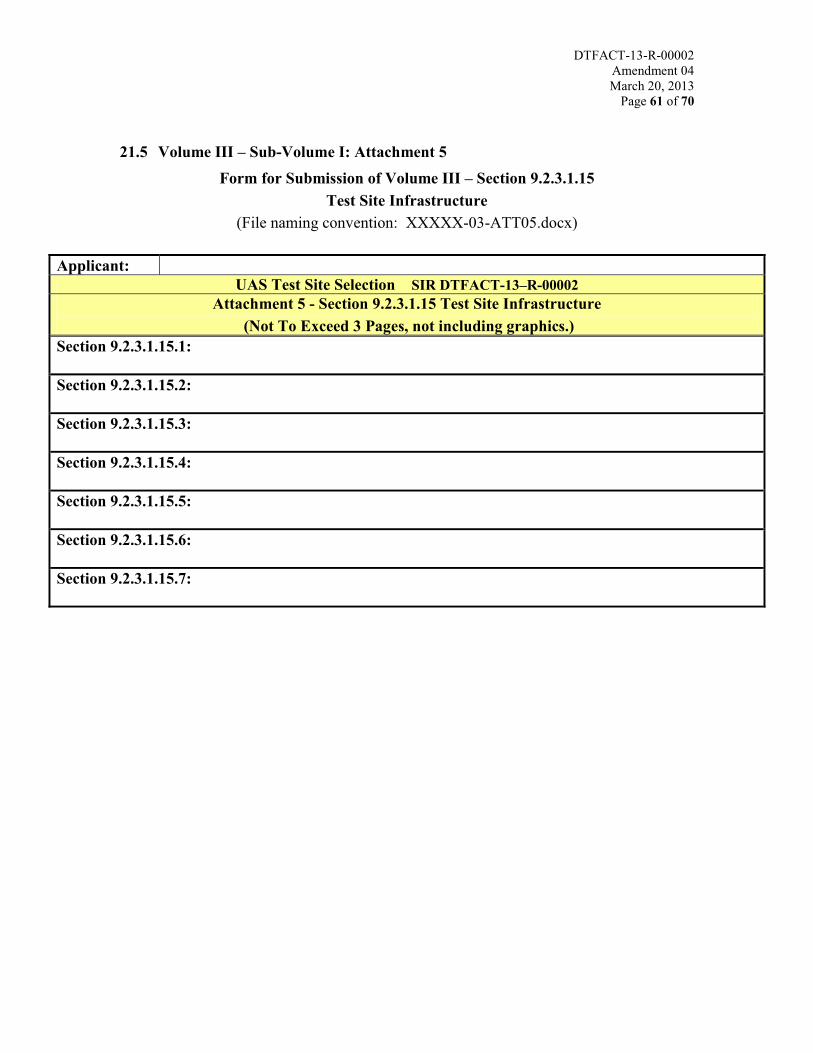
DTFACT-13-R-00002Amendment 04March 20, 2013
Page 61 of 70
21.5 Volume III – Sub-Volume I: Attachment 5Form for Submission of Volume III – Section 9.2.3.1.15
Test Site Infrastructure(File naming convention: XXXXX-03-ATT05.docx)
Applicant:UAS Test Site Selection SIR DTFACT-13–R-00002
Attachment 5 - Section 9.2.3.1.15 Test Site Infrastructure(Not To Exceed 3 Pages, not including graphics.)
Section 9.2.3.1.15.1:
Section 9.2.3.1.15.2:
Section 9.2.3.1.15.3:
Section 9.2.3.1.15.4:
Section 9.2.3.1.15.5:
Section 9.2.3.1.15.6:
Section 9.2.3.1.15.7:
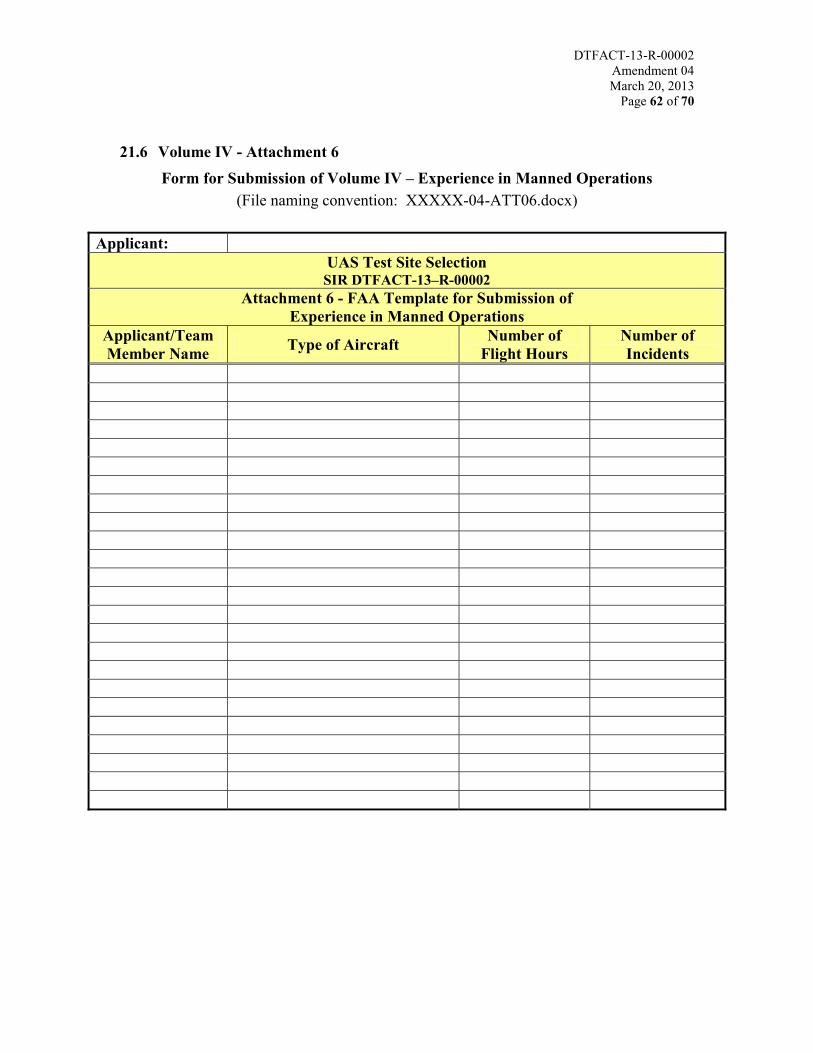
DTFACT-13-R-00002Amendment 04March 20, 2013
Page 62 of 70
21.6 Volume IV - Attachment 6Form for Submission of Volume IV – Experience in Manned Operations
(File naming convention: XXXXX-04-ATT06.docx)
Applicant:UAS Test Site Selection SIR DTFACT-13–R-00002
Attachment 6 - FAA Template for Submission of Experience in Manned Operations
Applicant/Team Member Name Type of Aircraft Number of
Flight HoursNumber of Incidents
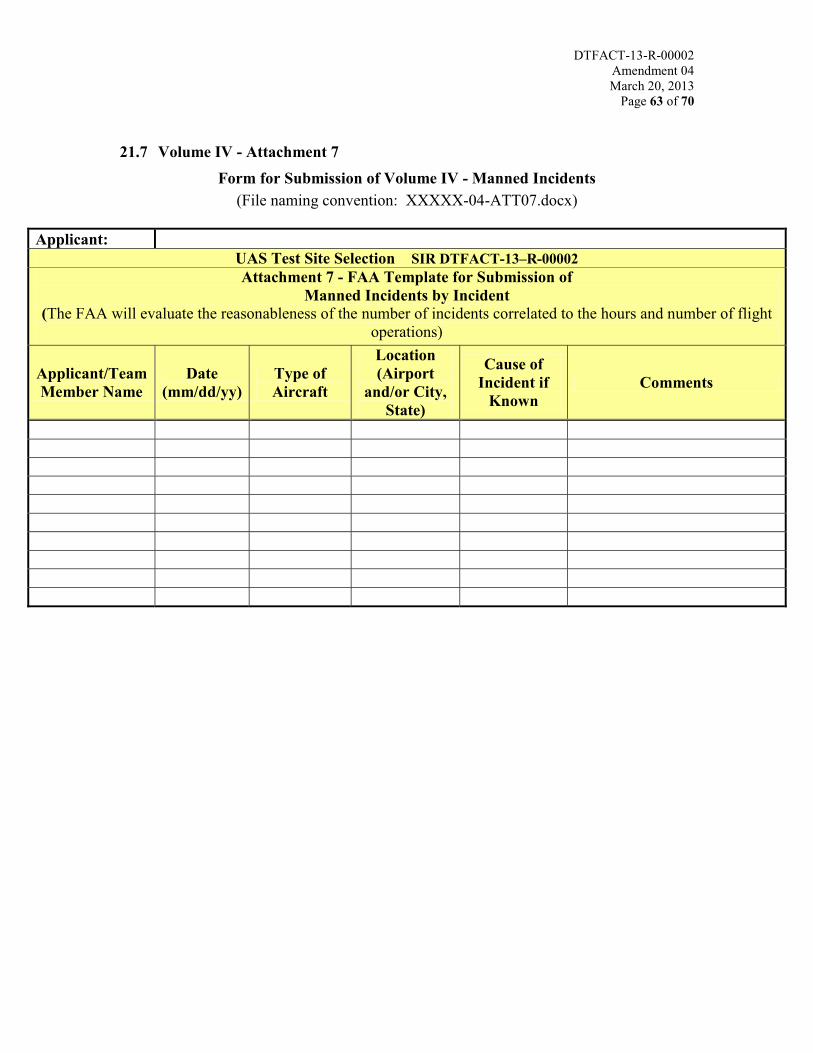
DTFACT-13-R-00002Amendment 04March 20, 2013
Page 63 of 70
21.7 Volume IV - Attachment 7Form for Submission of Volume IV - Manned Incidents
(File naming convention: XXXXX-04-ATT07.docx)
Applicant:UAS Test Site Selection SIR DTFACT-13–R-00002Attachment 7 - FAA Template for Submission of
Manned Incidents by Incident(The FAA will evaluate the reasonableness of the number of incidents correlated to the hours and number of flight
operations)
Applicant/Team Member Name
Date(mm/dd/yy)
Type of Aircraft
Location(Airport
and/or City, State)
Cause of Incident if
KnownComments
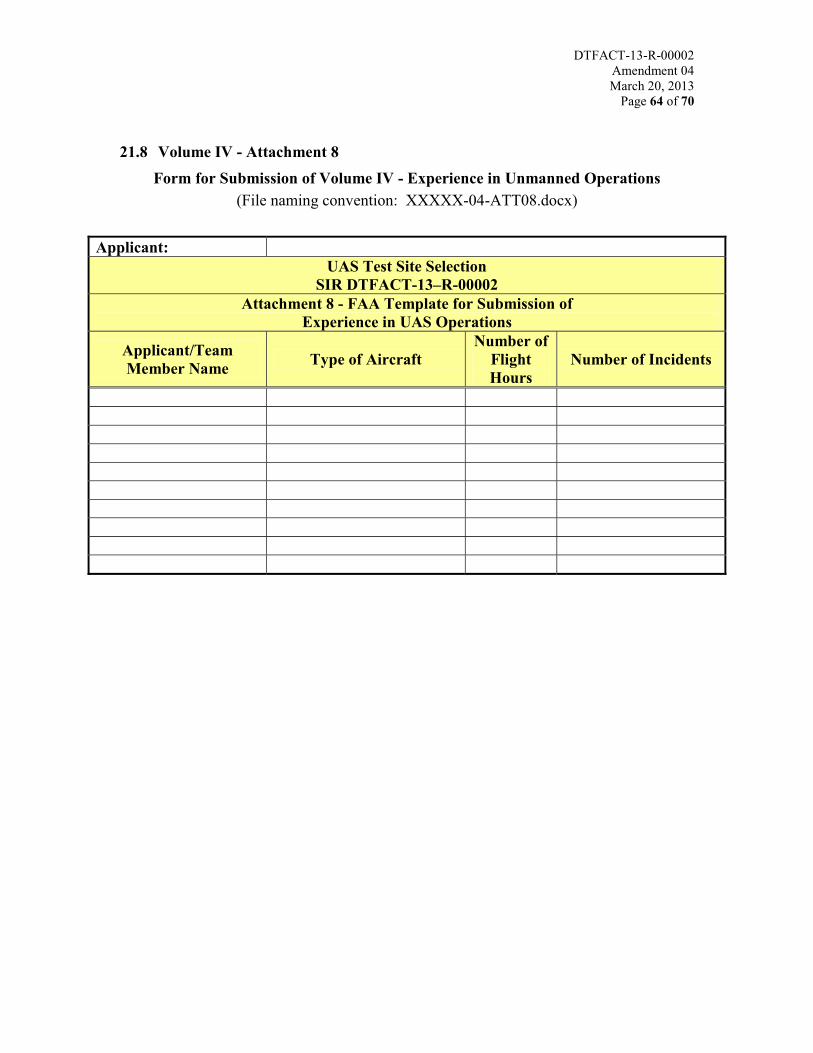
DTFACT-13-R-00002Amendment 04March 20, 2013
Page 64 of 70
21.8 Volume IV - Attachment 8Form for Submission of Volume IV - Experience in Unmanned Operations
(File naming convention: XXXXX-04-ATT08.docx)
Applicant:UAS Test Site Selection
SIR DTFACT-13–R-00002Attachment 8 - FAA Template for Submission of
Experience in UAS Operations
Applicant/Team Member Name Type of Aircraft
Number of Flight Hours
Number of Incidents
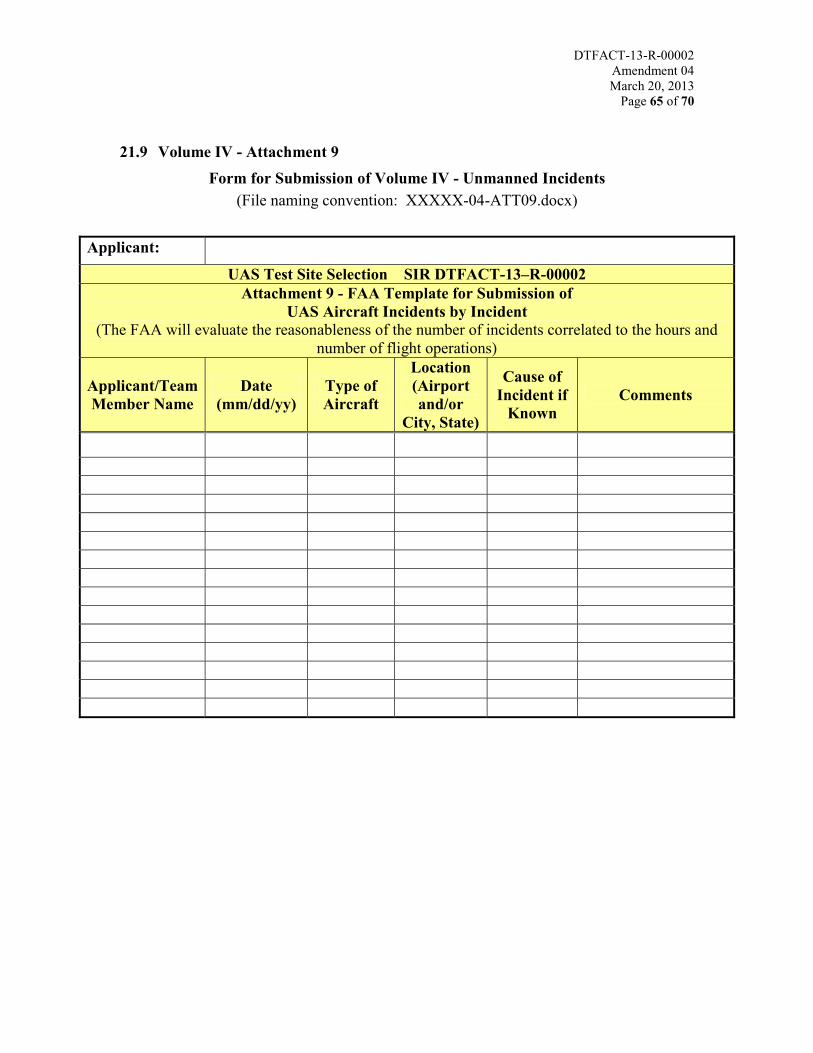
DTFACT-13-R-00002Amendment 04March 20, 2013
Page 65 of 70
21.9 Volume IV - Attachment 9Form for Submission of Volume IV - Unmanned Incidents
(File naming convention: XXXXX-04-ATT09.docx)
Applicant:
UAS Test Site Selection SIR DTFACT-13–R-00002Attachment 9 - FAA Template for Submission of
UAS Aircraft Incidents by Incident(The FAA will evaluate the reasonableness of the number of incidents correlated to the hours and
number of flight operations)
Applicant/Team Member Name
Date(mm/dd/yy)
Type of Aircraft
Location(Airport and/or
City, State)
Cause of Incident if
KnownComments
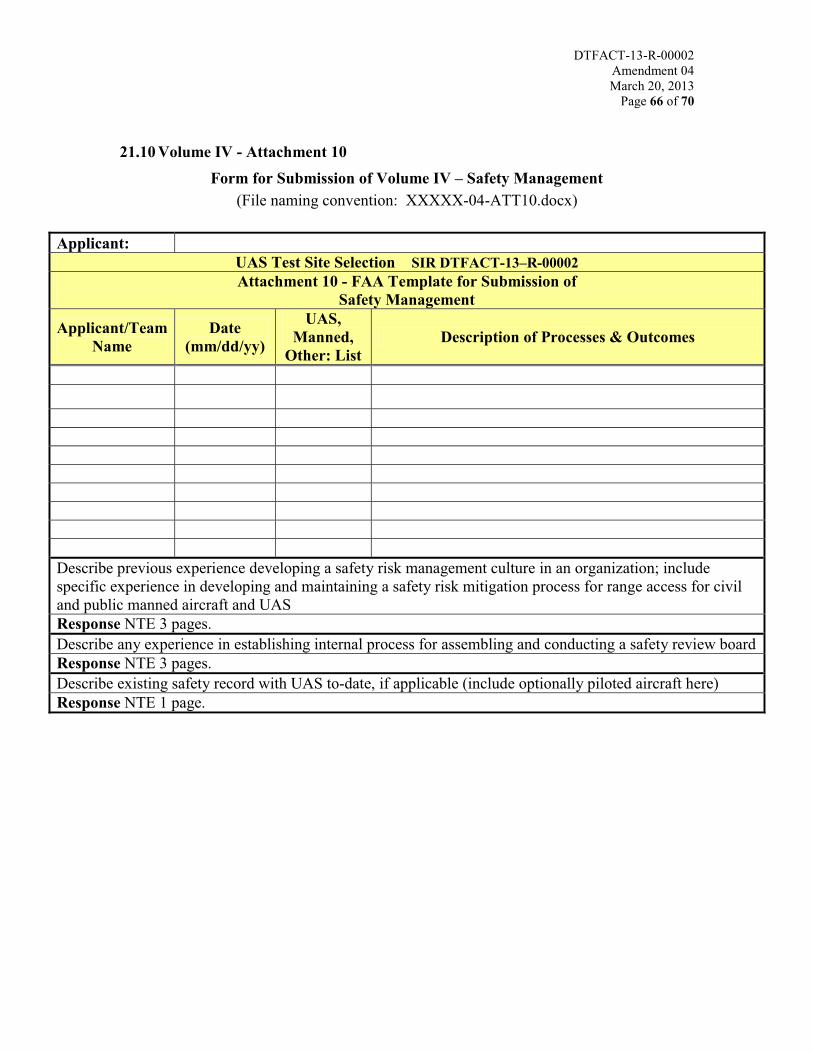
DTFACT-13-R-00002Amendment 04March 20, 2013
Page 66 of 70
21.10 Volume IV - Attachment 10Form for Submission of Volume IV – Safety Management
(File naming convention: XXXXX-04-ATT10.docx)
Applicant:UAS Test Site Selection SIR DTFACT-13–R-00002Attachment 10 - FAA Template for Submission of
Safety Management
Applicant/Team Name
Date(mm/dd/yy)
UAS, Manned,
Other: ListDescription of Processes & Outcomes
Describe previous experience developing a safety risk management culture in an organization; include specific experience in developing and maintaining a safety risk mitigation process for range access for civil and public manned aircraft and UASResponse NTE 3 pages.Describe any experience in establishing internal process for assembling and conducting a safety review boardResponse NTE 3 pages.Describe existing safety record with UAS to-date, if applicable (include optionally piloted aircraft here)Response NTE 1 page.

DTFACT-13-R-00002Amendment 04March 20, 2013
Page 67 of 70
21.11 Volume IV - Attachment 11Form for Submission of Volume IV - Safety Risk Management Processes
(File naming convention: XXXXX-04-ATT11.docx)
Applicant:UAS Test Site Selection SIR DTFACT-13–R-00002Attachment 11 - FAA Template for Submission of
Safety Risk Management Processes
Date(mm/dd/yy)
Type of Process
UAS, Manned, Other:
List
Author (Y/N), Team Member Implemented Oversight /
Compliance
Applicant Team Member YES NO YES NO
YES____ NO____ YES____ NO____ YES____ NO____ YES____ NO____ YES____ NO____ YES____ NO____ YES____ NO____ YES____ NO____ YES____ NO____ YES____ NO____ YES____ NO____ YES____ NO____ YES____ NO____ YES____ NO____ YES____ NO____ YES____ NO____ YES____ NO____ YES____ NO____ YES____ NO____ YES____ NO____

DTFACT-13-R-00002Amendment 04March 20, 2013
Page 68 of 70
21.12 Volume V - Attachment 12Form for Submission of Volume V – Experience
(File naming convention: XXXXX-05-ATT12)
Applicant:UAS Test Site Selection SIR DTFACT-13–R-00002Attachment 12 - FAA Template for Submission of
ExperienceApplicant/Team Member Name
Pilot Name Total Manned Hours
Total Unmanned Hours First Name Last Name
Describe the certification and licensing of all flight crew members, including visual observersResponse NTE 2 pages.Describe ability to obtain frequency spectrum approval, and current experience in completing application process, if any. Response NTE 1 page.The Applicant’s Team must have a minimum of five (5) years, within the past 7 years, of aviation research and development (R&D) experience. The Applicant’s Team must have at least one (1) year of UAS experience within the last five (5) years. The one year of UAS experience may be counted as part of the five (5) years R&D experience.Response NTE 2 pages.
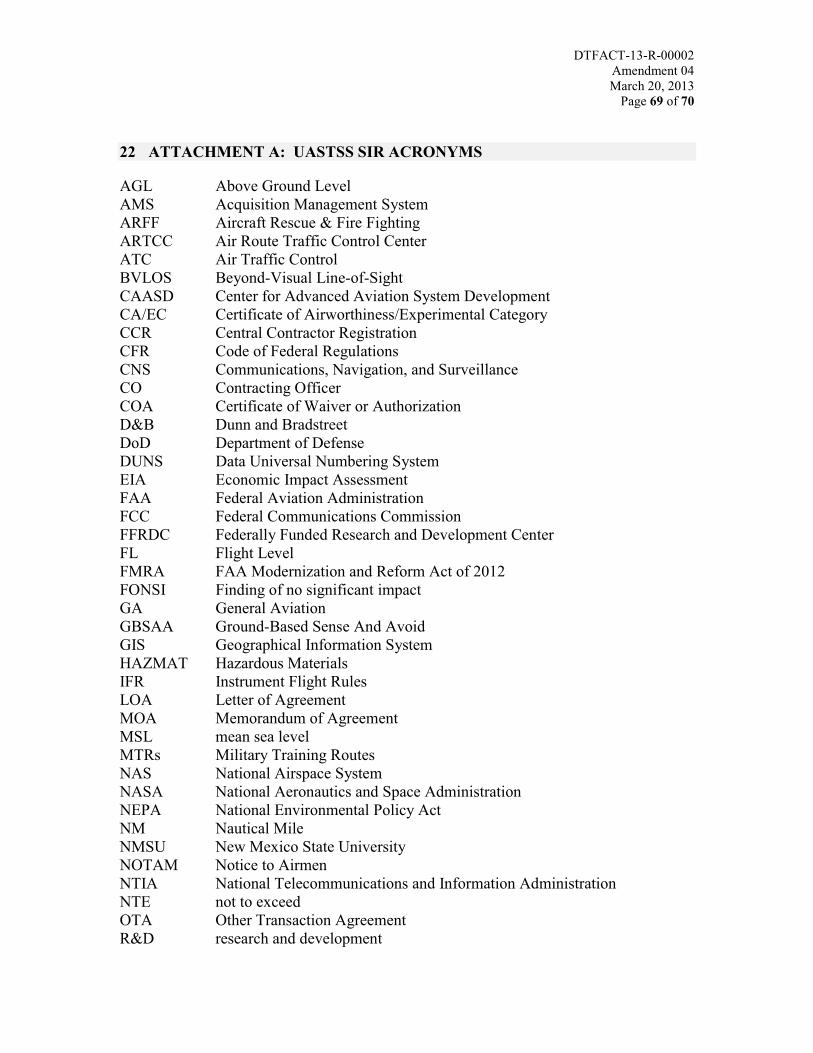
DTFACT-13-R-00002Amendment 04March 20, 2013
Page 69 of 70
22 ATTACHMENT A: UASTSS SIR ACRONYMS
AGL Above Ground LevelAMS Acquisition Management System ARFF Aircraft Rescue & Fire FightingARTCC Air Route Traffic Control CenterATC Air Traffic ControlBVLOS Beyond-Visual Line-of-Sight CAASD Center for Advanced Aviation System DevelopmentCA/EC Certificate of Airworthiness/Experimental CategoryCCR Central Contractor RegistrationCFR Code of Federal Regulations CNS Communications, Navigation, and SurveillanceCO Contracting Officer COA Certificate of Waiver or AuthorizationD&B Dunn and Bradstreet DoD Department of Defense DUNS Data Universal Numbering SystemEIA Economic Impact AssessmentFAA Federal Aviation Administration FCC Federal Communications CommissionFFRDC Federally Funded Research and Development CenterFL Flight LevelFMRA FAA Modernization and Reform Act of 2012FONSI Finding of no significant impactGA General AviationGBSAA Ground-Based Sense And AvoidGIS Geographical Information SystemHAZMAT Hazardous MaterialsIFR Instrument Flight RulesLOA Letter of AgreementMOA Memorandum of AgreementMSL mean sea level MTRs Military Training Routes NAS National Airspace System NASA National Aeronautics and Space Administration NEPA National Environmental Policy ActNM Nautical MileNMSU New Mexico State UniversityNOTAM Notice to AirmenNTIA National Telecommunications and Information AdministrationNTE not to exceed OTA Other Transaction Agreement R&D research and development
DTFACT-13-R-00002Amendment 04March 20, 2013
Page 70 of 70
SAA Special Activity Airspace SAIC Science Applications International CorporationSAM System for Award ManagementSIDs Standard Instrument Departures SIR Screening Information Request SOP Standard Operating Procedure SRMS Safety Risk Management System SSEB Site Selection Evaluation Board SSO Site Selection Official STARs Standard Terminal ArrivalsTMI Traffic Management InitiativesTER Technical Evaluation ReportTET Technical Evaluation TeamTRACON Terminal Radar Approach ControlUAS unmanned aircraft systems UASTSS Unmanned Aircraft Systems Test Site Selection VFR Visual Flight RulesVLOS Visual Line-of-Sight

1 A U V S I E c o n o m i c R e p o r t 2 0 1 3
THE ECONOMIC IMPACT OF UNMANNED AIRCRAFT SYSTEMS INTEGRATION IN THE UNITED STATES
MARCH 2013

Executive Summary........................................................ 2Total Economic Impact of UAS Integration in the United States (Table 1) ..................................................... 4Forecast............................................................................... 5Economic Impact Analysis............................................ 10Appendix A....................................................................... 21Appendix B....................................................................... 22Alabama Detailed Economic Impact............................ 23Alaska Detailed Economic Impact................................ 23Arizona Detailed Economic Impact............................. 23Arkansas Detailed Economic Impact........................... 23California Detailed Economic Impact.......................... 24Colorado Detailed Economic Impact.......................... 24Connecticut Detailed Economic Impact...................... 24Delaware Detailed Economic Impact......................... 24Florida Detailed Economic Impact............................. 25Georgia Detailed Economic Impact............................ 25Hawaii Detailed Economic Impact............................... 25Idaho Detailed Economic Impact................................ 25Illinois Detailed Economic Impact............................... 26Indiana Detailed Economic Impact.............................. 26Iowa Detailed Economic Impact.................................. 26Kansas Detailed Economic Impact.............................. 26Kentucky Detailed Economic Impact......................... 27Louisiana Detailed Economic Impact........................ 27Maine Detailed Economic Impact.............................. 27 Maryland Detailed Economic Impact.......................... 27Massachusetts Detailed Economic Impact..................28Michigan Detailed Economic Impact...........................28Minnesota Detailed Economic Impact.......................28Mississippi Detailed Economic Impact ........................28Missouri Detailed Economic Impact............................29Montana Detailed Economic Impact............................29Nebraska Detailed Economic Impact............................29Nevada Detailed Economic Impact..............................29New Hampshire Detailed Economic Impact.............30New Jersey Detailed Economic Impact.........................30New Mexico Detailed Economic Impact ......................30New York Detailed Economic Impact..........................30North Carolina Detailed Economic Impact.................. 31North Dakota Detailed Economic Impact.................. 31Ohio Detailed Economic Impact..................................31Oklahoma Detailed Economic Impact..........................31
About the Authors Darryl Jenkins, author of “The Handbook of Airline Economics,” is an airline analyst with more than 30 years of experience in the avia-tion industry. Jenkins also served as director of the Aviation Institute at George Washington University for more than 15 years. As an inde-pendent aviation consultant, Jenkins has worked for the majority of the world’s top 50 airlines. In addition, he has consulted for the FAA, DOT, NTSB and other U.S. government agencies as well as many foreign countries. Jenkins also is the author of several aviation books and is a regular commentator for major media including ABC, CBS, NBC, MSNBC, CNN, FOX and major print publications. Jenkins was a member of the Executive Committee of the White House Con-ference on Aviation Safety and Security.
Dr. Bijan Vasigh is professor of economics and finance in the De-partment of Business Administration at Embry-Riddle Aeronautical University in Daytona Beach, Florida, and a managing director at Aviation Consulting Group LLC. Vasigh received a Ph.D. in econom-ics from the State University of New York in 1984, and he has writ-ten and published many articles concerning the aviation industry. The articles have been published in numerous academic journals such as the “Handbook of Airline Economics,” “Journal of Economics and Finance,” “Journal of Transportation Management,” “Transportation Quarterly,” “Airport Business,” “Journal of Business and Economics” and “Journal of Travel Research.” He was a consultant with the Inter-national Civil Aviation Organization and provided assistance on the evolution of aeronautical charge structure for the Brazilian Institute of Civil Aviation. He is a member of the editorial board of “Journal of Air Transport Management,” the “Southwest Journal of Pure and Applied Mathematics” and “Journal of Air Transportation World Wide.” He is currently a member of the international faculty at the IATA Learning Center, where he is faculty leader of the Airline Finance and Account-ing Management division.
Oregon Detailed Economic Impact..............................32Pennsylvania Detailed Economic Impact.....................32Rhode Island Detailed Economic Impact.....................32South Carolina Detailed Economic Impact..................32South Dakota Detailed Economic Impact....................33Tennessee Detailed Economic Impact..........................33Texas Detailed Economic Impact..................................33Utah Detailed Economic Impact...................................33Vermont Detailed Economic Impact............................34Virginia Detailed Economic Impact..............................34Washington Detailed Economic Impact....................34West Virginia Detailed Economic Impact....................34Wisconsin Detailed Economic Impact.........................35Wyoming Detailed Economic Impact...........................35References......................................................................... 36AUVSI Fast Facts.............................................................. 38
Table of Contents
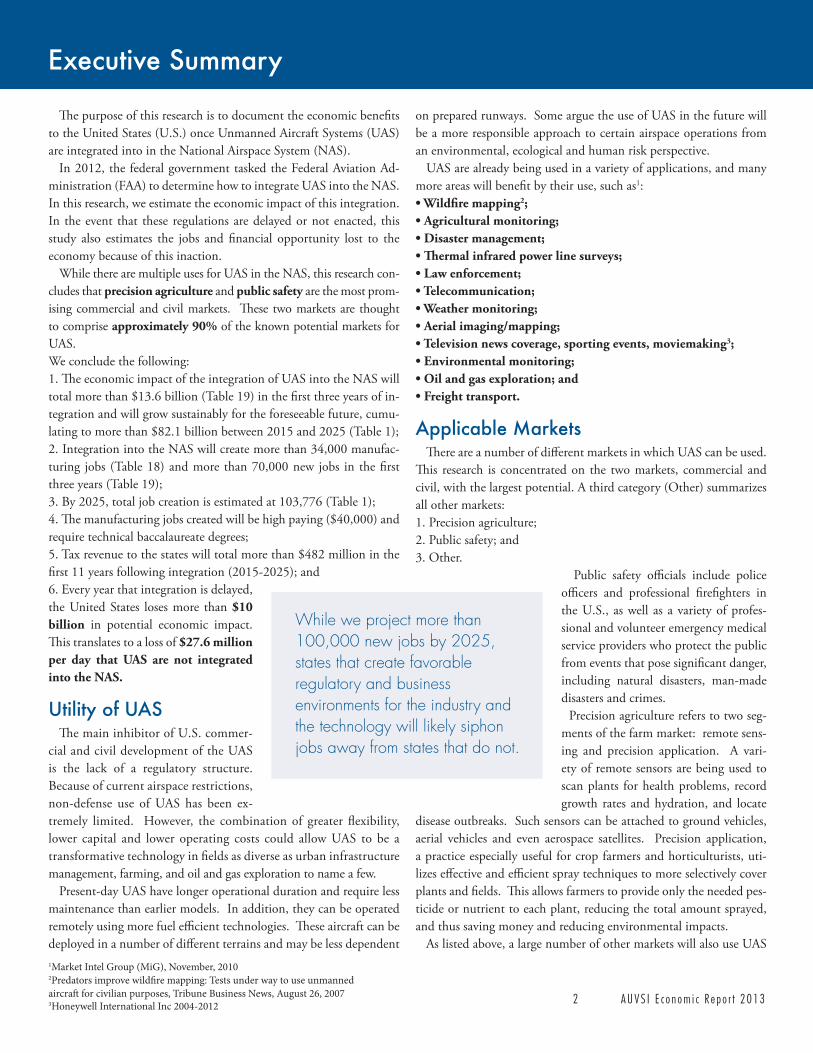
2 A U V S I E c o n o m i c R e p o r t 2 0 1 3
The purpose of this research is to document the economic benefits to the United States (U.S.) once Unmanned Aircraft Systems (UAS) are integrated into in the National Airspace System (NAS). In 2012, the federal government tasked the Federal Aviation Ad-ministration (FAA) to determine how to integrate UAS into the NAS. In this research, we estimate the economic impact of this integration. In the event that these regulations are delayed or not enacted, this study also estimates the jobs and financial opportunity lost to the economy because of this inaction. While there are multiple uses for UAS in the NAS, this research con-cludes that precision agriculture and public safety are the most prom-ising commercial and civil markets. These two markets are thought to comprise approximately 90% of the known potential markets for UAS.We conclude the following:1. The economic impact of the integration of UAS into the NAS will total more than $13.6 billion (Table 19) in the first three years of in-tegration and will grow sustainably for the foreseeable future, cumu-lating to more than $82.1 billion between 2015 and 2025 (Table 1);2. Integration into the NAS will create more than 34,000 manufac-turing jobs (Table 18) and more than 70,000 new jobs in the first three years (Table 19);3. By 2025, total job creation is estimated at 103,776 (Table 1);4. The manufacturing jobs created will be high paying ($40,000) and require technical baccalaureate degrees; 5. Tax revenue to the states will total more than $482 million in the first 11 years following integration (2015-2025); and6. Every year that integration is delayed, the United States loses more than $10 billion in potential economic impact. This translates to a loss of $27.6 million per day that UAS are not integrated into the NAS.
Utility of UAS The main inhibitor of U.S. commer-cial and civil development of the UAS is the lack of a regulatory structure. Because of current airspace restrictions, non-defense use of UAS has been ex-tremely limited. However, the combination of greater flexibility, lower capital and lower operating costs could allow UAS to be a transformative technology in fields as diverse as urban infrastructure management, farming, and oil and gas exploration to name a few. Present-day UAS have longer operational duration and require less maintenance than earlier models. In addition, they can be operated remotely using more fuel efficient technologies. These aircraft can be deployed in a number of different terrains and may be less dependent
on prepared runways. Some argue the use of UAS in the future will be a more responsible approach to certain airspace operations from an environmental, ecological and human risk perspective. UAS are already being used in a variety of applications, and many more areas will benefit by their use, such as1:
2;
3;
Applicable Markets There are a number of different markets in which UAS can be used. This research is concentrated on the two markets, commercial and civil, with the largest potential. A third category (Other) summarizes all other markets:1. Precision agriculture;2. Public safety; and3. Other.
Public safety officials include police officers and professional firefighters in the U.S., as well as a variety of profes-sional and volunteer emergency medical service providers who protect the public from events that pose significant danger, including natural disasters, man-made disasters and crimes. Precision agriculture refers to two seg-ments of the farm market: remote sens-ing and precision application. A vari-ety of remote sensors are being used to scan plants for health problems, record growth rates and hydration, and locate
disease outbreaks. Such sensors can be attached to ground vehicles, aerial vehicles and even aerospace satellites. Precision application, a practice especially useful for crop farmers and horticulturists, uti-lizes effective and efficient spray techniques to more selectively cover plants and fields. This allows farmers to provide only the needed pes-ticide or nutrient to each plant, reducing the total amount sprayed, and thus saving money and reducing environmental impacts. As listed above, a large number of other markets will also use UAS
Executive Summary
While we project more than 100,000 new jobs by 2025, states that create favorable regulatory and business environments for the industry and the technology will likely siphon jobs away from states that do not.
1Market Intel Group (MiG), November, 20102Predators improve wildfire mapping: Tests under way to use unmanned aircraft for civilian purposes, Tribune Business News, August 26, 20073Honeywell International Inc 2004-2012
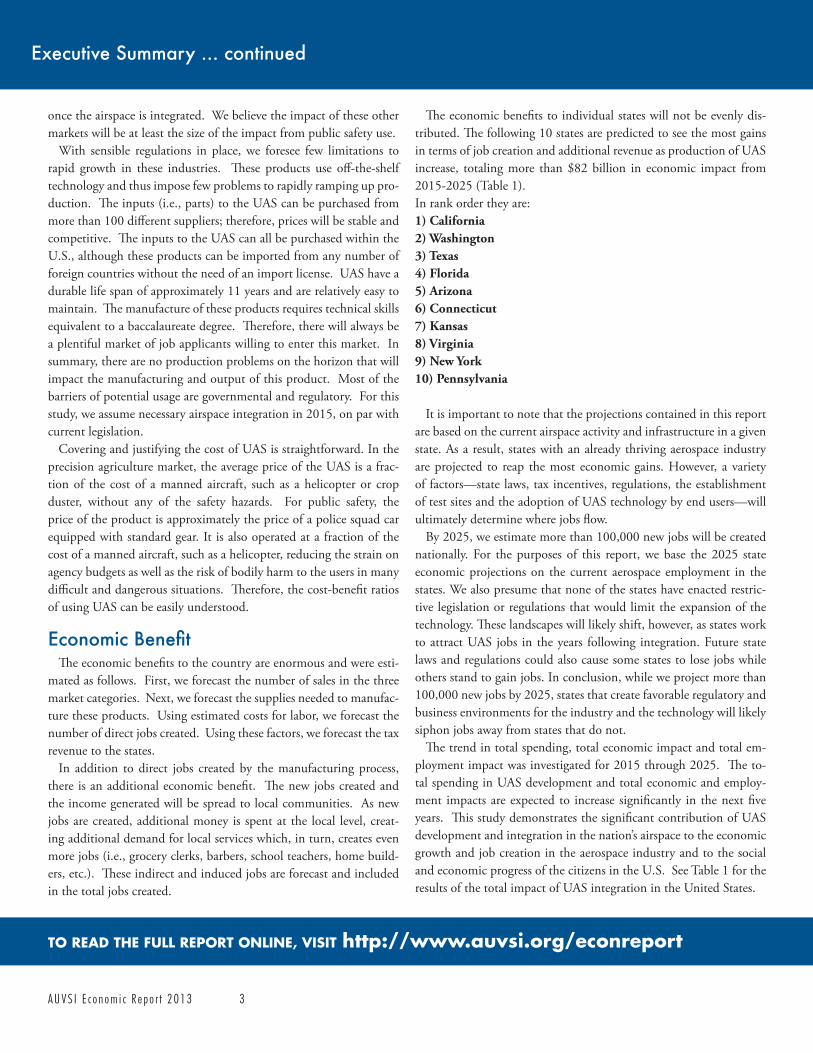
A U V S I E c o n o m i c R e p o r t 2 0 1 3 3
once the airspace is integrated. We believe the impact of these other markets will be at least the size of the impact from public safety use. With sensible regulations in place, we foresee few limitations to rapid growth in these industries. These products use off-the-shelf technology and thus impose few problems to rapidly ramping up pro-duction. The inputs (i.e., parts) to the UAS can be purchased from more than 100 different suppliers; therefore, prices will be stable and competitive. The inputs to the UAS can all be purchased within the U.S., although these products can be imported from any number of foreign countries without the need of an import license. UAS have a durable life span of approximately 11 years and are relatively easy to maintain. The manufacture of these products requires technical skills equivalent to a baccalaureate degree. Therefore, there will always be a plentiful market of job applicants willing to enter this market. In summary, there are no production problems on the horizon that will impact the manufacturing and output of this product. Most of the barriers of potential usage are governmental and regulatory. For this study, we assume necessary airspace integration in 2015, on par with current legislation. Covering and justifying the cost of UAS is straightforward. In the precision agriculture market, the average price of the UAS is a frac-tion of the cost of a manned aircraft, such as a helicopter or crop duster, without any of the safety hazards. For public safety, the price of the product is approximately the price of a police squad car equipped with standard gear. It is also operated at a fraction of the cost of a manned aircraft, such as a helicopter, reducing the strain on agency budgets as well as the risk of bodily harm to the users in many difficult and dangerous situations. Therefore, the cost-benefit ratios of using UAS can be easily understood.
������������ The economic benefits to the country are enormous and were esti-mated as follows. First, we forecast the number of sales in the three market categories. Next, we forecast the supplies needed to manufac-ture these products. Using estimated costs for labor, we forecast the number of direct jobs created. Using these factors, we forecast the tax revenue to the states. In addition to direct jobs created by the manufacturing process, there is an additional economic benefit. The new jobs created and the income generated will be spread to local communities. As new jobs are created, additional money is spent at the local level, creat-ing additional demand for local services which, in turn, creates even more jobs (i.e., grocery clerks, barbers, school teachers, home build-ers, etc.). These indirect and induced jobs are forecast and included in the total jobs created.
The economic benefits to individual states will not be evenly dis-tributed. The following 10 states are predicted to see the most gains in terms of job creation and additional revenue as production of UAS increase, totaling more than $82 billion in economic impact from 2015-2025 (Table 1). In rank order they are:1) California
5) Arizona6) Connecticut7) Kansas8) Virginia
It is important to note that the projections contained in this report are based on the current airspace activity and infrastructure in a given state. As a result, states with an already thriving aerospace industry are projected to reap the most economic gains. However, a variety of factors—state laws, tax incentives, regulations, the establishment of test sites and the adoption of UAS technology by end users—will ultimately determine where jobs flow. By 2025, we estimate more than 100,000 new jobs will be created nationally. For the purposes of this report, we base the 2025 state economic projections on the current aerospace employment in the states. We also presume that none of the states have enacted restric-tive legislation or regulations that would limit the expansion of the technology. These landscapes will likely shift, however, as states work to attract UAS jobs in the years following integration. Future state laws and regulations could also cause some states to lose jobs while others stand to gain jobs. In conclusion, while we project more than 100,000 new jobs by 2025, states that create favorable regulatory and business environments for the industry and the technology will likely siphon jobs away from states that do not. The trend in total spending, total economic impact and total em-ployment impact was investigated for 2015 through 2025. The to-tal spending in UAS development and total economic and employ-ment impacts are expected to increase significantly in the next five years. This study demonstrates the significant contribution of UAS development and integration in the nation’s airspace to the economic growth and job creation in the aerospace industry and to the social and economic progress of the citizens in the U.S. See Table 1 for the results of the total impact of UAS integration in the United States.
Executive Summary ... continued
TO READ THE FULL REPORT ONLINE, VISIT http://www.auvsi.org/econreport
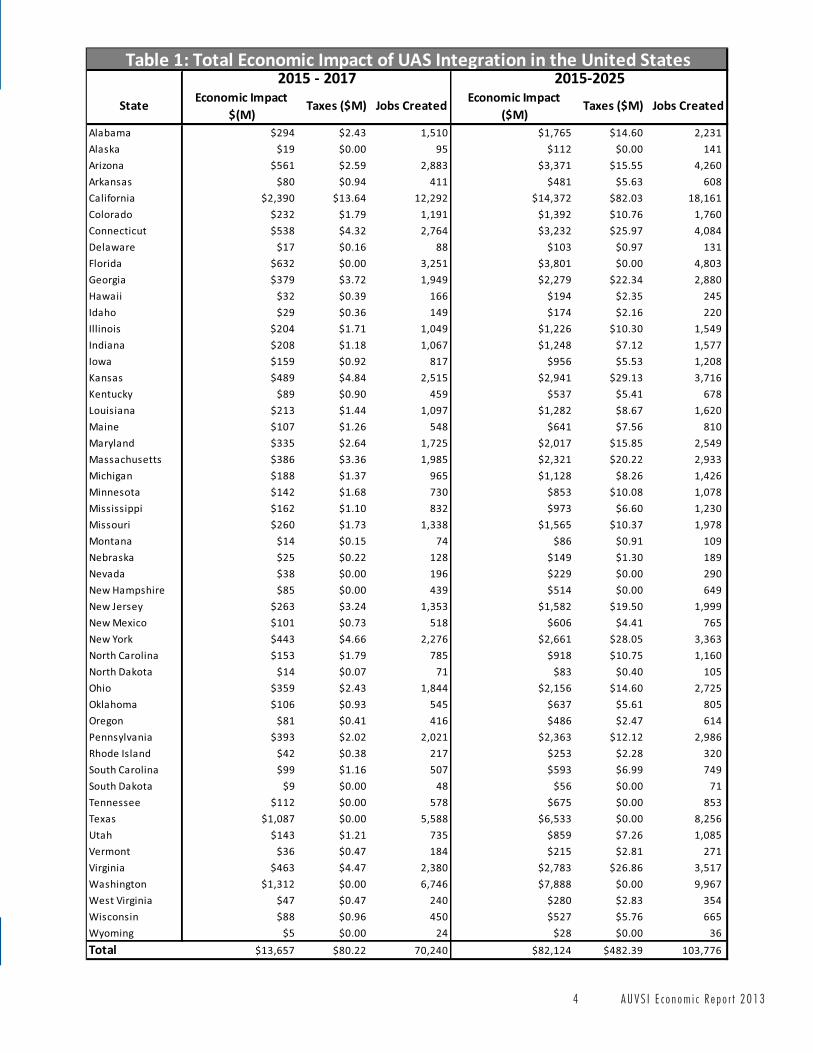
4 A U V S I E c o n o m i c R e p o r t 2 0 1 3
State Economic Impact $(M)
Taxes ($M) Jobs Created Economic Impact ($M)
Taxes ($M) Jobs Created
Alabama $294 $2.43 1,510 $1,765 $14.60 2,231 Alaska $19 $0.00 95 $112 $0.00 141 Arizona $561 $2.59 2,883 $3,371 $15.55 4,260 Arkansas $80 $0.94 411 $481 $5.63 608 California $2,390 $13.64 12,292 $14,372 $82.03 18,161 Colorado $232 $1.79 1,191 $1,392 $10.76 1,760 Connecticut $538 $4.32 2,764 $3,232 $25.97 4,084 Delaware $17 $0.16 88 $103 $0.97 131 Florida $632 $0.00 3,251 $3,801 $0.00 4,803 Georgia $379 $3.72 1,949 $2,279 $22.34 2,880 Hawaii $32 $0.39 166 $194 $2.35 245 Idaho $29 $0.36 149 $174 $2.16 220 Illinois $204 $1.71 1,049 $1,226 $10.30 1,549 Indiana $208 $1.18 1,067 $1,248 $7.12 1,577 Iowa $159 $0.92 817 $956 $5.53 1,208 Kansas $489 $4.84 2,515 $2,941 $29.13 3,716 Kentucky $89 $0.90 459 $537 $5.41 678 Louisiana $213 $1.44 1,097 $1,282 $8.67 1,620 Maine $107 $1.26 548 $641 $7.56 810 Maryland $335 $2.64 1,725 $2,017 $15.85 2,549 Massachusetts $386 $3.36 1,985 $2,321 $20.22 2,933 Michigan $188 $1.37 965 $1,128 $8.26 1,426 Minnesota $142 $1.68 730 $853 $10.08 1,078 Mississippi $162 $1.10 832 $973 $6.60 1,230 Missouri $260 $1.73 1,338 $1,565 $10.37 1,978 Montana $14 $0.15 74 $86 $0.91 109 Nebraska $25 $0.22 128 $149 $1.30 189 Nevada $38 $0.00 196 $229 $0.00 290 New Hampshire $85 $0.00 439 $514 $0.00 649 New Jersey $263 $3.24 1,353 $1,582 $19.50 1,999 New Mexico $101 $0.73 518 $606 $4.41 765 New York $443 $4.66 2,276 $2,661 $28.05 3,363 North Carolina $153 $1.79 785 $918 $10.75 1,160 North Dakota $14 $0.07 71 $83 $0.40 105 Ohio $359 $2.43 1,844 $2,156 $14.60 2,725 Oklahoma $106 $0.93 545 $637 $5.61 805 Oregon $81 $0.41 416 $486 $2.47 614 Pennsylvania $393 $2.02 2,021 $2,363 $12.12 2,986 Rhode Island $42 $0.38 217 $253 $2.28 320 South Carolina $99 $1.16 507 $593 $6.99 749 South Dakota $9 $0.00 48 $56 $0.00 71 Tennessee $112 $0.00 578 $675 $0.00 853 Texas $1,087 $0.00 5,588 $6,533 $0.00 8,256 Utah $143 $1.21 735 $859 $7.26 1,085 Vermont $36 $0.47 184 $215 $2.81 271 Virginia $463 $4.47 2,380 $2,783 $26.86 3,517 Washington $1,312 $0.00 6,746 $7,888 $0.00 9,967 West Virginia $47 $0.47 240 $280 $2.83 354 Wisconsin $88 $0.96 450 $527 $5.76 665 Wyoming $5 $0.00 24 $28 $0.00 36 Total $13,657 $80.22 70,240 $82,124 $482.39 103,776
2015-20252015 - 2017 Table 1: Total Economic Impact of UAS Integration in the United States

A U V S I E c o n o m i c R e p o r t 2 0 1 3 5
Forecast
In this chapter, we describe the methodology for the forecasts we used as inputs to the economic benefits section. In accomplishing this task, we were fortunate to obtain and use comparable product sales from other countries. In making the forecasts, we relied on four different methods:1) Comparable sales from other countries;2) Survey results;3) Land ratios; and4) A literature search on rates of adoption of new technology.
The four different methodologies yielded similar results and pro-vide confidence in our final results.
Throughout this study, we use the following terms. When we use the term output, we are referring to the UAS. The inputs to the UAS are the parts and labor that go into making these products. In turn, the parts that go into the inputs we refer to as derived demand.
As part of this section, we provide a detailed discussion of the fac-tors that may make our forecasts inaccurate and their potential im-pact. Our forecasts are for an 11-year period. That unit of measure-ment was chosen as that is the expected life of a UAS. We did not include maintenance, training or other revenue streams, which makes our overall estimates conservative. In addition, there are multiple op-tions on sales including leasing the equipment and having third-party providers as an outsourced service, all of which add to our conserva-tive estimates.
Sales in Foreign CountriesOther countries have already adopted UAS technology from a zero
base (i.e., first year of adoption). By now, these technologies have been operational for more than two decades. The growth curve is found to be logistic with a rapid beginning and then a leveling off of the market (Figure 1). The issue is not whether these products will be adopted once the airspace is integrated, but at what rate(s). The experience in Japan started out at rates of growth in excess of 20% annually. This was from no unmanned vehicles in 1990 (i.e., the zero base), where neither the companies nor the consumers had previous experience with this technology (see Appendix A for detailed data).
As is readily apparent, the growth rates in the early years in Japan were very high. The question of interest is: How fast will growth occur in the U.S.? We chose a short time period for growth in the U.S. (doubling the first year, 50% growth the next year and thereaf-ter a 5% growth rate). Our justification is as follows. First, there is considerable experience with these products. American farmers are not starting out from a zero-knowledge base as did Japan. Second, UAS are not sold in the U.S. domestic market only because FAA regulations prohibit them in the nation’s airspace. It is noted that the dampening of the Japanese growth curve happened within six years. The literature review found higher initial rates of product acceptance than the previous Japanese experience and lower leveling off of rates.
Adoption Rates of New TechnologyThere are many factors that influence the rate at which new tech-
nologies are adopted and diffused into a society. We found consider-able literature on this topic. The conclusion from the brief search we conducted is that new technologies are either accepted or rejected quickly. There is already a trade association that is doing outreach to the primary targets and showing products in their trade show(s). Because there is previous experience in this field, we reject the notion that these products will not be adopted. However, it is suggested that a follow up to this study be conducted on adoption of new technol-ogy. There is considerable literature on this topic, which needs to be investigated, and will help develop further adoption strategies.
MethodologyWe performed three separate forecasts for this study:
1) The estimated number of sales by state;2) The estimated sales by state for the inputs to the final product; and3) The estimated sales by state for the derived demand for the final products.
To complete these forecasts, we developed a telephone survey and pilot-tested it on five participants to refine our survey questions. We next conducted 30 telephone interviews with industry experts. An industry expert was defined as a person with more than three years of practical and relevant experience. Each interview lasted about 30 minutes. The participants were guaranteed confidentiality so we can-not divulge the individual results. However, we were able to obtain a reasonable estimate on what the group as a whole felt was the size of the market and the cost structure. Because there was considerable variance in these estimates, we ignored the outliers and calculated the average cost structure. We estimate that approximately 60% of the overall cost of a UAS is parts with an average annual labor cost of $37,000. In this report, we use $40,000 and hold it at a con-stant cost, as we do with the parts numbers. Thus the results can be interpreted as constant dollars over the entire term, as we are not forecasting the inflation rate. As for profitability, we consider this a competitive industry with a normal rate of return.
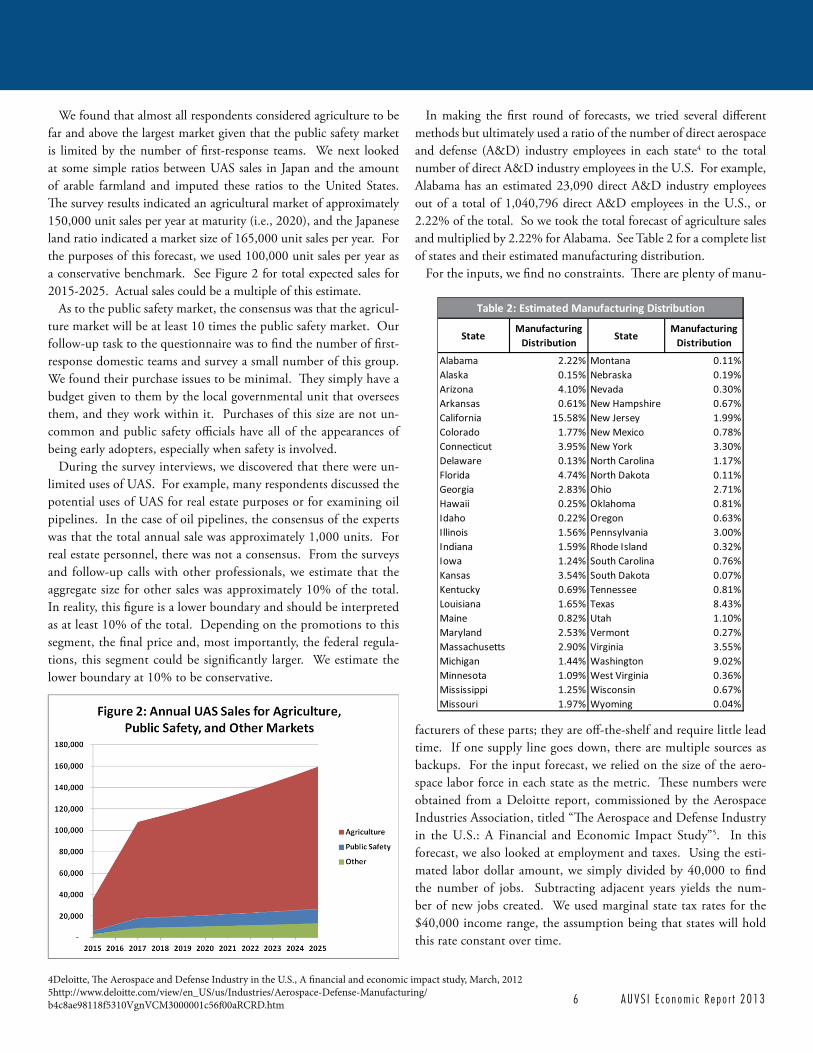
6 A U V S I E c o n o m i c R e p o r t 2 0 1 3
We found that almost all respondents considered agriculture to be far and above the largest market given that the public safety market is limited by the number of first-response teams. We next looked at some simple ratios between UAS sales in Japan and the amount of arable farmland and imputed these ratios to the United States. The survey results indicated an agricultural market of approximately 150,000 unit sales per year at maturity (i.e., 2020), and the Japanese land ratio indicated a market size of 165,000 unit sales per year. For the purposes of this forecast, we used 100,000 unit sales per year as a conservative benchmark. See Figure 2 for total expected sales for 2015-2025. Actual sales could be a multiple of this estimate.
As to the public safety market, the consensus was that the agricul-ture market will be at least 10 times the public safety market. Our follow-up task to the questionnaire was to find the number of first- response domestic teams and survey a small number of this group. We found their purchase issues to be minimal. They simply have a budget given to them by the local governmental unit that oversees them, and they work within it. Purchases of this size are not un-common and public safety officials have all of the appearances of being early adopters, especially when safety is involved.
During the survey interviews, we discovered that there were un-limited uses of UAS. For example, many respondents discussed the potential uses of UAS for real estate purposes or for examining oil pipelines. In the case of oil pipelines, the consensus of the experts was that the total annual sale was approximately 1,000 units. For real estate personnel, there was not a consensus. From the surveys and follow-up calls with other professionals, we estimate that the aggregate size for other sales was approximately 10% of the total. In reality, this figure is a lower boundary and should be interpreted as at least 10% of the total. Depending on the promotions to this segment, the final price and, most importantly, the federal regula-tions, this segment could be significantly larger. We estimate the lower boundary at 10% to be conservative.
In making the first round of forecasts, we tried several different methods but ultimately used a ratio of the number of direct aerospace and defense (A&D) industry employees in each state4 to the total number of direct A&D industry employees in the U.S. For example, Alabama has an estimated 23,090 direct A&D industry employees out of a total of 1,040,796 direct A&D employees in the U.S., or 2.22% of the total. So we took the total forecast of agriculture sales and multiplied by 2.22% for Alabama. See Table 2 for a complete list of states and their estimated manufacturing distribution.
For the inputs, we find no constraints. There are plenty of manu-
facturers of these parts; they are off-the-shelf and require little lead time. If one supply line goes down, there are multiple sources as backups. For the input forecast, we relied on the size of the aero-space labor force in each state as the metric. These numbers were obtained from a Deloitte report, commissioned by the Aerospace Industries Association, titled “The Aerospace and Defense Industry in the U.S.: A Financial and Economic Impact Study”5. In this forecast, we also looked at employment and taxes. Using the esti-mated labor dollar amount, we simply divided by 40,000 to find the number of jobs. Subtracting adjacent years yields the num-ber of new jobs created. We used marginal state tax rates for the $40,000 income range, the assumption being that states will hold this rate constant over time.
Alabama 2.22% Montana 0.11%Alaska 0.15% Nebraska 0.19%Arizona 4.10% Nevada 0.30%Arkansas 0.61% New Hampshire 0.67%California 15.58% New Jersey 1.99%Colorado 1.77% New Mexico 0.78%Connecticut 3.95% New York 3.30%Delaware 0.13% North Carolina 1.17%Florida 4.74% North Dakota 0.11%Georgia 2.83% Ohio 2.71%Hawaii 0.25% Oklahoma 0.81%Idaho 0.22% Oregon 0.63%Illinois 1.56% Pennsylvania 3.00%Indiana 1.59% Rhode Island 0.32%Iowa 1.24% South Carolina 0.76%Kansas 3.54% South Dakota 0.07%Kentucky 0.69% Tennessee 0.81%Louisiana 1.65% Texas 8.43%Maine 0.82% Utah 1.10%Maryland 2.53% Vermont 0.27%Massachusetts 2.90% Virginia 3.55%Michigan 1.44% Washington 9.02%Minnesota 1.09% West Virginia 0.36%Mississippi 1.25% Wisconsin 0.67%Missouri 1.97% Wyoming 0.04%
Manufacturing Distribution
StateManufacturing
Distribution
Table 2: Estimated Manufacturing Distribution
State
4Deloitte, The Aerospace and Defense Industry in the U.S., A financial and economic impact study, March, 2012 5http://www.deloitte.com/view/en_US/us/Industries/Aerospace-Defense-Manufacturing/b4c8ae98118f5310VgnVCM3000001c56f00aRCRD.htm
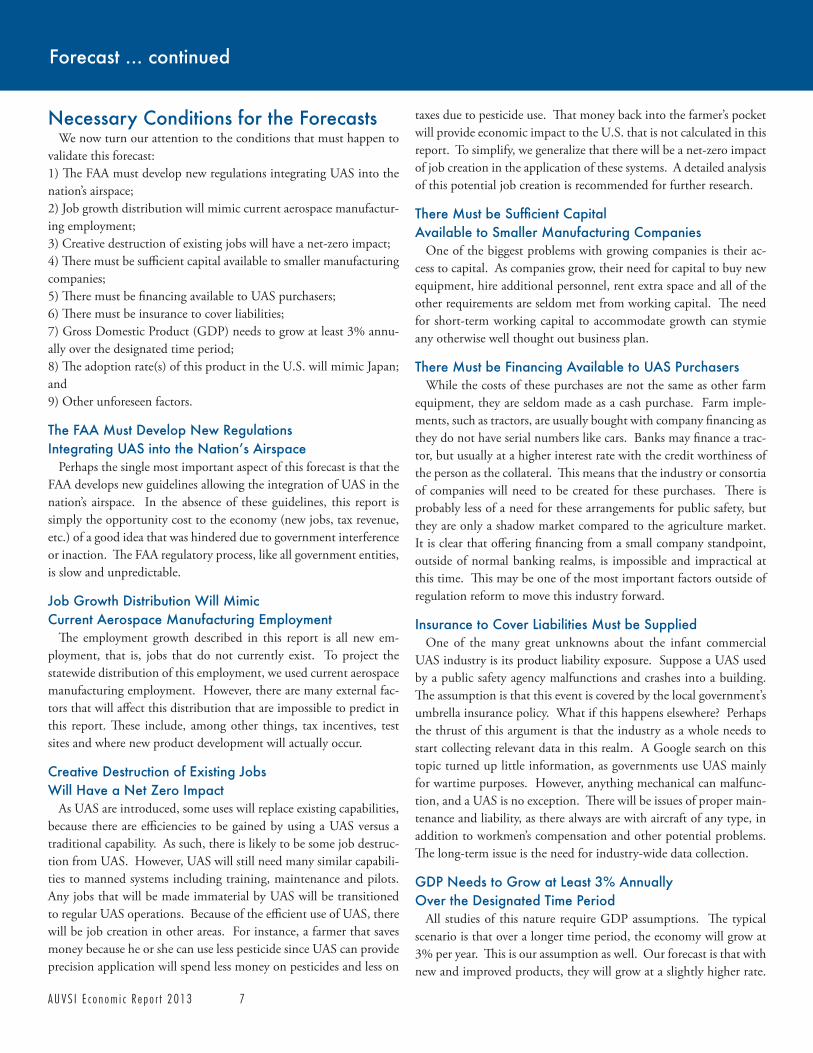
A U V S I E c o n o m i c R e p o r t 2 0 1 3 7
Forecast ... continued
Necessary Conditions for the Forecasts We now turn our attention to the conditions that must happen to validate this forecast: 1) The FAA must develop new regulations integrating UAS into the nation’s airspace;2) Job growth distribution will mimic current aerospace manufactur-ing employment;3) Creative destruction of existing jobs will have a net-zero impact;4) There must be sufficient capital available to smaller manufacturing companies;5) There must be financing available to UAS purchasers;6) There must be insurance to cover liabilities;7) Gross Domestic Product (GDP) needs to grow at least 3% annu-ally over the designated time period;8) The adoption rate(s) of this product in the U.S. will mimic Japan; and9) Other unforeseen factors.
The FAA Must Develop New Regulations �������������������������������������� Perhaps the single most important aspect of this forecast is that the FAA develops new guidelines allowing the integration of UAS in the nation’s airspace. In the absence of these guidelines, this report is simply the opportunity cost to the economy (new jobs, tax revenue, etc.) of a good idea that was hindered due to government interference or inaction. The FAA regulatory process, like all government entities, is slow and unpredictable.
Job Growth Distribution Will Mimic Current Aerospace Manufacturing Employment The employment growth described in this report is all new em-ployment, that is, jobs that do not currently exist. To project the statewide distribution of this employment, we used current aerospace manufacturing employment. However, there are many external fac-tors that will affect this distribution that are impossible to predict in this report. These include, among other things, tax incentives, test sites and where new product development will actually occur.
Creative Destruction of Existing Jobs Will Have a Net Zero Impact As UAS are introduced, some uses will replace existing capabilities, because there are efficiencies to be gained by using a UAS versus a traditional capability. As such, there is likely to be some job destruc-tion from UAS. However, UAS will still need many similar capabili-ties to manned systems including training, maintenance and pilots. Any jobs that will be made immaterial by UAS will be transitioned to regular UAS operations. Because of the efficient use of UAS, there will be job creation in other areas. For instance, a farmer that saves money because he or she can use less pesticide since UAS can provide precision application will spend less money on pesticides and less on
taxes due to pesticide use. That money back into the farmer’s pocket will provide economic impact to the U.S. that is not calculated in this report. To simplify, we generalize that there will be a net-zero impact of job creation in the application of these systems. A detailed analysis of this potential job creation is recommended for further research.
���������������������������� Available to Smaller Manufacturing Companies One of the biggest problems with growing companies is their ac-cess to capital. As companies grow, their need for capital to buy new equipment, hire additional personnel, rent extra space and all of the other requirements are seldom met from working capital. The need for short-term working capital to accommodate growth can stymie any otherwise well thought out business plan.
There Must be Financing Available to UAS Purchasers While the costs of these purchases are not the same as other farm equipment, they are seldom made as a cash purchase. Farm imple-ments, such as tractors, are usually bought with company financing as they do not have serial numbers like cars. Banks may finance a trac-tor, but usually at a higher interest rate with the credit worthiness of the person as the collateral. This means that the industry or consortia of companies will need to be created for these purchases. There is probably less of a need for these arrangements for public safety, but they are only a shadow market compared to the agriculture market. It is clear that offering financing from a small company standpoint, outside of normal banking realms, is impossible and impractical at this time. This may be one of the most important factors outside of regulation reform to move this industry forward.
Insurance to Cover Liabilities Must be Supplied One of the many great unknowns about the infant commercial UAS industry is its product liability exposure. Suppose a UAS used by a public safety agency malfunctions and crashes into a building. The assumption is that this event is covered by the local government’s umbrella insurance policy. What if this happens elsewhere? Perhaps the thrust of this argument is that the industry as a whole needs to start collecting relevant data in this realm. A Google search on this topic turned up little information, as governments use UAS mainly for wartime purposes. However, anything mechanical can malfunc-tion, and a UAS is no exception. There will be issues of proper main-tenance and liability, as there always are with aircraft of any type, in addition to workmen’s compensation and other potential problems. The long-term issue is the need for industry-wide data collection.
GDP Needs to Grow at Least 3% Annually Over the Designated Time Period All studies of this nature require GDP assumptions. The typical scenario is that over a longer time period, the economy will grow at 3% per year. This is our assumption as well. Our forecast is that with new and improved products, they will grow at a slightly higher rate.
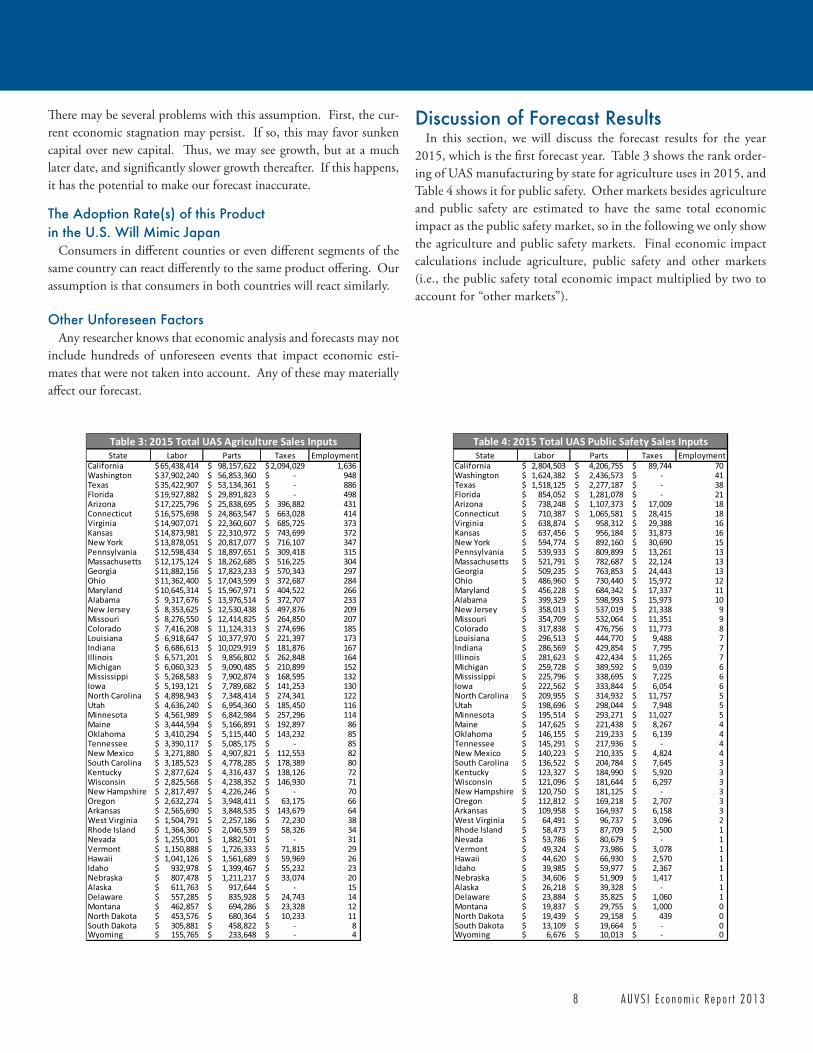
8 A U V S I E c o n o m i c R e p o r t 2 0 1 3
There may be several problems with this assumption. First, the cur-rent economic stagnation may persist. If so, this may favor sunken capital over new capital. Thus, we may see growth, but at a much later date, and significantly slower growth thereafter. If this happens, it has the potential to make our forecast inaccurate.
The Adoption Rate(s) of this Product in the U.S. Will Mimic Japan Consumers in different counties or even different segments of the same country can react differently to the same product offering. Our assumption is that consumers in both countries will react similarly.
Other Unforeseen Factors Any researcher knows that economic analysis and forecasts may not include hundreds of unforeseen events that impact economic esti-mates that were not taken into account. Any of these may materially affect our forecast.
Discussion of Forecast Results In this section, we will discuss the forecast results for the year 2015, which is the first forecast year. Table 3 shows the rank order-ing of UAS manufacturing by state for agriculture uses in 2015, and Table 4 shows it for public safety. Other markets besides agriculture and public safety are estimated to have the same total economic impact as the public safety market, so in the following we only show the agriculture and public safety markets. Final economic impact calculations include agriculture, public safety and other markets (i.e., the public safety total economic impact multiplied by two to account for “other markets”).
State Labor Parts Taxes EmploymentCalifornia 65,438,414$ 98,157,622$ 2,094,029$ 1,636 Washington 37,902,240$ 56,853,360$ -$ 948 Texas 35,422,907$ 53,134,361$ -$ 886 Florida 19,927,882$ 29,891,823$ -$ 498 Arizona 17,225,796$ 25,838,695$ 396,882$ 431 Connecticut 16,575,698$ 24,863,547$ 663,028$ 414 Virginia 14,907,071$ 22,360,607$ 685,725$ 373 Kansas 14,873,981$ 22,310,972$ 743,699$ 372 New York 13,878,051$ 20,817,077$ 716,107$ 347 Pennsylvania 12,598,434$ 18,897,651$ 309,418$ 315 Massachusetts 12,175,124$ 18,262,685$ 516,225$ 304 Georgia 11,882,156$ 17,823,233$ 570,343$ 297 Ohio 11,362,400$ 17,043,599$ 372,687$ 284 Maryland 10,645,314$ 15,967,971$ 404,522$ 266 Alabama 9,317,676$ 13,976,514$ 372,707$ 233 New Jersey 8,353,625$ 12,530,438$ 497,876$ 209 Missouri 8,276,550$ 12,414,825$ 264,850$ 207 Colorado 7,416,208$ 11,124,313$ 274,696$ 185 Louisiana 6,918,647$ 10,377,970$ 221,397$ 173 Indiana 6,686,613$ 10,029,919$ 181,876$ 167 Illinois 6,571,201$ 9,856,802$ 262,848$ 164 Michigan 6,060,323$ 9,090,485$ 210,899$ 152 Mississippi 5,268,583$ 7,902,874$ 168,595$ 132 Iowa 5,193,121$ 7,789,682$ 141,253$ 130 North Carolina 4,898,943$ 7,348,414$ 274,341$ 122 Utah 4,636,240$ 6,954,360$ 185,450$ 116 Minnesota 4,561,989$ 6,842,984$ 257,296$ 114 Maine 3,444,594$ 5,166,891$ 192,897$ 86 Oklahoma 3,410,294$ 5,115,440$ 143,232$ 85 Tennessee 3,390,117$ 5,085,175$ -$ 85 New Mexico 3,271,880$ 4,907,821$ 112,553$ 82 South Carolina 3,185,523$ 4,778,285$ 178,389$ 80 Kentucky 2,877,624$ 4,316,437$ 138,126$ 72 Wisconsin 2,825,568$ 4,238,352$ 146,930$ 71 New Hampshire 2,817,497$ 4,226,246$ -$ 70 Oregon 2,632,274$ 3,948,411$ 63,175$ 66 Arkansas 2,565,690$ 3,848,535$ 143,679$ 64 West Virginia 1,504,791$ 2,257,186$ 72,230$ 38 Rhode Island 1,364,360$ 2,046,539$ 58,326$ 34 Nevada 1,255,001$ 1,882,501$ -$ 31 Vermont 1,150,888$ 1,726,333$ 71,815$ 29 Hawaii 1,041,126$ 1,561,689$ 59,969$ 26 Idaho 932,978$ 1,399,467$ 55,232$ 23 Nebraska 807,478$ 1,211,217$ 33,074$ 20 Alaska 611,763$ 917,644$ -$ 15 Delaware 557,285$ 835,928$ 24,743$ 14 Montana 462,857$ 694,286$ 23,328$ 12 North Dakota 453,576$ 680,364$ 10,233$ 11 South Dakota 305,881$ 458,822$ -$ 8 Wyoming 155,765$ 233,648$ -$ 4
Table 3: 2015 Total UAS Agriculture Sales InputsState Labor Parts Taxes Employment
California 2,804,503$ 4,206,755$ 89,744$ 70 Washington 1,624,382$ 2,436,573$ -$ 41 Texas 1,518,125$ 2,277,187$ -$ 38 Florida 854,052$ 1,281,078$ -$ 21 Arizona 738,248$ 1,107,373$ 17,009$ 18 Connecticut 710,387$ 1,065,581$ 28,415$ 18 Virginia 638,874$ 958,312$ 29,388$ 16 Kansas 637,456$ 956,184$ 31,873$ 16 New York 594,774$ 892,160$ 30,690$ 15 Pennsylvania 539,933$ 809,899$ 13,261$ 13 Massachusetts 521,791$ 782,687$ 22,124$ 13 Georgia 509,235$ 763,853$ 24,443$ 13 Ohio 486,960$ 730,440$ 15,972$ 12 Maryland 456,228$ 684,342$ 17,337$ 11 Alabama 399,329$ 598,993$ 15,973$ 10 New Jersey 358,013$ 537,019$ 21,338$ 9 Missouri 354,709$ 532,064$ 11,351$ 9 Colorado 317,838$ 476,756$ 11,773$ 8 Louisiana 296,513$ 444,770$ 9,488$ 7 Indiana 286,569$ 429,854$ 7,795$ 7 Illinois 281,623$ 422,434$ 11,265$ 7 Michigan 259,728$ 389,592$ 9,039$ 6 Mississippi 225,796$ 338,695$ 7,225$ 6 Iowa 222,562$ 333,844$ 6,054$ 6 North Carolina 209,955$ 314,932$ 11,757$ 5 Utah 198,696$ 298,044$ 7,948$ 5 Minnesota 195,514$ 293,271$ 11,027$ 5 Maine 147,625$ 221,438$ 8,267$ 4 Oklahoma 146,155$ 219,233$ 6,139$ 4 Tennessee 145,291$ 217,936$ -$ 4 New Mexico 140,223$ 210,335$ 4,824$ 4 South Carolina 136,522$ 204,784$ 7,645$ 3 Kentucky 123,327$ 184,990$ 5,920$ 3 Wisconsin 121,096$ 181,644$ 6,297$ 3 New Hampshire 120,750$ 181,125$ -$ 3 Oregon 112,812$ 169,218$ 2,707$ 3 Arkansas 109,958$ 164,937$ 6,158$ 3 West Virginia 64,491$ 96,737$ 3,096$ 2 Rhode Island 58,473$ 87,709$ 2,500$ 1 Nevada 53,786$ 80,679$ -$ 1 Vermont 49,324$ 73,986$ 3,078$ 1 Hawaii 44,620$ 66,930$ 2,570$ 1 Idaho 39,985$ 59,977$ 2,367$ 1 Nebraska 34,606$ 51,909$ 1,417$ 1 Alaska 26,218$ 39,328$ -$ 1 Delaware 23,884$ 35,825$ 1,060$ 1 Montana 19,837$ 29,755$ 1,000$ 0 North Dakota 19,439$ 29,158$ 439$ 0 South Dakota 13,109$ 19,664$ -$ 0 Wyoming 6,676$ 10,013$ -$ 0
Table 4: 2015 Total UAS Public Safety Sales Inputs
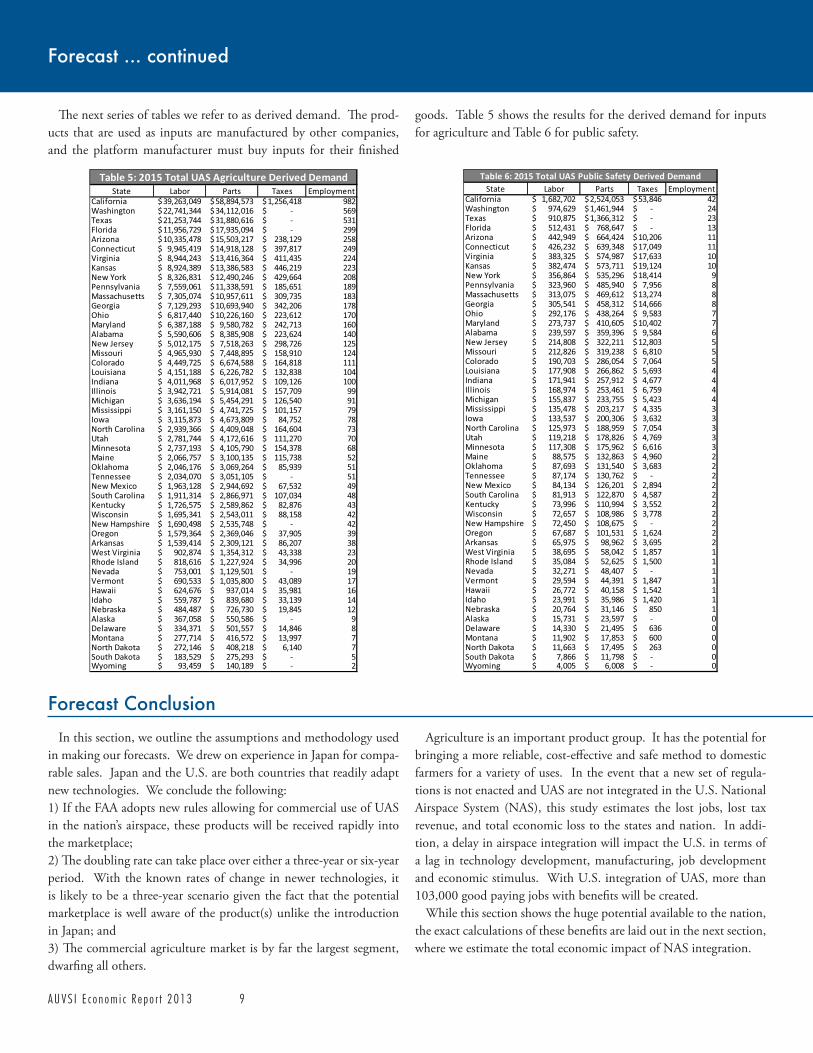
A U V S I E c o n o m i c R e p o r t 2 0 1 3 9
Forecast ... continued
The next series of tables we refer to as derived demand. The prod-ucts that are used as inputs are manufactured by other companies, and the platform manufacturer must buy inputs for their finished
goods. Table 5 shows the results for the derived demand for inputs for agriculture and Table 6 for public safety.
State Labor Parts Taxes EmploymentCalifornia 39,263,049$ 58,894,573$ 1,256,418$ 982Washington 22,741,344$ 34,112,016$ -$ 569Texas 21,253,744$ 31,880,616$ -$ 531Florida 11,956,729$ 17,935,094$ -$ 299Arizona 10,335,478$ 15,503,217$ 238,129$ 258Connecticut 9,945,419$ 14,918,128$ 397,817$ 249Virginia 8,944,243$ 13,416,364$ 411,435$ 224Kansas 8,924,389$ 13,386,583$ 446,219$ 223New York 8,326,831$ 12,490,246$ 429,664$ 208Pennsylvania 7,559,061$ 11,338,591$ 185,651$ 189Massachusetts 7,305,074$ 10,957,611$ 309,735$ 183Georgia 7,129,293$ 10,693,940$ 342,206$ 178Ohio 6,817,440$ 10,226,160$ 223,612$ 170Maryland 6,387,188$ 9,580,782$ 242,713$ 160Alabama 5,590,606$ 8,385,908$ 223,624$ 140New Jersey 5,012,175$ 7,518,263$ 298,726$ 125Missouri 4,965,930$ 7,448,895$ 158,910$ 124Colorado 4,449,725$ 6,674,588$ 164,818$ 111Louisiana 4,151,188$ 6,226,782$ 132,838$ 104Indiana 4,011,968$ 6,017,952$ 109,126$ 100Illinois 3,942,721$ 5,914,081$ 157,709$ 99Michigan 3,636,194$ 5,454,291$ 126,540$ 91Mississippi 3,161,150$ 4,741,725$ 101,157$ 79Iowa 3,115,873$ 4,673,809$ 84,752$ 78North Carolina 2,939,366$ 4,409,048$ 164,604$ 73Utah 2,781,744$ 4,172,616$ 111,270$ 70Minnesota 2,737,193$ 4,105,790$ 154,378$ 68Maine 2,066,757$ 3,100,135$ 115,738$ 52Oklahoma 2,046,176$ 3,069,264$ 85,939$ 51Tennessee 2,034,070$ 3,051,105$ -$ 51New Mexico 1,963,128$ 2,944,692$ 67,532$ 49South Carolina 1,911,314$ 2,866,971$ 107,034$ 48Kentucky 1,726,575$ 2,589,862$ 82,876$ 43Wisconsin 1,695,341$ 2,543,011$ 88,158$ 42New Hampshire 1,690,498$ 2,535,748$ -$ 42Oregon 1,579,364$ 2,369,046$ 37,905$ 39Arkansas 1,539,414$ 2,309,121$ 86,207$ 38West Virginia 902,874$ 1,354,312$ 43,338$ 23Rhode Island 818,616$ 1,227,924$ 34,996$ 20Nevada 753,001$ 1,129,501$ -$ 19Vermont 690,533$ 1,035,800$ 43,089$ 17Hawaii 624,676$ 937,014$ 35,981$ 16Idaho 559,787$ 839,680$ 33,139$ 14Nebraska 484,487$ 726,730$ 19,845$ 12Alaska 367,058$ 550,586$ -$ 9Delaware 334,371$ 501,557$ 14,846$ 8Montana 277,714$ 416,572$ 13,997$ 7North Dakota 272,146$ 408,218$ 6,140$ 7South Dakota 183,529$ 275,293$ -$ 5Wyoming 93,459$ 140,189$ -$ 2
Table 5: 2015 Total UAS Agriculture Derived DemandState Labor Parts Taxes Employment
California 1,682,702$ 2,524,053$ 53,846$ 42Washington 974,629$ 1,461,944$ -$ 24Texas 910,875$ 1,366,312$ -$ 23Florida 512,431$ 768,647$ -$ 13Arizona 442,949$ 664,424$ 10,206$ 11Connecticut 426,232$ 639,348$ 17,049$ 11Virginia 383,325$ 574,987$ 17,633$ 10Kansas 382,474$ 573,711$ 19,124$ 10New York 356,864$ 535,296$ 18,414$ 9Pennsylvania 323,960$ 485,940$ 7,956$ 8Massachusetts 313,075$ 469,612$ 13,274$ 8Georgia 305,541$ 458,312$ 14,666$ 8Ohio 292,176$ 438,264$ 9,583$ 7Maryland 273,737$ 410,605$ 10,402$ 7Alabama 239,597$ 359,396$ 9,584$ 6New Jersey 214,808$ 322,211$ 12,803$ 5Missouri 212,826$ 319,238$ 6,810$ 5Colorado 190,703$ 286,054$ 7,064$ 5Louisiana 177,908$ 266,862$ 5,693$ 4Indiana 171,941$ 257,912$ 4,677$ 4Illinois 168,974$ 253,461$ 6,759$ 4Michigan 155,837$ 233,755$ 5,423$ 4Mississippi 135,478$ 203,217$ 4,335$ 3Iowa 133,537$ 200,306$ 3,632$ 3North Carolina 125,973$ 188,959$ 7,054$ 3Utah 119,218$ 178,826$ 4,769$ 3Minnesota 117,308$ 175,962$ 6,616$ 3Maine 88,575$ 132,863$ 4,960$ 2Oklahoma 87,693$ 131,540$ 3,683$ 2Tennessee 87,174$ 130,762$ -$ 2New Mexico 84,134$ 126,201$ 2,894$ 2South Carolina 81,913$ 122,870$ 4,587$ 2Kentucky 73,996$ 110,994$ 3,552$ 2Wisconsin 72,657$ 108,986$ 3,778$ 2New Hampshire 72,450$ 108,675$ -$ 2Oregon 67,687$ 101,531$ 1,624$ 2Arkansas 65,975$ 98,962$ 3,695$ 2West Virginia 38,695$ 58,042$ 1,857$ 1Rhode Island 35,084$ 52,625$ 1,500$ 1Nevada 32,271$ 48,407$ -$ 1Vermont 29,594$ 44,391$ 1,847$ 1Hawaii 26,772$ 40,158$ 1,542$ 1Idaho 23,991$ 35,986$ 1,420$ 1Nebraska 20,764$ 31,146$ 850$ 1Alaska 15,731$ 23,597$ -$ 0Delaware 14,330$ 21,495$ 636$ 0Montana 11,902$ 17,853$ 600$ 0North Dakota 11,663$ 17,495$ 263$ 0South Dakota 7,866$ 11,798$ -$ 0Wyoming 4,005$ 6,008$ -$ 0
Table 6: 2015 Total UAS Public Safety Derived Demand
In this section, we outline the assumptions and methodology used in making our forecasts. We drew on experience in Japan for compa-rable sales. Japan and the U.S. are both countries that readily adapt new technologies. We conclude the following:1) If the FAA adopts new rules allowing for commercial use of UAS in the nation’s airspace, these products will be received rapidly into the marketplace;2) The doubling rate can take place over either a three-year or six-year period. With the known rates of change in newer technologies, it is likely to be a three-year scenario given the fact that the potential marketplace is well aware of the product(s) unlike the introduction in Japan; and3) The commercial agriculture market is by far the largest segment, dwarfing all others.
Agriculture is an important product group. It has the potential for bringing a more reliable, cost-effective and safe method to domestic farmers for a variety of uses. In the event that a new set of regula-tions is not enacted and UAS are not integrated in the U.S. National Airspace System (NAS), this study estimates the lost jobs, lost tax revenue, and total economic loss to the states and nation. In addi-tion, a delay in airspace integration will impact the U.S. in terms of a lag in technology development, manufacturing, job development and economic stimulus. With U.S. integration of UAS, more than 103,000 good paying jobs with benefits will be created. While this section shows the huge potential available to the nation, the exact calculations of these benefits are laid out in the next section, where we estimate the total economic impact of NAS integration.
Forecast Conclusion
1 0 A U V S I E c o n o m i c R e p o r t 2 0 1 3
Economic Impact Analysis
Economic impact is based on the theory that a dollar flowing into a local economy from the outside is a benefit to the regional economy. The financial return for residents is in the form of new jobs, more earnings and new tax revenues that follow because of the initial development of a new business organization, and through new spending, in the municipality due to the operation of such a business or industry. These earnings, for instance, are generated for residents who are not directly associated with the business but who are the beneficiaries of the positive externalities that the business or industry can provide to communities. External benefits, or positive externalities, are those returns that are generated by a business but that are not captured by the business or local region. When the employees of a company spend money at local businesses, such as restaurants, gas stations and retail stores, their spending will benefit the owners and employees of those estab-lishments, thereby creating a positive incremental impact. According to Davis (1990) an impact analysis is purposely de-signed to produce quantitative results of the effects that a certain segment of an industry has in the local economy. From an indus-try’s standpoint, these impact studies are based on the grounds of aggregate economic growth that may be derived from additional spending by the business. The range of the impact can be limited to the city, county, state or national levels. There are various methodologies that aid the economic valuation of specific organizations in their local economies. From the litera-ture review, we concluded that Economic Impact Analysis (EIA) mostly relies on input-output economic models. Economists evalu-ate the impact that one sector has on another in terms of indirect and induced effects. The total economic impact is then the sum of the direct, indirect and induced effects.
Direct Impacts Direct impacts are consequences of economic activities carried out by a company or organization in the economy. For example, institutions (public or private) have a direct impact on the local economy because of the activities conducted by the institution, management, employees, visitors and other related events. Em-ploying labor, purchasing locally produced goods and services, and contracting for construction and capital improvements are all ex-amples of activities that generate direct impacts. Some direct im-pacts, such as UAS, occur on site. Others, such as local production of goods and services for use at the institution, may occur off site. Expenditures by management, owners and visitors also gener-ate direct impacts, but only those expenditures that lead to local business activity are relevant for a regional economic assessment. For this reason, it is important to distinguish between (a) the lo-cal value-added component of expenditures and (b) the regional import component. Thus, the manufacturers of UAS expenditures on utilities, supplies, professional services, meals and entertainment
generate significant economic benefits to the local and national economy. In most parts of the country, only the former component is relevant for the analysis. The following is a list of local value-added components:
Construction, maintenance, operations
Value of user benefits
Logistics/inventory/ processing, scale economies
Tourism, business relocation effects
Effect on disposable income
The distinguishing feature of a direct impact is that it is an immedi-ate consequence of the manufacturers of UAS’ economic activity.
Indirect Impacts In addition to the direct effect of an economic activity, there are also indirect effects and induced effects. Indirect impacts derive from off-site economic activities that are attributable to the business activities of the manufacturers of UAS’ presence. For example, if we are looking at the job impacts of a new UAS being manufactured in Arizona, the direct effect is the number of new jobs created by the company itself. The indirect effect is the number of new jobs created at those firms that supply ancillary services for individu-als who are employed at the UAS manufacturing facility and for customers of the firm. These can include, but are not limited to, hotels, restaurants and other businesses that may expand because of the presence of the UAS manufacturing facility. These suppli-ers and clients employ labor, purchase locally produced goods and services, and invest in capital expansion and improvements. Indirect impacts differ from direct impacts in that they originate entirely off site. Examples of indirect impacts would be:
business opportunities created by the UAS manufacturing facility.
Induced Impacts Induced impacts are the result of spending of the wages and sala-ries of the direct and indirect employees on items such as food, housing, transportation and medical services. In other words, in-duced effects are the multiplier effects caused by successive rounds of spending throughout the economy as a result of the direct and indirect effects discussed above. For example, most of the take-home income earned by the manu-

A U V S I E c o n o m i c R e p o r t 2 0 1 3 1 1
facturers of UAS employees is spent locally. Some of this spending becomes income to local businesses and their employees that provide services to the firm’s employees. Then part of these second-round incomes are also spent locally and thus become income to another set of individuals. As successive rounds of spending occur, addi-tional income is created. Although some of the induced impacts occur locally, some are felt outside the region because of the region-al import components of the goods and services purchased. More economically self-sufficient regions have higher multipliers than do regions that are more dependent on regional imports, because more of the spending and respending is accomplished in the area. Simi-larly, two or more counties considered together as one economic region would have a higher multiplier than would each individual county.
Total Impact The total impact is the sum of direct impacts, indirect impacts and
induced impacts. Total impact is expressed in economic output, earnings or jobs.
Economists sometimes say that the direct economic impacts are “multiplied” through their indirect economic impacts. The ratio of the total (direct + indirect) economic impacts to the direct econom-ic impacts is frequently referred to as the economic multiplier. The employment multiplier is the ratio of total employment to direct employment. The income multiplier is the ratio of total income to direct income created.
Multipliers are not directly observed; rather, they are inferred from an economic model. The direct measure is generally the most accurate since it can be measured more easily, but it only represents a part of the impact, so other multipliers are added to get the total. However, it should be emphasized that the sum of the multipliers is very important since these are virtually the only tools available to researchers attempting to identify the overall impact of activity within a regional economy.
Although a variety of methods can be used to generate economic multipliers, input-output (I-O) models are the most popular tool
for such analysis and will be our focus. IMPLAN is a standard economic impact software package used to generate indirect, in-duced employment and sales estimates. IMPLAN utilizes user-supplied estimates of the direct sales and/or em-ployment and provides associated indirect and induced effects es-timates. Direct effects are the changes in the industries to which a final demand change was made; indirect effects are the changes in interindustry purchases as the response to demand of the directly affected industry; and induced effects generally reflect changes in household spending resulting from activity generated by the direct and indirect effects (MIG, p.102).
Previous Economic Impact StudiesConducting an economic impact study is important, because it
is a useful tool to evaluate the economic impact of a business in a community in terms of jobs, income and tax revenue. Ten studies were selected from the literature to illustrate the different facets of economic impact and approaches used to assess impact. The purpose is to illustrate the range of values that may be achieved by different economic entities. The 10 examples are listed below:
Florida; and
MethodologyThe aircraft industry, undoubtedly, provides significant economic
and social benefits for the regional, state and national economies. Most economic impact analyses utilize input-output models to pro-vide detailed descriptions on how money invested in an economy travels and, through multiplier effects, creates additional employ-ment and income. The basis of these input-output models is a sum-mation of expenditures of the manufacturer (operations, capital and payroll) and the application of the multipliers to account for the interdependency of economic activity in a local economy (Siegfried et al., 2007). There are two well-known input-output programs: Regional Input-Output Modeling System (RIMS II) and the more advanced Impact Analysis for Planning (IMPLAN) software.
To more effectively use the multipliers for impact analysis, users must provide geographically and industrially detailed information
Economic Impact ... continued
indirect impactsdirec
Multipt imp
lis
eract
�
Economic Impact Overview
Customers Spending in the areaBusiness Operations Lodging
Direct Spendings Meals Amin. Expenses Direct Indirect Recreation Other Direct Spendings Impacts Impacts Car rentals
Other
Re-spending of EarningsDirect Impacts Induced by Employees and
Capital Programs Impacts Business
Total Impacts
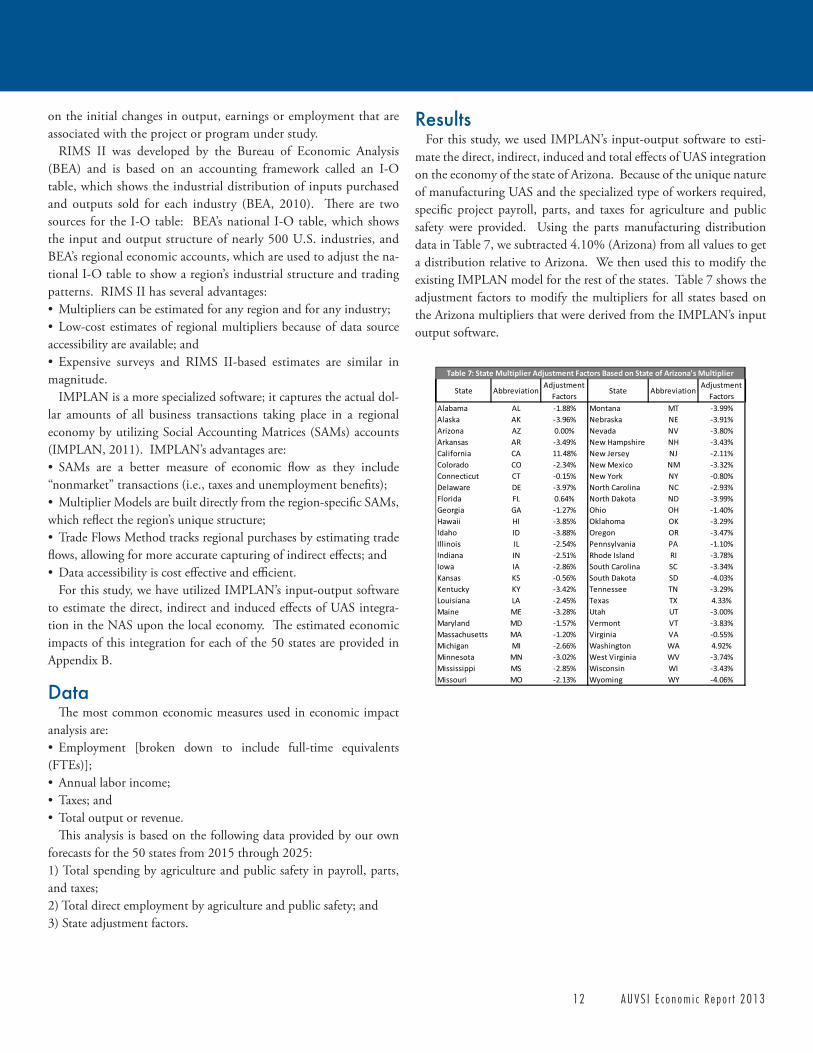
1 2 A U V S I E c o n o m i c R e p o r t 2 0 1 3
on the initial changes in output, earnings or employment that are associated with the project or program under study. RIMS II was developed by the Bureau of Economic Analysis (BEA) and is based on an accounting framework called an I-O table, which shows the industrial distribution of inputs purchased and outputs sold for each industry (BEA, 2010). There are two sources for the I-O table: BEA’s national I-O table, which shows the input and output structure of nearly 500 U.S. industries, and BEA’s regional economic accounts, which are used to adjust the na-tional I-O table to show a region’s industrial structure and trading patterns. RIMS II has several advantages:
accessibility are available; and
magnitude. IMPLAN is a more specialized software; it captures the actual dol-lar amounts of all business transactions taking place in a regional economy by utilizing Social Accounting Matrices (SAMs) accounts (IMPLAN, 2011). IMPLAN’s advantages are:
“nonmarket” transactions (i.e., taxes and unemployment benefits);
which reflect the region’s unique structure;
flows, allowing for more accurate capturing of indirect effects; and
For this study, we have utilized IMPLAN’s input-output software to estimate the direct, indirect and induced effects of UAS integra-tion in the NAS upon the local economy. The estimated economic impacts of this integration for each of the 50 states are provided in Appendix B.
Data The most common economic measures used in economic impact analysis are:
(FTEs)];
This analysis is based on the following data provided by our own forecasts for the 50 states from 2015 through 2025:1) Total spending by agriculture and public safety in payroll, parts, and taxes; 2) Total direct employment by agriculture and public safety; and 3) State adjustment factors.
Results For this study, we used IMPLAN’s input-output software to esti-mate the direct, indirect, induced and total effects of UAS integration on the economy of the state of Arizona. Because of the unique nature of manufacturing UAS and the specialized type of workers required, specific project payroll, parts, and taxes for agriculture and public safety were provided. Using the parts manufacturing distribution data in Table 7, we subtracted 4.10% (Arizona) from all values to get a distribution relative to Arizona. We then used this to modify the existing IMPLAN model for the rest of the states. Table 7 shows the adjustment factors to modify the multipliers for all states based on the Arizona multipliers that were derived from the IMPLAN’s input output software.
Alabama AL -1.88% Montana MT -3.99%Alaska AK -3.96% Nebraska NE -3.91%Arizona AZ 0.00% Nevada NV -3.80%Arkansas AR -3.49% New Hampshire NH -3.43%California CA 11.48% New Jersey NJ -2.11%Colorado CO -2.34% New Mexico NM -3.32%Connecticut CT -0.15% New York NY -0.80%Delaware DE -3.97% North Carolina NC -2.93%Florida FL 0.64% North Dakota ND -3.99%Georgia GA -1.27% Ohio OH -1.40%Hawaii HI -3.85% Oklahoma OK -3.29%Idaho ID -3.88% Oregon OR -3.47%Illinois IL -2.54% Pennsylvania PA -1.10%Indiana IN -2.51% Rhode Island RI -3.78%Iowa IA -2.86% South Carolina SC -3.34%Kansas KS -0.56% South Dakota SD -4.03%Kentucky KY -3.42% Tennessee TN -3.29%Louisiana LA -2.45% Texas TX 4.33%Maine ME -3.28% Utah UT -3.00%Maryland MD -1.57% Vermont VT -3.83%Massachusetts MA -1.20% Virginia VA -0.55%Michigan MI -2.66% Washington WA 4.92%Minnesota MN -3.02% West Virginia WV -3.74%Mississippi MS -2.85% Wisconsin WI -3.43%Missouri MO -2.13% Wyoming WY -4.06%
Table 7: State Multiplier Adjustment Factors Based on State of Arizona's Multiplier
StateState AbbreviationAdjustment
FactorsAdjustment
FactorsAbbreviation

A U V S I E c o n o m i c R e p o r t 2 0 1 3 1 3
Economic Impact ... Total Impacts
Total Economic and Employment Impacts of Agriculture Spending Table 8 presents the estimated total economic and employment impacts of agriculture spending in all 50 states in 2015. The total economic impact in all 50 states is $2,096.5 million with total job creation of 21,565. The state with the largest economic and employ-ment impacts is California with a total economic impact of about $366.9 million and creation of 3,774 new jobs. Following California are Washington, Texas, Florida and Arizona. The state with the least economic and employment impacts is Wyoming with an estimated $723,647 and creation of seven new jobs. The average economic and employment impacts of agriculture spending per state are $41,929,742 and creation of 431 new jobs. The standard deviation of economic and employment impacts of ag-riculture spending are $61,565,404 and 633 new jobs. The large standard deviation indicates the wide variability (spread) of economic and employment impacts among states.
Total Economic and Employment Impacts of Public Safety and Other Spending Table 9 presents the estimated total economic and employment im-pacts in 2015 of public safety spending in all 50 states. Since the total spending for “other markets” is considered equivalent to the public safety estimates, these data are not repeated. The total economic im-pact of the public safety market in all 50 states is approximately $89.8 million with creation of 924 new jobs. As with agriculture spend-ing, the state with the largest economic and employment impacts is California with a total of more than $15.7 million and creation of 162 new jobs. This is followed in descending order by the states of Washington, Texas, Florida and Arizona. The state of Wyoming has the least economic and employment impacts with $31,013 and no new jobs created. The average economic and employment impacts of public safety spending per state are $1,796,989 and creation of 18 new jobs. The standard deviation of economic and employment impacts of public safety spending is $2,638,517 and creation of 27 new jobs. The large standard deviation again indicates the wide variability among states.
Payroll Parts Taxes TotalAlabama $399,329 $598,993 $15,973 $1,014,296 1.9043 $1,931,523 20 Alaska $26,218 $39,328 $0 $65,546 1.8623 $122,066 1 Arizona $738,248 $1,107,373 $17,009 $1,862,630 1.9800 $3,688,008 38 Arkansas $109,958 $164,937 $6,158 $281,053 1.8718 $526,075 5 California $2,804,503 $4,206,755 $89,744 $7,101,003 2.2143 $15,723,751 162 Colorado $317,838 $476,756 $11,773 $806,366 1.8893 $1,523,468 16 Connecticut $710,387 $1,065,581 $28,415 $1,804,383 1.9598 $3,536,230 36 Delaw are $23,884 $35,825 $1,060 $60,770 1.8594 $112,995 1 Florida $854,052 $1,281,078 $0 $2,135,130 1.9477 $4,158,593 43 Georgia $509,235 $763,853 $24,443 $1,297,531 1.9216 $2,493,336 26 Haw aii $44,620 $66,930 $2,570 $114,119 1.8604 $212,308 2 Idaho $39,985 $59,977 $2,367 $102,329 1.8602 $190,353 2 Illinois $281,623 $422,434 $11,265 $715,322 1.8750 $1,341,229 14 Indiana $286,569 $429,854 $7,795 $724,217 1.8850 $1,365,150 14 Iow a $222,562 $333,844 $6,054 $562,460 1.8589 $1,045,556 11 Kansas $637,456 $956,184 $31,873 $1,625,514 1.9792 $3,217,217 33 Kentucky $123,327 $184,990 $5,920 $314,237 1.8681 $587,025 6 Louisiana $296,513 $444,770 $9,488 $750,772 1.8684 $1,402,742 14 Maine $147,625 $221,438 $8,267 $377,331 1.8584 $701,231 7 Maryland $456,228 $684,342 $17,337 $1,157,906 1.9061 $2,207,085 23 Massachusetts $521,791 $782,687 $22,124 $1,326,601 1.9142 $2,539,381 26 Michigan $259,728 $389,592 $9,039 $658,359 1.8748 $1,234,291 13 Minnesota $195,514 $293,271 $11,027 $499,812 1.8677 $933,498 10 Mississippi $225,796 $338,695 $7,225 $571,717 1.8621 $1,064,593 11 Missouri $354,709 $532,064 $11,351 $898,124 1.9064 $1,712,183 18 Montana $19,837 $29,755 $1,000 $50,592 1.8589 $94,045 1 Nebraska $34,606 $51,909 $1,417 $87,933 1.8600 $163,555 2 Nevada $53,786 $80,679 $0 $134,464 1.8666 $250,991 3 New Hampshire $120,750 $181,125 $0 $301,875 1.8612 $561,849 6 New Jersey $358,013 $537,019 $21,338 $916,369 1.8883 $1,730,379 18 New Mexico $140,223 $210,335 $4,824 $355,382 1.8642 $662,504 7 New York $594,774 $892,160 $30,690 $1,517,624 1.9184 $2,911,411 30 North Carolina $209,955 $314,932 $11,757 $536,644 1.8711 $1,004,115 10 North Dakota $19,439 $29,158 $439 $49,036 1.8585 $91,133 1 Ohio $486,960 $730,440 $15,972 $1,233,372 1.9129 $2,359,318 24 Oklahoma $146,155 $219,233 $6,139 $371,527 1.8753 $696,725 7 Oregon $112,812 $169,218 $2,707 $284,737 1.8685 $532,031 5 Pennsylvania $539,933 $809,899 $13,261 $1,363,093 1.8964 $2,584,970 27 Rhode Island $58,473 $87,709 $2,500 $148,681 1.8638 $277,112 3 South Carolina $136,522 $204,784 $7,645 $348,951 1.8585 $648,526 7 South Dakota $13,109 $19,664 $0 $32,773 1.8673 $61,197 1 Tennessee $145,291 $217,936 $0 $363,227 2.0342 $738,876 8 Texas $1,518,125 $2,277,187 $0 $3,795,311 1.8834 $7,148,090 74 Utah $198,696 $298,044 $7,948 $504,688 1.8619 $939,678 10 Vermont $49,324 $73,986 $3,078 $126,387 1.8578 $234,802 2 Virginia $638,874 $958,312 $29,388 $1,626,574 1.8720 $3,044,947 31 Washington $1,624,382 $2,436,573 $0 $4,060,954 2.1250 $8,629,528 89 West Virginia $64,491 $96,737 $3,096 $164,323 1.8662 $306,660 3 Wisconsin $121,096 $181,644 $6,297 $309,036 1.8642 $576,106 6 Wyoming $6,676 $10,013 $0 $16,689 1.8583 $31,013 0 T O T A L $18,000,000 $27,000,000 $527,772 $45,527,772 $89,849,448 924
A vera g e $1,796,989 18
S TD $2,638,517 27
MA X $15,723,751 162
MIN $31,013 0
Table 9: 2015 Total Economic & Employment Impacts of Public Safety Spending
Direct SpendingState State Total
Multipliers
Total Economic
Impact
Total Employment
ImpactPayroll Parts Taxes TotalAlabama $9,317,676 $13,976,514 $372,707 $23,666,897 1.9043 $45,068,872 464 Alaska $611,763 $917,644 $0 $1,529,406 1.8623 $2,848,213 29 Arizona $17,225,796 $25,838,695 $396,882 $43,461,373 1.9800 $86,053,519 885 Arkansas $2,565,690 $3,848,535 $143,679 $6,557,904 1.8718 $12,275,085 126 California $65,438,414 $98,157,622 $2,094,029 $165,690,065 2.2143 $366,887,512 3,774 Colorado $7,416,208 $11,124,313 $274,696 $18,815,217 1.8893 $35,547,590 366 Connecticut $16,575,698 $24,863,547 $663,028 $42,102,272 1.9598 $82,512,034 849 Delaw are $557,285 $835,928 $24,743 $1,417,956 1.8594 $2,636,547 27 Florida $19,927,882 $29,891,823 $0 $49,819,705 1.9477 $97,033,840 998 Georgia $11,882,156 $17,823,233 $570,343 $30,275,732 1.9216 $58,177,847 598 Haw aii $1,041,126 $1,561,689 $59,969 $2,662,784 1.8604 $4,953,844 51 Idaho $932,978 $1,399,467 $55,232 $2,387,678 1.8602 $4,441,558 46 Illinois $6,571,201 $9,856,802 $262,848 $16,690,851 1.8750 $31,295,346 322 Indiana $6,686,613 $10,029,919 $181,876 $16,898,408 1.8850 $31,853,499 328 Iow a $5,193,121 $7,789,682 $141,253 $13,124,056 1.8589 $24,396,309 251 Kansas $14,873,981 $22,310,972 $743,699 $37,928,652 1.9792 $75,068,387 772 Kentucky $2,877,624 $4,316,437 $138,126 $7,332,187 1.8681 $13,697,259 141 Louisiana $6,918,647 $10,377,970 $221,397 $17,518,014 1.8684 $32,730,657 337 Maine $3,444,594 $5,166,891 $192,897 $8,804,383 1.8584 $16,362,066 168 Maryland $10,645,314 $15,967,971 $404,522 $27,017,806 1.9061 $51,498,641 530 Massachusetts $12,175,124 $18,262,685 $516,225 $30,954,034 1.9142 $59,252,213 609 Michigan $6,060,323 $9,090,485 $210,899 $15,361,707 1.8748 $28,800,128 296 Minnesota $4,561,989 $6,842,984 $257,296 $11,662,269 1.8677 $21,781,620 224 Mississippi $5,268,583 $7,902,874 $168,595 $13,340,052 1.8621 $24,840,511 256 Missouri $8,276,550 $12,414,825 $264,850 $20,956,224 1.9064 $39,950,946 411 Montana $462,857 $694,286 $23,328 $1,180,471 1.8589 $2,194,378 23 Nebraska $807,478 $1,211,217 $33,074 $2,051,770 1.8600 $3,816,291 39 Nevada $1,255,001 $1,882,501 $0 $3,137,502 1.8666 $5,856,462 60 New Ha mpshire $2,817,497 $4,226,246 $0 $7,043,743 1.8612 $13,109,815 135 New J ersey $8,353,625 $12,530,438 $497,876 $21,381,940 1.8883 $40,375,517 415 New Mexic o $3,271,880 $4,907,821 $112,553 $8,292,254 1.8642 $15,458,419 159 New Y ork $13,878,051 $20,817,077 $716,107 $35,411,235 1.9184 $67,932,913 699 North C a rolina $4,898,943 $7,348,414 $274,341 $12,521,698 1.8711 $23,429,348 241 North Da kota $453,576 $680,364 $10,233 $1,144,172 1.8585 $2,126,445 22 O hio $11,362,400 $17,043,599 $372,687 $28,778,686 1.9129 $55,050,748 566 O kla homa $3,410,294 $5,115,440 $143,232 $8,668,966 1.8753 $16,256,913 167 O reg on $2,632,274 $3,948,411 $63,175 $6,643,859 1.8685 $12,414,050 128 P ennsylva nia $12,598,434 $18,897,651 $309,418 $31,805,503 1.8964 $60,315,956 620 R hode Is la nd $1,364,360 $2,046,539 $58,326 $3,469,225 1.8638 $6,465,942 67 S outh C a rolina $3,185,523 $4,778,285 $178,389 $8,142,198 1.8585 $15,132,275 156 S outh Da kota $305,881 $458,822 $0 $764,703 1.8673 $1,427,930 15 Tennessee $3,390,117 $5,085,175 $0 $8,475,292 2.0342 $17,240,439 177 Texa s $35,422,907 $53,134,361 $0 $88,557,268 1.8834 $166,788,758 1,716 Uta h $4,636,240 $6,954,360 $185,450 $11,776,049 1.8619 $21,925,827 226 V ermont $1,150,888 $1,726,333 $71,815 $2,949,036 1.8578 $5,478,720 56 V irg inia $14,907,071 $22,360,607 $685,725 $37,953,403 1.8720 $71,048,771 731 Wa shing ton $37,902,240 $56,853,360 $0 $94,755,601 2.1250 $201,355,651 2,071 West V irg inia $1,504,791 $2,257,186 $72,230 $3,834,206 1.8662 $7,155,396 74 Wisc ons in $2,825,568 $4,238,352 $146,930 $7,210,850 1.8642 $13,442,466 138 Wyoming $155,765 $233,648 $0 $389,413 1.8583 $723,647 7 T O T A L $420,000,000 $630,000,000 $12,314,681 $1,062,314,681 $2,096,487,120 21,565
A vera g e $41,929,742 431
S TD $61,565,404 633
Table 8: 2015 Total Economic & Employment Impacts of Agriculture Spending
Direct Spending Total Employment
Impact
Total Economic Impact
State Total Multipliers
State
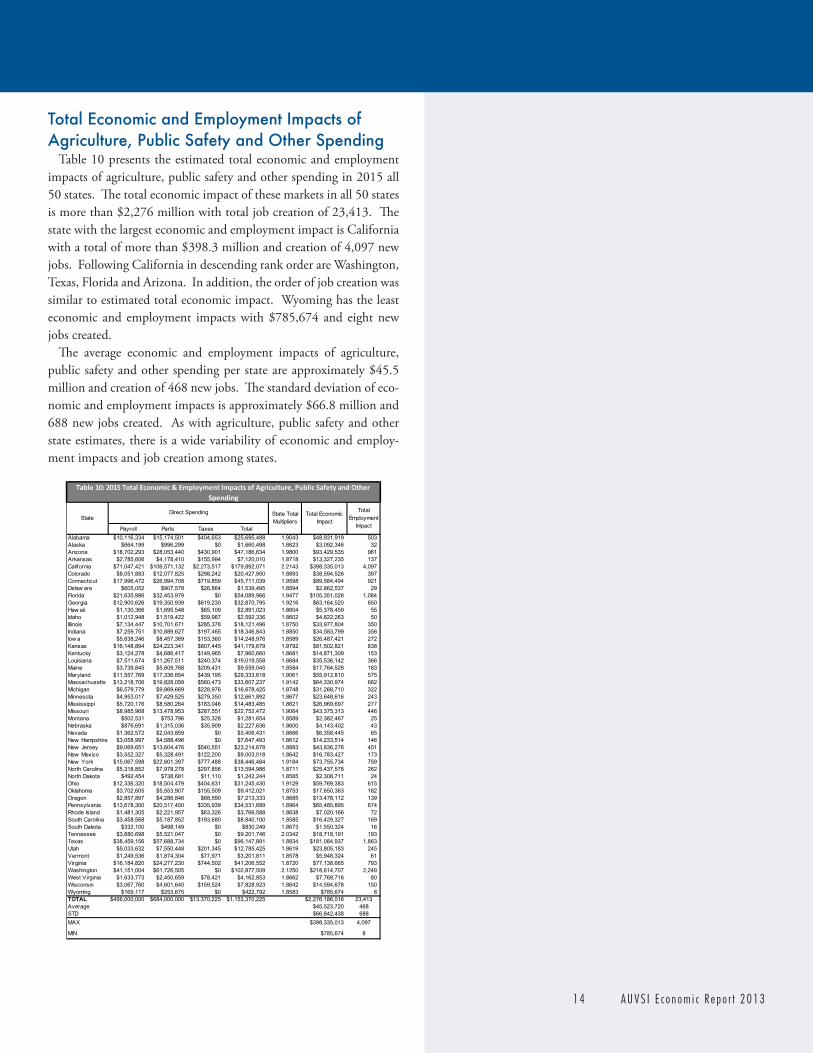
1 4 A U V S I E c o n o m i c R e p o r t 2 0 1 3
Total Economic and Employment Impacts of Agriculture, Public Safety and Other Spending Table 10 presents the estimated total economic and employment impacts of agriculture, public safety and other spending in 2015 all 50 states. The total economic impact of these markets in all 50 states is more than $2,276 million with total job creation of 23,413. The state with the largest economic and employment impact is California with a total of more than $398.3 million and creation of 4,097 new jobs. Following California in descending rank order are Washington, Texas, Florida and Arizona. In addition, the order of job creation was similar to estimated total economic impact. Wyoming has the least economic and employment impacts with $785,674 and eight new jobs created. The average economic and employment impacts of agriculture, public safety and other spending per state are approximately $45.5 million and creation of 468 new jobs. The standard deviation of eco-nomic and employment impacts is approximately $66.8 million and 688 new jobs created. As with agriculture, public safety and other state estimates, there is a wide variability of economic and employ-ment impacts and job creation among states.
Payroll Parts Taxes TotalAlabama $10,116,334 $15,174,501 $404,653 $25,695,488 1.9043 $48,931,919 503 Alaska $664,199 $996,299 $0 $1,660,498 1.8623 $3,092,346 32 Arizona $18,702,293 $28,053,440 $430,901 $47,186,634 1.9800 $93,429,535 961 Arkansas $2,785,606 $4,178,410 $155,994 $7,120,010 1.8718 $13,327,235 137 California $71,047,421 $106,571,132 $2,273,517 $179,892,071 2.2143 $398,335,013 4,097 Colorado $8,051,883 $12,077,825 $298,242 $20,427,950 1.8893 $38,594,526 397 Connecticut $17,996,472 $26,994,708 $719,859 $45,711,039 1.9598 $89,584,494 921 Delaw are $605,052 $907,578 $26,864 $1,539,495 1.8594 $2,862,537 29 Florida $21,635,986 $32,453,979 $0 $54,089,966 1.9477 $105,351,026 1,084 Georgia $12,900,626 $19,350,939 $619,230 $32,870,795 1.9216 $63,164,520 650 Haw aii $1,130,366 $1,695,548 $65,109 $2,891,023 1.8604 $5,378,459 55 Idaho $1,012,948 $1,519,422 $59,967 $2,592,336 1.8602 $4,822,263 50 Illinois $7,134,447 $10,701,671 $285,378 $18,121,496 1.8750 $33,977,804 350 Indiana $7,259,751 $10,889,627 $197,465 $18,346,843 1.8850 $34,583,799 356 Iow a $5,638,246 $8,457,369 $153,360 $14,248,976 1.8589 $26,487,421 272 Kansas $16,148,894 $24,223,341 $807,445 $41,179,679 1.9792 $81,502,821 838 Kentucky $3,124,278 $4,686,417 $149,965 $7,960,660 1.8681 $14,871,309 153 Louisiana $7,511,674 $11,267,511 $240,374 $19,019,558 1.8684 $35,536,142 366 Maine $3,739,845 $5,609,768 $209,431 $9,559,045 1.8584 $17,764,528 183 Maryland $11,557,769 $17,336,654 $439,195 $29,333,618 1.9061 $55,912,810 575 Massachusetts $13,218,706 $19,828,059 $560,473 $33,607,237 1.9142 $64,330,974 662 Michigan $6,579,779 $9,869,669 $228,976 $16,678,425 1.8748 $31,268,710 322 Minnesota $4,953,017 $7,429,525 $279,350 $12,661,892 1.8677 $23,648,616 243 Mississippi $5,720,176 $8,580,264 $183,046 $14,483,485 1.8621 $26,969,697 277 Missouri $8,985,968 $13,478,953 $287,551 $22,752,472 1.9064 $43,375,313 446 Montana $502,531 $753,796 $25,328 $1,281,654 1.8589 $2,382,467 25 Nebraska $876,691 $1,315,036 $35,909 $2,227,636 1.8600 $4,143,402 43 Nevada $1,362,572 $2,043,859 $0 $3,406,431 1.8666 $6,358,445 65 New Hampshire $3,058,997 $4,588,496 $0 $7,647,493 1.8612 $14,233,514 146 New Jersey $9,069,651 $13,604,476 $540,551 $23,214,678 1.8883 $43,836,276 451 New Mexico $3,552,327 $5,328,491 $122,200 $9,003,018 1.8642 $16,783,427 173 New York $15,067,598 $22,601,397 $777,488 $38,446,484 1.9184 $73,755,734 759 North Carolina $5,318,852 $7,978,278 $297,856 $13,594,986 1.8711 $25,437,578 262 North Dakota $492,454 $738,681 $11,110 $1,242,244 1.8585 $2,308,711 24 Ohio $12,336,320 $18,504,479 $404,631 $31,245,430 1.9129 $59,769,383 615 Oklahoma $3,702,605 $5,553,907 $155,509 $9,412,021 1.8753 $17,650,363 182 Oregon $2,857,897 $4,286,846 $68,590 $7,213,333 1.8685 $13,478,112 139 Pennsylvania $13,678,300 $20,517,450 $335,939 $34,531,689 1.8964 $65,485,895 674 Rhode Island $1,481,305 $2,221,957 $63,326 $3,766,588 1.8638 $7,020,166 72 South Carolina $3,458,568 $5,187,852 $193,680 $8,840,100 1.8585 $16,429,327 169 South Dakota $332,100 $498,149 $0 $830,249 1.8673 $1,550,324 16 Tennessee $3,680,698 $5,521,047 $0 $9,201,746 2.0342 $18,718,191 193 Texas $38,459,156 $57,688,734 $0 $96,147,891 1.8834 $181,084,937 1,863 Utah $5,033,632 $7,550,448 $201,345 $12,785,425 1.8619 $23,805,183 245 Vermont $1,249,536 $1,874,304 $77,971 $3,201,811 1.8578 $5,948,324 61 Virginia $16,184,820 $24,277,230 $744,502 $41,206,552 1.8720 $77,138,665 793 Washington $41,151,004 $61,726,505 $0 $102,877,509 2.1250 $218,614,707 2,249 West Virginia $1,633,773 $2,450,659 $78,421 $4,162,853 1.8662 $7,768,716 80 Wisconsin $3,067,760 $4,601,640 $159,524 $7,828,923 1.8642 $14,594,678 150 Wyoming $169,117 $253,675 $0 $422,792 1.8583 $785,674 8 TOTAL $456,000,000 $684,000,000 $13,370,225 $1,153,370,225 $2,276,186,016 23,413Average $45,523,720 468STD $66,842,438 688MAX $398,335,013 4,097
MIN $785,674 8
Table 10: 2015 Total Economic & Employment Impacts of Agriculture, Public Safety and Other Spending
Direct SpendingState
State Total Multipliers
Total Economic Impact
Total Employment
Impact
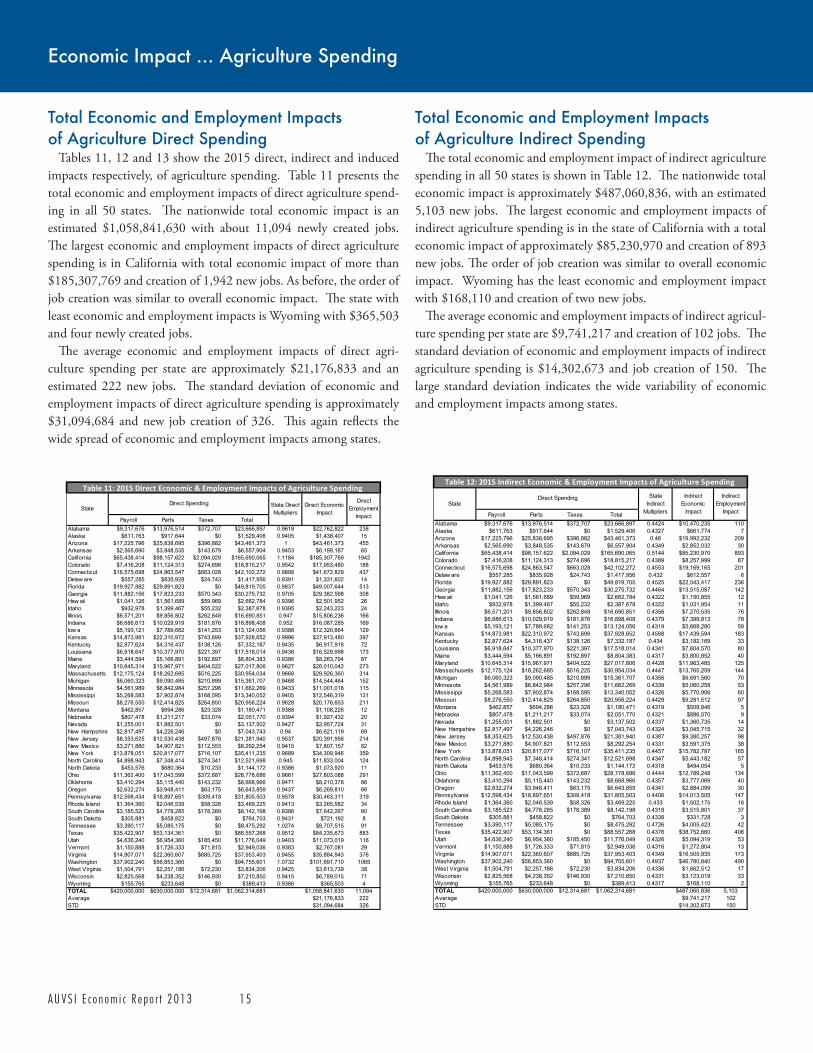
A U V S I E c o n o m i c R e p o r t 2 0 1 3 1 5
Economic Impact ... Agriculture Spending
Total Economic and Employment Impacts of Agriculture Direct Spending Tables 11, 12 and 13 show the 2015 direct, indirect and induced impacts respectively, of agriculture spending. Table 11 presents the total economic and employment impacts of direct agriculture spend-ing in all 50 states. The nationwide total economic impact is an estimated $1,058,841,630 with about 11,094 newly created jobs. The largest economic and employment impacts of direct agriculture spending is in California with total economic impact of more than $185,307,769 and creation of 1,942 new jobs. As before, the order of job creation was similar to overall economic impact. The state with least economic and employment impacts is Wyoming with $365,503 and four newly created jobs. The average economic and employment impacts of direct agri-culture spending per state are approximately $21,176,833 and an estimated 222 new jobs. The standard deviation of economic and employment impacts of direct agriculture spending is approximately $31,094,684 and new job creation of 326. This again reflects the wide spread of economic and employment impacts among states.
Total Economic and Employment Impacts of Agriculture Indirect Spending The total economic and employment impact of indirect agriculture spending in all 50 states is shown in Table 12. The nationwide total economic impact is approximately $487,060,836, with an estimated 5,103 new jobs. The largest economic and employment impacts of indirect agriculture spending is in the state of California with a total economic impact of approximately $85,230,970 and creation of 893 new jobs. The order of job creation was similar to overall economic impact. Wyoming has the least economic and employment impact with $168,110 and creation of two new jobs. The average economic and employment impacts of indirect agricul-ture spending per state are $9,741,217 and creation of 102 jobs. The standard deviation of economic and employment impacts of indirect agriculture spending is $14,302,673 and job creation of 150. The large standard deviation indicates the wide variability of economic and employment impacts among states.
Payroll Parts Taxes TotalAlabama $9,317,676 $13,976,514 $372,707 $23,666,897 0.9618 $22,762,822 238Alaska $611,763 $917,644 $0 $1,529,406 0.9405 $1,438,407 15Arizona $17,225,796 $25,838,695 $396,882 $43,461,373 1 $43,461,373 455Arkansas $2,565,690 $3,848,535 $143,679 $6,557,904 0.9453 $6,199,187 65California $65,438,414 $98,157,622 $2,094,029 $165,690,065 1.1184 $185,307,769 1942Colorado $7,416,208 $11,124,313 $274,696 $18,815,217 0.9542 $17,953,480 188Connecticut $16,575,698 $24,863,547 $663,028 $42,102,272 0.9898 $41,672,829 437Delaw are $557,285 $835,928 $24,743 $1,417,956 0.9391 $1,331,602 14Florida $19,927,882 $29,891,823 $0 $49,819,705 0.9837 $49,007,644 513Georgia $11,882,156 $17,823,233 $570,343 $30,275,732 0.9705 $29,382,598 308Haw aii $1,041,126 $1,561,689 $59,969 $2,662,784 0.9396 $2,501,952 26Idaho $932,978 $1,399,467 $55,232 $2,387,678 0.9395 $2,243,223 24Illinois $6,571,201 $9,856,802 $262,848 $16,690,851 0.947 $15,806,236 166Indiana $6,686,613 $10,029,919 $181,876 $16,898,408 0.952 $16,087,285 169Iow a $5,193,121 $7,789,682 $141,253 $13,124,056 0.9388 $12,320,864 129Kansas $14,873,981 $22,310,972 $743,699 $37,928,652 0.9996 $37,913,480 397Kentucky $2,877,624 $4,316,437 $138,126 $7,332,187 0.9435 $6,917,918 72Louisiana $6,918,647 $10,377,970 $221,397 $17,518,014 0.9436 $16,529,998 173Maine $3,444,594 $5,166,891 $192,897 $8,804,383 0.9386 $8,263,794 87Maryland $10,645,314 $15,967,971 $404,522 $27,017,806 0.9627 $26,010,042 273Massachusetts $12,175,124 $18,262,685 $516,225 $30,954,034 0.9668 $29,926,360 314Michigan $6,060,323 $9,090,485 $210,899 $15,361,707 0.9468 $14,544,464 152Minnesota $4,561,989 $6,842,984 $257,296 $11,662,269 0.9433 $11,001,018 115Mississippi $5,268,583 $7,902,874 $168,595 $13,340,052 0.9405 $12,546,319 131Missouri $8,276,550 $12,414,825 $264,850 $20,956,224 0.9628 $20,176,653 211Montana $462,857 $694,286 $23,328 $1,180,471 0.9388 $1,108,226 12Nebraska $807,478 $1,211,217 $33,074 $2,051,770 0.9394 $1,927,432 20Nevada $1,255,001 $1,882,501 $0 $3,137,502 0.9427 $2,957,724 31New Hampshire $2,817,497 $4,226,246 $0 $7,043,743 0.94 $6,621,119 69New Jersey $8,353,625 $12,530,438 $497,876 $21,381,940 0.9537 $20,391,956 214New Mexico $3,271,880 $4,907,821 $112,553 $8,292,254 0.9415 $7,807,157 82New York $13,878,051 $20,817,077 $716,107 $35,411,235 0.9689 $34,309,946 359North Carolina $4,898,943 $7,348,414 $274,341 $12,521,698 0.945 $11,833,004 124North Dakota $453,576 $680,364 $10,233 $1,144,172 0.9386 $1,073,920 11Ohio $11,362,400 $17,043,599 $372,687 $28,778,686 0.9661 $27,803,088 291Oklahoma $3,410,294 $5,115,440 $143,232 $8,668,966 0.9471 $8,210,378 86Oregon $2,632,274 $3,948,411 $63,175 $6,643,859 0.9437 $6,269,810 66Pennsylvania $12,598,434 $18,897,651 $309,418 $31,805,503 0.9578 $30,463,311 319Rhode Island $1,364,360 $2,046,539 $58,326 $3,469,225 0.9413 $3,265,582 34South Carolina $3,185,523 $4,778,285 $178,389 $8,142,198 0.9386 $7,642,267 80South Dakota $305,881 $458,822 $0 $764,703 0.9431 $721,192 8Tennessee $3,390,117 $5,085,175 $0 $8,475,292 1.0274 $8,707,515 91Texas $35,422,907 $53,134,361 $0 $88,557,268 0.9512 $84,235,673 883Utah $4,636,240 $6,954,360 $185,450 $11,776,049 0.9403 $11,073,019 116Vermont $1,150,888 $1,726,333 $71,815 $2,949,036 0.9383 $2,767,081 29Virginia $14,907,071 $22,360,607 $685,725 $37,953,403 0.9455 $35,884,943 376Washington $37,902,240 $56,853,360 $0 $94,755,601 1.0732 $101,691,710 1065West Virginia $1,504,791 $2,257,186 $72,230 $3,834,206 0.9425 $3,613,739 38Wisconsin $2,825,568 $4,238,352 $146,930 $7,210,850 0.9415 $6,789,015 71Wyoming $155,765 $233,648 $0 $389,413 0.9386 $365,503 4TOTAL $420,000,000 $630,000,000 $12,314,681 $1,062,314,681 $1,058,841,630 11,094Average $21,176,833 222STD $31,094,684 326
Table 11: 2015 Direct Economic & Employment Impacts of Agriculture Spending
StateDirect Spending State Direct
MultipliersDirect Economic
Impact
Direct Employment
Impact Payroll Parts Taxes TotalAlabama $9,317,676 $13,976,514 $372,707 $23,666,897 0.4424 $10,470,235 110 Alaska $611,763 $917,644 $0 $1,529,406 0.4327 $661,774 7 Arizona $17,225,796 $25,838,695 $396,882 $43,461,373 0.46 $19,992,232 209 Arkansas $2,565,690 $3,848,535 $143,679 $6,557,904 0.4349 $2,852,032 30 California $65,438,414 $98,157,622 $2,094,029 $165,690,065 0.5144 $85,230,970 893 Colorado $7,416,208 $11,124,313 $274,696 $18,815,217 0.4389 $8,257,999 87 Connecticut $16,575,698 $24,863,547 $663,028 $42,102,272 0.4553 $19,169,165 201 Delaw are $557,285 $835,928 $24,743 $1,417,956 0.432 $612,557 6 Florida $19,927,882 $29,891,823 $0 $49,819,705 0.4525 $22,543,417 236 Georgia $11,882,156 $17,823,233 $570,343 $30,275,732 0.4464 $13,515,087 142 Haw aii $1,041,126 $1,561,689 $59,969 $2,662,784 0.4322 $1,150,855 12 Idaho $932,978 $1,399,467 $55,232 $2,387,678 0.4322 $1,031,954 11 Illinois $6,571,201 $9,856,802 $262,848 $16,690,851 0.4356 $7,270,535 76 Indiana $6,686,613 $10,029,919 $181,876 $16,898,408 0.4379 $7,399,813 78 Iow a $5,193,121 $7,789,682 $141,253 $13,124,056 0.4319 $5,668,280 59 Kansas $14,873,981 $22,310,972 $743,699 $37,928,652 0.4598 $17,439,594 183 Kentucky $2,877,624 $4,316,437 $138,126 $7,332,187 0.434 $3,182,169 33 Louisiana $6,918,647 $10,377,970 $221,397 $17,518,014 0.4341 $7,604,570 80 Maine $3,444,594 $5,166,891 $192,897 $8,804,383 0.4317 $3,800,852 40 Maryland $10,645,314 $15,967,971 $404,522 $27,017,806 0.4428 $11,963,485 125 Massachusetts $12,175,124 $18,262,685 $516,225 $30,954,034 0.4447 $13,765,259 144 Michigan $6,060,323 $9,090,485 $210,899 $15,361,707 0.4356 $6,691,560 70 Minnesota $4,561,989 $6,842,984 $257,296 $11,662,269 0.4339 $5,060,258 53 Mississippi $5,268,583 $7,902,874 $168,595 $13,340,052 0.4326 $5,770,906 60 Missouri $8,276,550 $12,414,825 $264,850 $20,956,224 0.4429 $9,281,512 97 Montana $462,857 $694,286 $23,328 $1,180,471 0.4319 $509,846 5 Nebraska $807,478 $1,211,217 $33,074 $2,051,770 0.4321 $886,570 9 Nevada $1,255,001 $1,882,501 $0 $3,137,502 0.4337 $1,360,735 14 New Hampshire $2,817,497 $4,226,246 $0 $7,043,743 0.4324 $3,045,715 32 New Jersey $8,353,625 $12,530,438 $497,876 $21,381,940 0.4387 $9,380,257 98 New Mexico $3,271,880 $4,907,821 $112,553 $8,292,254 0.4331 $3,591,375 38 New York $13,878,051 $20,817,077 $716,107 $35,411,235 0.4457 $15,782,787 165 North Carolina $4,898,943 $7,348,414 $274,341 $12,521,698 0.4347 $5,443,182 57 North Dakota $453,576 $680,364 $10,233 $1,144,172 0.4318 $494,054 5 Ohio $11,362,400 $17,043,599 $372,687 $28,778,686 0.4444 $12,789,248 134 Oklahoma $3,410,294 $5,115,440 $143,232 $8,668,966 0.4357 $3,777,069 40 Oregon $2,632,274 $3,948,411 $63,175 $6,643,859 0.4341 $2,884,099 30 Pennsylvania $12,598,434 $18,897,651 $309,418 $31,805,503 0.4406 $14,013,505 147 Rhode Island $1,364,360 $2,046,539 $58,326 $3,469,225 0.433 $1,502,175 16 South Carolina $3,185,523 $4,778,285 $178,389 $8,142,198 0.4318 $3,515,801 37 South Dakota $305,881 $458,822 $0 $764,703 0.4338 $331,728 3 Tennessee $3,390,117 $5,085,175 $0 $8,475,292 0.4726 $4,005,423 42 Texas $35,422,907 $53,134,361 $0 $88,557,268 0.4376 $38,752,660 406 Utah $4,636,240 $6,954,360 $185,450 $11,776,049 0.4326 $5,094,319 53 Vermont $1,150,888 $1,726,333 $71,815 $2,949,036 0.4316 $1,272,804 13 Virginia $14,907,071 $22,360,607 $685,725 $37,953,403 0.4349 $16,505,935 173 Washington $37,902,240 $56,853,360 $0 $94,755,601 0.4937 $46,780,840 490 West Virginia $1,504,791 $2,257,186 $72,230 $3,834,206 0.4336 $1,662,512 17 Wisconsin $2,825,568 $4,238,352 $146,930 $7,210,850 0.4331 $3,123,019 33 Wyoming $155,765 $233,648 $0 $389,413 0.4317 $168,110 2 TOTAL $420,000,000 $630,000,000 $12,314,681 $1,062,314,681 $487,060,836 5,103Average $9,741,217 102STD $14,302,673 150
Table 12: 2015 Indirect Economic & Employment Impacts of Agriculture Spending
StateDirect Spending State
Indirect Multipliers
Indirect Economic
Impact
Indirect Employment
Impact
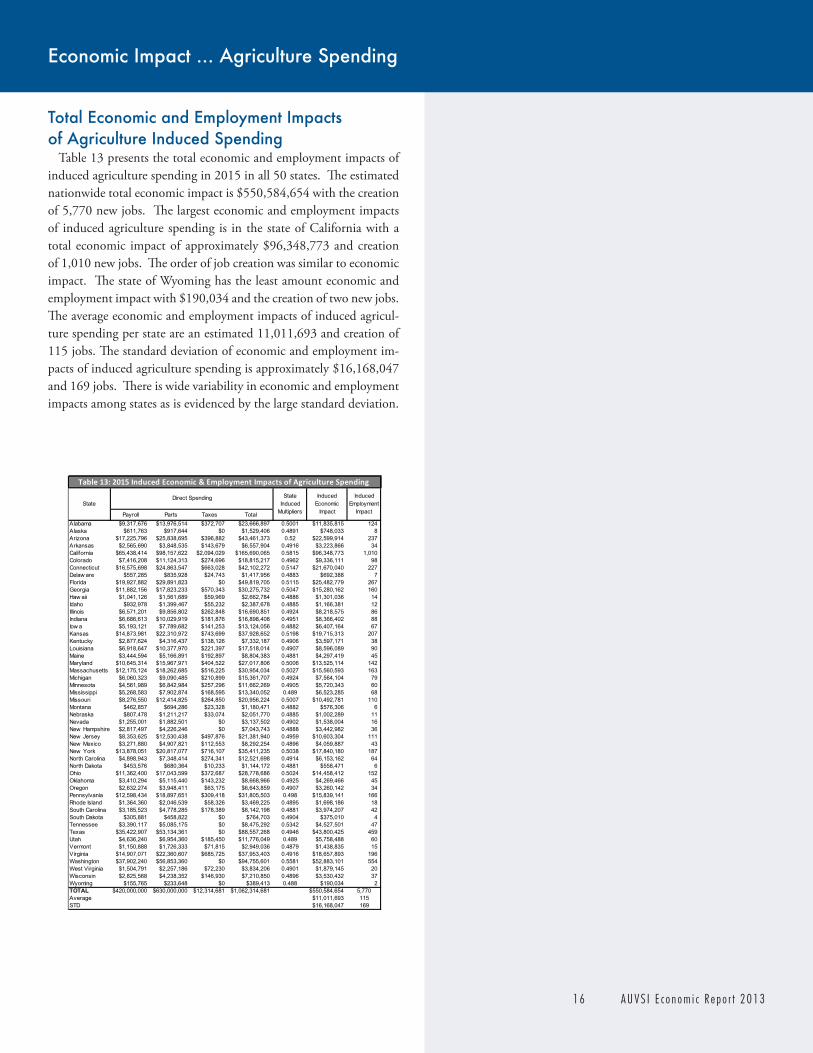
1 6 A U V S I E c o n o m i c R e p o r t 2 0 1 3
Total Economic and Employment Impacts of Agriculture Induced Spending Table 13 presents the total economic and employment impacts of induced agriculture spending in 2015 in all 50 states. The estimated nationwide total economic impact is $550,584,654 with the creation of 5,770 new jobs. The largest economic and employment impacts of induced agriculture spending is in the state of California with a total economic impact of approximately $96,348,773 and creation of 1,010 new jobs. The order of job creation was similar to economic impact. The state of Wyoming has the least amount economic and employment impact with $190,034 and the creation of two new jobs. The average economic and employment impacts of induced agricul-ture spending per state are an estimated 11,011,693 and creation of 115 jobs. The standard deviation of economic and employment im-pacts of induced agriculture spending is approximately $16,168,047 and 169 jobs. There is wide variability in economic and employment impacts among states as is evidenced by the large standard deviation.
Economic Impact ... Agriculture Spending
Payroll Parts Taxes TotalAlabama $9,317,676 $13,976,514 $372,707 $23,666,897 0.5001 $11,835,815 124 Alaska $611,763 $917,644 $0 $1,529,406 0.4891 $748,033 8 Arizona $17,225,796 $25,838,695 $396,882 $43,461,373 0.52 $22,599,914 237 Arkansas $2,565,690 $3,848,535 $143,679 $6,557,904 0.4916 $3,223,866 34 California $65,438,414 $98,157,622 $2,094,029 $165,690,065 0.5815 $96,348,773 1,010 Colorado $7,416,208 $11,124,313 $274,696 $18,815,217 0.4962 $9,336,111 98 Connecticut $16,575,698 $24,863,547 $663,028 $42,102,272 0.5147 $21,670,040 227 Delaw are $557,285 $835,928 $24,743 $1,417,956 0.4883 $692,388 7 Florida $19,927,882 $29,891,823 $0 $49,819,705 0.5115 $25,482,779 267 Georgia $11,882,156 $17,823,233 $570,343 $30,275,732 0.5047 $15,280,162 160 Haw aii $1,041,126 $1,561,689 $59,969 $2,662,784 0.4886 $1,301,036 14 Idaho $932,978 $1,399,467 $55,232 $2,387,678 0.4885 $1,166,381 12 Illinois $6,571,201 $9,856,802 $262,848 $16,690,851 0.4924 $8,218,575 86 Indiana $6,686,613 $10,029,919 $181,876 $16,898,408 0.4951 $8,366,402 88 Iow a $5,193,121 $7,789,682 $141,253 $13,124,056 0.4882 $6,407,164 67 Kansas $14,873,981 $22,310,972 $743,699 $37,928,652 0.5198 $19,715,313 207 Kentucky $2,877,624 $4,316,437 $138,126 $7,332,187 0.4906 $3,597,171 38 Louisiana $6,918,647 $10,377,970 $221,397 $17,518,014 0.4907 $8,596,089 90 Maine $3,444,594 $5,166,891 $192,897 $8,804,383 0.4881 $4,297,419 45 Maryland $10,645,314 $15,967,971 $404,522 $27,017,806 0.5006 $13,525,114 142 Massachusetts $12,175,124 $18,262,685 $516,225 $30,954,034 0.5027 $15,560,593 163 Michigan $6,060,323 $9,090,485 $210,899 $15,361,707 0.4924 $7,564,104 79 Minnesota $4,561,989 $6,842,984 $257,296 $11,662,269 0.4905 $5,720,343 60 Mississippi $5,268,583 $7,902,874 $168,595 $13,340,052 0.489 $6,523,285 68 Missouri $8,276,550 $12,414,825 $264,850 $20,956,224 0.5007 $10,492,781 110 Montana $462,857 $694,286 $23,328 $1,180,471 0.4882 $576,306 6 Nebraska $807,478 $1,211,217 $33,074 $2,051,770 0.4885 $1,002,289 11 Nevada $1,255,001 $1,882,501 $0 $3,137,502 0.4902 $1,538,004 16 New Hampshire $2,817,497 $4,226,246 $0 $7,043,743 0.4888 $3,442,982 36 New Jersey $8,353,625 $12,530,438 $497,876 $21,381,940 0.4959 $10,603,304 111 New Mexico $3,271,880 $4,907,821 $112,553 $8,292,254 0.4896 $4,059,887 43 New York $13,878,051 $20,817,077 $716,107 $35,411,235 0.5038 $17,840,180 187 North Carolina $4,898,943 $7,348,414 $274,341 $12,521,698 0.4914 $6,153,162 64 North Dakota $453,576 $680,364 $10,233 $1,144,172 0.4881 $558,471 6 Ohio $11,362,400 $17,043,599 $372,687 $28,778,686 0.5024 $14,458,412 152 Oklahoma $3,410,294 $5,115,440 $143,232 $8,668,966 0.4925 $4,269,466 45 Oregon $2,632,274 $3,948,411 $63,175 $6,643,859 0.4907 $3,260,142 34 Pennsylvania $12,598,434 $18,897,651 $309,418 $31,805,503 0.498 $15,839,141 166 Rhode Island $1,364,360 $2,046,539 $58,326 $3,469,225 0.4895 $1,698,186 18 South Carolina $3,185,523 $4,778,285 $178,389 $8,142,198 0.4881 $3,974,207 42 South Dakota $305,881 $458,822 $0 $764,703 0.4904 $375,010 4 Tennessee $3,390,117 $5,085,175 $0 $8,475,292 0.5342 $4,527,501 47 Texas $35,422,907 $53,134,361 $0 $88,557,268 0.4946 $43,800,425 459 Utah $4,636,240 $6,954,360 $185,450 $11,776,049 0.489 $5,758,488 60 Vermont $1,150,888 $1,726,333 $71,815 $2,949,036 0.4879 $1,438,835 15 Virginia $14,907,071 $22,360,607 $685,725 $37,953,403 0.4916 $18,657,893 196 Washington $37,902,240 $56,853,360 $0 $94,755,601 0.5581 $52,883,101 554 West Virginia $1,504,791 $2,257,186 $72,230 $3,834,206 0.4901 $1,879,145 20 Wisconsin $2,825,568 $4,238,352 $146,930 $7,210,850 0.4896 $3,530,432 37 Wyoming $155,765 $233,648 $0 $389,413 0.488 $190,034 2 TOTAL $420,000,000 $630,000,000 $12,314,681 $1,062,314,681 $550,584,654 5,770Average $11,011,693 115STD $16,168,047 169
Table 13: 2015 Induced Economic & Employment Impacts of Agriculture Spending
StateDirect Spending State
Induced Multipliers
Induced Economic
Impact
Induced Employment
Impact
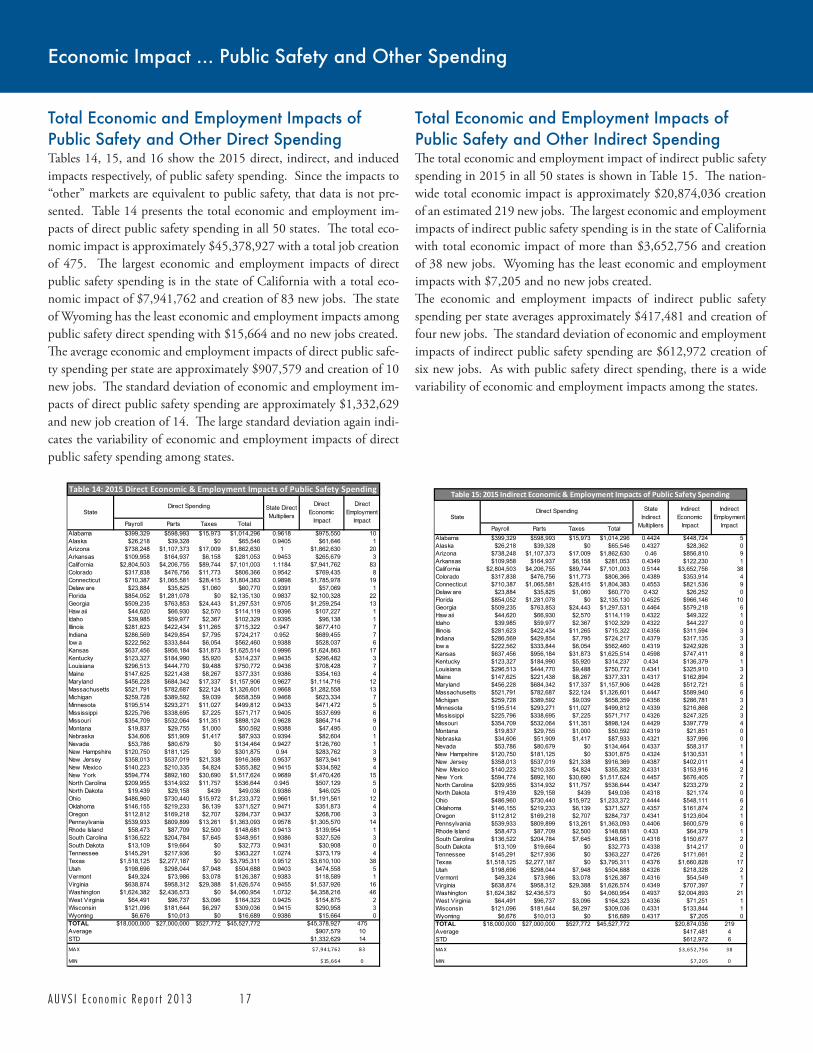
A U V S I E c o n o m i c R e p o r t 2 0 1 3 1 7
Economic Impact ... Public Safety and Other Spending
Total Economic and Employment Impacts of Public Safety and Other Direct Spending Tables 14, 15, and 16 show the 2015 direct, indirect, and induced impacts respectively, of public safety spending. Since the impacts to “other” markets are equivalent to public safety, that data is not pre-sented. Table 14 presents the total economic and employment im-pacts of direct public safety spending in all 50 states. The total eco-nomic impact is approximately $45,378,927 with a total job creation of 475. The largest economic and employment impacts of direct public safety spending is in the state of California with a total eco-nomic impact of $7,941,762 and creation of 83 new jobs. The state of Wyoming has the least economic and employment impacts among public safety direct spending with $15,664 and no new jobs created.The average economic and employment impacts of direct public safe-ty spending per state are approximately $907,579 and creation of 10 new jobs. The standard deviation of economic and employment im-pacts of direct public safety spending are approximately $1,332,629 and new job creation of 14. The large standard deviation again indi-cates the variability of economic and employment impacts of direct public safety spending among states.
Total Economic and Employment Impacts ofPublic Safety and Other Indirect Spending The total economic and employment impact of indirect public safety spending in 2015 in all 50 states is shown in Table 15. The nation-wide total economic impact is approximately $20,874,036 creation of an estimated 219 new jobs. The largest economic and employment impacts of indirect public safety spending is in the state of California with total economic impact of more than $3,652,756 and creation of 38 new jobs. Wyoming has the least economic and employment impacts with $7,205 and no new jobs created.The economic and employment impacts of indirect public safety spending per state averages approximately $417,481 and creation of four new jobs. The standard deviation of economic and employment impacts of indirect public safety spending are $612,972 creation of six new jobs. As with public safety direct spending, there is a wide variability of economic and employment impacts among the states.
Payroll Parts Taxes TotalAlabama $399,329 $598,993 $15,973 $1,014,296 0.9618 $975,550 10 Alaska $26,218 $39,328 $0 $65,546 0.9405 $61,646 1 Arizona $738,248 $1,107,373 $17,009 $1,862,630 1 $1,862,630 20 Arkansas $109,958 $164,937 $6,158 $281,053 0.9453 $265,679 3 California $2,804,503 $4,206,755 $89,744 $7,101,003 1.1184 $7,941,762 83 Colorado $317,838 $476,756 $11,773 $806,366 0.9542 $769,435 8 Connecticut $710,387 $1,065,581 $28,415 $1,804,383 0.9898 $1,785,978 19 Delaw are $23,884 $35,825 $1,060 $60,770 0.9391 $57,069 1 Florida $854,052 $1,281,078 $0 $2,135,130 0.9837 $2,100,328 22 Georgia $509,235 $763,853 $24,443 $1,297,531 0.9705 $1,259,254 13 Haw aii $44,620 $66,930 $2,570 $114,119 0.9396 $107,227 1 Idaho $39,985 $59,977 $2,367 $102,329 0.9395 $96,138 1 Illinois $281,623 $422,434 $11,265 $715,322 0.947 $677,410 7 Indiana $286,569 $429,854 $7,795 $724,217 0.952 $689,455 7 Iow a $222,562 $333,844 $6,054 $562,460 0.9388 $528,037 6 Kansas $637,456 $956,184 $31,873 $1,625,514 0.9996 $1,624,863 17 Kentucky $123,327 $184,990 $5,920 $314,237 0.9435 $296,482 3 Louisiana $296,513 $444,770 $9,488 $750,772 0.9436 $708,428 7 Maine $147,625 $221,438 $8,267 $377,331 0.9386 $354,163 4 Maryland $456,228 $684,342 $17,337 $1,157,906 0.9627 $1,114,716 12 Massachusetts $521,791 $782,687 $22,124 $1,326,601 0.9668 $1,282,558 13 Michigan $259,728 $389,592 $9,039 $658,359 0.9468 $623,334 7 Minnesota $195,514 $293,271 $11,027 $499,812 0.9433 $471,472 5 Mississippi $225,796 $338,695 $7,225 $571,717 0.9405 $537,699 6 Missouri $354,709 $532,064 $11,351 $898,124 0.9628 $864,714 9 Montana $19,837 $29,755 $1,000 $50,592 0.9388 $47,495 0 Nebraska $34,606 $51,909 $1,417 $87,933 0.9394 $82,604 1 Nevada $53,786 $80,679 $0 $134,464 0.9427 $126,760 1 New Hampshire $120,750 $181,125 $0 $301,875 0.94 $283,762 3 New Jersey $358,013 $537,019 $21,338 $916,369 0.9537 $873,941 9 New Mexico $140,223 $210,335 $4,824 $355,382 0.9415 $334,592 4 New York $594,774 $892,160 $30,690 $1,517,624 0.9689 $1,470,426 15 North Carolina $209,955 $314,932 $11,757 $536,644 0.945 $507,129 5 North Dakota $19,439 $29,158 $439 $49,036 0.9386 $46,025 0 Ohio $486,960 $730,440 $15,972 $1,233,372 0.9661 $1,191,561 12 Oklahoma $146,155 $219,233 $6,139 $371,527 0.9471 $351,873 4 Oregon $112,812 $169,218 $2,707 $284,737 0.9437 $268,706 3 Pennsylvania $539,933 $809,899 $13,261 $1,363,093 0.9578 $1,305,570 14 Rhode Island $58,473 $87,709 $2,500 $148,681 0.9413 $139,954 1 South Carolina $136,522 $204,784 $7,645 $348,951 0.9386 $327,526 3 South Dakota $13,109 $19,664 $0 $32,773 0.9431 $30,908 0 Tennessee $145,291 $217,936 $0 $363,227 1.0274 $373,179 4 Texas $1,518,125 $2,277,187 $0 $3,795,311 0.9512 $3,610,100 38 Utah $198,696 $298,044 $7,948 $504,688 0.9403 $474,558 5 Vermont $49,324 $73,986 $3,078 $126,387 0.9383 $118,589 1 Virginia $638,874 $958,312 $29,388 $1,626,574 0.9455 $1,537,926 16 Washington $1,624,382 $2,436,573 $0 $4,060,954 1.0732 $4,358,216 46 West Virginia $64,491 $96,737 $3,096 $164,323 0.9425 $154,875 2 Wisconsin $121,096 $181,644 $6,297 $309,036 0.9415 $290,958 3 Wyoming $6,676 $10,013 $0 $16,689 0.9386 $15,664 0 TOTAL $18,000,000 $27,000,000 $527,772 $45,527,772 $45,378,927 475Average $907,579 10STD $1,332,629 14MA X $7,941,762 83
MIN $15,664 0
Table 14: 2015 Direct Economic & Employment Impacts of Public Safety Spending
StateDirect Spending State Direct
Multipliers
Direct Economic
Impact
Direct Employment
ImpactPayroll Parts Taxes Total
Alabama $399,329 $598,993 $15,973 $1,014,296 0.4424 $448,724 5 Alaska $26,218 $39,328 $0 $65,546 0.4327 $28,362 0 Arizona $738,248 $1,107,373 $17,009 $1,862,630 0.46 $856,810 9 Arkansas $109,958 $164,937 $6,158 $281,053 0.4349 $122,230 1 California $2,804,503 $4,206,755 $89,744 $7,101,003 0.5144 $3,652,756 38 Colorado $317,838 $476,756 $11,773 $806,366 0.4389 $353,914 4 Connecticut $710,387 $1,065,581 $28,415 $1,804,383 0.4553 $821,536 9 Delaw are $23,884 $35,825 $1,060 $60,770 0.432 $26,252 0 Florida $854,052 $1,281,078 $0 $2,135,130 0.4525 $966,146 10 Georgia $509,235 $763,853 $24,443 $1,297,531 0.4464 $579,218 6 Haw aii $44,620 $66,930 $2,570 $114,119 0.4322 $49,322 1 Idaho $39,985 $59,977 $2,367 $102,329 0.4322 $44,227 0 Illinois $281,623 $422,434 $11,265 $715,322 0.4356 $311,594 3 Indiana $286,569 $429,854 $7,795 $724,217 0.4379 $317,135 3 Iow a $222,562 $333,844 $6,054 $562,460 0.4319 $242,926 3 Kansas $637,456 $956,184 $31,873 $1,625,514 0.4598 $747,411 8 Kentucky $123,327 $184,990 $5,920 $314,237 0.434 $136,379 1 Louisiana $296,513 $444,770 $9,488 $750,772 0.4341 $325,910 3 Maine $147,625 $221,438 $8,267 $377,331 0.4317 $162,894 2 Maryland $456,228 $684,342 $17,337 $1,157,906 0.4428 $512,721 5 Massachusetts $521,791 $782,687 $22,124 $1,326,601 0.4447 $589,940 6 Michigan $259,728 $389,592 $9,039 $658,359 0.4356 $286,781 3 Minnesota $195,514 $293,271 $11,027 $499,812 0.4339 $216,868 2 Mississippi $225,796 $338,695 $7,225 $571,717 0.4326 $247,325 3 Missouri $354,709 $532,064 $11,351 $898,124 0.4429 $397,779 4 Montana $19,837 $29,755 $1,000 $50,592 0.4319 $21,851 0 Nebraska $34,606 $51,909 $1,417 $87,933 0.4321 $37,996 0 Nevada $53,786 $80,679 $0 $134,464 0.4337 $58,317 1 New Hampshire $120,750 $181,125 $0 $301,875 0.4324 $130,531 1 New Jersey $358,013 $537,019 $21,338 $916,369 0.4387 $402,011 4 New Mexico $140,223 $210,335 $4,824 $355,382 0.4331 $153,916 2 New York $594,774 $892,160 $30,690 $1,517,624 0.4457 $676,405 7 North Carolina $209,955 $314,932 $11,757 $536,644 0.4347 $233,279 2 North Dakota $19,439 $29,158 $439 $49,036 0.4318 $21,174 0 Ohio $486,960 $730,440 $15,972 $1,233,372 0.4444 $548,111 6 Oklahoma $146,155 $219,233 $6,139 $371,527 0.4357 $161,874 2 Oregon $112,812 $169,218 $2,707 $284,737 0.4341 $123,604 1 Pennsylvania $539,933 $809,899 $13,261 $1,363,093 0.4406 $600,579 6 Rhode Island $58,473 $87,709 $2,500 $148,681 0.433 $64,379 1 South Carolina $136,522 $204,784 $7,645 $348,951 0.4318 $150,677 2 South Dakota $13,109 $19,664 $0 $32,773 0.4338 $14,217 0 Tennessee $145,291 $217,936 $0 $363,227 0.4726 $171,661 2 Texas $1,518,125 $2,277,187 $0 $3,795,311 0.4376 $1,660,828 17 Utah $198,696 $298,044 $7,948 $504,688 0.4326 $218,328 2 Vermont $49,324 $73,986 $3,078 $126,387 0.4316 $54,549 1 Virginia $638,874 $958,312 $29,388 $1,626,574 0.4349 $707,397 7 Washington $1,624,382 $2,436,573 $0 $4,060,954 0.4937 $2,004,893 21 West Virginia $64,491 $96,737 $3,096 $164,323 0.4336 $71,251 1 Wisconsin $121,096 $181,644 $6,297 $309,036 0.4331 $133,844 1 Wyoming $6,676 $10,013 $0 $16,689 0.4317 $7,205 0 TOTAL $18,000,000 $27,000,000 $527,772 $45,527,772 $20,874,036 219Average $417,481 4STD $612,972 6MA X $3,652,756 38
MIN $7,205 0
Table 15: 2015 Indirect Economic & Employment Impacts of Public Safety Spending
StateDirect Spending State
Indirect Multipliers
Indirect Economic
Impact
Indirect Employment
Impact
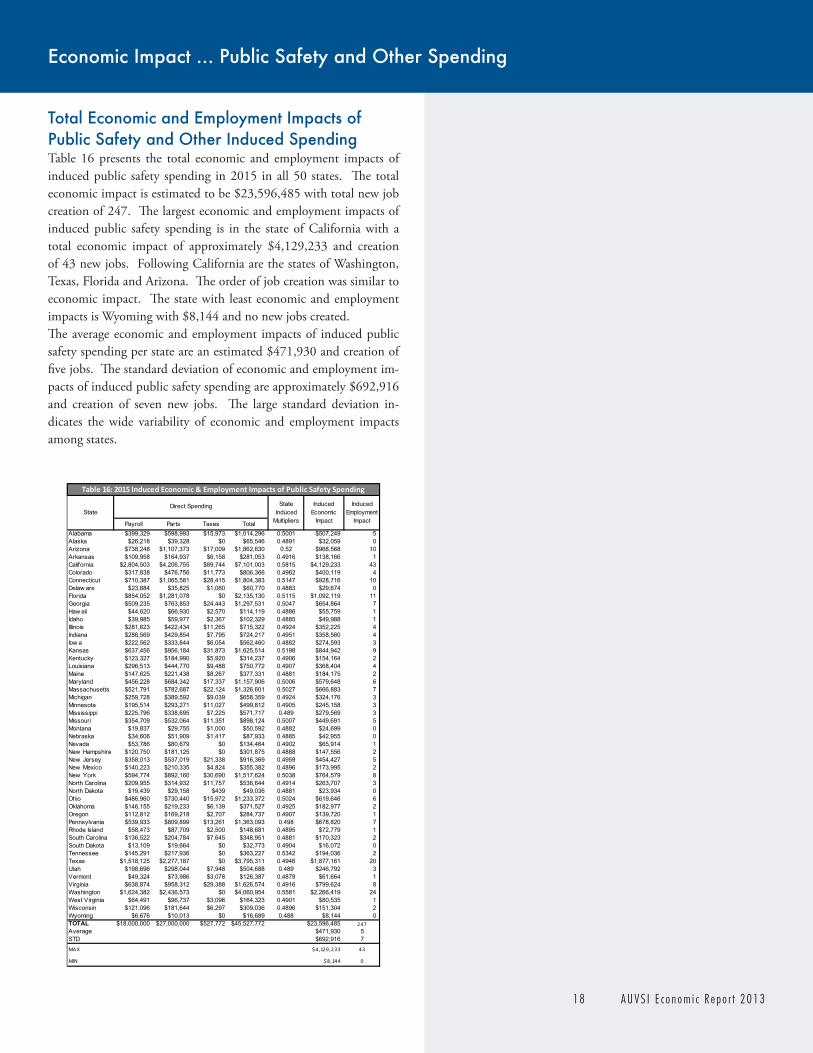
1 8 A U V S I E c o n o m i c R e p o r t 2 0 1 3
Total Economic and Employment Impacts of Public Safety and Other Induced SpendingTable 16 presents the total economic and employment impacts of induced public safety spending in 2015 in all 50 states. The total economic impact is estimated to be $23,596,485 with total new job creation of 247. The largest economic and employment impacts of induced public safety spending is in the state of California with a total economic impact of approximately $4,129,233 and creation of 43 new jobs. Following California are the states of Washington, Texas, Florida and Arizona. The order of job creation was similar to economic impact. The state with least economic and employment impacts is Wyoming with $8,144 and no new jobs created.The average economic and employment impacts of induced public safety spending per state are an estimated $471,930 and creation of five jobs. The standard deviation of economic and employment im-pacts of induced public safety spending are approximately $692,916 and creation of seven new jobs. The large standard deviation in-dicates the wide variability of economic and employment impacts among states.
Economic Impact ... Public Safety and Other Spending
Payroll Parts Taxes TotalAlabama $399,329 $598,993 $15,973 $1,014,296 0.5001 $507,249 5 Alaska $26,218 $39,328 $0 $65,546 0.4891 $32,059 0 Arizona $738,248 $1,107,373 $17,009 $1,862,630 0.52 $968,568 10 Arkansas $109,958 $164,937 $6,158 $281,053 0.4916 $138,166 1 California $2,804,503 $4,206,755 $89,744 $7,101,003 0.5815 $4,129,233 43 Colorado $317,838 $476,756 $11,773 $806,366 0.4962 $400,119 4 Connecticut $710,387 $1,065,581 $28,415 $1,804,383 0.5147 $928,716 10 Delaw are $23,884 $35,825 $1,060 $60,770 0.4883 $29,674 0 Florida $854,052 $1,281,078 $0 $2,135,130 0.5115 $1,092,119 11 Georgia $509,235 $763,853 $24,443 $1,297,531 0.5047 $654,864 7 Haw aii $44,620 $66,930 $2,570 $114,119 0.4886 $55,759 1 Idaho $39,985 $59,977 $2,367 $102,329 0.4885 $49,988 1 Illinois $281,623 $422,434 $11,265 $715,322 0.4924 $352,225 4 Indiana $286,569 $429,854 $7,795 $724,217 0.4951 $358,560 4 Iow a $222,562 $333,844 $6,054 $562,460 0.4882 $274,593 3 Kansas $637,456 $956,184 $31,873 $1,625,514 0.5198 $844,942 9 Kentucky $123,327 $184,990 $5,920 $314,237 0.4906 $154,164 2 Louisiana $296,513 $444,770 $9,488 $750,772 0.4907 $368,404 4 Maine $147,625 $221,438 $8,267 $377,331 0.4881 $184,175 2 Maryland $456,228 $684,342 $17,337 $1,157,906 0.5006 $579,648 6 Massachusetts $521,791 $782,687 $22,124 $1,326,601 0.5027 $666,883 7 Michigan $259,728 $389,592 $9,039 $658,359 0.4924 $324,176 3 Minnesota $195,514 $293,271 $11,027 $499,812 0.4905 $245,158 3 Mississippi $225,796 $338,695 $7,225 $571,717 0.489 $279,569 3 Missouri $354,709 $532,064 $11,351 $898,124 0.5007 $449,691 5 Montana $19,837 $29,755 $1,000 $50,592 0.4882 $24,699 0 Nebraska $34,606 $51,909 $1,417 $87,933 0.4885 $42,955 0 Nevada $53,786 $80,679 $0 $134,464 0.4902 $65,914 1 New Hampshire $120,750 $181,125 $0 $301,875 0.4888 $147,556 2 New Jersey $358,013 $537,019 $21,338 $916,369 0.4959 $454,427 5 New Mexico $140,223 $210,335 $4,824 $355,382 0.4896 $173,995 2 New York $594,774 $892,160 $30,690 $1,517,624 0.5038 $764,579 8 North Carolina $209,955 $314,932 $11,757 $536,644 0.4914 $263,707 3 North Dakota $19,439 $29,158 $439 $49,036 0.4881 $23,934 0 Ohio $486,960 $730,440 $15,972 $1,233,372 0.5024 $619,646 6 Oklahoma $146,155 $219,233 $6,139 $371,527 0.4925 $182,977 2 Oregon $112,812 $169,218 $2,707 $284,737 0.4907 $139,720 1 Pennsylvania $539,933 $809,899 $13,261 $1,363,093 0.498 $678,820 7 Rhode Island $58,473 $87,709 $2,500 $148,681 0.4895 $72,779 1 South Carolina $136,522 $204,784 $7,645 $348,951 0.4881 $170,323 2 South Dakota $13,109 $19,664 $0 $32,773 0.4904 $16,072 0 Tennessee $145,291 $217,936 $0 $363,227 0.5342 $194,036 2 Texas $1,518,125 $2,277,187 $0 $3,795,311 0.4946 $1,877,161 20 Utah $198,696 $298,044 $7,948 $504,688 0.489 $246,792 3 Vermont $49,324 $73,986 $3,078 $126,387 0.4879 $61,664 1 Virginia $638,874 $958,312 $29,388 $1,626,574 0.4916 $799,624 8 Washington $1,624,382 $2,436,573 $0 $4,060,954 0.5581 $2,266,419 24 West Virginia $64,491 $96,737 $3,096 $164,323 0.4901 $80,535 1 Wisconsin $121,096 $181,644 $6,297 $309,036 0.4896 $151,304 2 Wyoming $6,676 $10,013 $0 $16,689 0.488 $8,144 0 TOTAL $18,000,000 $27,000,000 $527,772 $45,527,772 $23,596,485 247Average $471,930 5STD $692,916 7MA X $4,129,233 43
MIN $8,144 0
Direct Spending
Table 16: 2015 Induced Economic & Employment Impacts of Public Safety Spending
StateState
Induced Multipliers
Induced Economic
Impact
Induced Employment
Impact
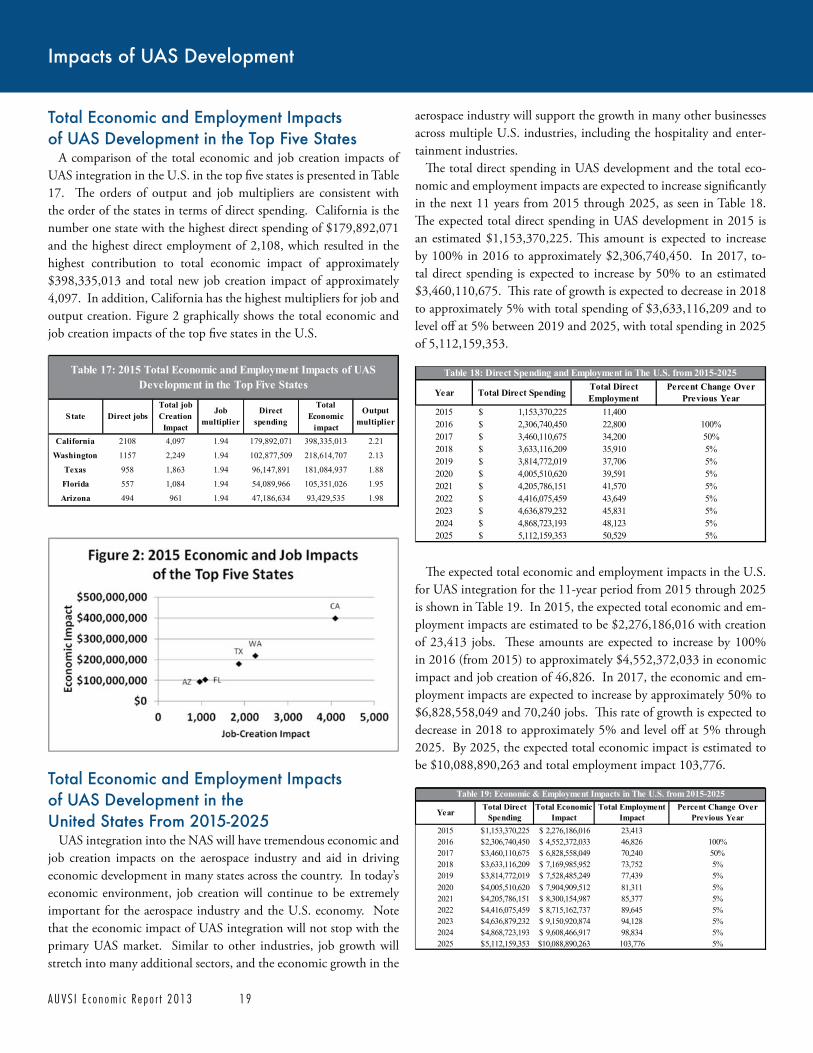
A U V S I E c o n o m i c R e p o r t 2 0 1 3 1 9
Impacts of UAS Development
Total Economic and Employment Impacts of UAS Development in the Top Five States
A comparison of the total economic and job creation impacts of UAS integration in the U.S. in the top five states is presented in Table 17. The orders of output and job multipliers are consistent with the order of the states in terms of direct spending. California is the number one state with the highest direct spending of $179,892,071 and the highest direct employment of 2,108, which resulted in the highest contribution to total economic impact of approximately $398,335,013 and total new job creation impact of approximately 4,097. In addition, California has the highest multipliers for job and output creation. Figure 2 graphically shows the total economic and job creation impacts of the top five states in the U.S.
Total Economic and Employment Impacts of UAS Development in the United States From 2015-2025
UAS integration into the NAS will have tremendous economic and job creation impacts on the aerospace industry and aid in driving economic development in many states across the country. In today’s economic environment, job creation will continue to be extremely important for the aerospace industry and the U.S. economy. Note that the economic impact of UAS integration will not stop with the primary UAS market. Similar to other industries, job growth will stretch into many additional sectors, and the economic growth in the
aerospace industry will support the growth in many other businesses across multiple U.S. industries, including the hospitality and enter-tainment industries.
The total direct spending in UAS development and the total eco-nomic and employment impacts are expected to increase significantly in the next 11 years from 2015 through 2025, as seen in Table 18. The expected total direct spending in UAS development in 2015 is an estimated $1,153,370,225. This amount is expected to increase by 100% in 2016 to approximately $2,306,740,450. In 2017, to-tal direct spending is expected to increase by 50% to an estimated $3,460,110,675. This rate of growth is expected to decrease in 2018 to approximately 5% with total spending of $3,633,116,209 and to level off at 5% between 2019 and 2025, with total spending in 2025 of 5,112,159,353.
The expected total economic and employment impacts in the U.S. for UAS integration for the 11-year period from 2015 through 2025 is shown in Table 19. In 2015, the expected total economic and em-ployment impacts are estimated to be $2,276,186,016 with creation of 23,413 jobs. These amounts are expected to increase by 100% in 2016 (from 2015) to approximately $4,552,372,033 in economic impact and job creation of 46,826. In 2017, the economic and em-ployment impacts are expected to increase by approximately 50% to $6,828,558,049 and 70,240 jobs. This rate of growth is expected to decrease in 2018 to approximately 5% and level off at 5% through 2025. By 2025, the expected total economic impact is estimated to be $10,088,890,263 and total employment impact 103,776.
State Direct jobsTotal job Creation
Impact
Job multiplier
Direct spending
Total Economic
impact
Output multiplier
California 2108 4,097 1.94 179,892,071 398,335,013 2.21
Washington 1157 2,249 1.94 102,877,509 218,614,707 2.13
Texas 958 1,863 1.94 96,147,891 181,084,937 1.88
Florida 557 1,084 1.94 54,089,966 105,351,026 1.95
Arizona 494 961 1.94 47,186,634 93,429,535 1.98
Table 17: 2015 Total Economic and Employment Impacts of UAS Development in the Top Five States
Year Total Direct SpendingTotal Direct Employment
Percent Change Over Previous Year
2015 1,153,370,225$ 11,4002016 2,306,740,450$ 22,800 100%2017 3,460,110,675$ 34,200 50%2018 3,633,116,209$ 35,910 5%2019 3,814,772,019$ 37,706 5%2020 4,005,510,620$ 39,591 5%2021 4,205,786,151$ 41,570 5%2022 4,416,075,459$ 43,649 5%2023 4,636,879,232$ 45,831 5%2024 4,868,723,193$ 48,123 5%2025 5,112,159,353$ 50,529 5%
Table 18: Direct Spending and Employment in The U.S. from 2015-2025
2015 1,153,370,225$ 2,276,186,016$ 23,4132016 2,306,740,450$ 4,552,372,033$ 46,826 100%2017 3,460,110,675$ 6,828,558,049$ 70,240 50%2018 3,633,116,209$ 7,169,985,952$ 73,752 5%2019 3,814,772,019$ 7,528,485,249$ 77,439 5%2020 4,005,510,620$ 7,904,909,512$ 81,311 5%2021 4,205,786,151$ 8,300,154,987$ 85,377 5%2022 4,416,075,459$ 8,715,162,737$ 89,645 5%2023 4,636,879,232$ 9,150,920,874$ 94,128 5%2024 4,868,723,193$ 9,608,466,917$ 98,834 5%2025 5,112,159,353$ 10,088,890,263$ 103,776 5%
Table 19: Economic & Employment Impacts in The U.S. from 2015-2025
YearPercent Change Over
Previous YearTotal Employment
ImpactTotal Economic
ImpactTotal Direct
Spending

2 0 A U V S I E c o n o m i c R e p o r t 2 0 1 3
Figure 3 graphically compares total spending and economic impacts from 2015 to 2025. There are high growth rates for both spending and total economic impact in the first three years (2015-2017) but both spending and total economic impact growth are expected to decrease to 5% in 2018 and level off at 5% through 2025.
Direct employment and total employment impact from 2015 to 2025 are compared in Figure 4. There are high growth rates for both direct and total employment impacts in the first three years (2015-2017) to approximately 100% and 50% in 2016 and 2017, respec-tively. The growth rate of both direct employment and total employ-ment impacts are expected to decrease to 5% in 2018 and level off at 5% through 2025.
Conclusion UAS integration into the NAS is expected to have enormous eco-
nomic and job creation impacts in the United States. These impacts have been demonstrated to be due to direct, indirect and induced effects of total spending in UAS development. The results of these economic impacts are as follows:During the 11-year period 2015-2025:
-tion’s economy by agriculture, public safety and other activities;
over the time period;
impact by agriculture, $3.2 billion by public safety and $3.2 billion by other activities;
require technical baccalaureate degrees; and
than 34,000 manufacturing jobs and more than 70,000 new jobs.This study demonstrates the significant contribution of UAS in-
tegration to the economic growth and job creation in the aerospace industry and to the social and economic progress of the citizens in the United States.
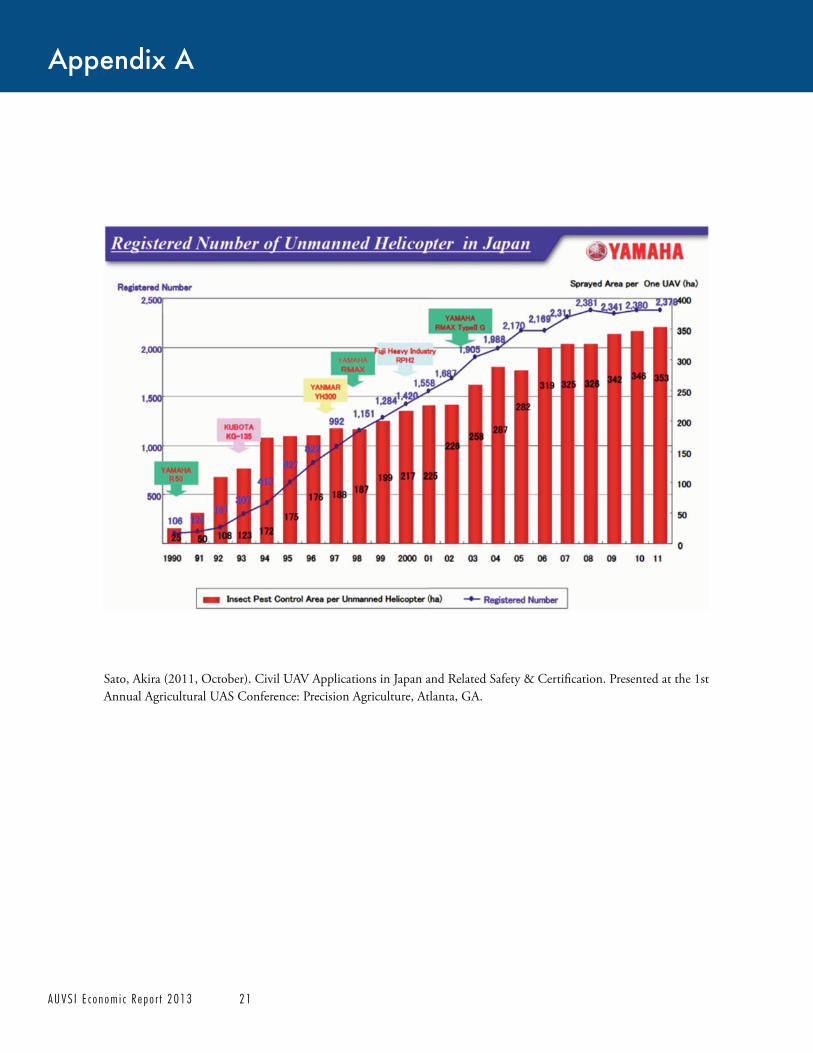
A U V S I E c o n o m i c R e p o r t 2 0 1 3 2 1
Sato, Akira (2011, October). Civil UAV Applications in Japan and Related Safety & Certification. Presented at the 1st Annual Agricultural UAS Conference: Precision Agriculture, Atlanta, GA.
Appendix A
2 2 A U V S I E c o n o m i c R e p o r t 2 0 1 3
Appendix BState Level Detailed Economic Impact
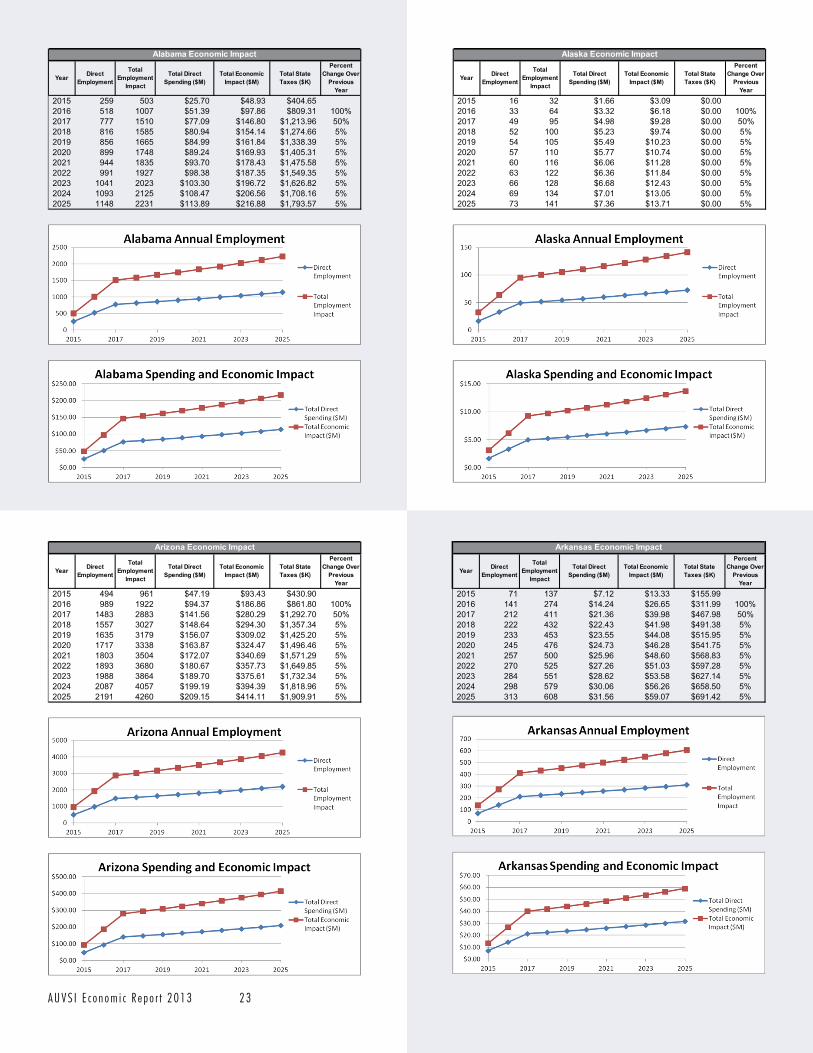
A U V S I E c o n o m i c R e p o r t 2 0 1 3 2 3
Year Direct Employment
Total Employment
Impact
Total Direct Spending ($M)
Total Economic Impact ($M)
Total State Taxes ($K)
Percent Change Over
Previous Year
2015 259 503 $25.70 $48.93 $404.652016 518 1007 $51.39 $97.86 $809.31 100%2017 777 1510 $77.09 $146.80 $1,213.96 50%2018 816 1585 $80.94 $154.14 $1,274.66 5%2019 856 1665 $84.99 $161.84 $1,338.39 5%2020 899 1748 $89.24 $169.93 $1,405.31 5%2021 944 1835 $93.70 $178.43 $1,475.58 5%2022 991 1927 $98.38 $187.35 $1,549.35 5%2023 1041 2023 $103.30 $196.72 $1,626.82 5%2024 1093 2125 $108.47 $206.56 $1,708.16 5%2025 1148 2231 $113.89 $216.88 $1,793.57 5%
Alabama Economic Impact
Year Direct Employment
Total Employment
Impact
Total Direct Spending ($M)
Total Economic Impact ($M)
Total State Taxes ($K)
Percent Change Over
Previous Year
2015 16 32 $1.66 $3.09 $0.002016 33 64 $3.32 $6.18 $0.00 100%2017 49 95 $4.98 $9.28 $0.00 50%2018 52 100 $5.23 $9.74 $0.00 5%2019 54 105 $5.49 $10.23 $0.00 5%2020 57 110 $5.77 $10.74 $0.00 5%2021 60 116 $6.06 $11.28 $0.00 5%2022 63 122 $6.36 $11.84 $0.00 5%2023 66 128 $6.68 $12.43 $0.00 5%2024 69 134 $7.01 $13.05 $0.00 5%2025 73 141 $7.36 $13.71 $0.00 5%
Alaska Economic Impact
Year Direct Employment
Total Employment
Impact
Total Direct Spending ($M)
Total Economic Impact ($M)
Total State Taxes ($K)
Percent Change Over
Previous Year
2015 494 961 $47.19 $93.43 $430.902016 989 1922 $94.37 $186.86 $861.80 100%2017 1483 2883 $141.56 $280.29 $1,292.70 50%2018 1557 3027 $148.64 $294.30 $1,357.34 5%2019 1635 3179 $156.07 $309.02 $1,425.20 5%2020 1717 3338 $163.87 $324.47 $1,496.46 5%2021 1803 3504 $172.07 $340.69 $1,571.29 5%2022 1893 3680 $180.67 $357.73 $1,649.85 5%2023 1988 3864 $189.70 $375.61 $1,732.34 5%2024 2087 4057 $199.19 $394.39 $1,818.96 5%2025 2191 4260 $209.15 $414.11 $1,909.91 5%
Arizona Economic Impact
Year Direct Employment
Total Employment
Impact
Total Direct Spending ($M)
Total Economic Impact ($M)
Total State Taxes ($K)
Percent Change Over
Previous Year
2015 71 137 $7.12 $13.33 $155.992016 141 274 $14.24 $26.65 $311.99 100%2017 212 411 $21.36 $39.98 $467.98 50%2018 222 432 $22.43 $41.98 $491.38 5%2019 233 453 $23.55 $44.08 $515.95 5%2020 245 476 $24.73 $46.28 $541.75 5%2021 257 500 $25.96 $48.60 $568.83 5%2022 270 525 $27.26 $51.03 $597.28 5%2023 284 551 $28.62 $53.58 $627.14 5%2024 298 579 $30.06 $56.26 $658.50 5%2025 313 608 $31.56 $59.07 $691.42 5%
Arkansas Economic Impact

2 4 A U V S I E c o n o m i c R e p o r t 2 0 1 3
Year Direct Employment
Total Employment
Impact
Total Direct Spending ($M)
Total Economic Impact ($M)
Total State Taxes ($K)
Percent Change Over
Previous Year
2015 2108 4097 $179.89 $398.34 $2,273.522016 4216 8195 $359.78 $796.67 $4,547.03 100%2017 6324 12292 $539.68 $1,195.01 $6,820.55 50%2018 6640 12907 $566.66 $1,254.76 $7,161.58 5%2019 6972 13552 $594.99 $1,317.49 $7,519.66 5%2020 7321 14230 $624.74 $1,383.37 $7,895.64 5%2021 7687 14941 $655.98 $1,452.54 $8,290.42 5%2022 8071 15688 $688.78 $1,525.16 $8,704.95 5%2023 8475 16472 $723.22 $1,601.42 $9,140.19 5%2024 8898 17296 $759.38 $1,681.49 $9,597.20 5%2025 9343 18161 $797.35 $1,765.57 $10,077.06 5%
California Economic Impact
Year Direct Employment
Total Employment
Impact
Total Direct Spending ($M)
Total Economic Impact ($M)
Total State Taxes ($K)
Percent Change Over
Previous Year
2015 204 397 $20.43 $38.59 $298.242016 408 794 $40.86 $77.19 $596.48 100%2017 613 1191 $61.28 $115.78 $894.73 50%2018 643 1251 $64.35 $121.57 $939.46 5%2019 675 1313 $67.57 $127.65 $986.43 5%2020 709 1379 $70.94 $134.03 $1,035.76 5%2021 745 1448 $74.49 $140.74 $1,087.54 5%2022 782 1520 $78.22 $147.77 $1,141.92 5%2023 821 1596 $82.13 $155.16 $1,199.02 5%2024 862 1676 $86.23 $162.92 $1,258.97 5%2025 905 1760 $90.54 $171.07 $1,321.92 5%
Colorado Economic Impact
Year Direct Employment
Total Employment
Impact
Total Direct Spending ($M)
Total Economic Impact ($M)
Total State Taxes ($K)
Percent Change Over
Previous Year
2015 474 921 $45.71 $89.58 $719.862016 948 1843 $91.42 $179.17 $1,439.72 100%2017 1422 2764 $137.13 $268.75 $2,159.58 50%2018 1493 2903 $143.99 $282.19 $2,267.56 5%2019 1568 3048 $151.19 $296.30 $2,380.93 5%2020 1646 3200 $158.75 $311.12 $2,499.98 5%2021 1729 3360 $166.69 $326.67 $2,624.98 5%2022 1815 3528 $175.02 $343.01 $2,756.23 5%2023 1906 3705 $183.77 $360.16 $2,894.04 5%2024 2001 3890 $192.96 $378.16 $3,038.74 5%2025 2101 4084 $202.61 $397.07 $3,190.68 5%
Connecticut Economic Impact
Year Direct Employment
Total Employment
Impact
Total Direct Spending ($M)
Total Economic Impact ($M)
Total State Taxes ($K)
Percent Change Over
Previous Year
2015 15 29 $1.54 $2.86 $26.862016 30 59 $3.08 $5.73 $53.73 100%2017 45 88 $4.62 $8.59 $80.59 50%2018 48 93 $4.85 $9.02 $84.62 5%2019 50 97 $5.09 $9.47 $88.85 5%2020 53 102 $5.35 $9.94 $93.30 5%2021 55 107 $5.61 $10.44 $97.96 5%2022 58 113 $5.89 $10.96 $102.86 5%2023 61 118 $6.19 $11.51 $108.00 5%2024 64 124 $6.50 $12.08 $113.40 5%2025 67 131 $6.82 $12.69 $119.07 5%
Delaware Economic Impact
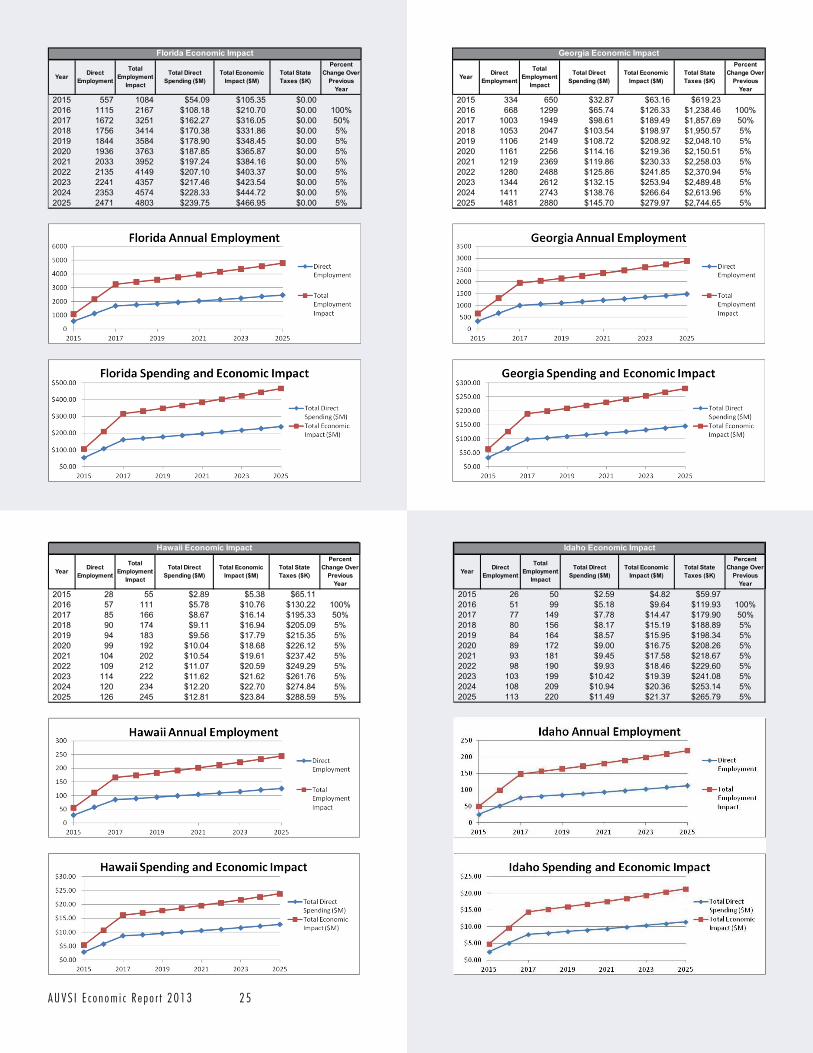
A U V S I E c o n o m i c R e p o r t 2 0 1 3 2 5
Year Direct Employment
Total Employment
Impact
Total Direct Spending ($M)
Total Economic Impact ($M)
Total State Taxes ($K)
Percent Change Over
Previous Year
2015 557 1084 $54.09 $105.35 $0.002016 1115 2167 $108.18 $210.70 $0.00 100%2017 1672 3251 $162.27 $316.05 $0.00 50%2018 1756 3414 $170.38 $331.86 $0.00 5%2019 1844 3584 $178.90 $348.45 $0.00 5%2020 1936 3763 $187.85 $365.87 $0.00 5%2021 2033 3952 $197.24 $384.16 $0.00 5%2022 2135 4149 $207.10 $403.37 $0.00 5%2023 2241 4357 $217.46 $423.54 $0.00 5%2024 2353 4574 $228.33 $444.72 $0.00 5%2025 2471 4803 $239.75 $466.95 $0.00 5%
Florida Economic Impact
Year Direct Employment
Total Employment
Impact
Total Direct Spending ($M)
Total Economic Impact ($M)
Total State Taxes ($K)
Percent Change Over
Previous Year
2015 334 650 $32.87 $63.16 $619.232016 668 1299 $65.74 $126.33 $1,238.46 100%2017 1003 1949 $98.61 $189.49 $1,857.69 50%2018 1053 2047 $103.54 $198.97 $1,950.57 5%2019 1106 2149 $108.72 $208.92 $2,048.10 5%2020 1161 2256 $114.16 $219.36 $2,150.51 5%2021 1219 2369 $119.86 $230.33 $2,258.03 5%2022 1280 2488 $125.86 $241.85 $2,370.94 5%2023 1344 2612 $132.15 $253.94 $2,489.48 5%2024 1411 2743 $138.76 $266.64 $2,613.96 5%2025 1481 2880 $145.70 $279.97 $2,744.65 5%
Georgia Economic Impact
Year Direct Employment
Total Employment
Impact
Total Direct Spending ($M)
Total Economic Impact ($M)
Total State Taxes ($K)
Percent Change Over
Previous Year
2015 28 55 $2.89 $5.38 $65.112016 57 111 $5.78 $10.76 $130.22 100%2017 85 166 $8.67 $16.14 $195.33 50%2018 90 174 $9.11 $16.94 $205.09 5%2019 94 183 $9.56 $17.79 $215.35 5%2020 99 192 $10.04 $18.68 $226.12 5%2021 104 202 $10.54 $19.61 $237.42 5%2022 109 212 $11.07 $20.59 $249.29 5%2023 114 222 $11.62 $21.62 $261.76 5%2024 120 234 $12.20 $22.70 $274.84 5%2025 126 245 $12.81 $23.84 $288.59 5%
Hawaii Economic Impact
Year Direct Employment
Total Employment
Impact
Total Direct Spending ($M)
Total Economic Impact ($M)
Total State Taxes ($K)
Percent Change Over
Previous Year
2015 26 50 $2.59 $4.82 $59.972016 51 99 $5.18 $9.64 $119.93 100%2017 77 149 $7.78 $14.47 $179.90 50%2018 80 156 $8.17 $15.19 $188.89 5%2019 84 164 $8.57 $15.95 $198.34 5%2020 89 172 $9.00 $16.75 $208.26 5%2021 93 181 $9.45 $17.58 $218.67 5%2022 98 190 $9.93 $18.46 $229.60 5%2023 103 199 $10.42 $19.39 $241.08 5%2024 108 209 $10.94 $20.36 $253.14 5%2025 113 220 $11.49 $21.37 $265.79 5%
Idaho Economic Impact
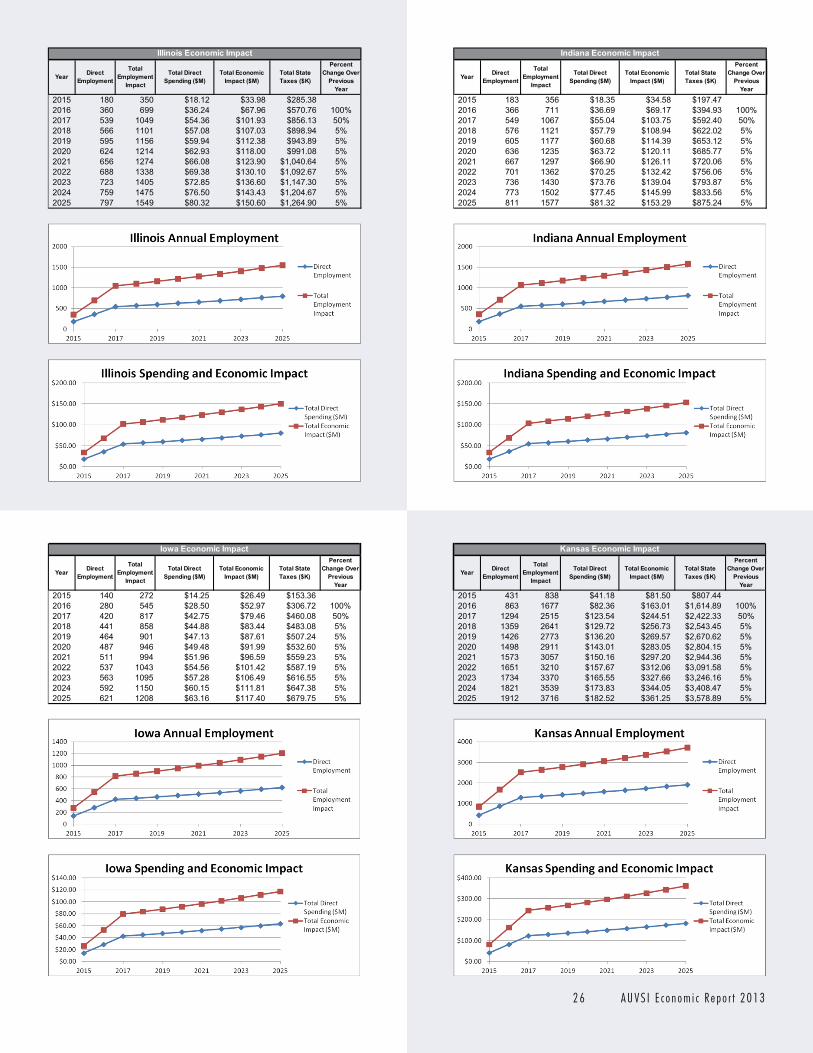
2 6 A U V S I E c o n o m i c R e p o r t 2 0 1 3
Year Direct Employment
Total Employment
Impact
Total Direct Spending ($M)
Total Economic Impact ($M)
Total State Taxes ($K)
Percent Change Over
Previous Year
2015 180 350 $18.12 $33.98 $285.382016 360 699 $36.24 $67.96 $570.76 100%2017 539 1049 $54.36 $101.93 $856.13 50%2018 566 1101 $57.08 $107.03 $898.94 5%2019 595 1156 $59.94 $112.38 $943.89 5%2020 624 1214 $62.93 $118.00 $991.08 5%2021 656 1274 $66.08 $123.90 $1,040.64 5%2022 688 1338 $69.38 $130.10 $1,092.67 5%2023 723 1405 $72.85 $136.60 $1,147.30 5%2024 759 1475 $76.50 $143.43 $1,204.67 5%2025 797 1549 $80.32 $150.60 $1,264.90 5%
Illinois Economic Impact
Year Direct Employment
Total Employment
Impact
Total Direct Spending ($M)
Total Economic Impact ($M)
Total State Taxes ($K)
Percent Change Over
Previous Year
2015 183 356 $18.35 $34.58 $197.472016 366 711 $36.69 $69.17 $394.93 100%2017 549 1067 $55.04 $103.75 $592.40 50%2018 576 1121 $57.79 $108.94 $622.02 5%2019 605 1177 $60.68 $114.39 $653.12 5%2020 636 1235 $63.72 $120.11 $685.77 5%2021 667 1297 $66.90 $126.11 $720.06 5%2022 701 1362 $70.25 $132.42 $756.06 5%2023 736 1430 $73.76 $139.04 $793.87 5%2024 773 1502 $77.45 $145.99 $833.56 5%2025 811 1577 $81.32 $153.29 $875.24 5%
Indiana Economic Impact
Year Direct Employment
Total Employment
Impact
Total Direct Spending ($M)
Total Economic Impact ($M)
Total State Taxes ($K)
Percent Change Over
Previous Year
2015 140 272 $14.25 $26.49 $153.362016 280 545 $28.50 $52.97 $306.72 100%2017 420 817 $42.75 $79.46 $460.08 50%2018 441 858 $44.88 $83.44 $483.08 5%2019 464 901 $47.13 $87.61 $507.24 5%2020 487 946 $49.48 $91.99 $532.60 5%2021 511 994 $51.96 $96.59 $559.23 5%2022 537 1043 $54.56 $101.42 $587.19 5%2023 563 1095 $57.28 $106.49 $616.55 5%2024 592 1150 $60.15 $111.81 $647.38 5%2025 621 1208 $63.16 $117.40 $679.75 5%
Iowa Economic Impact
Year Direct Employment
Total Employment
Impact
Total Direct Spending ($M)
Total Economic Impact ($M)
Total State Taxes ($K)
Percent Change Over
Previous Year
2015 431 838 $41.18 $81.50 $807.442016 863 1677 $82.36 $163.01 $1,614.89 100%2017 1294 2515 $123.54 $244.51 $2,422.33 50%2018 1359 2641 $129.72 $256.73 $2,543.45 5%2019 1426 2773 $136.20 $269.57 $2,670.62 5%2020 1498 2911 $143.01 $283.05 $2,804.15 5%2021 1573 3057 $150.16 $297.20 $2,944.36 5%2022 1651 3210 $157.67 $312.06 $3,091.58 5%2023 1734 3370 $165.55 $327.66 $3,246.16 5%2024 1821 3539 $173.83 $344.05 $3,408.47 5%2025 1912 3716 $182.52 $361.25 $3,578.89 5%
Kansas Economic Impact
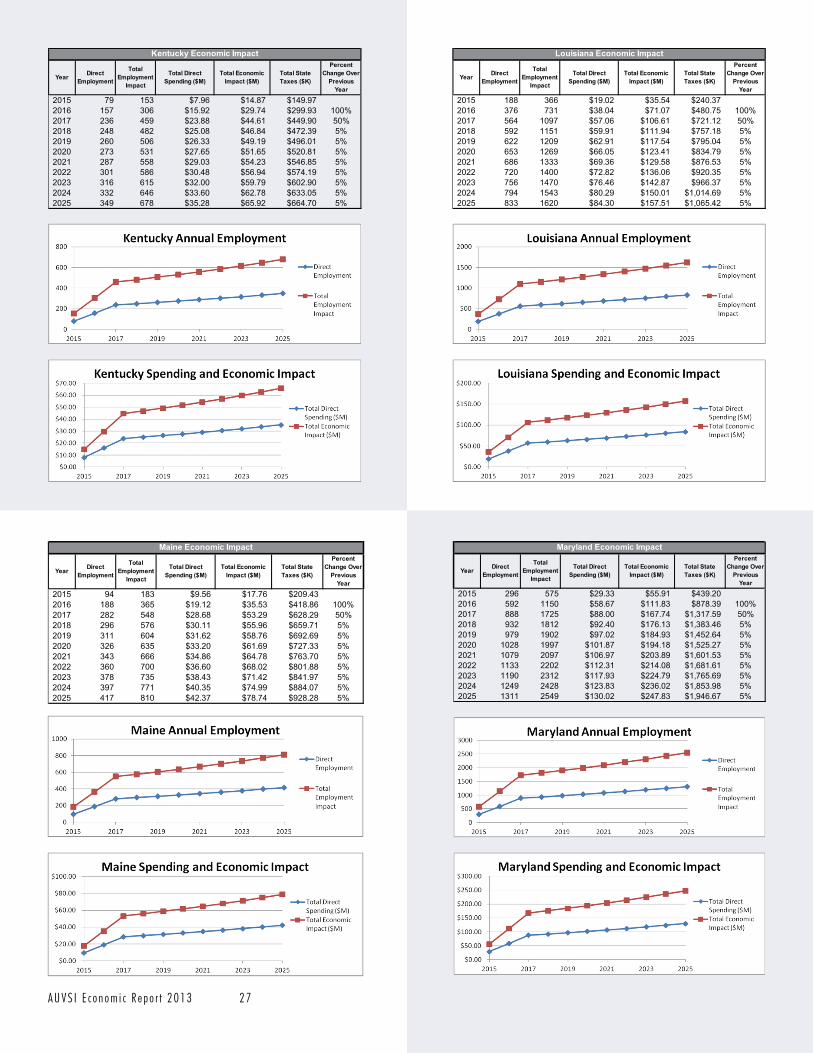
A U V S I E c o n o m i c R e p o r t 2 0 1 3 2 7
Year Direct Employment
Total Employment
Impact
Total Direct Spending ($M)
Total Economic Impact ($M)
Total State Taxes ($K)
Percent Change Over
Previous Year
2015 79 153 $7.96 $14.87 $149.972016 157 306 $15.92 $29.74 $299.93 100%2017 236 459 $23.88 $44.61 $449.90 50%2018 248 482 $25.08 $46.84 $472.39 5%2019 260 506 $26.33 $49.19 $496.01 5%2020 273 531 $27.65 $51.65 $520.81 5%2021 287 558 $29.03 $54.23 $546.85 5%2022 301 586 $30.48 $56.94 $574.19 5%2023 316 615 $32.00 $59.79 $602.90 5%2024 332 646 $33.60 $62.78 $633.05 5%2025 349 678 $35.28 $65.92 $664.70 5%
Kentucky Economic Impact
Year Direct Employment
Total Employment
Impact
Total Direct Spending ($M)
Total Economic Impact ($M)
Total State Taxes ($K)
Percent Change Over
Previous Year
2015 188 366 $19.02 $35.54 $240.372016 376 731 $38.04 $71.07 $480.75 100%2017 564 1097 $57.06 $106.61 $721.12 50%2018 592 1151 $59.91 $111.94 $757.18 5%2019 622 1209 $62.91 $117.54 $795.04 5%2020 653 1269 $66.05 $123.41 $834.79 5%2021 686 1333 $69.36 $129.58 $876.53 5%2022 720 1400 $72.82 $136.06 $920.35 5%2023 756 1470 $76.46 $142.87 $966.37 5%2024 794 1543 $80.29 $150.01 $1,014.69 5%2025 833 1620 $84.30 $157.51 $1,065.42 5%
Louisiana Economic Impact
Year Direct Employment
Total Employment
Impact
Total Direct Spending ($M)
Total Economic Impact ($M)
Total State Taxes ($K)
Percent Change Over
Previous Year
2015 94 183 $9.56 $17.76 $209.432016 188 365 $19.12 $35.53 $418.86 100%2017 282 548 $28.68 $53.29 $628.29 50%2018 296 576 $30.11 $55.96 $659.71 5%2019 311 604 $31.62 $58.76 $692.69 5%2020 326 635 $33.20 $61.69 $727.33 5%2021 343 666 $34.86 $64.78 $763.70 5%2022 360 700 $36.60 $68.02 $801.88 5%2023 378 735 $38.43 $71.42 $841.97 5%2024 397 771 $40.35 $74.99 $884.07 5%2025 417 810 $42.37 $78.74 $928.28 5%
Maine Economic Impact
Year Direct Employment
Total Employment
Impact
Total Direct Spending ($M)
Total Economic Impact ($M)
Total State Taxes ($K)
Percent Change Over
Previous Year
2015 296 575 $29.33 $55.91 $439.202016 592 1150 $58.67 $111.83 $878.39 100%2017 888 1725 $88.00 $167.74 $1,317.59 50%2018 932 1812 $92.40 $176.13 $1,383.46 5%2019 979 1902 $97.02 $184.93 $1,452.64 5%2020 1028 1997 $101.87 $194.18 $1,525.27 5%2021 1079 2097 $106.97 $203.89 $1,601.53 5%2022 1133 2202 $112.31 $214.08 $1,681.61 5%2023 1190 2312 $117.93 $224.79 $1,765.69 5%2024 1249 2428 $123.83 $236.02 $1,853.98 5%2025 1311 2549 $130.02 $247.83 $1,946.67 5%
Maryland Economic Impact
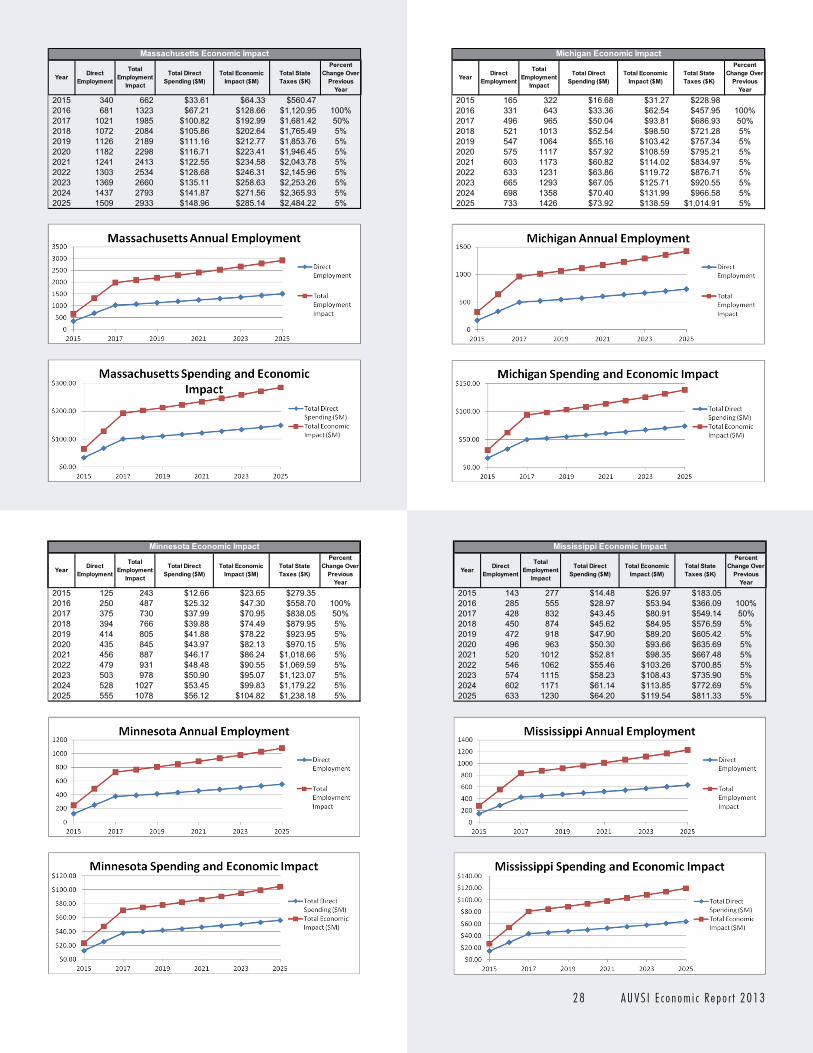
2 8 A U V S I E c o n o m i c R e p o r t 2 0 1 3
Year Direct Employment
Total Employment
Impact
Total Direct Spending ($M)
Total Economic Impact ($M)
Total State Taxes ($K)
Percent Change Over
Previous Year
2015 340 662 $33.61 $64.33 $560.472016 681 1323 $67.21 $128.66 $1,120.95 100%2017 1021 1985 $100.82 $192.99 $1,681.42 50%2018 1072 2084 $105.86 $202.64 $1,765.49 5%2019 1126 2189 $111.16 $212.77 $1,853.76 5%2020 1182 2298 $116.71 $223.41 $1,946.45 5%2021 1241 2413 $122.55 $234.58 $2,043.78 5%2022 1303 2534 $128.68 $246.31 $2,145.96 5%2023 1369 2660 $135.11 $258.63 $2,253.26 5%2024 1437 2793 $141.87 $271.56 $2,365.93 5%2025 1509 2933 $148.96 $285.14 $2,484.22 5%
Massachusetts Economic Impact
Year Direct Employment
Total Employment
Impact
Total Direct Spending ($M)
Total Economic Impact ($M)
Total State Taxes ($K)
Percent Change Over
Previous Year
2015 165 322 $16.68 $31.27 $228.982016 331 643 $33.36 $62.54 $457.95 100%2017 496 965 $50.04 $93.81 $686.93 50%2018 521 1013 $52.54 $98.50 $721.28 5%2019 547 1064 $55.16 $103.42 $757.34 5%2020 575 1117 $57.92 $108.59 $795.21 5%2021 603 1173 $60.82 $114.02 $834.97 5%2022 633 1231 $63.86 $119.72 $876.71 5%2023 665 1293 $67.05 $125.71 $920.55 5%2024 698 1358 $70.40 $131.99 $966.58 5%2025 733 1426 $73.92 $138.59 $1,014.91 5%
Michigan Economic Impact
Year Direct Employment
Total Employment
Impact
Total Direct Spending ($M)
Total Economic Impact ($M)
Total State Taxes ($K)
Percent Change Over
Previous Year
2015 125 243 $12.66 $23.65 $279.352016 250 487 $25.32 $47.30 $558.70 100%2017 375 730 $37.99 $70.95 $838.05 50%2018 394 766 $39.88 $74.49 $879.95 5%2019 414 805 $41.88 $78.22 $923.95 5%2020 435 845 $43.97 $82.13 $970.15 5%2021 456 887 $46.17 $86.24 $1,018.66 5%2022 479 931 $48.48 $90.55 $1,069.59 5%2023 503 978 $50.90 $95.07 $1,123.07 5%2024 528 1027 $53.45 $99.83 $1,179.22 5%2025 555 1078 $56.12 $104.82 $1,238.18 5%
Minnesota Economic Impact
Year Direct Employment
Total Employment
Impact
Total Direct Spending ($M)
Total Economic Impact ($M)
Total State Taxes ($K)
Percent Change Over
Previous Year
2015 143 277 $14.48 $26.97 $183.052016 285 555 $28.97 $53.94 $366.09 100%2017 428 832 $43.45 $80.91 $549.14 50%2018 450 874 $45.62 $84.95 $576.59 5%2019 472 918 $47.90 $89.20 $605.42 5%2020 496 963 $50.30 $93.66 $635.69 5%2021 520 1012 $52.81 $98.35 $667.48 5%2022 546 1062 $55.46 $103.26 $700.85 5%2023 574 1115 $58.23 $108.43 $735.90 5%2024 602 1171 $61.14 $113.85 $772.69 5%2025 633 1230 $64.20 $119.54 $811.33 5%
Mississippi Economic Impact
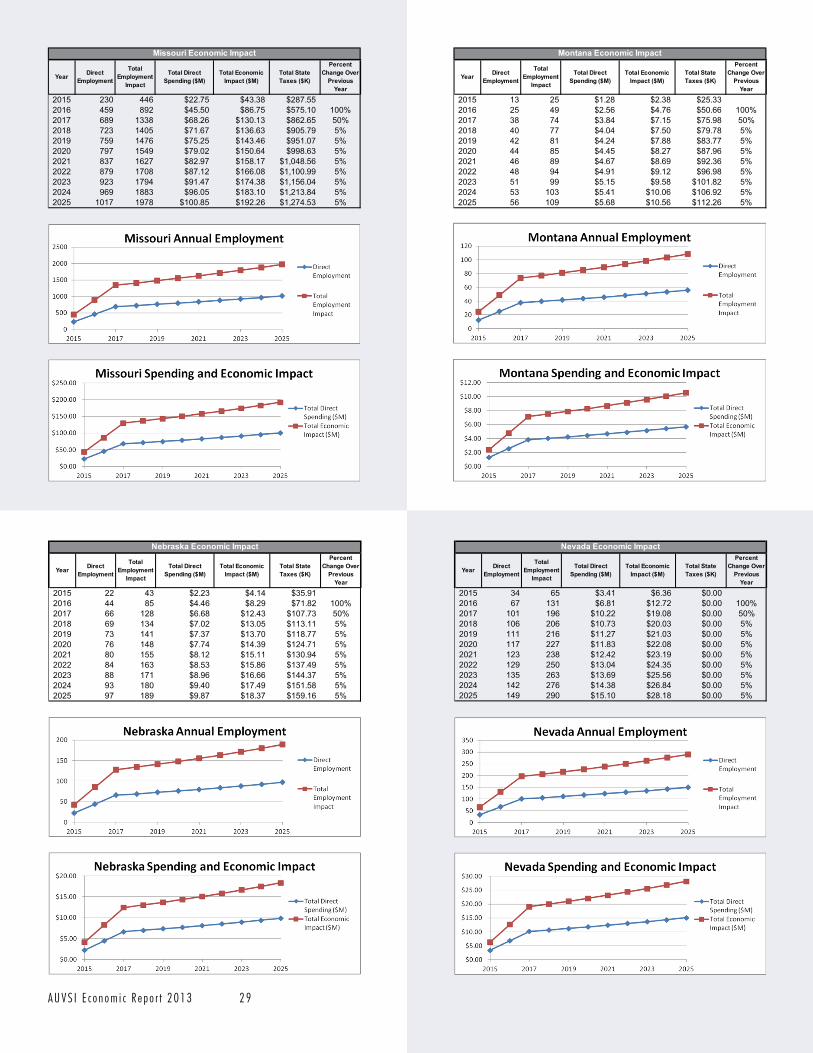
A U V S I E c o n o m i c R e p o r t 2 0 1 3 2 9
Year Direct Employment
Total Employment
Impact
Total Direct Spending ($M)
Total Economic Impact ($M)
Total State Taxes ($K)
Percent Change Over
Previous Year
2015 230 446 $22.75 $43.38 $287.552016 459 892 $45.50 $86.75 $575.10 100%2017 689 1338 $68.26 $130.13 $862.65 50%2018 723 1405 $71.67 $136.63 $905.79 5%2019 759 1476 $75.25 $143.46 $951.07 5%2020 797 1549 $79.02 $150.64 $998.63 5%2021 837 1627 $82.97 $158.17 $1,048.56 5%2022 879 1708 $87.12 $166.08 $1,100.99 5%2023 923 1794 $91.47 $174.38 $1,156.04 5%2024 969 1883 $96.05 $183.10 $1,213.84 5%2025 1017 1978 $100.85 $192.26 $1,274.53 5%
Missouri Economic Impact
Year Direct Employment
Total Employment
Impact
Total Direct Spending ($M)
Total Economic Impact ($M)
Total State Taxes ($K)
Percent Change Over
Previous Year
2015 13 25 $1.28 $2.38 $25.332016 25 49 $2.56 $4.76 $50.66 100%2017 38 74 $3.84 $7.15 $75.98 50%2018 40 77 $4.04 $7.50 $79.78 5%2019 42 81 $4.24 $7.88 $83.77 5%2020 44 85 $4.45 $8.27 $87.96 5%2021 46 89 $4.67 $8.69 $92.36 5%2022 48 94 $4.91 $9.12 $96.98 5%2023 51 99 $5.15 $9.58 $101.82 5%2024 53 103 $5.41 $10.06 $106.92 5%2025 56 109 $5.68 $10.56 $112.26 5%
Montana Economic Impact
Year Direct Employment
Total Employment
Impact
Total Direct Spending ($M)
Total Economic Impact ($M)
Total State Taxes ($K)
Percent Change Over
Previous Year
2015 22 43 $2.23 $4.14 $35.912016 44 85 $4.46 $8.29 $71.82 100%2017 66 128 $6.68 $12.43 $107.73 50%2018 69 134 $7.02 $13.05 $113.11 5%2019 73 141 $7.37 $13.70 $118.77 5%2020 76 148 $7.74 $14.39 $124.71 5%2021 80 155 $8.12 $15.11 $130.94 5%2022 84 163 $8.53 $15.86 $137.49 5%2023 88 171 $8.96 $16.66 $144.37 5%2024 93 180 $9.40 $17.49 $151.58 5%2025 97 189 $9.87 $18.37 $159.16 5%
Nebraska Economic Impact
Year Direct Employment
Total Employment
Impact
Total Direct Spending ($M)
Total Economic Impact ($M)
Total State Taxes ($K)
Percent Change Over
Previous Year
2015 34 65 $3.41 $6.36 $0.002016 67 131 $6.81 $12.72 $0.00 100%2017 101 196 $10.22 $19.08 $0.00 50%2018 106 206 $10.73 $20.03 $0.00 5%2019 111 216 $11.27 $21.03 $0.00 5%2020 117 227 $11.83 $22.08 $0.00 5%2021 123 238 $12.42 $23.19 $0.00 5%2022 129 250 $13.04 $24.35 $0.00 5%2023 135 263 $13.69 $25.56 $0.00 5%2024 142 276 $14.38 $26.84 $0.00 5%2025 149 290 $15.10 $28.18 $0.00 5%
Nevada Economic Impact

3 0 A U V S I E c o n o m i c R e p o r t 2 0 1 3
Year Direct Employment
Total Employment
Impact
Total Direct Spending ($M)
Total Economic Impact ($M)
Total State Taxes ($K)
Percent Change Over
Previous Year
2015 75 146 $7.65 $14.23 $0.002016 151 293 $15.29 $28.47 $0.00 100%2017 226 439 $22.94 $42.70 $0.00 50%2018 237 461 $24.09 $44.84 $0.00 5%2019 249 484 $25.29 $47.08 $0.00 5%2020 262 508 $26.56 $49.43 $0.00 5%2021 275 534 $27.89 $51.90 $0.00 5%2022 288 561 $29.28 $54.50 $0.00 5%2023 303 589 $30.75 $57.22 $0.00 5%2024 318 618 $32.28 $60.08 $0.00 5%2025 334 649 $33.90 $63.09 $0.00 5%
New Hampshire Economic Impact
Year Direct Employment
Total Employment
Impact
Total Direct Spending ($M)
Total Economic Impact ($M)
Total State Taxes ($K)
Percent Change Over
Previous Year
2015 232 451 $23.21 $43.84 $540.552016 464 902 $46.43 $87.67 $1,081.10 100%2017 696 1353 $69.64 $131.51 $1,621.65 50%2018 731 1420 $73.13 $138.08 $1,702.74 5%2019 767 1491 $76.78 $144.99 $1,787.87 5%2020 806 1566 $80.62 $152.24 $1,877.27 5%2021 846 1644 $84.65 $159.85 $1,971.13 5%2022 888 1726 $88.89 $167.84 $2,069.69 5%2023 933 1813 $93.33 $176.23 $2,173.17 5%2024 979 1903 $98.00 $185.05 $2,281.83 5%2025 1028 1999 $102.90 $194.30 $2,395.92 5%
New Jersey Economic Impact
Year Direct Employment
Total Employment
Impact
Total Direct Spending ($M)
Total Economic Impact ($M)
Total State Taxes ($K)
Percent Change Over
Previous Year
2015 89 173 $9.00 $16.78 $122.202016 178 345 $18.01 $33.57 $244.40 100%2017 266 518 $27.01 $50.35 $366.60 50%2018 280 544 $28.36 $52.87 $384.93 5%2019 294 571 $29.78 $55.51 $404.18 5%2020 308 600 $31.27 $58.29 $424.39 5%2021 324 630 $32.83 $61.20 $445.60 5%2022 340 661 $34.47 $64.26 $467.89 5%2023 357 694 $36.19 $67.47 $491.28 5%2024 375 729 $38.00 $70.85 $515.84 5%2025 394 765 $39.90 $74.39 $541.64 5%
New Mexico Economic Impact
Year Direct Employment
Total Employment
Impact
Total Direct Spending ($M)
Total Economic Impact ($M)
Total State Taxes ($K)
Percent Change Over
Previous Year
2015 390 759 $38.45 $73.76 $777.492016 781 1517 $76.89 $147.51 $1,554.98 100%2017 1171 2276 $115.34 $221.27 $2,332.46 50%2018 1229 2390 $121.11 $232.33 $2,449.09 5%2019 1291 2509 $127.16 $243.95 $2,571.54 5%2020 1355 2635 $133.52 $256.14 $2,700.12 5%2021 1423 2766 $140.20 $268.95 $2,835.12 5%2022 1494 2905 $147.21 $282.40 $2,976.88 5%2023 1569 3050 $154.57 $296.52 $3,125.73 5%2024 1648 3203 $162.29 $311.35 $3,282.01 5%2025 1730 3363 $170.41 $326.91 $3,446.11 5%
New York Economic Impact
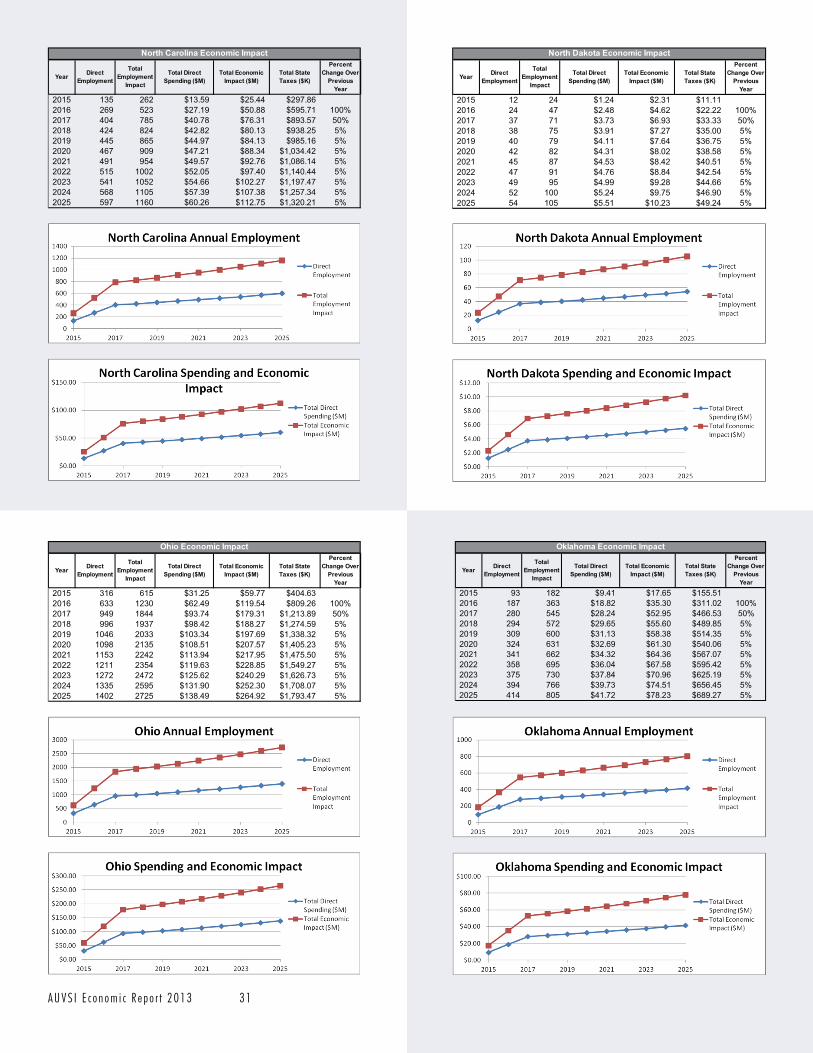
A U V S I E c o n o m i c R e p o r t 2 0 1 3 3 1
Year Direct Employment
Total Employment
Impact
Total Direct Spending ($M)
Total Economic Impact ($M)
Total State Taxes ($K)
Percent Change Over
Previous Year
2015 135 262 $13.59 $25.44 $297.862016 269 523 $27.19 $50.88 $595.71 100%2017 404 785 $40.78 $76.31 $893.57 50%2018 424 824 $42.82 $80.13 $938.25 5%2019 445 865 $44.97 $84.13 $985.16 5%2020 467 909 $47.21 $88.34 $1,034.42 5%2021 491 954 $49.57 $92.76 $1,086.14 5%2022 515 1002 $52.05 $97.40 $1,140.44 5%2023 541 1052 $54.66 $102.27 $1,197.47 5%2024 568 1105 $57.39 $107.38 $1,257.34 5%2025 597 1160 $60.26 $112.75 $1,320.21 5%
North Carolina Economic Impact
Year Direct Employment
Total Employment
Impact
Total Direct Spending ($M)
Total Economic Impact ($M)
Total State Taxes ($K)
Percent Change Over
Previous Year
2015 12 24 $1.24 $2.31 $11.112016 24 47 $2.48 $4.62 $22.22 100%2017 37 71 $3.73 $6.93 $33.33 50%2018 38 75 $3.91 $7.27 $35.00 5%2019 40 79 $4.11 $7.64 $36.75 5%2020 42 82 $4.31 $8.02 $38.58 5%2021 45 87 $4.53 $8.42 $40.51 5%2022 47 91 $4.76 $8.84 $42.54 5%2023 49 95 $4.99 $9.28 $44.66 5%2024 52 100 $5.24 $9.75 $46.90 5%2025 54 105 $5.51 $10.23 $49.24 5%
North Dakota Economic Impact
Year Direct Employment
Total Employment
Impact
Total Direct Spending ($M)
Total Economic Impact ($M)
Total State Taxes ($K)
Percent Change Over
Previous Year
2015 316 615 $31.25 $59.77 $404.632016 633 1230 $62.49 $119.54 $809.26 100%2017 949 1844 $93.74 $179.31 $1,213.89 50%2018 996 1937 $98.42 $188.27 $1,274.59 5%2019 1046 2033 $103.34 $197.69 $1,338.32 5%2020 1098 2135 $108.51 $207.57 $1,405.23 5%2021 1153 2242 $113.94 $217.95 $1,475.50 5%2022 1211 2354 $119.63 $228.85 $1,549.27 5%2023 1272 2472 $125.62 $240.29 $1,626.73 5%2024 1335 2595 $131.90 $252.30 $1,708.07 5%2025 1402 2725 $138.49 $264.92 $1,793.47 5%
Ohio Economic Impact
Year Direct Employment
Total Employment
Impact
Total Direct Spending ($M)
Total Economic Impact ($M)
Total State Taxes ($K)
Percent Change Over
Previous Year
2015 93 182 $9.41 $17.65 $155.512016 187 363 $18.82 $35.30 $311.02 100%2017 280 545 $28.24 $52.95 $466.53 50%2018 294 572 $29.65 $55.60 $489.85 5%2019 309 600 $31.13 $58.38 $514.35 5%2020 324 631 $32.69 $61.30 $540.06 5%2021 341 662 $34.32 $64.36 $567.07 5%2022 358 695 $36.04 $67.58 $595.42 5%2023 375 730 $37.84 $70.96 $625.19 5%2024 394 766 $39.73 $74.51 $656.45 5%2025 414 805 $41.72 $78.23 $689.27 5%
Oklahoma Economic Impact
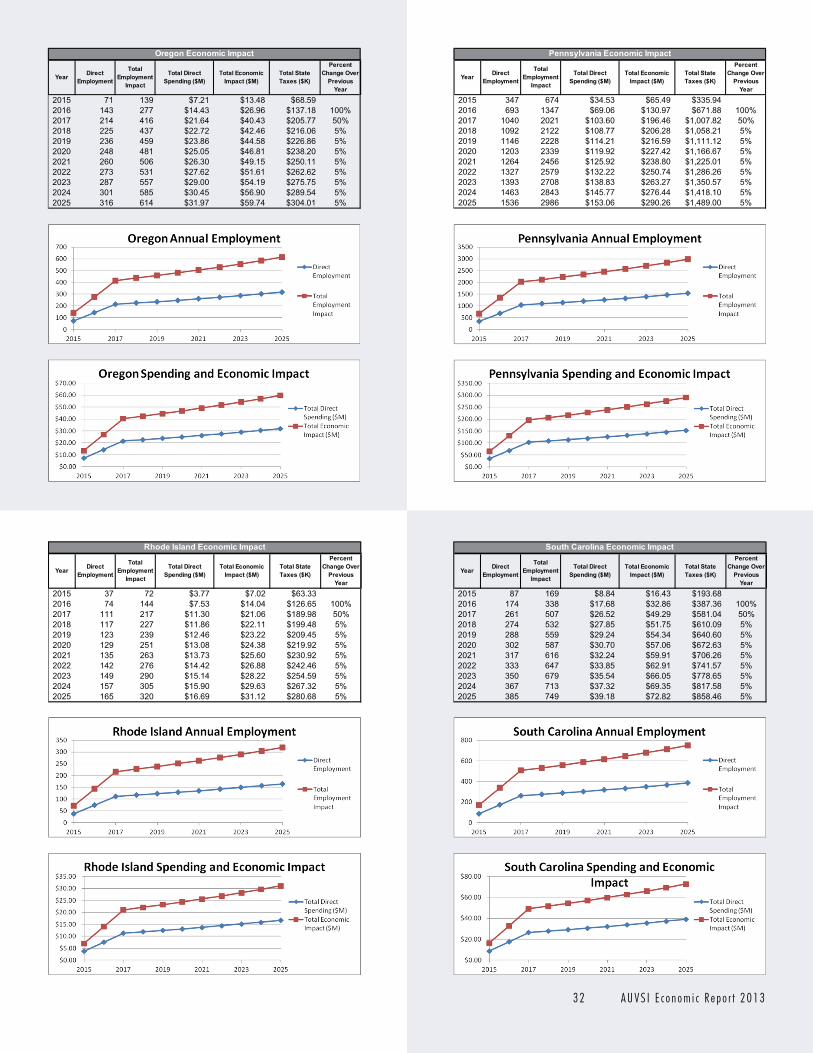
3 2 A U V S I E c o n o m i c R e p o r t 2 0 1 3
Year Direct Employment
Total Employment
Impact
Total Direct Spending ($M)
Total Economic Impact ($M)
Total State Taxes ($K)
Percent Change Over
Previous Year
2015 71 139 $7.21 $13.48 $68.592016 143 277 $14.43 $26.96 $137.18 100%2017 214 416 $21.64 $40.43 $205.77 50%2018 225 437 $22.72 $42.46 $216.06 5%2019 236 459 $23.86 $44.58 $226.86 5%2020 248 481 $25.05 $46.81 $238.20 5%2021 260 506 $26.30 $49.15 $250.11 5%2022 273 531 $27.62 $51.61 $262.62 5%2023 287 557 $29.00 $54.19 $275.75 5%2024 301 585 $30.45 $56.90 $289.54 5%2025 316 614 $31.97 $59.74 $304.01 5%
Oregon Economic Impact
Year Direct Employment
Total Employment
Impact
Total Direct Spending ($M)
Total Economic Impact ($M)
Total State Taxes ($K)
Percent Change Over
Previous Year
2015 347 674 $34.53 $65.49 $335.942016 693 1347 $69.06 $130.97 $671.88 100%2017 1040 2021 $103.60 $196.46 $1,007.82 50%2018 1092 2122 $108.77 $206.28 $1,058.21 5%2019 1146 2228 $114.21 $216.59 $1,111.12 5%2020 1203 2339 $119.92 $227.42 $1,166.67 5%2021 1264 2456 $125.92 $238.80 $1,225.01 5%2022 1327 2579 $132.22 $250.74 $1,286.26 5%2023 1393 2708 $138.83 $263.27 $1,350.57 5%2024 1463 2843 $145.77 $276.44 $1,418.10 5%2025 1536 2986 $153.06 $290.26 $1,489.00 5%
Pennsylvania Economic Impact
Year Direct Employment
Total Employment
Impact
Total Direct Spending ($M)
Total Economic Impact ($M)
Total State Taxes ($K)
Percent Change Over
Previous Year
2015 37 72 $3.77 $7.02 $63.332016 74 144 $7.53 $14.04 $126.65 100%2017 111 217 $11.30 $21.06 $189.98 50%2018 117 227 $11.86 $22.11 $199.48 5%2019 123 239 $12.46 $23.22 $209.45 5%2020 129 251 $13.08 $24.38 $219.92 5%2021 135 263 $13.73 $25.60 $230.92 5%2022 142 276 $14.42 $26.88 $242.46 5%2023 149 290 $15.14 $28.22 $254.59 5%2024 157 305 $15.90 $29.63 $267.32 5%2025 165 320 $16.69 $31.12 $280.68 5%
Rhode Island Economic Impact
Year Direct Employment
Total Employment
Impact
Total Direct Spending ($M)
Total Economic Impact ($M)
Total State Taxes ($K)
Percent Change Over
Previous Year
2015 87 169 $8.84 $16.43 $193.682016 174 338 $17.68 $32.86 $387.36 100%2017 261 507 $26.52 $49.29 $581.04 50%2018 274 532 $27.85 $51.75 $610.09 5%2019 288 559 $29.24 $54.34 $640.60 5%2020 302 587 $30.70 $57.06 $672.63 5%2021 317 616 $32.24 $59.91 $706.26 5%2022 333 647 $33.85 $62.91 $741.57 5%2023 350 679 $35.54 $66.05 $778.65 5%2024 367 713 $37.32 $69.35 $817.58 5%2025 385 749 $39.18 $72.82 $858.46 5%
South Carolina Economic Impact
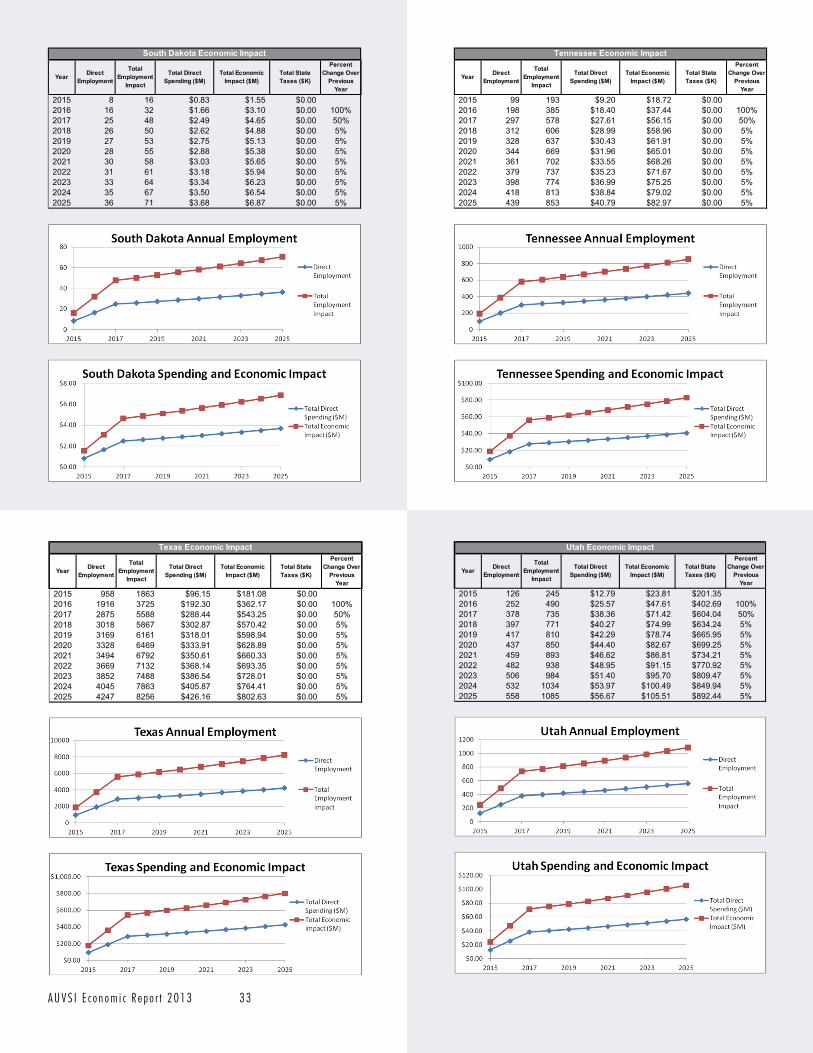
A U V S I E c o n o m i c R e p o r t 2 0 1 3 3 3
Year Direct Employment
Total Employment
Impact
Total Direct Spending ($M)
Total Economic Impact ($M)
Total State Taxes ($K)
Percent Change Over
Previous Year
2015 8 16 $0.83 $1.55 $0.002016 16 32 $1.66 $3.10 $0.00 100%2017 25 48 $2.49 $4.65 $0.00 50%2018 26 50 $2.62 $4.88 $0.00 5%2019 27 53 $2.75 $5.13 $0.00 5%2020 28 55 $2.88 $5.38 $0.00 5%2021 30 58 $3.03 $5.65 $0.00 5%2022 31 61 $3.18 $5.94 $0.00 5%2023 33 64 $3.34 $6.23 $0.00 5%2024 35 67 $3.50 $6.54 $0.00 5%2025 36 71 $3.68 $6.87 $0.00 5%
South Dakota Economic Impact
Year Direct Employment
Total Employment
Impact
Total Direct Spending ($M)
Total Economic Impact ($M)
Total State Taxes ($K)
Percent Change Over
Previous Year
2015 99 193 $9.20 $18.72 $0.002016 198 385 $18.40 $37.44 $0.00 100%2017 297 578 $27.61 $56.15 $0.00 50%2018 312 606 $28.99 $58.96 $0.00 5%2019 328 637 $30.43 $61.91 $0.00 5%2020 344 669 $31.96 $65.01 $0.00 5%2021 361 702 $33.55 $68.26 $0.00 5%2022 379 737 $35.23 $71.67 $0.00 5%2023 398 774 $36.99 $75.25 $0.00 5%2024 418 813 $38.84 $79.02 $0.00 5%2025 439 853 $40.79 $82.97 $0.00 5%
Tennessee Economic Impact
Year Direct Employment
Total Employment
Impact
Total Direct Spending ($M)
Total Economic Impact ($M)
Total State Taxes ($K)
Percent Change Over
Previous Year
2015 958 1863 $96.15 $181.08 $0.002016 1916 3725 $192.30 $362.17 $0.00 100%2017 2875 5588 $288.44 $543.25 $0.00 50%2018 3018 5867 $302.87 $570.42 $0.00 5%2019 3169 6161 $318.01 $598.94 $0.00 5%2020 3328 6469 $333.91 $628.89 $0.00 5%2021 3494 6792 $350.61 $660.33 $0.00 5%2022 3669 7132 $368.14 $693.35 $0.00 5%2023 3852 7488 $386.54 $728.01 $0.00 5%2024 4045 7863 $405.87 $764.41 $0.00 5%2025 4247 8256 $426.16 $802.63 $0.00 5%
Texas Economic Impact
Year Direct Employment
Total Employment
Impact
Total Direct Spending ($M)
Total Economic Impact ($M)
Total State Taxes ($K)
Percent Change Over
Previous Year
2015 126 245 $12.79 $23.81 $201.352016 252 490 $25.57 $47.61 $402.69 100%2017 378 735 $38.36 $71.42 $604.04 50%2018 397 771 $40.27 $74.99 $634.24 5%2019 417 810 $42.29 $78.74 $665.95 5%2020 437 850 $44.40 $82.67 $699.25 5%2021 459 893 $46.62 $86.81 $734.21 5%2022 482 938 $48.95 $91.15 $770.92 5%2023 506 984 $51.40 $95.70 $809.47 5%2024 532 1034 $53.97 $100.49 $849.94 5%2025 558 1085 $56.67 $105.51 $892.44 5%
Utah Economic Impact
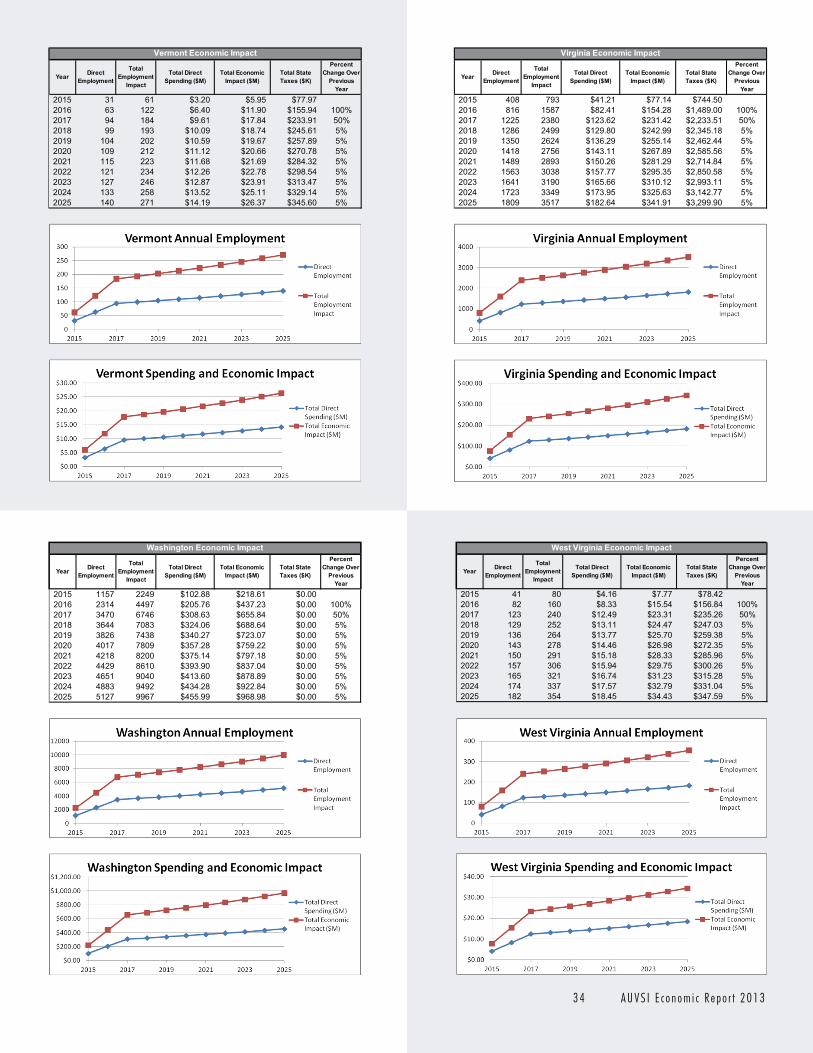
3 4 A U V S I E c o n o m i c R e p o r t 2 0 1 3
Year Direct Employment
Total Employment
Impact
Total Direct Spending ($M)
Total Economic Impact ($M)
Total State Taxes ($K)
Percent Change Over
Previous Year
2015 31 61 $3.20 $5.95 $77.972016 63 122 $6.40 $11.90 $155.94 100%2017 94 184 $9.61 $17.84 $233.91 50%2018 99 193 $10.09 $18.74 $245.61 5%2019 104 202 $10.59 $19.67 $257.89 5%2020 109 212 $11.12 $20.66 $270.78 5%2021 115 223 $11.68 $21.69 $284.32 5%2022 121 234 $12.26 $22.78 $298.54 5%2023 127 246 $12.87 $23.91 $313.47 5%2024 133 258 $13.52 $25.11 $329.14 5%2025 140 271 $14.19 $26.37 $345.60 5%
Vermont Economic Impact
Year Direct Employment
Total Employment
Impact
Total Direct Spending ($M)
Total Economic Impact ($M)
Total State Taxes ($K)
Percent Change Over
Previous Year
2015 408 793 $41.21 $77.14 $744.502016 816 1587 $82.41 $154.28 $1,489.00 100%2017 1225 2380 $123.62 $231.42 $2,233.51 50%2018 1286 2499 $129.80 $242.99 $2,345.18 5%2019 1350 2624 $136.29 $255.14 $2,462.44 5%2020 1418 2756 $143.11 $267.89 $2,585.56 5%2021 1489 2893 $150.26 $281.29 $2,714.84 5%2022 1563 3038 $157.77 $295.35 $2,850.58 5%2023 1641 3190 $165.66 $310.12 $2,993.11 5%2024 1723 3349 $173.95 $325.63 $3,142.77 5%2025 1809 3517 $182.64 $341.91 $3,299.90 5%
Virginia Economic Impact
Year Direct Employment
Total Employment
Impact
Total Direct Spending ($M)
Total Economic Impact ($M)
Total State Taxes ($K)
Percent Change Over
Previous Year
2015 1157 2249 $102.88 $218.61 $0.002016 2314 4497 $205.76 $437.23 $0.00 100%2017 3470 6746 $308.63 $655.84 $0.00 50%2018 3644 7083 $324.06 $688.64 $0.00 5%2019 3826 7438 $340.27 $723.07 $0.00 5%2020 4017 7809 $357.28 $759.22 $0.00 5%2021 4218 8200 $375.14 $797.18 $0.00 5%2022 4429 8610 $393.90 $837.04 $0.00 5%2023 4651 9040 $413.60 $878.89 $0.00 5%2024 4883 9492 $434.28 $922.84 $0.00 5%2025 5127 9967 $455.99 $968.98 $0.00 5%
Washington Economic Impact
Year Direct Employment
Total Employment
Impact
Total Direct Spending ($M)
Total Economic Impact ($M)
Total State Taxes ($K)
Percent Change Over
Previous Year
2015 41 80 $4.16 $7.77 $78.422016 82 160 $8.33 $15.54 $156.84 100%2017 123 240 $12.49 $23.31 $235.26 50%2018 129 252 $13.11 $24.47 $247.03 5%2019 136 264 $13.77 $25.70 $259.38 5%2020 143 278 $14.46 $26.98 $272.35 5%2021 150 291 $15.18 $28.33 $285.96 5%2022 157 306 $15.94 $29.75 $300.26 5%2023 165 321 $16.74 $31.23 $315.28 5%2024 174 337 $17.57 $32.79 $331.04 5%2025 182 354 $18.45 $34.43 $347.59 5%
West Virginia Economic Impact
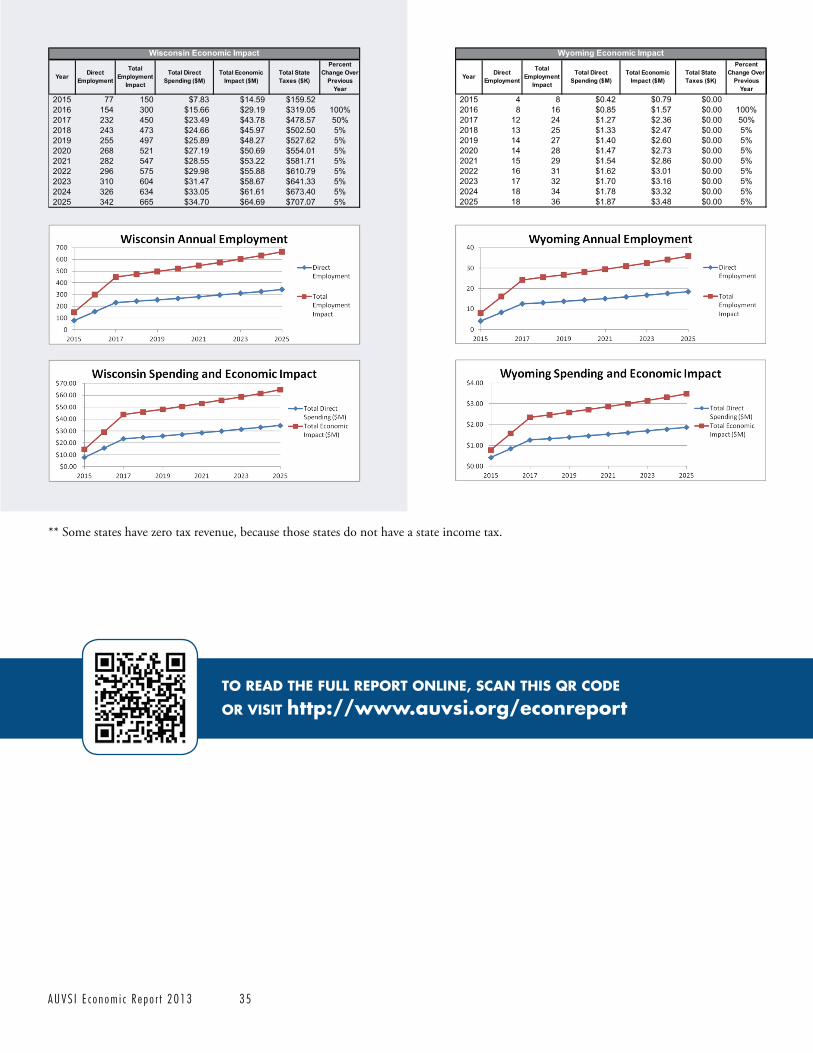
A U V S I E c o n o m i c R e p o r t 2 0 1 3 3 5
Year Direct Employment
Total Employment
Impact
Total Direct Spending ($M)
Total Economic Impact ($M)
Total State Taxes ($K)
Percent Change Over
Previous Year
2015 77 150 $7.83 $14.59 $159.522016 154 300 $15.66 $29.19 $319.05 100%2017 232 450 $23.49 $43.78 $478.57 50%2018 243 473 $24.66 $45.97 $502.50 5%2019 255 497 $25.89 $48.27 $527.62 5%2020 268 521 $27.19 $50.69 $554.01 5%2021 282 547 $28.55 $53.22 $581.71 5%2022 296 575 $29.98 $55.88 $610.79 5%2023 310 604 $31.47 $58.67 $641.33 5%2024 326 634 $33.05 $61.61 $673.40 5%2025 342 665 $34.70 $64.69 $707.07 5%
Wisconsin Economic Impact
Year Direct Employment
Total Employment
Impact
Total Direct Spending ($M)
Total Economic Impact ($M)
Total State Taxes ($K)
Percent Change Over
Previous Year
2015 4 8 $0.42 $0.79 $0.002016 8 16 $0.85 $1.57 $0.00 100%2017 12 24 $1.27 $2.36 $0.00 50%2018 13 25 $1.33 $2.47 $0.00 5%2019 14 27 $1.40 $2.60 $0.00 5%2020 14 28 $1.47 $2.73 $0.00 5%2021 15 29 $1.54 $2.86 $0.00 5%2022 16 31 $1.62 $3.01 $0.00 5%2023 17 32 $1.70 $3.16 $0.00 5%2024 18 34 $1.78 $3.32 $0.00 5%2025 18 36 $1.87 $3.48 $0.00 5%
Wyoming Economic Impact
** Some states have zero tax revenue, because those states do not have a state income tax.
TO READ THE FULL REPORT ONLINE, SCAN THIS QR CODE
OR VISIT http://www.auvsi.org/econreport

3 6 A U V S I E c o n o m i c R e p o r t 2 0 1 3
References
A U V S I E c o n o m i c R e p o r t 2 0 1 3 3 7
Anders, GC. 1992. The changing role of the public university in local economic development. Economic Development Review 10.
Arik, Murat, and Christian Nsiah. 2004. Measuring the Economic Impact of Middle Tennessee State University. Business and Economic Research Center, Jennings A. Jones College of Business, Middle Tennessee State University.
A Study of the Economic Impact and Benefits of UC San Diego FY 2006-07. Accessed on January 15, 2011, http://ucsdnews.ucsd.edu/economicimpact/pdf/UC-San-Diego-Economic-Impact-Report-July-10-2008.pdf
Blackwell, Melanie, Steven Cobb, and David Weinberg. 2002. The economic impact of educational institutions: Issues and methodology. Economic Development Quarterly 16, No. 1: 88-95.
Bluestone, B. 1993. UMASS/Boston: An Economic Impact Analysis. Boston, MA: John W. McCormack Institute of Public Affairs, the University of Massachusetts.
Constantinides, Efthymios. 2002. The 4S web-marketing mix model. Electronic Commerce Research and Applications 1, no. 1: 57-76.
Contributing to the Economic Health of Connecticut: The University of Connecticut 2009. Accessed on January 15, 2011, http://www.uconn.edu/pdf/UCONNOMY.pdf.
Cornell University Economic Impact on New York State. Accessed on January 15, 2011, http://www.cornell.edu/land-grant/assets/pdfs/EconomicImpactOnNYS.pdf.
Davis, H Craig. 1990. Regional Economic Impact Analysis and Project Evaluation. UBC Press.
Davy, J. 1998. Electronic Commerce: Is Going Online the Right Road for Your Company? Managing Office Technology: pp. 20–23.
De Pillis, EG, and LG De Pillis. 2001. The long-term impact of university budget cuts: A mathematical model. Mathematical and Computer Modelling 33, no. 8: 851-876.
Economic Impact of Marshall County Hospital on Marshall County, Kentucky. Accessed on Feb 1, 2013, pubs/04aug_marshall_impact.pdf.
Economic Impact Analysis of the University of Southern California Annual Operations FY 2005-2006. Accessed on January 15, 2011, http://www.usc.edu/private/factbook/USC_EconomicImpact_2006.pdf
Bangsund, Dean A, F Larry Leistritz, and Randal C Coon. 2010. Economic Impact of the North Dakota University System in 2009. Department of Agribusiness and Applied Economics, North Dakota State University.
Evans, Philip, and Thomas S Wurster. 1999. Getting real about virtual commerce. Harvard Business Review 77: 84-98.
Futhey, Carol. 2011. Mesa State College Regional Economic Impact 2011. Accessed on January 15, 2011, http://www.coloradomesa.edu/president/documents/2011_ImpactStudy_web.pdf.
Hodges, A.W., W. D. Mulkey, & T. J. Stevens. 2006. Economic Impacts of the University of Florida and Affiliated Organization in 2005-06. Accessed on January 15, 2011, http://edis.ifas.ufl.edu/pdffiles/FE/FE69900.pdf.
Investing in Innovation: Harvard University’s Impact on The Economy of the Boston Area 2009. Accessed on January 15, 2011, http://community.harvard.edu/files/documents/HarvardSum-mary_Jan14-09.pdf.
Marketing Management: Analysis, Planning, Implementation, and Control. Prentice Hall.
Sealey, Peter. 1999. How E-commerce will trump brand manage-ment. Harvard Business Review 77: 171-176.
Seninger, Stephen F. 1997. Town and Gown: the EconomicPartnership between the University of Montana and Missoula. Montana Business Quarterly 35, no. 4.
Siegfried, John J, Allen R Sanderson, and Peter McHenry. 2007. The economic impact of colleges and universities. Economics of Education Review 26, no. 5: 546-558.
Susman, N. 1990. The role of the technical university in area economic development: A review and appraisal. Economic Development Review 8: 25-29.
Users Guide, Analysis Guide, Data Guide IMPLAN Professional Version 2.0. IMPLAN Group Inc.

3 8 A U V S I E c o n o m i c R e p o r t 2 0 1 3
MISSIONThe mission of AUVSI is to advance the unmanned systems and robotics community through education, advocacy and leadership.
MEMBERSAUVSI represents more than 7,000 individual members and more than 600 corporate members from 60+ allied countries involved in the fields of government, industry and academia. AUVSI members work in the defense, civil and commercial markets.
AUVSI ACTIVITIESEVENTS
–More than 8,000 attendees and 600+ exhibitors from more than 40 countries and an average annual growth rate of 20% make this the leading event for the global unmanned systems and robotics market-place. www.auvsishow.org
– Providing the latest information on government and industry programs for ground, air and maritime systems, this annual event is one of the most important to the unmanned systems community. This is one event where business happens.
– AUVSI hosts meetings and events world-wide, providing education and networking opportunities for key in-dustry leaders, including AUVSI’s Driverless Car Summit.
ADVOCACY AUVSI works with its membership to shape policy by advocating on behalf of the unmanned systems industry, monitoring legislation and assessing the impact of the industry. AUVSI plays a key role in addressing critical industry issues, such as National Airspace Access, Frequency Spectrum (GPS), NextGen/SESAR, Coalition Building and First Responder Grants. AUVSI works to influence legislation, including the FAA Reauthorization, Transportation Bill, DOD Re-authorization and Homeland Security Reauthorization.
EDUCATION CAMPAIGNAUVSI is working hard to change the public perception of the un-manned systems and robotics industry through promotion of our members and the endless applications and benefits of their systems. Part of this campaign includes a public website:www.increasinghumanpotential.org.
PUBLICATIONSPrint - Unmanned Systems magazine – A monthly magazine pro-
viding current industry news, trends and emerging developments; Unmanned Systems: Mission Critical – A quarterly supplement dedi-cated to unmanned systems sectors that, once tapped, will change the way the world works.
– AUVSI’s Unmanned Systems eBrief – A weekly elec-tronic newsletter that includes the latest global industry and associa-tion news and information; Flight Unmanned – A biweekly elec-tronic publication of the association for AUVSI members.
ONLINE CAREER CENTER A leading resource for job-seekers and employers in the unmanned systems and robotics market.
KNOWLEDGE RESOURCESThrough its knowledge services AUVSI promotes vision, intellectual
Vault provides AUVSI members a one-stop shop for all AUVSI event proceedings and publications.
AUVSI FOUNDATION The AUVSI Foundation is a tax-exempt 501(c)3 public charity es-tablished to support educational initiatives such as AUVSI’s Youth Education Program, discussion groups, forums and other programs. The foundation has provided more than $500,000 to educational programs worldwide. Each year, the AUVSI Foundation hosts and sponsors competitions to challenge students to design, build and de-ploy autonomous air, ground and maritime systems.
AUVSI FAST FACTS
CONTACT US
2700 SOUTH QUINCY STREETSUITE 400ARLINGTON VA 22206 USA
+1 703 845 [email protected] WWW.AUVSI.ORG