Embed Size (px)
Citation preview
MADISON CONSULTING GROUP, INC.
TEXAS DEPARTMENT OF INSURANCE DIVISION OF WORKERS’ COMPENSATION
ACTUARIAL ANALYSIS OF THE TEXAS WORKERS’ COMPENSATION
SUBSEQUENT INJURY FUND AS OF AUGUST 31, 2018
200 N. Second Street • Madison, GA 30650 14 Clover Lane • Newtown Square, PA 19073 706-342-7750 www.madisoninc.com Fax: 706-342-7775
November 12, 2018
Mr. Blaise Gerstenlauer Subsequent Injury Fund Specialist/Team Lead Texas Department of Insurance Division of Workers’ Compensation 7551 Metro Center Drive Suite 100 Austin, TX 78744 Re: Actuarial Analysis of the Texas Workers’ Compensation Subsequent Injury Fund as of August 31, 2018. Dear Mr. Gerstenlauer:
Madison Consulting Group, Inc. is pleased to enclose a copy of the above captioned report. Please note that this report replaces the Actuarial Analysis of the Texas Workers’ Compensation Subsequent Injury Fund as of August 31, 2018 sent on November 2, 2018. We have enjoyed working on this project and hope you find it satisfactory. Please call if you have any questions or comments. Sincerely, Mark Crawshaw, Ph.D., FCAS, MAAA MC/nc Attachment
MADISON CONSULTING GROUP, INC.
TEXAS DEPARTMENT OF INSURANCE
DIVISION OF WORKERS’ COMPENSATION ACTUARIAL ANALYSIS OF
THE TEXAS WORKERS’ COMPENSATION SUBSEQUENT INJURY FUND
AS OF AUGUST 31, 2018 INTRODUCTION At the request of management of the Texas Department of Insurance,
Division of Workers' Compensation Insurance (DWC), Madison Consulting Group
(MCG) has performed an actuarial analysis of the Subsequent Injury Fund (SIF) as of
August 31, 2018. The purpose of the review was to analyze the solvency of the SIF
based on past, present, and future trends of income flow and to project future funding
requirements for the SIF through fiscal year 2023, including assessments (if any) on
insurance carriers to meet the SIF's obligations under the Texas Workers' Compensation
Act. This report describes our analysis and conclusions.
ACKNOWLEDGEMENT OF QUALIFICATION
This report was prepared under the direction of Mark Crawshaw, Ph.D.,
FCAS, MAAA. Dr. Crawshaw is a member of the American Academy of Actuaries and
meets the Qualification Standards of the American Academy of Actuaries to render the
actuarial opinions contained herein.
3
MADISON CONSULTING GROUP, INC.
DISTRIBUTION AND USE This report has been prepared for the internal use of management at DWC
to assist in their operation of the SIF. It is our understanding that this report will become
a public document. It is requested that all distributions of this report be in its entirety
including the attached exhibits and appendices.
ANALYSIS Overview of the SIF The SIF was created by the State Legislature in 1947 to facilitate the
employment of handicapped persons, including many disabled WWII veterans. The
original purpose of the SIF was to protect disabled workers against employment
discrimination that might otherwise have arisen as an unintended consequence of placing
the financial responsibility for work related disability on each employer through the
workers’ compensation system. As originally conceived, if an employee who had
previously lost a leg, eye, or hand should lose a second leg, eye, or hand in a work-related
accident, then the employer or insurance carrier would be liable only for the
compensation payable for the second injury. The SIF would be liable for the remainder
of any total permanent disability award to the injured employee.
Since its inception, the responsibilities of the SIF have expanded beyond
its original purpose. In addition to its responsibility for payments in events of second
injuries, the SIF is now responsible for claims not related to second injuries as follows:
To reimburse carriers for payments made in accordance with DWC decisions/orders that are later reversed or modified resulting in an overpayment of a claim.
4
MADISON CONSULTING GROUP, INC.
To reimburse carriers for certain benefits that were paid due to a designated doctor opinion that is later reversed or modified resulting in an overpayment of a claim. (This is a change contained in SB 1169 and effective September 1, 2007).
To reimburse carriers in situations where multiple employment causes an increase in benefits. SB 1169 extended the scope of this item to include reimbursement of death benefits in situations of multiple employments in addition to the previously authorized reimbursement of income benefits.
To reimburse carriers for pharmaceutical costs incurred on claims that are ultimately determined to be non-compensable. Recently adopted pharmacy formulary rule (28 TAC §134.550) extended the scope of this item to include reimbursement of drugs received through a medical interlocutory order that is later reversed or modified resulting in an overpayment of a claim.
SIF’s Accounting Conventions
The SIF operates on a fiscal year and appropriation year basis. Fiscal year
2018 refers to transactions made during the period September 1, 2017 through August 31,
2018. Appropriation year refers to all transactions assigned to funds appropriated for the
period September 1, 2017 through August 31, 2018 and may include transactions made
outside of this period. For example, payment orders signed no later than August 31, 2018
(last day of appropriation year 2018) may in fact be paid (with appropriation year 2018
funds) during fiscal year 2019. The reports SIF provided to us included amounts
compiled from the various systems used by SIF to track payments. In some instances,
these systems have differences in how they code payments to fiscal or appropriation year.
In our analysis, we have taken the amounts from the USAS system as being definitive1.
Prior to September 1, 2005, the SIF was operated by the Texas Workers’
Compensation Commission (TWCC). During this period, TWCC produced a separate
financial statement for the SIF. Effective September 1, 2005, TWCC became part of the
1 In the course of this analysis, we worked with SIF staff to reconcile the various reports to the financial statements for 2011 and subsequent. In some instances, this resulted in small revisions to amounts on Exhibit I as compared to amounts in our previous reports.
5
MADISON CONSULTING GROUP, INC.
Texas Department of Insurance. At this time, the financial statement for the SIF changed
and became part of the Annual Financial Report of the Texas Department of Insurance
(TDI).
The financial reports that are routinely produced by TDI include an
accounting of revenue and expenses of SIF on essentially a cash basis for the fiscal year
(see Exhibit I). From an actuarial perspective, to evaluate the financial condition of the
SIF, it is necessary to expand these financial reports to include estimates of all accrued
revenue and expenses. To this end, Sheet 1 of Exhibit II of this report provides a
summary of the balance sheet of the SIF with full accruals for all revenues and expenses.
In preparing Sheet 1 of Exhibit II, we have attempted to account for all revenue and
expenses of the SIF associated with all claims occurring through the accounting date,
regardless of when SIF will make the cash transaction or when SIF becomes aware of the
underlying claim that results in the revenue or expense.
The SIF's Revenue
The SIF is currently funded solely by death benefit payments from
insurance carriers in situations where a compensable death occurs and there is no eligible
beneficiary (or the claim for death benefits is not made in a timely manner). Prior to July
2003, the SIF was designated a special fund in the State Treasury and was credited
interest on the account funds. However, since that time, interest has not accumulated to
the benefit of the SIF.2 In the event that this funding is not enough, the SIF may assess
insurance carriers.
2 It is noted that the SIF's earlier financial statements show small amounts of income in addition to death benefits described above. We understand these items relate to reversals of items that have previously been expensed rather than external sources of income.
6

MADISON CONSULTING GROUP, INC.
Effective September 1, 2007, HB 724 expanded the definition of eligible
beneficiaries to include “eligible parent.” Effective September 1, 2009, HB 1058
clarified and somewhat expanded upon the previous legislation. These changes had the
practical effect of reducing revenue to SIF.
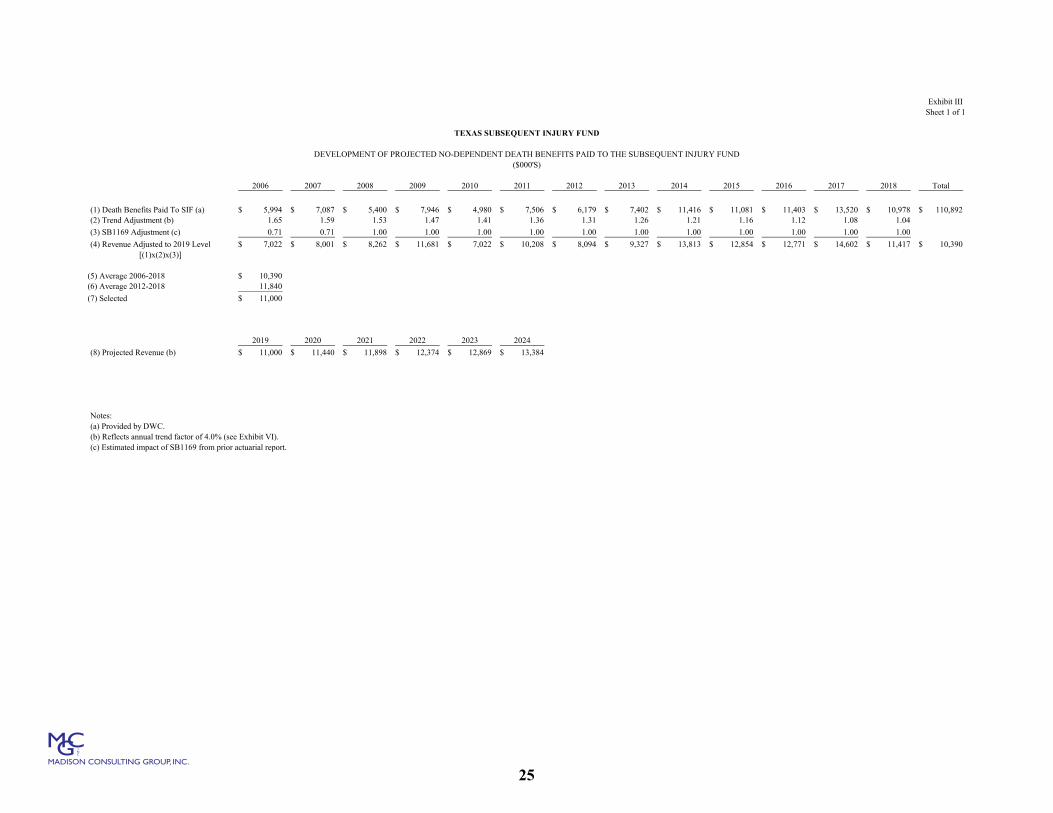
Projection of Revenue
Exhibit III summarizes the analysis of revenue to the SIF from no-
dependent death cases. We projected future revenue (cash basis) based on the historical
data, consideration of current economic activity, and a projected annual rate of growth of
4% per year (see Exhibit VI, Column (6)).
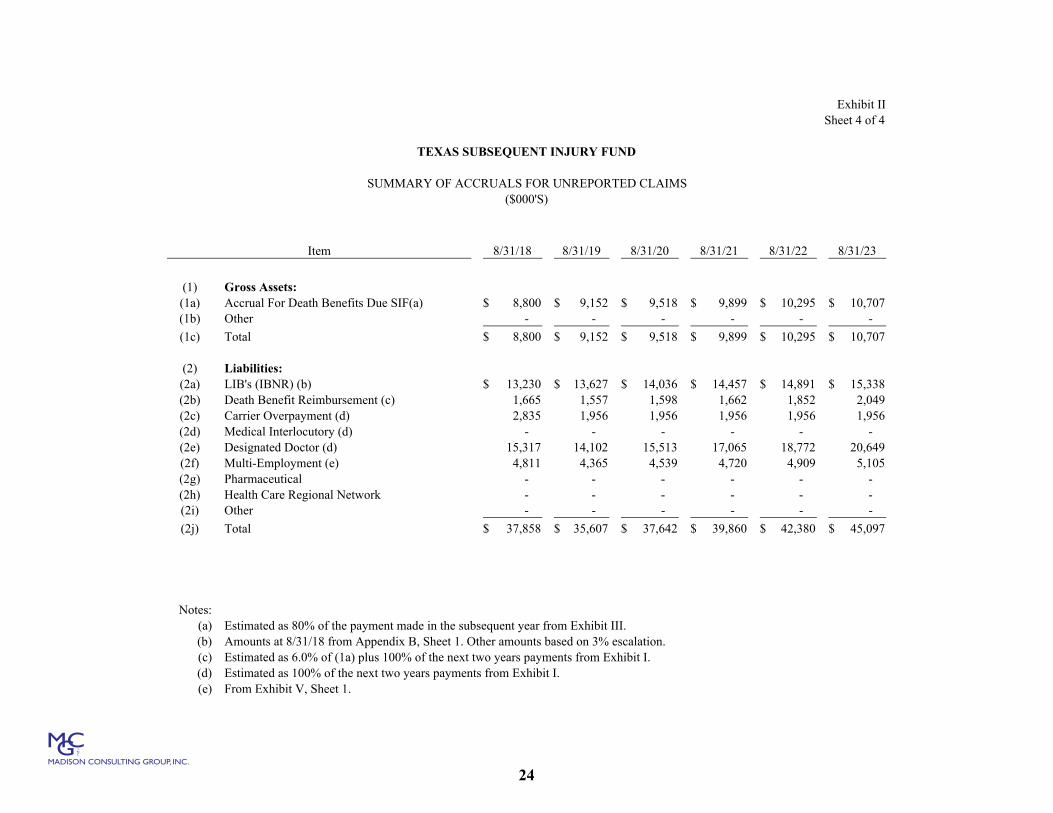
We estimated the accrual for revenue receivable (see Exhibit II, Sheet 4,
Row 1a) from the projected revenue (cash basis) (Exhibit I, Item 2a) assuming an average
lag of twelve months from the time of a no-dependent fatality to the time the revenue is
received by SIF.
The SIF's Expenses The SIF has six sources of expenses as follows:
1. Lifetime Income Benefits (LIB's) 2. Carrier Overpayment Reimbursement (including “medical interlocutory
orders” and “designated doctor opinions”) 3. Multiple Employment Reimbursement (including reimbursement for death
benefits in multiple employment situations) 4. Pharmaceutical Reimbursement 5. Death Benefit Reimbursement 6. Healthcare Regional Network Assessment (historical only, not a
prospective expense) These items (excluding Healthcare Regional Network Assessment) are described in the following five sections:
7
MADISON CONSULTING GROUP, INC.
Expense Item 1: LIB's The original purpose of the SIF was to facilitate the employment of
handicapped persons by providing a mechanism for funding increased benefit costs
arising from pre-existing injuries. This was, and continues to be, accomplished through
lifetime income benefits (LIB's) paid to eligible injured workers. The eligibility criteria
and benefit amounts vary depending on whether the injury is covered by the "old law"
(i.e., accidents prior to January 1, 1991) or the "new law." Under either law, the benefits
refer to indemnity benefits only and exclude medical benefits.
Under the old law, if an employee who had previously lost a leg, eye or
hand, was to lose a second leg, eye or hand, then the insurance carrier would be liable
only for the second injury. The SIF would be liable for the remainder of any total and
permanent disability award and pay to the injured worker the portion of workers’
compensation benefits attributed to the previous disability or injury. Under the old law,
the benefit awards were fixed weekly (or biweekly or monthly) amounts. There was no
escalation in benefits.
Under the new law, if an employee had a previous injury, which when
combined with a second injury results in a condition for which the injured employee is
entitled to lifetime income benefits, the insurance carrier is liable for the second injury
only to the extent that the first injury had not existed. The SIF is liable for the remainder
of any lifetime income benefits. Under the new law, the benefit awards are subject to 3%
escalation per annum.
The SIF determines the liability for known LIB awards using the 2001
Commissioners Standard Mortality Table (Appendix D). For benefits under the new law,
8

MADISON CONSULTING GROUP, INC.
the SIF includes an adjustment to reflect the 3% per year escalation in benefits specified
in the law. The SIF calculates the liability at nominal value and does not adjust the
liability to present value. This is reasonable considering that the SIF does not receive
interest on its funds.
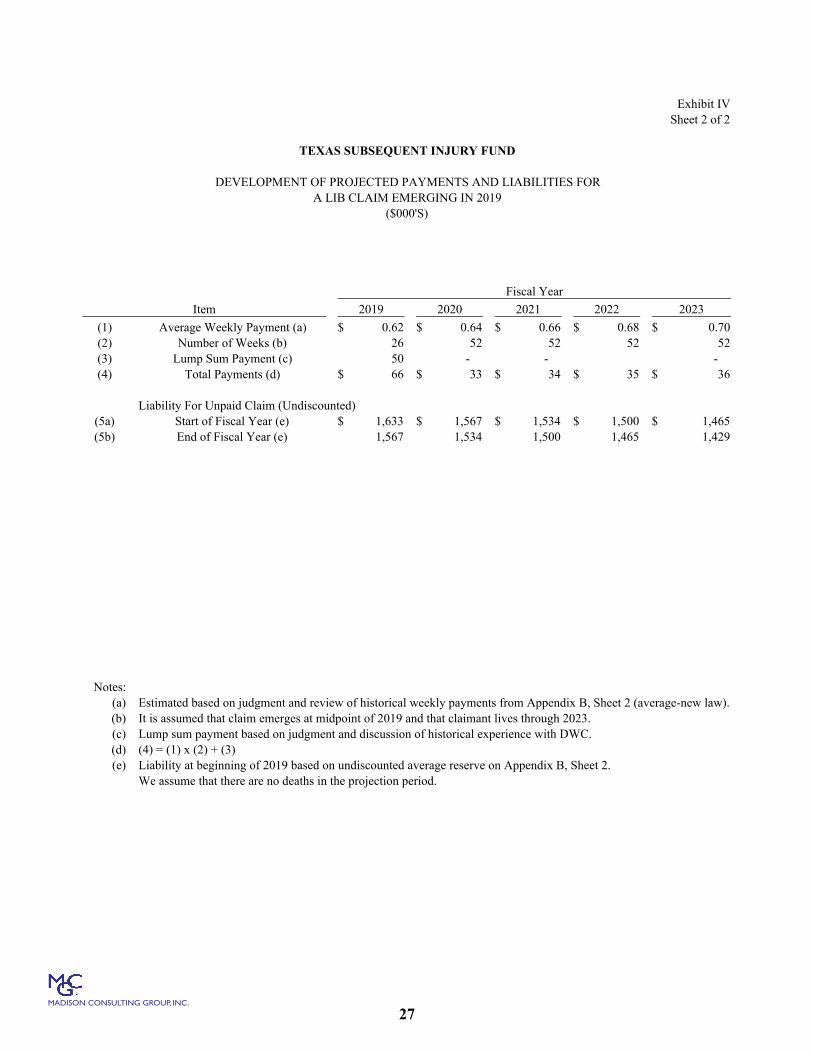
On Sheet 1 of Exhibit IV, we have estimated future LIB payments (cash
basis) through 2023 based on the following assumptions (each of which is based on
historical experience):
1. There will be 1.2 new LIB's awarded each year. 2. The new LIB's will be under the new law. The average benefit will be
approximately $620 per week in 2019 (see Sheet 2 of Exhibit IV) and will escalate at 3% per year.
3. No existing or future claimants will die before 2023. 4. In the initial year of award, a lump sum of $50 thousand is payable for
accrued benefits.
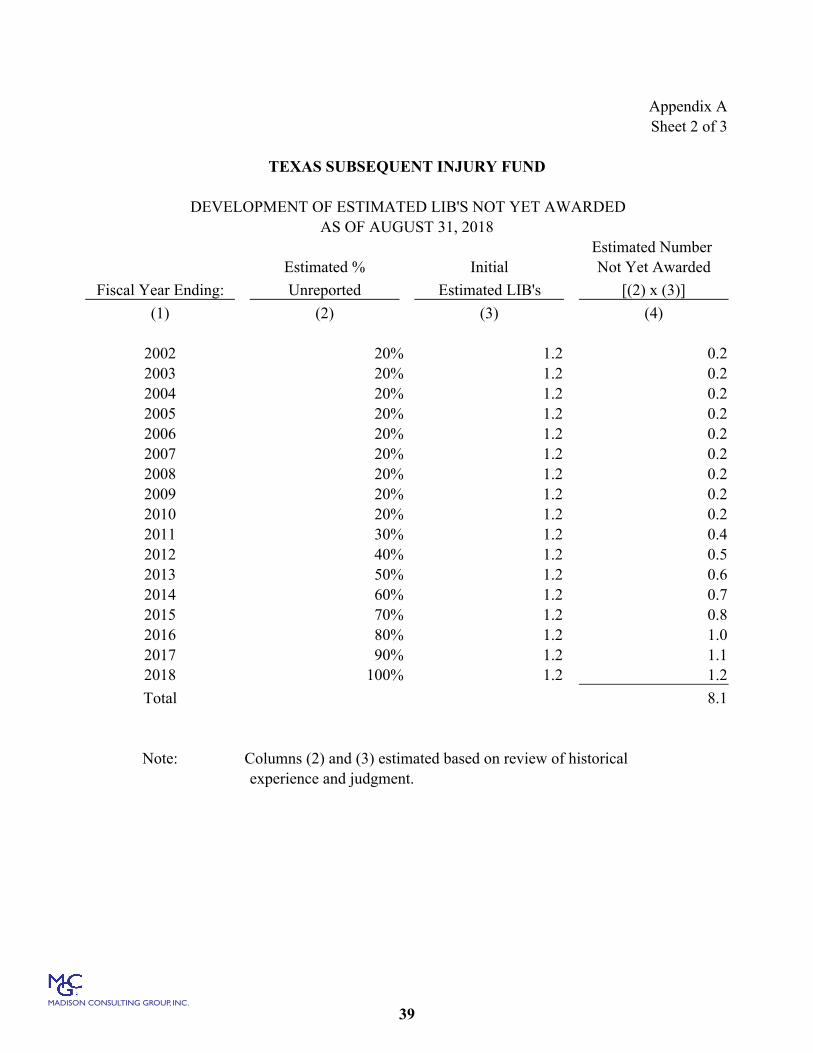
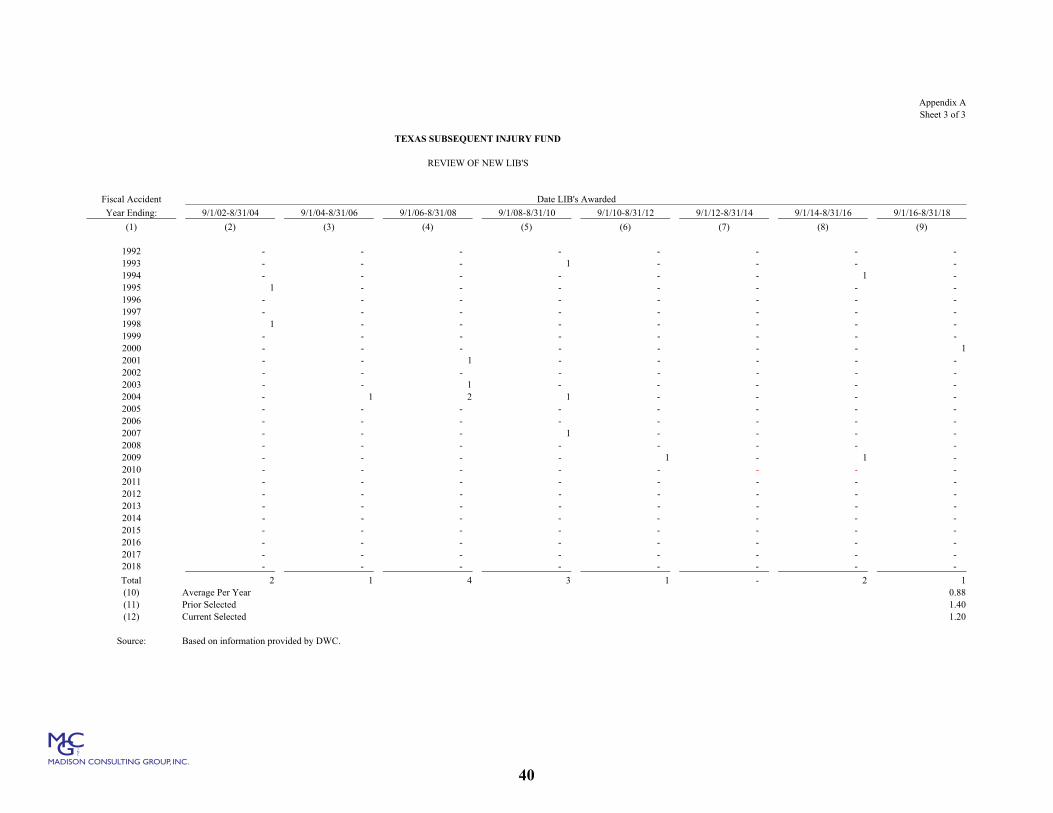
Appendix A documents the analysis of the number of LIB claims. Future
claims are projected based on the expectation of an average number of claims per year of
1.2 and an assumed reporting pattern. The estimate of 1.2 claims per year, as well as the
assumed reporting pattern, was based on a review of recent claims activity, discussion
with DWC personnel and judgment. The estimate of 1.2 has decreased from 1.4 in our
previous actuarial report at August 31, 2016 based on reduced claims activity.
In addition to estimating the LIB payments, we estimated the accrual
(liability) for future payments associated with LIB claims that have occurred on or before
the accounting date. This includes both the liability for known LIB awards, as well as the
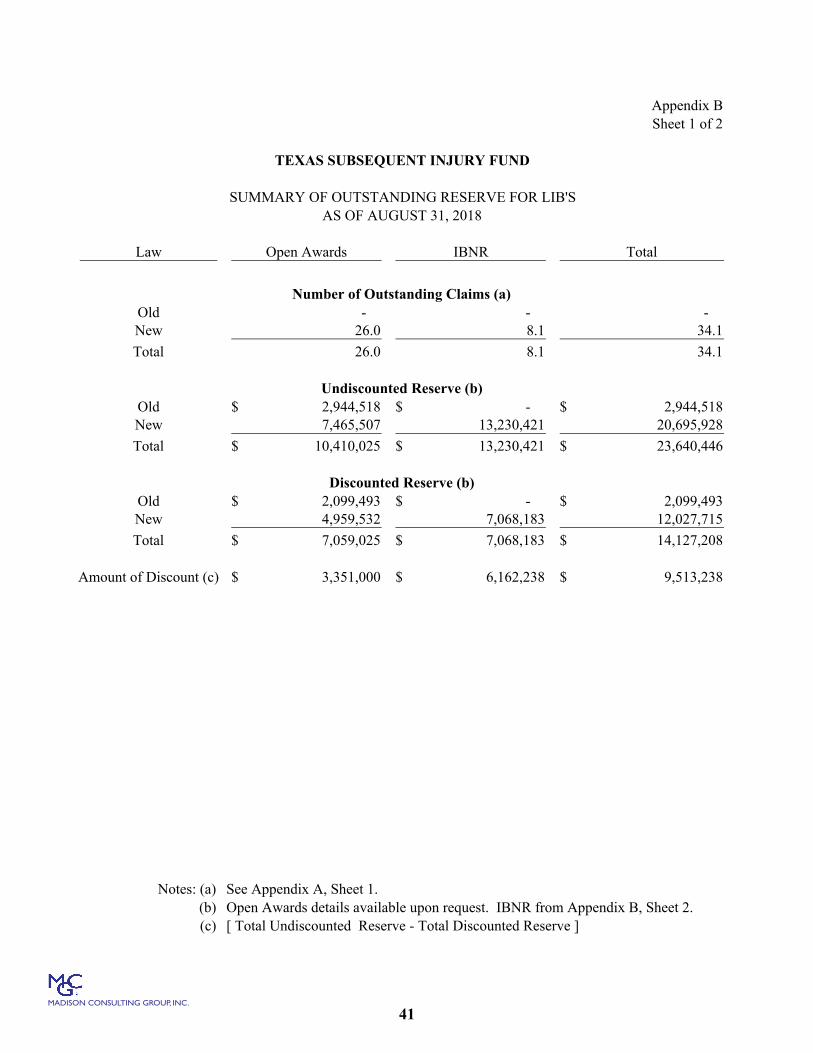
liability for unknown awards. In Appendix B of this report, we evaluated the liability for
known LIB awards using a similar procedure to that used by the SIF. We also estimated
9
MADISON CONSULTING GROUP, INC.
the liability for LIB's that have not yet been awarded but where the underlying accident
has occurred (also referred to as IBNR).
Expense Item 2: Carrier Overpayment Reimbursement
The determination of the benefits due an injured employee in the Texas
workers’ compensation system often involves complex issues and a lengthy process. The
process may involve a benefit review conference (an informal procedure in which a
DWC hearings officer can order payments of benefits), a contested case hearing (in
which a DWC hearings officer issues a decision and order), a DWC appeals panel (that
reviews the record and may reverse the decision of the hearings officer and render a new
decision; or reverse the decision of the hearings officer and remand the case to the
hearings officer for further consideration and development of evidence) and, finally,
judicial review in the court system. In this process, previous decisions of DWC that
ordered carriers to pay claimants may be reversed or modified. In these situations
(whether, or not it involves a second injury), the SIF is required to reimburse carriers for
overpayments they previously made to claimants. A similar situation, whereby SIF may
have to reimburse carriers, exists for reversals or modifications of designated doctor
opinions and medical interlocutory orders.
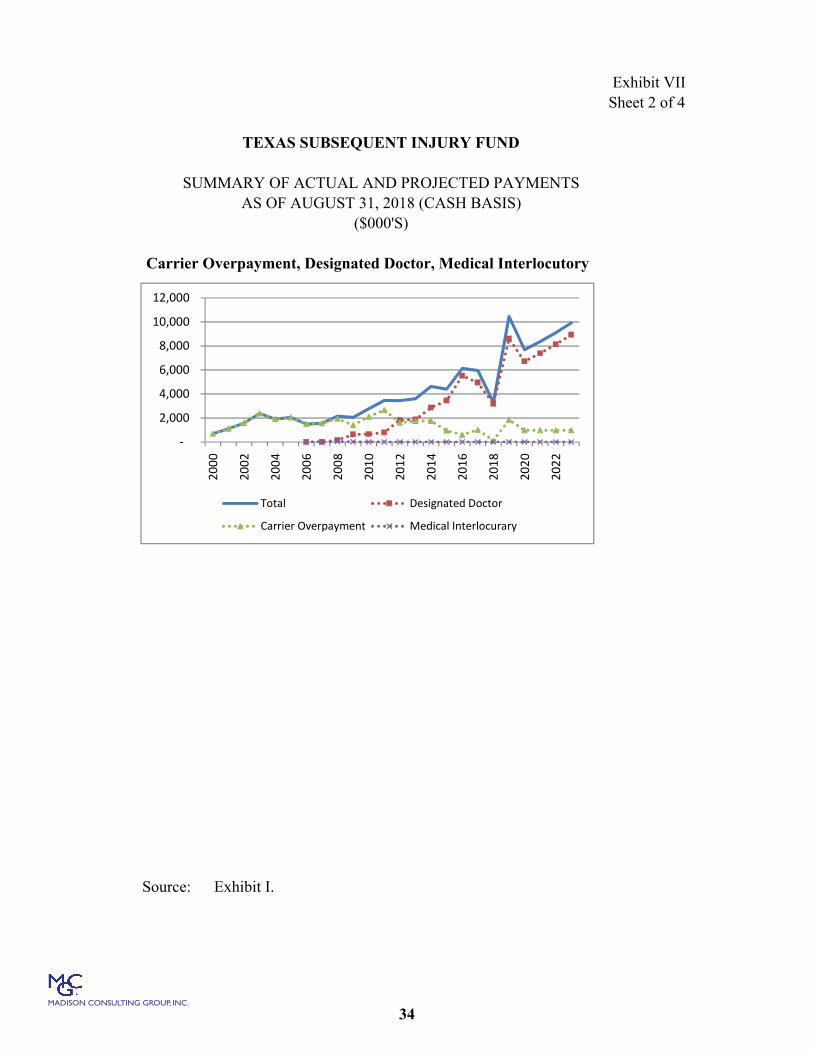
We estimated these reimbursements (cash basis) based on recent
experience and an assumed annual growth rate of 0% per year for “carrier overpayment”
and “medical interlocutory orders”, and a growth rate of 10% per year for “designated
doctor,” (see Exhibit I, Items 3c through 3e, and Exhibit VI).
Because there is a lag between the time when a claim occurs, and the time
SIF reimburses the insurance carrier, it is necessary to estimate an accrual (liability) for
10
MADISON CONSULTING GROUP, INC.
carrier overpayment reimbursements. Accordingly, we have included a liability for this
item on Sheet 4 of Exhibit II assuming an average lag of two years in filing a request for
reimbursements.
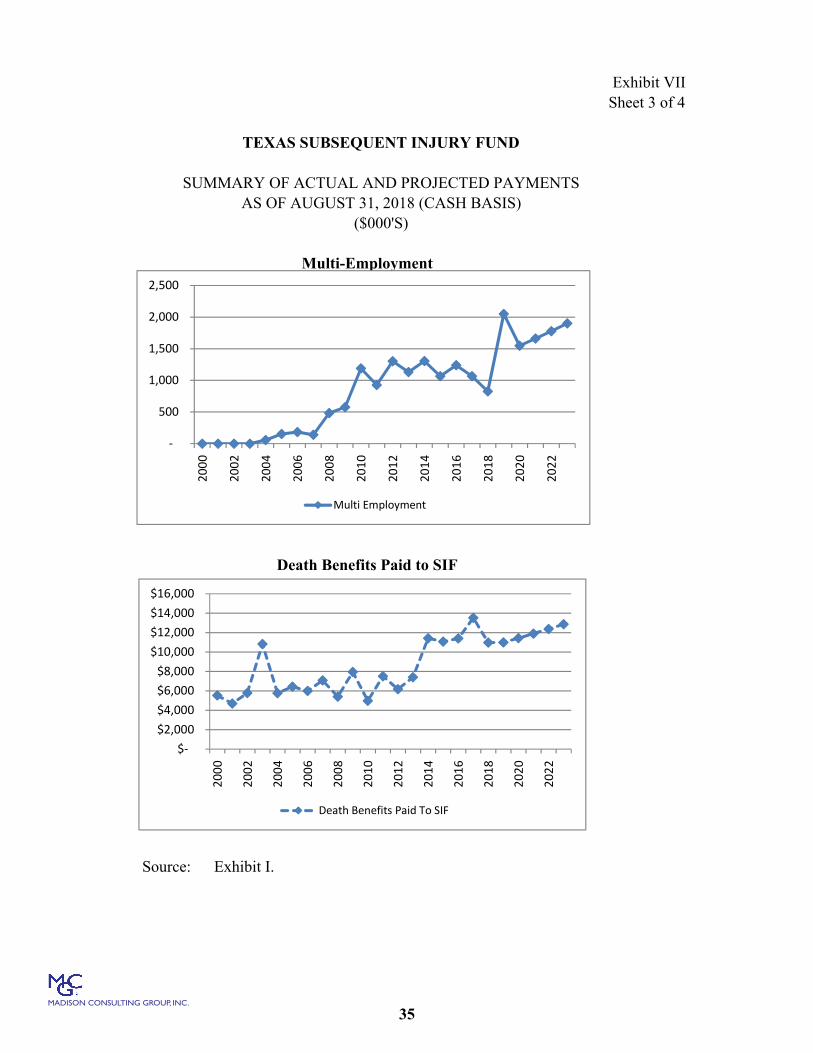
Expense Item 3: Multiple Employment Reimbursement
In 2001, the Texas legislature provided benefits for employees with
multiple employers and expanded the responsibilities of the SIF by requiring the SIF to
reimburse carriers for income benefits when the benefits have been increased because of
the claimant’s wages at more than one employer. Effective September 1, 2007, SB 1169
expanded the scope of reimbursement to include death benefits. In the past, SIF paid the
multiple employer reimbursement benefit one year in arrears. It is our understanding that,
beginning in 2010, SIF has made its payments current.
Over the last few years, it has become apparent that SIF is incurring
significant liabilities for multiple employment reimbursement benefits associated with
death benefits and LIB benefits. Like the second injury LIBs that SIF has traditionally
covered, these claims may involve lifetime benefits and payout over long periods of time.
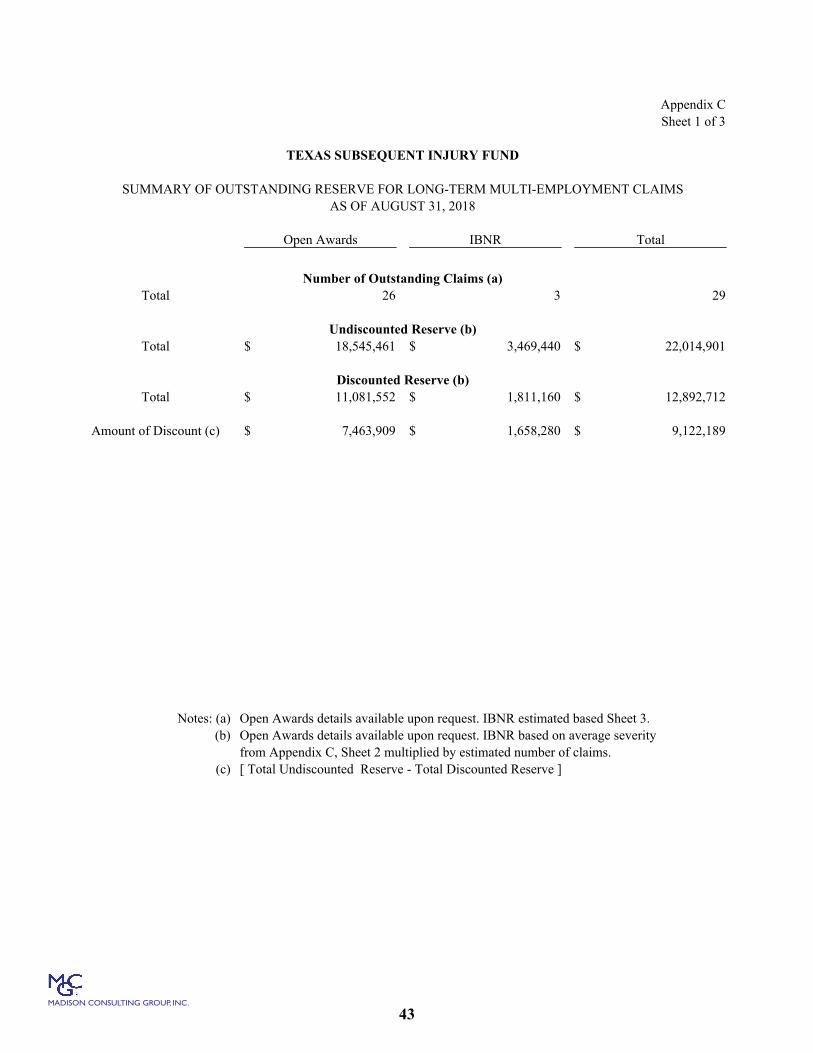
For this reason, we have analyzed the liability for these “long-term” claims using an
approach similar to that for the “regular” LIB benefits for which SIF has traditionally
been liable (see Appendix C).
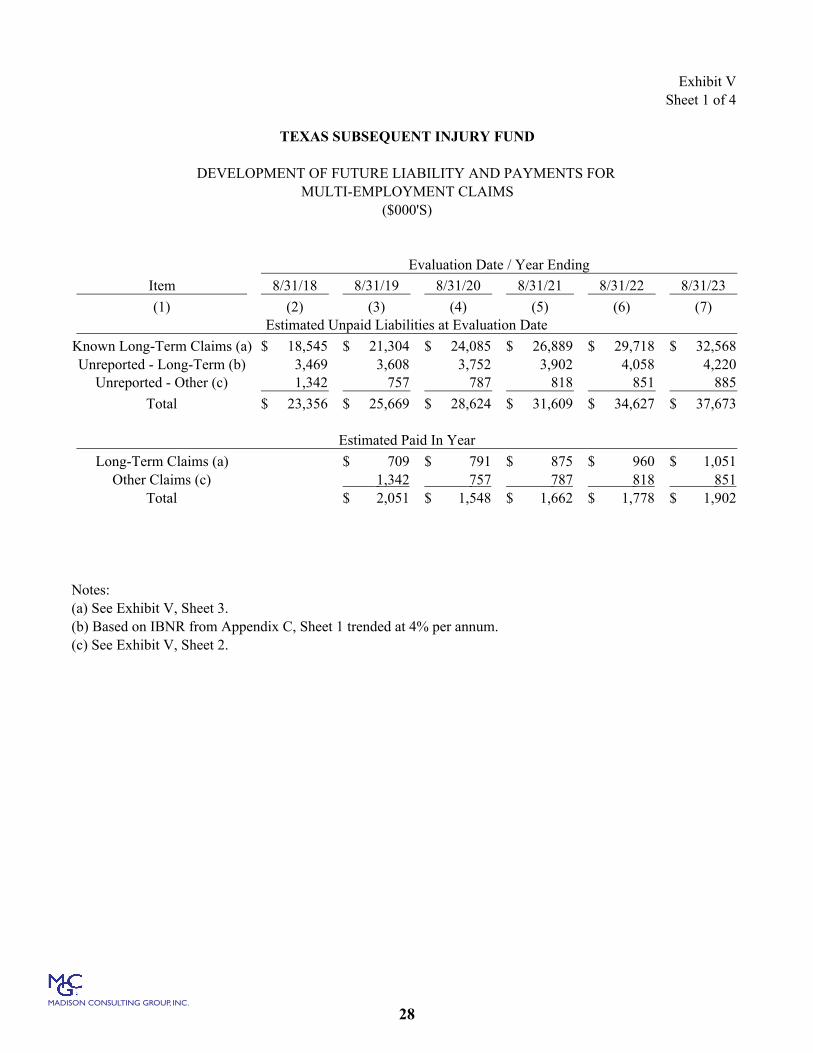
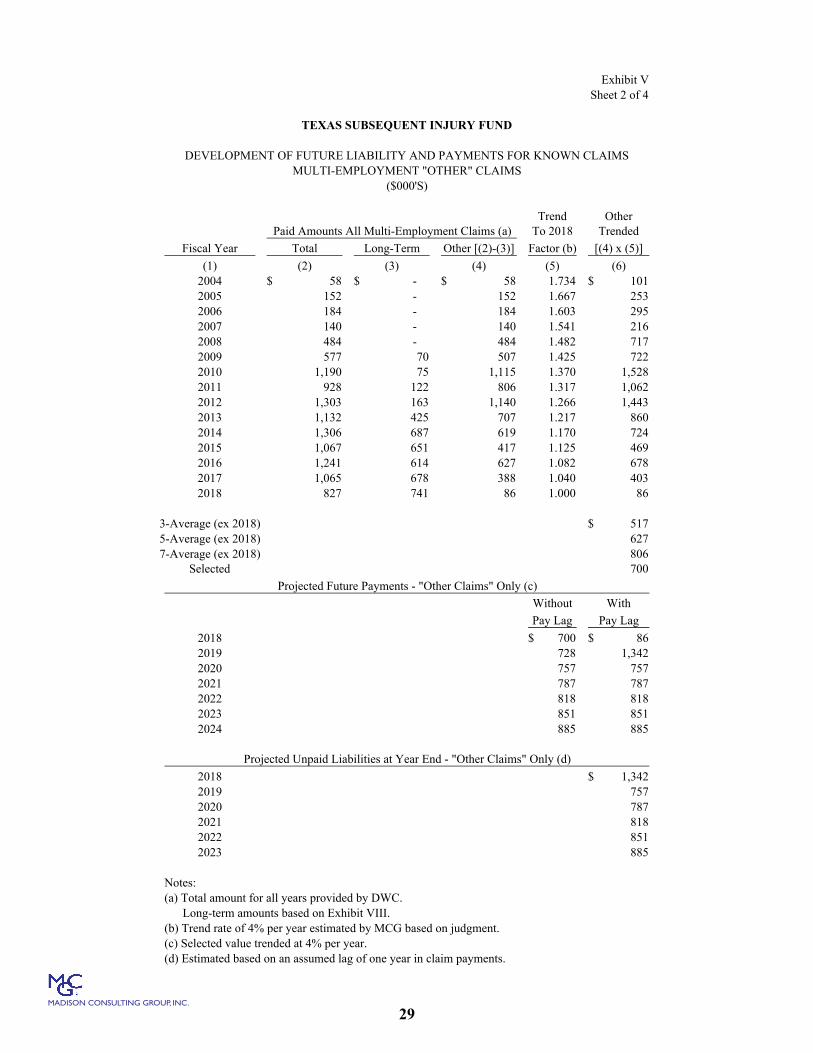
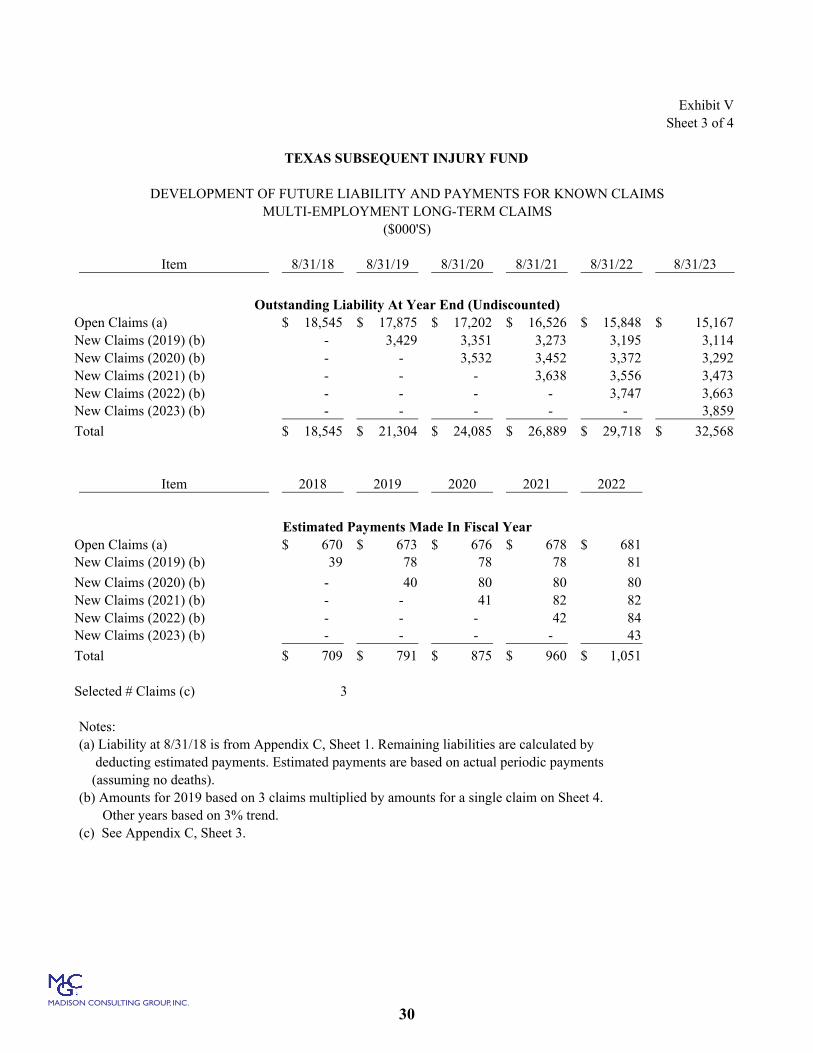
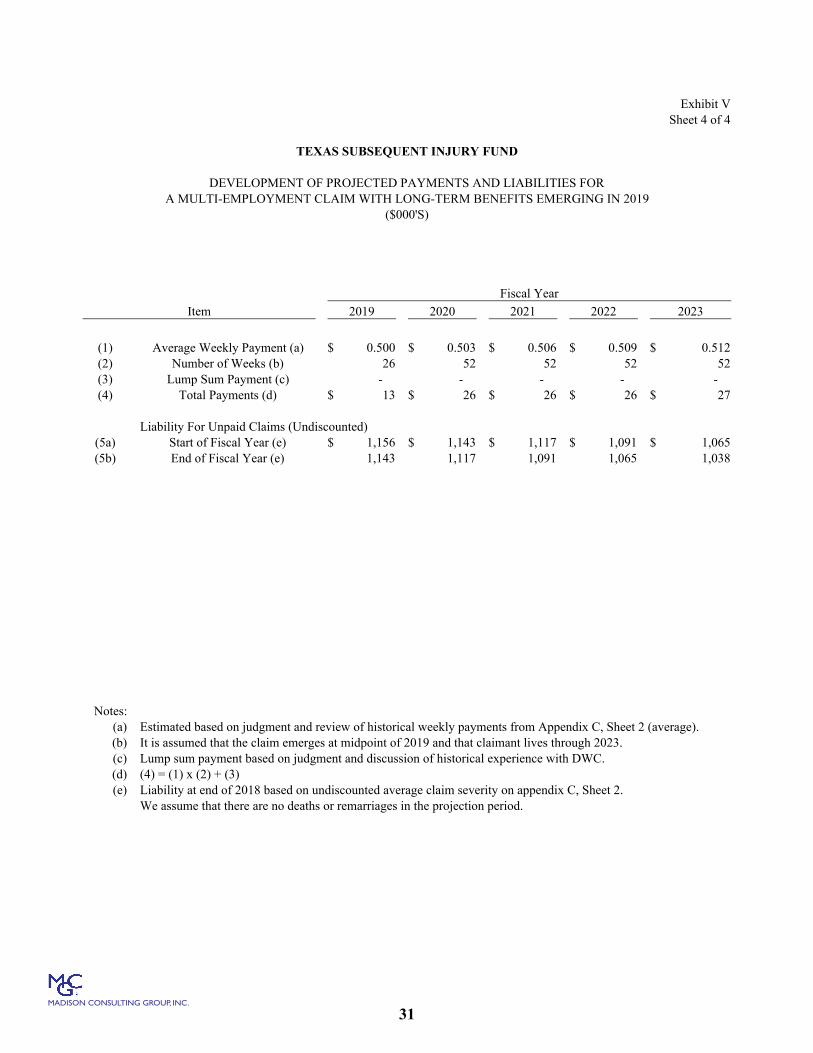
In addition to the “long term” multiple-employment claims, we separately
analyzed the “other” multiple employment claims. We projected payments for these
claims assuming a 4% annual growth rate (see Exhibit V, Sheet 2). Since these “other”
claims involve shorter time lags in the payment process, we included a liability for this
11
MADISON CONSULTING GROUP, INC.
item on Sheet 4 of Exhibit II assuming an average lag of one year in filing a request for
reimbursement (see also Exhibit V, Sheets 1 and 2).
Expense Item 4: Pharmaceutical Reimbursement
In 2003, the Texas legislature expanded the responsibilities of the SIF by
requiring the SIF to reimburse carriers for pharmaceutical services for the first seven days
following an injury in situations where the injury is ultimately found to be non-
compensable. We understand that, to date, there have been very few requests for
pharmaceutical reimbursements.
Expense Item 5: Death Benefit Reimbursement As described earlier, the SIF's source of income is payments from
insurance carriers in no-beneficiary death claims. In some situations, insurance carriers
must provide payments to the SIF under the assumption that there is no beneficiary only
to discover later that there is, in fact, an eligible beneficiary and that the carrier has
overpaid the SIF. In these situations, the SIF is responsible for issuing a refund to the
insurance carrier for the overpayment. Based on recent historical experience, we have
estimated that these reimbursements average about 5% of the gross death benefits paid by
carriers to the SIF. We used this 5% factor to project future (cash) reimbursements (see
Row 3b of Exhibit I).
Because there is a lag between the time SIF receives a payment from an
insurance carrier and the time it refunds a portion or all that payment back to the carrier,
it is necessary to estimate an accrual (liability) for death benefit refunds. Accordingly, we
12
MADISON CONSULTING GROUP, INC.
have included a liability for this item on Sheet 4 of Exhibit II assuming an average lag of
two years in making reimbursements.
Review of Experience
The revenue and expense payment projections in this report are based on
historical trends. The historical and future revenue and expense payments are illustrated
on Exhibit VII.
2018 Payment Backlog
We understand that, at the end of 2018, SIF had a significant backlog of
unpaid invoices caused by staff turnover and other internal issues. In our analysis, we
made our projections of future payments (for all expense categories except LIBs and
serious multi-employment claims which are not affected by the backlog) based on
experience through 2017 and attributed the resulting difference between actual and
projected payments for 2018 to the backlog. We then projected that these backlogged
amounts will be paid in 2019.
Data Sources Data for this analysis was provided by DWC as follows:
copies of schedules of LIB claims, as well as multiple employment claims involving LIB or survivor benefit of August 31, 2018; and,
copies of schedules prepared by DWC breaking out revenues and expenses into various categories.
TDI (unaudited) financial statements through August 31, 2017 A copy of the USAS screen shot showing SIF’s cash balance at September
14, 2018. This data was supplemented by the following:
13
MADISON CONSULTING GROUP, INC.
data underlying the 2001 Commissioners Standard Ordinary Mortality Table from the Texas Department of Insurance website; and,
a copy of an article by an economist Thomas Amirault entitled Characteristics of Multiple Jobholders, 1995 and published in the Monthly Labor Review in March 1997.
Data previously provided to us by DWC for earlier actuarial studies. All the data were accepted for analysis without audit or verification. Acknowledgment We acknowledge the assistance of DWC in providing the data and
answering questions on the operations of the SIF.
Inherent Variability Any projection of financial results for the SIF involves the estimation of
future contingent events. Actual results are likely to vary from projections. We have,
however, utilized standard actuarial methods and considerations and believe the results
are reasonable.
14
MADISON CONSULTING GROUP, INC.
RESULTS AND CONCLUSIONS Based on our analysis we have the following results and conclusions: Projected Cash Flows
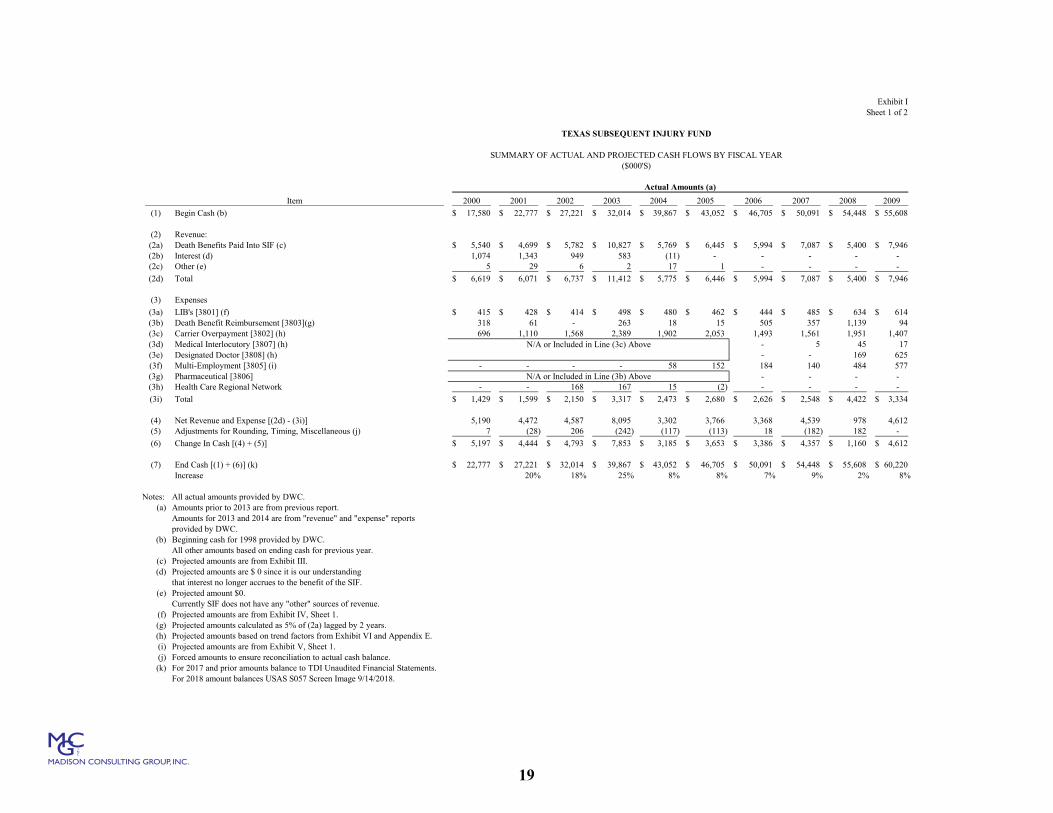
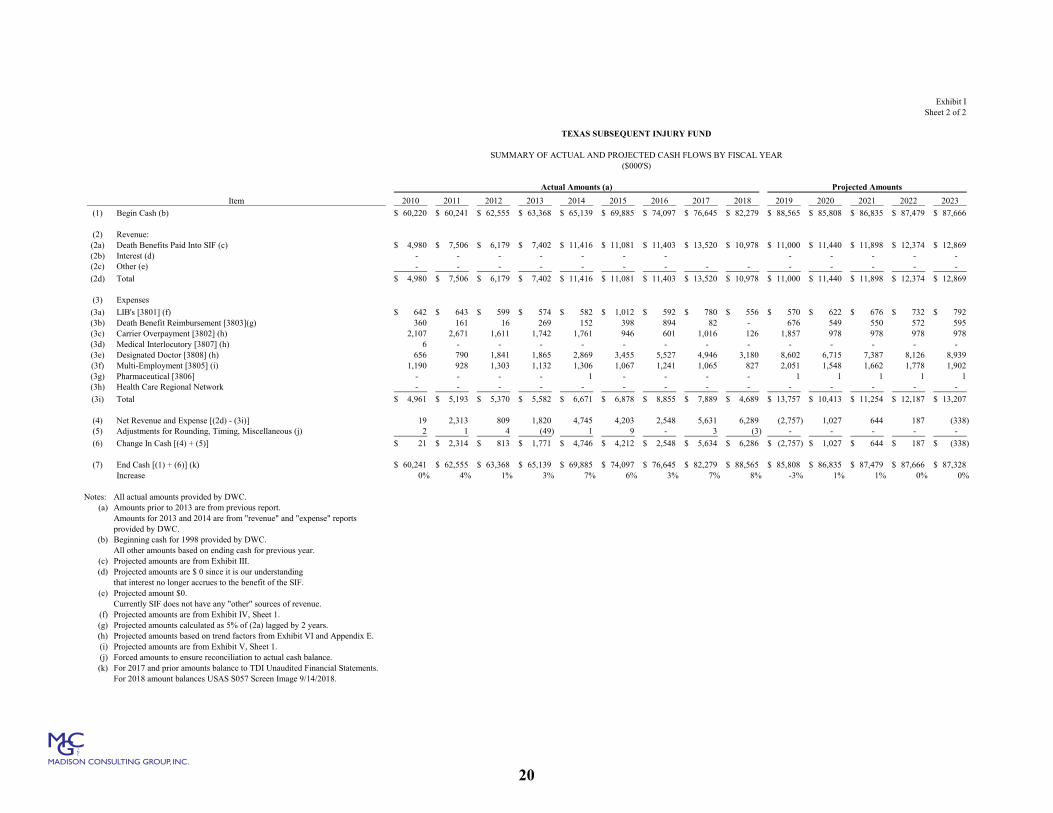
Exhibit I provides a summary of the actual cash flows, as well as projected
cash flows, through the end of fiscal year 2023. SIF’s cash balance grew rapidly through
fiscal year 2009. The growth then moderated largely as the result of rapidly increasing
costs through fiscal year 2016. The cash balance grew substantially in fiscal years 2017
and 2018 as expense payments decreased (though the decrease in fiscal year 2018 is at
least partially attributed to a payment backlog). We project that, the growth in cash
balance will level off in the near future.
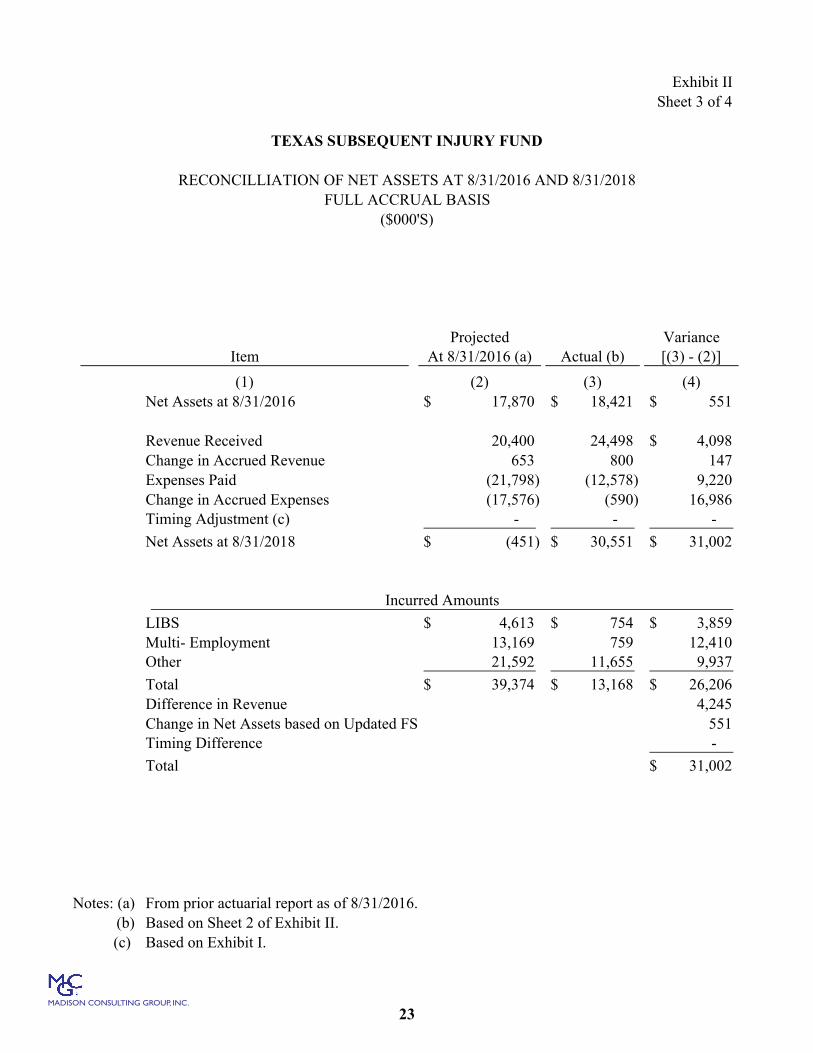
Projected Balance Sheet
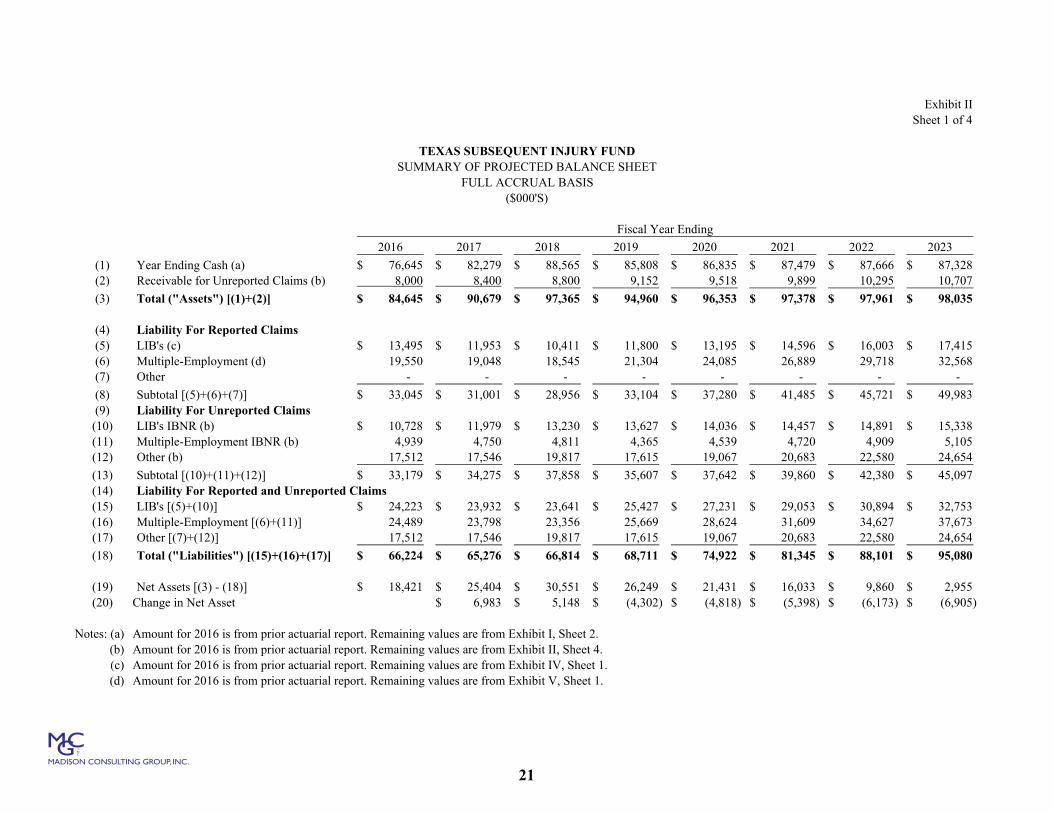
Sheet 1 of Exhibit II provides a summary of SIF’s estimated balance sheet
at the end of fiscal years 2018 through 2023 on a full accrual basis. In addition, it
provides a similar balance sheet at the end of fiscal year 2016 based on our previous
actuarial report. Although an actuarial report was not provided in 2017, 2017 is also
shown here, estimated with the benefit of hindsight. The balance sheet has been
estimated based on the cash amounts on Exhibit I adjusted to reflect accruals for revenue
and expenses associated with all claims occurring through the evaluation date. These
accruals include:
1. An asset accrual for cash expected to be received from all deaths that occurred through the accounting date, regardless of when the SIF receives the money.
15
MADISON CONSULTING GROUP, INC.
2. A liability accrual for all LIB's that are expected to arise from accidents occurring through the accounting date but awarded after the accounting date.
3. A liability accrual for all multiple employment benefits that are expected
to arise from long-term claims (i.e., widow, children, dependent and non-dependent parents), as well as a liability for short-term claims.
4. A liability accrual for all the other reimbursements the SIF is required to
make that reflects the time lag inherent in the reimbursement process.
The accrual items noted above result in a substantial reduction to the net
assets of the SIF. However, for the upcoming years the net assets remain positive
(though decreasing).
Projected Income Statement (Accrual Basis)
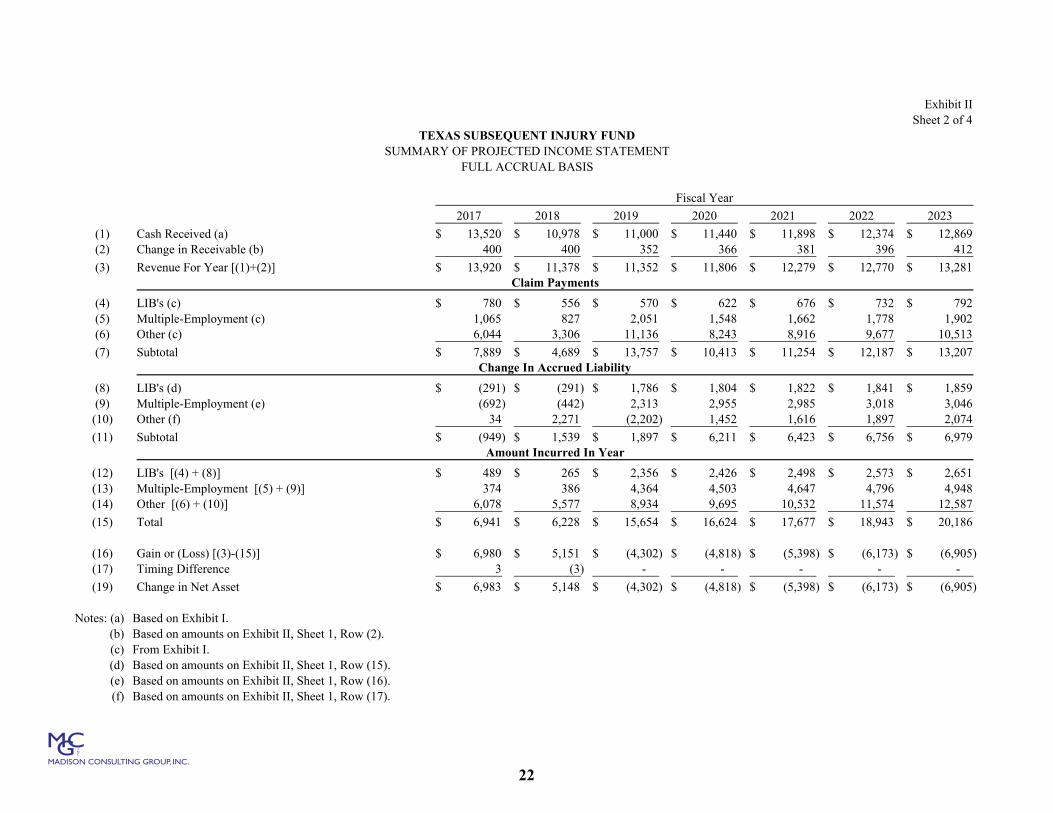
Sheet 2 of Exhibit II provides a summary of SIF’s projected income
statement for fiscal years 2019 through 2023. This income statement is calculated on a
full accrual basis similar to how the balance sheet was calculated on Sheet 1 of Exhibit II.
This Sheet also includes the income for fiscal year 2017 and 2018 as implied by our
current and prior actuarial reports.
Potential for Activating the Maintenance Tax
In recent years, the SIF has had strong positive cash flow. However,
based on current trends, we project that, in the near future, revenue and expenses will
come into approximate balance on a cash basis (Exhibit I). In addition, on a full accrual
basis, the projected assets of SIF currently exceed the projected liabilities. However,
based on current trends, we project this excess may erode in the next few years (Exhibit
16
MADISON CONSULTING GROUP, INC.
II). Thus, if current trends persist, the SIF will eventually encounter an actuarial funding
shortfall. However, this is not likely to occur in the immediate future.
Annuities
The liabilities for LIB's in the discussion above are based on nominal
values and have not been reduced to reflect the time value of money. We understand the
SIF is permitted to purchase annuities to satisfy LIB awards. If the SIF was to do this,
the immediate effect would likely be to increase the net assets of the SIF. This is because
annuities reflect the present value of future payments (i.e. payments discounted to reflect
interest), whereas SIF’s net assets are calculated on a nominal basis. We do, however,
note the following:
1. The purchase of annuities would expose the SIF to a credit risk. We understand that the SIF would reassume responsibility of paying claims should the issuer of the annuity not fulfill its responsibilities.
2. Viewed from the narrow perspective of the SIF, there may be financial
advantages in purchasing annuities. However, from the perspective of the State, this may be a disadvantage as it reduces interest income to the State.
To illustrate this issue, we have estimated that the discount, at a 3.5%
interest rate, in the liability for LIB’s at August 31, 2018 is about $3.4 million for
awarded LIB’s and $6.2 million for IBNR LIB’s (see Appendix B, Sheet 1). Similarly,
we have estimated the amount of discount for multiple employment claims as about $7.5
million for known claims and $1.7 million for IBNR claims (see Appendix C, Sheet 1).
These estimated values provide an indication of the possible financial gain to the SIF
from purchasing annuities.
17
MADISON CONSULTING GROUP, INC.
Comparison to Our Previous Analyses
We have previously performed similar analyses of the SIF at two-year
intervals. We performed our last analysis of the SIF as of August 31, 2016. The
methodology used in this current report is generally like that used in our previous report.
We have noted that the actual experience for 2017 and 2018 was more
favorable than we projected at August 2016. On a paid basis, the revenue received by
SIF was significantly higher (about $4.1 million) than we previously projected. Expenses
were also significantly lower (about $9.5 million) than we previously projected.
However, some of this apparent favorable situation is likely only an illusion attributable
to the payment backlog existing at August 31, 2018 and may partially reverse soon. On
an accrual basis, the estimated liabilities of the SIF are substantially improved from our
previous report based on low emergence of LIB or serious multi-employment claims over
the last two years, as well as moderation in the level of “Designated Doctor” expenses
(Exhibit II, Sheet 3).
GENERAL
Finally, to keep this report reasonably concise, we have not included any
of the source documents. This information is available at the request of DWC.
18
MADISON CONSULTING GROUP, INC.
Exhibit ISheet 1 of 2
TEXAS SUBSEQUENT INJURY FUND
SUMMARY OF ACTUAL AND PROJECTED CASH FLOWS BY FISCAL YEAR($000'S)
2000 2001 2002 2003 2004 2005 2006 2007 2008 2009
(1) Begin Cash (b) 17,580$ 22,777$ 27,221$ 32,014$ 39,867$ 43,052$ 46,705$ 50,091$ 54,448$ 55,608$
(2) Revenue:(2a) Death Benefits Paid Into SIF (c) 5,540$ 4,699$ 5,782$ 10,827$ 5,769$ 6,445$ 5,994$ 7,087$ 5,400$ 7,946$ (2b) Interest (d) 1,074 1,343 949 583 (11) - - - - - (2c) Other (e) 5 29 6 2 17 1 - - - -
(2d) Total 6,619$ 6,071$ 6,737$ 11,412$ 5,775$ 6,446$ 5,994$ 7,087$ 5,400$ 7,946$
(3) Expenses
(3a) LIB's [3801] (f) 415$ 428$ 414$ 498$ 480$ 462$ 444$ 485$ 634$ 614$ (3b) Death Benefit Reimbursement [3803](g) 318 61 - 263 18 15 505 357 1,139 94 (3c) Carrier Overpayment [3802] (h) 696 1,110 1,568 2,389 1,902 2,053 1,493 1,561 1,951 1,407 (3d) Medical Interlocutory [3807] (h) - 5 45 17 (3e) Designated Doctor [3808] (h) - - 169 625 (3f) Multi-Employment [3805] (i) - - - - 58 152 184 140 484 577 (3g) Pharmaceutical [3806] - - - - (3h) Health Care Regional Network - - 168 167 15 (2) - - - -
(3i) Total 1,429$ 1,599$ 2,150$ 3,317$ 2,473$ 2,680$ 2,626$ 2,548$ 4,422$ 3,334$
(4) Net Revenue and Expense [(2d) - (3i)] 5,190 4,472 4,587 8,095 3,302 3,766 3,368 4,539 978 4,612 (5) Adjustments for Rounding, Timing, Miscellaneous (j) 7 (28) 206 (242) (117) (113) 18 (182) 182 -
(6) Change In Cash [(4) + (5)] 5,197$ 4,444$ 4,793$ 7,853$ 3,185$ 3,653$ 3,386$ 4,357$ 1,160$ 4,612$
(7) End Cash [(1) + (6)] (k) 22,777$ 27,221$ 32,014$ 39,867$ 43,052$ 46,705$ 50,091$ 54,448$ 55,608$ 60,220$ Increase 20% 18% 25% 8% 8% 7% 9% 2% 8%
Notes: All actual amounts provided by DWC.(a) Amounts prior to 2013 are from previous report.
Amounts for 2013 and 2014 are from "revenue" and "expense" reportsprovided by DWC.
(b) Beginning cash for 1998 provided by DWC.All other amounts based on ending cash for previous year.
(c) Projected amounts are from Exhibit III.(d) Projected amounts are $ 0 since it is our understanding
that interest no longer accrues to the benefit of the SIF.(e) Projected amount $0.
Currently SIF does not have any "other" sources of revenue.(f) Projected amounts are from Exhibit IV, Sheet 1.(g) Projected amounts calculated as 5% of (2a) lagged by 2 years.(h) Projected amounts based on trend factors from Exhibit VI and Appendix E.(i) Projected amounts are from Exhibit V, Sheet 1.(j) Forced amounts to ensure reconciliation to actual cash balance.(k) For 2017 and prior amounts balance to TDI Unaudited Financial Statements.
For 2018 amount balances USAS S057 Screen Image 9/14/2018.
N/A or Included in Line (3b) Above
Item
N/A or Included in Line (3c) Above
Actual Amounts (a)
19
MADISON CONSULTING GROUP, INC.
(1) Begin Cash (b)
(2) Revenue:(2a) Death Benefits Paid Into SIF (c)(2b) Interest (d)(2c) Other (e)
(2d) Total
(3) Expenses
(3a) LIB's [3801] (f)(3b) Death Benefit Reimbursement [3803](g)(3c) Carrier Overpayment [3802] (h)(3d) Medical Interlocutory [3807] (h)(3e) Designated Doctor [3808] (h)(3f) Multi-Employment [3805] (i)(3g) Pharmaceutical [3806](3h) Health Care Regional Network
(3i) Total
(4) Net Revenue and Expense [(2d) - (3i)](5) Adjustments for Rounding, Timing, Miscellaneous (j)
(6) Change In Cash [(4) + (5)]
(7) End Cash [(1) + (6)] (k)Increase
Notes: All actual amounts provided by DWC.(a) Amounts prior to 2013 are from previous report.
Amounts for 2013 and 2014 are from "revenue" and "expense" reportsprovided by DWC.
(b) Beginning cash for 1998 provided by DWC.All other amounts based on ending cash for previous year.
(c) Projected amounts are from Exhibit III.(d) Projected amounts are $ 0 since it is our understanding
that interest no longer accrues to the benefit of the SIF.(e) Projected amount $0.
Currently SIF does not have any "other" sources of revenue.(f) Projected amounts are from Exhibit IV, Sheet 1.(g) Projected amounts calculated as 5% of (2a) lagged by 2 years.(h) Projected amounts based on trend factors from Exhibit VI and Appendix E.(i) Projected amounts are from Exhibit V, Sheet 1.(j) Forced amounts to ensure reconciliation to actual cash balance.(k) For 2017 and prior amounts balance to TDI Unaudited Financial Statements.
For 2018 amount balances USAS S057 Screen Image 9/14/2018.
Item
Exhibit ISheet 2 of 2
TEXAS SUBSEQUENT INJURY FUND
SUMMARY OF ACTUAL AND PROJECTED CASH FLOWS BY FISCAL YEAR($000'S)
2010 2011 2012 2013 2014 2015 2016 2017 2018 2019 2020 2021 2022 2023
60,220$ 60,241$ 62,555$ 63,368$ 65,139$ 69,885$ 74,097$ 76,645$ 82,279$ 88,565$ 85,808$ 86,835$ 87,479$ 87,666$
4,980$ 7,506$ 6,179$ 7,402$ 11,416$ 11,081$ 11,403$ 13,520$ 10,978$ 11,000$ 11,440$ 11,898$ 12,374$ 12,869$ - - - - - - - - - - - - - - - - - - - - - - - - - -
4,980$ 7,506$ 6,179$ 7,402$ 11,416$ 11,081$ 11,403$ 13,520$ 10,978$ 11,000$ 11,440$ 11,898$ 12,374$ 12,869$
642$ 643$ 599$ 574$ 582$ 1,012$ 592$ 780$ 556$ 570$ 622$ 676$ 732$ 792$ 360 161 16 269 152 398 894 82 - 676 549 550 572 595
2,107 2,671 1,611 1,742 1,761 946 601 1,016 126 1,857 978 978 978 978 6 - - - - - - - - - - - - -
656 790 1,841 1,865 2,869 3,455 5,527 4,946 3,180 8,602 6,715 7,387 8,126 8,939 1,190 928 1,303 1,132 1,306 1,067 1,241 1,065 827 2,051 1,548 1,662 1,778 1,902
- - - - 1 - - - - 1 1 1 1 1 - - - - - - - - - - - - - -
4,961$ 5,193$ 5,370$ 5,582$ 6,671$ 6,878$ 8,855$ 7,889$ 4,689$ 13,757$ 10,413$ 11,254$ 12,187$ 13,207$
19 2,313 809 1,820 4,745 4,203 2,548 5,631 6,289 (2,757) 1,027 644 187 (338) 2 1 4 (49) 1 9 - 3 (3) - - - - -
21$ 2,314$ 813$ 1,771$ 4,746$ 4,212$ 2,548$ 5,634$ 6,286$ (2,757)$ 1,027$ 644$ 187$ (338)$
60,241$ 62,555$ 63,368$ 65,139$ 69,885$ 74,097$ 76,645$ 82,279$ 88,565$ 85,808$ 86,835$ 87,479$ 87,666$ 87,328$ 0% 4% 1% 3% 7% 6% 3% 7% 8% -3% 1% 1% 0% 0%
Projected AmountsActual Amounts (a)
20
MADISON CONSULTING GROUP, INC.
Exhibit IISheet 1 of 4
2016 2017 2018 2019 2020 2021 2022 2023
(1) Year Ending Cash (a) 76,645$ 82,279$ 88,565$ 85,808$ 86,835$ 87,479$ 87,666$ 87,328$ (2) Receivable for Unreported Claims (b) 8,000 8,400 8,800 9,152 9,518 9,899 10,295 10,707
(3) Total ("Assets") [(1)+(2)] 84,645$ 90,679$ 97,365$ 94,960$ 96,353$ 97,378$ 97,961$ 98,035$
(4) Liability For Reported Claims(5) LIB's (c) 13,495$ 11,953$ 10,411$ 11,800$ 13,195$ 14,596$ 16,003$ 17,415$ (6) Multiple-Employment (d) 19,550 19,048 18,545 21,304 24,085 26,889 29,718 32,568 (7) Other - - - - - - - -
(8) Subtotal [(5)+(6)+(7)] 33,045$ 31,001$ 28,956$ 33,104$ 37,280$ 41,485$ 45,721$ 49,983$ (9) Liability For Unreported Claims(10) LIB's IBNR (b) 10,728$ 11,979$ 13,230$ 13,627$ 14,036$ 14,457$ 14,891$ 15,338$ (11) Multiple-Employment IBNR (b) 4,939 4,750 4,811 4,365 4,539 4,720 4,909 5,105 (12) Other (b) 17,512 17,546 19,817 17,615 19,067 20,683 22,580 24,654
(13) Subtotal [(10)+(11)+(12)] 33,179$ 34,275$ 37,858$ 35,607$ 37,642$ 39,860$ 42,380$ 45,097$ (14) Liability For Reported and Unreported Claims(15) LIB's [(5)+(10)] 24,223$ 23,932$ 23,641$ 25,427$ 27,231$ 29,053$ 30,894$ 32,753$ (16) Multiple-Employment [(6)+(11)] 24,489 23,798 23,356 25,669 28,624 31,609 34,627 37,673 (17) Other [(7)+(12)] 17,512 17,546 19,817 17,615 19,067 20,683 22,580 24,654
(18) Total ("Liabilities") [(15)+(16)+(17)] 66,224$ 65,276$ 66,814$ 68,711$ 74,922$ 81,345$ 88,101$ 95,080$
(19) Net Assets [(3) - (18)] 18,421$ 25,404$ 30,551$ 26,249$ 21,431$ 16,033$ 9,860$ 2,955$ (20) Change in Net Asset 6,983$ 5,148$ (4,302)$ (4,818)$ (5,398)$ (6,173)$ (6,905)$
Notes: (a) Amount for 2016 is from prior actuarial report. Remaining values are from Exhibit I, Sheet 2.(b) Amount for 2016 is from prior actuarial report. Remaining values are from Exhibit II, Sheet 4.(c) Amount for 2016 is from prior actuarial report. Remaining values are from Exhibit IV, Sheet 1.(d) Amount for 2016 is from prior actuarial report. Remaining values are from Exhibit V, Sheet 1.
($000'S)
TEXAS SUBSEQUENT INJURY FUNDSUMMARY OF PROJECTED BALANCE SHEET
FULL ACCRUAL BASIS
Fiscal Year Ending
21
MADISON CONSULTING GROUP, INC.
Exhibit IISheet 2 of 4
Fiscal Year
2017 2018 2019 2020 2021 2022 2023
(1) Cash Received (a) 13,520$ 10,978$ 11,000$ 11,440$ 11,898$ 12,374$ 12,869$ (2) Change in Receivable (b) 400 400 352 366 381 396 412
(3) Revenue For Year [(1)+(2)] 13,920$ 11,378$ 11,352$ 11,806$ 12,279$ 12,770$ 13,281$
(4) LIB's (c) 780$ 556$ 570$ 622$ 676$ 732$ 792$ (5) Multiple-Employment (c) 1,065 827 2,051 1,548 1,662 1,778 1,902 (6) Other (c) 6,044 3,306 11,136 8,243 8,916 9,677 10,513
(7) Subtotal 7,889$ 4,689$ 13,757$ 10,413$ 11,254$ 12,187$ 13,207$
(8) LIB's (d) (291)$ (291)$ 1,786$ 1,804$ 1,822$ 1,841$ 1,859$ (9) Multiple-Employment (e) (692) (442) 2,313 2,955 2,985 3,018 3,046 (10) Other (f) 34 2,271 (2,202) 1,452 1,616 1,897 2,074
(11) Subtotal (949)$ 1,539$ 1,897$ 6,211$ 6,423$ 6,756$ 6,979$
(12) LIB's [(4) + (8)] 489$ 265$ 2,356$ 2,426$ 2,498$ 2,573$ 2,651$ (13) Multiple-Employment [(5) + (9)] 374 386 4,364 4,503 4,647 4,796 4,948 (14) Other [(6) + (10)] 6,078 5,577 8,934 9,695 10,532 11,574 12,587
(15) Total 6,941$ 6,228$ 15,654$ 16,624$ 17,677$ 18,943$ 20,186$
(16) Gain or (Loss) [(3)-(15)] 6,980$ 5,151$ (4,302)$ (4,818)$ (5,398)$ (6,173)$ (6,905)$ (17) Timing Difference 3 (3) - - - - -
(19) Change in Net Asset 6,983$ 5,148$ (4,302)$ (4,818)$ (5,398)$ (6,173)$ (6,905)$
Notes: (a) Based on Exhibit I. (b) Based on amounts on Exhibit II, Sheet 1, Row (2).(c) From Exhibit I.(d) Based on amounts on Exhibit II, Sheet 1, Row (15).(e) Based on amounts on Exhibit II, Sheet 1, Row (16).(f) Based on amounts on Exhibit II, Sheet 1, Row (17).
Amount Incurred In Year
FULL ACCRUAL BASISSUMMARY OF PROJECTED INCOME STATEMENT
Claim Payments
Change In Accrued Liability
TEXAS SUBSEQUENT INJURY FUND
22
MADISON CONSULTING GROUP, INC.
Exhibit IISheet 3 of 4
Projected VarianceAt 8/31/2016 (a) Actual (b) [(3) - (2)]
(2) (3) (4)Net Assets at 8/31/2016 17,870$ 18,421$ 551$
Revenue Received 20,400 24,498 4,098$ Change in Accrued Revenue 653 800 147 Expenses Paid (21,798) (12,578) 9,220 Change in Accrued Expenses (17,576) (590) 16,986 Timing Adjustment (c) - - -
Net Assets at 8/31/2018 (451)$ 30,551$ 31,002$
LIBS 4,613$ 754$ 3,859$ Multi- Employment 13,169 759 12,410 Other 21,592 11,655 9,937
Total 39,374$ 13,168$ 26,206$ Difference in Revenue 4,245 Change in Net Assets based on Updated FS 551 Timing Difference -
Total 31,002$
Notes: (a) From prior actuarial report as of 8/31/2016.(b) Based on Sheet 2 of Exhibit II.(c) Based on Exhibit I.
Incurred Amounts
(1)
Item
TEXAS SUBSEQUENT INJURY FUND
RECONCILLIATION OF NET ASSETS AT 8/31/2016 AND 8/31/2018
($000'S)FULL ACCRUAL BASIS
23
MADISON CONSULTING GROUP, INC.
Exhibit IISheet 4 of 4
8/31/18 8/31/19 8/31/20 8/31/21 8/31/22 8/31/23
(1) Gross Assets:(1a) Accrual For Death Benefits Due SIF(a) 8,800$ 9,152$ 9,518$ 9,899$ 10,295$ 10,707$ (1b) Other - - - - - -
(1c) Total 8,800$ 9,152$ 9,518$ 9,899$ 10,295$ 10,707$
(2) Liabilities:(2a) LIB's (IBNR) (b) 13,230$ 13,627$ 14,036$ 14,457$ 14,891$ 15,338$ (2b) Death Benefit Reimbursement (c) 1,665 1,557 1,598 1,662 1,852 2,049 (2c) Carrier Overpayment (d) 2,835 1,956 1,956 1,956 1,956 1,956 (2d) Medical Interlocutory (d) - - - - - - (2e) Designated Doctor (d) 15,317 14,102 15,513 17,065 18,772 20,649 (2f) Multi-Employment (e) 4,811 4,365 4,539 4,720 4,909 5,105 (2g) Pharmaceutical - - - - - - (2h) Health Care Regional Network - - - - - - (2i) Other - - - - - -
(2j) Total 37,858$ 35,607$ 37,642$ 39,860$ 42,380$ 45,097$
Notes:(a) Estimated as 80% of the payment made in the subsequent year from Exhibit III.(b) Amounts at 8/31/18 from Appendix B, Sheet 1. Other amounts based on 3% escalation.(c) Estimated as 6.0% of (1a) plus 100% of the next two years payments from Exhibit I.(d) Estimated as 100% of the next two years payments from Exhibit I.(e) From Exhibit V, Sheet 1.
Item
TEXAS SUBSEQUENT INJURY FUND
SUMMARY OF ACCRUALS FOR UNREPORTED CLAIMS($000'S)
24
MADISON CONSULTING GROUP, INC.
Exhibit IIISheet 1 of 1
2006 2007 2008 2009 2010 2011 2012 2013 2014 2015 2016 2017 2018 Total
(1) Death Benefits Paid To SIF (a) 5,994$ 7,087$ 5,400$ 7,946$ 4,980$ 7,506$ 6,179$ 7,402$ 11,416$ 11,081$ 11,403$ 13,520$ 10,978$ 110,892$ (2) Trend Adjustment (b) 1.65 1.59 1.53 1.47 1.41 1.36 1.31 1.26 1.21 1.16 1.12 1.08 1.04
(3) SB1169 Adjustment (c) 0.71 0.71 1.00 1.00 1.00 1.00 1.00 1.00 1.00 1.00 1.00 1.00 1.00
(4) Revenue Adjusted to 2019 Level 7,022$ 8,001$ 8,262$ 11,681$ 7,022$ 10,208$ 8,094$ 9,327$ 13,813$ 12,854$ 12,771$ 14,602$ 11,417$ 10,390$ [(1)x(2)x(3)]
(5) Average 2006-2018 10,390$ (6) Average 2012-2018 11,840
(7) Selected 11,000$
2019 2020 2021 2022 2023 2024
(8) Projected Revenue (b) 11,000$ 11,440$ 11,898$ 12,374$ 12,869$ 13,384$
Notes:(a) Provided by DWC.(b) Reflects annual trend factor of 4.0% (see Exhibit VI).(c) Estimated impact of SB1169 from prior actuarial report.
TEXAS SUBSEQUENT INJURY FUND
DEVELOPMENT OF PROJECTED NO-DEPENDENT DEATH BENEFITS PAID TO THE SUBSEQUENT INJURY FUND($000'S)
25

MADISON CONSULTING GROUP, INC.
Exhibit IVSheet 1 of 2
Item 8/31/18 8/31/19 8/31/20 8/31/21 8/31/22 8/31/23
Open Claims - Old Law (a) 2,945$ 2,776$ 2,607$ 2,438$ 2,269$ 2,100$ Open Claims - New Law (a) 7,466 7,144 6,812 6,470 6,118 5,755 New Claims (2019) - New Law (b) - 1,880 1,840 1,799 1,757 1,714 New Claims (2020) - New Law (b) - - 1,936 1,895 1,853 1,810 New Claims (2021) - New Law (b) - - - 1,994 1,952 1,909 New Claims (2022) - New Law (b) - - - - 2,054 2,011 New Claims (2023) - New Law (b) - - - - - 2,116
Total 10,411$ 11,800$ 13,195$ 14,596$ 16,003$ 17,415$
Item 2019 2020 2021 2022 2023
Open Claims - Old Law (a) 169$ 169$ 169$ 169$ 169$ Open Claims - New Law (a) 322 332 342 352 363 New Claims (2019) - New Law (b) 79 40 41 42 43 New Claims (2020) - New Law (b) - 81 41 42 43 New Claims (2021) - New Law (b) - - 83 42 43 New Claims (2022) - New Law (b) - - - 85 43 New Claims (2023) - New Law (b) - - - - 88
Total 570$ 622$ 676$ 732$ 792$
Selected # Claims (c) 1.20
Notes:(a) Liability at 8/31/18 is from Appendix B, Sheet 1. Remaining liabilities are calculated by
deducting estimated payments. Estimated payments are based on actual periodic payments (assuming no deaths).(b) Amounts for 2019 based on 1.2 claims multiplied by amounts for a single claim on Sheet 2.
Other years based on 3% trend from Exhibit VI.(c) From Appendix A, Sheet 3.
Estimated Payments Made In Fiscal Year
($000'S)
TEXAS SUBSEQUENT INJURY FUND
DEVELOPMENT OF LIB'S FUTURE LIABILITY AND PAYMENTS FOR KNOWN CLAIMS
Outstanding Liability At Year End (Undiscounted)
26
MADISON CONSULTING GROUP, INC.
Exhibit IVSheet 2 of 2
2019 2020 2021 2022 2023
(1) Average Weekly Payment (a) 0.62$ 0.64$ 0.66$ 0.68$ 0.70$ (2) Number of Weeks (b) 26 52 52 52 52 (3) Lump Sum Payment (c) 50 - - - (4) Total Payments (d) 66$ 33$ 34$ 35$ 36$
Liability For Unpaid Claim (Undiscounted)(5a) Start of Fiscal Year (e) 1,633$ 1,567$ 1,534$ 1,500$ 1,465$ (5b) End of Fiscal Year (e) 1,567 1,534 1,500 1,465 1,429
Notes:(a) Estimated based on judgment and review of historical weekly payments from Appendix B, Sheet 2 (average-new law).(b) It is assumed that claim emerges at midpoint of 2019 and that claimant lives through 2023.(c) Lump sum payment based on judgment and discussion of historical experience with DWC.(d) (4) = (1) x (2) + (3)(e) Liability at beginning of 2019 based on undiscounted average reserve on Appendix B, Sheet 2.
We assume that there are no deaths in the projection period.
Item
($000'S)
Fiscal Year
TEXAS SUBSEQUENT INJURY FUND
A LIB CLAIM EMERGING IN 2019DEVELOPMENT OF PROJECTED PAYMENTS AND LIABILITIES FOR
27
MADISON CONSULTING GROUP, INC.
Exhibit VSheet 1 of 4
Item 8/31/18 8/31/19 8/31/20 8/31/21 8/31/22 8/31/23
(1) (2) (3) (4) (5) (6) (7)
Known Long-Term Claims (a) 18,545$ 21,304$ 24,085$ 26,889$ 29,718$ 32,568$ Unreported - Long-Term (b) 3,469 3,608 3,752 3,902 4,058 4,220
Unreported - Other (c) 1,342 757 787 818 851 885
Total 23,356$ 25,669$ 28,624$ 31,609$ 34,627$ 37,673$
Long-Term Claims (a) 709$ 791$ 875$ 960$ 1,051$ Other Claims (c) 1,342 757 787 818 851
Total 2,051$ 1,548$ 1,662$ 1,778$ 1,902$
Notes:(a) See Exhibit V, Sheet 3.(b) Based on IBNR from Appendix C, Sheet 1 trended at 4% per annum.(c) See Exhibit V, Sheet 2.
Estimated Paid In Year
Evaluation Date / Year Ending
TEXAS SUBSEQUENT INJURY FUND
DEVELOPMENT OF FUTURE LIABILITY AND PAYMENTS FOR MULTI-EMPLOYMENT CLAIMS
($000'S)
Estimated Unpaid Liabilities at Evaluation Date
28
MADISON CONSULTING GROUP, INC.
Exhibit VSheet 2 of 4
Trend OtherTo 2018 Trended
Fiscal Year Total Long-Term Other [(2)-(3)] Factor (b) [(4) x (5)]
(1) (2) (3) (4) (5) (6)2004 58$ -$ 58$ 1.734 101$ 2005 152 - 152 1.667 253 2006 184 - 184 1.603 295 2007 140 - 140 1.541 216 2008 484 - 484 1.482 717 2009 577 70 507 1.425 722 2010 1,190 75 1,115 1.370 1,528 2011 928 122 806 1.317 1,062 2012 1,303 163 1,140 1.266 1,443 2013 1,132 425 707 1.217 860 2014 1,306 687 619 1.170 724 2015 1,067 651 417 1.125 469 2016 1,241 614 627 1.082 678 2017 1,065 678 388 1.040 403 2018 827 741 86 1.000 86
3-Average (ex 2018) 517$ 5-Average (ex 2018) 627 7-Average (ex 2018) 806
Selected 700
Without With
Pay Lag Pay Lag
2018 700$ 86$ 2019 728 1,342 2020 757 757 2021 787 787 2022 818 818 2023 851 851 2024 885 885
2018 1,342$ 2019 757 2020 787 2021 818 2022 851 2023 885
Notes:(a) Total amount for all years provided by DWC. Long-term amounts based on Exhibit VIII.(b) Trend rate of 4% per year estimated by MCG based on judgment.(c) Selected value trended at 4% per year.(d) Estimated based on an assumed lag of one year in claim payments.
Projected Unpaid Liabilities at Year End - "Other Claims" Only (d)
TEXAS SUBSEQUENT INJURY FUND
DEVELOPMENT OF FUTURE LIABILITY AND PAYMENTS FOR KNOWN CLAIMSMULTI-EMPLOYMENT "OTHER" CLAIMS
($000'S)
Paid Amounts All Multi-Employment Claims (a)
Projected Future Payments - "Other Claims" Only (c)
29
MADISON CONSULTING GROUP, INC.
Exhibit VSheet 3 of 4
Item 8/31/18 8/31/19 8/31/20 8/31/21 8/31/22 8/31/23
Open Claims (a) 18,545$ 17,875$ 17,202$ 16,526$ 15,848$ 15,167$ New Claims (2019) (b) - 3,429 3,351 3,273 3,195 3,114 New Claims (2020) (b) - - 3,532 3,452 3,372 3,292 New Claims (2021) (b) - - - 3,638 3,556 3,473 New Claims (2022) (b) - - - - 3,747 3,663 New Claims (2023) (b) - - - - - 3,859
Total 18,545$ 21,304$ 24,085$ 26,889$ 29,718$ 32,568$
Item 2018 2019 2020 2021 2022
Open Claims (a) 670$ 673$ 676$ 678$ 681$ New Claims (2019) (b) 39 78 78 78 81
New Claims (2020) (b) - 40 80 80 80 New Claims (2021) (b) - - 41 82 82 New Claims (2022) (b) - - - 42 84 New Claims (2023) (b) - - - - 43
Total 709$ 791$ 875$ 960$ 1,051$
Selected # Claims (c) 3
Notes:(a) Liability at 8/31/18 is from Appendix C, Sheet 1. Remaining liabilities are calculated by
deducting estimated payments. Estimated payments are based on actual periodic payments (assuming no deaths).(b) Amounts for 2019 based on 3 claims multiplied by amounts for a single claim on Sheet 4.
Other years based on 3% trend.(c) See Appendix C, Sheet 3.
TEXAS SUBSEQUENT INJURY FUND
DEVELOPMENT OF FUTURE LIABILITY AND PAYMENTS FOR KNOWN CLAIMS
($000'S)
Outstanding Liability At Year End (Undiscounted)
Estimated Payments Made In Fiscal Year
MULTI-EMPLOYMENT LONG-TERM CLAIMS
30
MADISON CONSULTING GROUP, INC.
Exhibit VSheet 4 of 4
2019 2020 2021 2022 2023
(1) Average Weekly Payment (a) 0.500$ 0.503$ 0.506$ 0.509$ 0.512$ (2) Number of Weeks (b) 26 52 52 52 52 (3) Lump Sum Payment (c) - - - - - (4) Total Payments (d) 13$ 26$ 26$ 26$ 27$
Liability For Unpaid Claims (Undiscounted)(5a) Start of Fiscal Year (e) 1,156$ 1,143$ 1,117$ 1,091$ 1,065$ (5b) End of Fiscal Year (e) 1,143 1,117 1,091 1,065 1,038
Notes:(a) Estimated based on judgment and review of historical weekly payments from Appendix C, Sheet 2 (average).(b) It is assumed that the claim emerges at midpoint of 2019 and that claimant lives through 2023.(c) Lump sum payment based on judgment and discussion of historical experience with DWC.(d) (4) = (1) x (2) + (3)(e) Liability at end of 2018 based on undiscounted average claim severity on appendix C, Sheet 2.
We assume that there are no deaths or remarriages in the projection period.
Item
TEXAS SUBSEQUENT INJURY FUND
DEVELOPMENT OF PROJECTED PAYMENTS AND LIABILITIES FORA MULTI-EMPLOYMENT CLAIM WITH LONG-TERM BENEFITS EMERGING IN 2019
($000'S)
Fiscal Year
31
MADISON CONSULTING GROUP, INC.
Exhibit VISheet 1 of 1
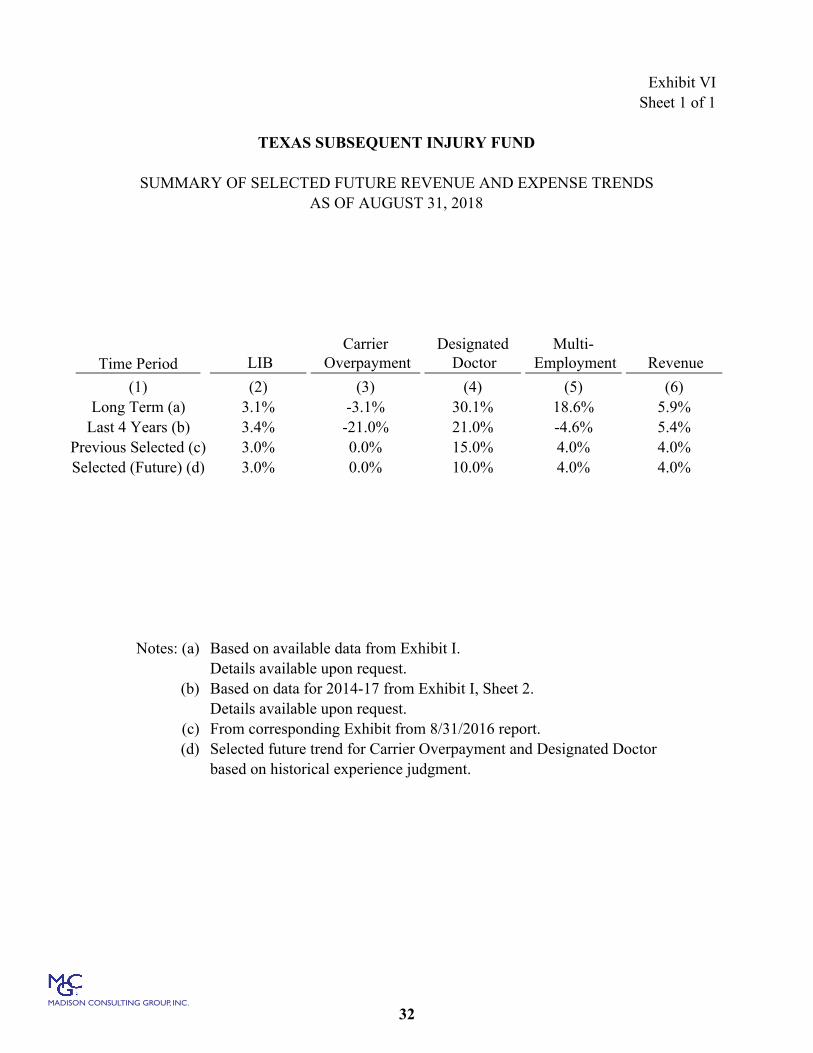
Carrier Designated Multi-Time Period LIB Overpayment Doctor Employment Revenue
(1) (2) (3) (4) (5) (6)Long Term (a) 3.1% -3.1% 30.1% 18.6% 5.9%
Last 4 Years (b) 3.4% -21.0% 21.0% -4.6% 5.4%Previous Selected (c) 3.0% 0.0% 15.0% 4.0% 4.0%Selected (Future) (d) 3.0% 0.0% 10.0% 4.0% 4.0%
Notes: (a) Based on available data from Exhibit I.Details available upon request.
(b) Based on data for 2014-17 from Exhibit I, Sheet 2.Details available upon request.
(c) From corresponding Exhibit from 8/31/2016 report.(d) Selected future trend for Carrier Overpayment and Designated Doctor
based on historical experience judgment.
TEXAS SUBSEQUENT INJURY FUND
SUMMARY OF SELECTED FUTURE REVENUE AND EXPENSE TRENDSAS OF AUGUST 31, 2018
32

MADISON CONSULTING GROUP, INC.
Exhibit VIISheet 1 of 4
Source: Exhibit I.
TEXAS SUBSEQUENT INJURY FUND
SUMMARY OF ACTUAL AND PROJECTED PAYMENTS
($000'S)AS OF AUGUST 31, 2018 (CASH BASIS)
LIB's
Death Benefit Reimbursement
$‐
$200
$400
$600
$800
$1,000
$1,200
2000
2002
2004
2006
2008
2010
2012
2014
2016
2018
2020
2022
LIBs
‐
200
400
600
800
1,000
1,200
2000
2002
2004
2006
2008
2010
2012
2014
2016
2018
2020
2022
Death Benefit Reimbursemnet
33
MADISON CONSULTING GROUP, INC.
Exhibit VIISheet 2 of 4
Source: Exhibit I.
TEXAS SUBSEQUENT INJURY FUND
SUMMARY OF ACTUAL AND PROJECTED PAYMENTSAS OF AUGUST 31, 2018 (CASH BASIS)
($000'S)
Carrier Overpayment, Designated Doctor, Medical Interlocutory
‐
2,000
4,000
6,000
8,000
10,000
12,000
2000
2002
2004
2006
2008
2010
2012
2014
2016
2018
2020
2022
Total Designated Doctor
Carrier Overpayment Medical Interlocurary
34
MADISON CONSULTING GROUP, INC.
Exhibit VIISheet 3 of 4
Source: Exhibit I.
TEXAS SUBSEQUENT INJURY FUND
SUMMARY OF ACTUAL AND PROJECTED PAYMENTS
Multi-Employment
Death Benefits Paid to SIF
AS OF AUGUST 31, 2018 (CASH BASIS)($000'S)
‐
500
1,000
1,500
2,000
2,500
2000
2002
2004
2006
2008
2010
2012
2014
2016
2018
2020
2022
Multi Employment
$‐
$2,000
$4,000
$6,000
$8,000
$10,000
$12,000
$14,000
$16,000
2000
2002
2004
2006
2008
2010
2012
2014
2016
2018
2020
2022
Death Benefits Paid To SIF
35

MADISON CONSULTING GROUP, INC.
Exhibit VIISheet 4 of 4
Source: Exhibit I.
SUMMARY OF ACTUAL AND PROJECTED EXPENSES AND REVENUEAS OF AUGUST 31, 2018 (CASH BASIS)
($000'S)
TEXAS SUBSEQUENT INJURY FUND
$‐
$2,000
$4,000
$6,000
$8,000
$10,000
$12,000
$14,000
$16,000
2000
2001
2002
2003
2004
2005
2006
2007
2008
2009
2010
2011
2012
2013
2014
2015
2016
2017
2018
2019
2020
2021
2022
2023
Total Expenses Revenue
36
MADISON CONSULTING GROUP, INC.
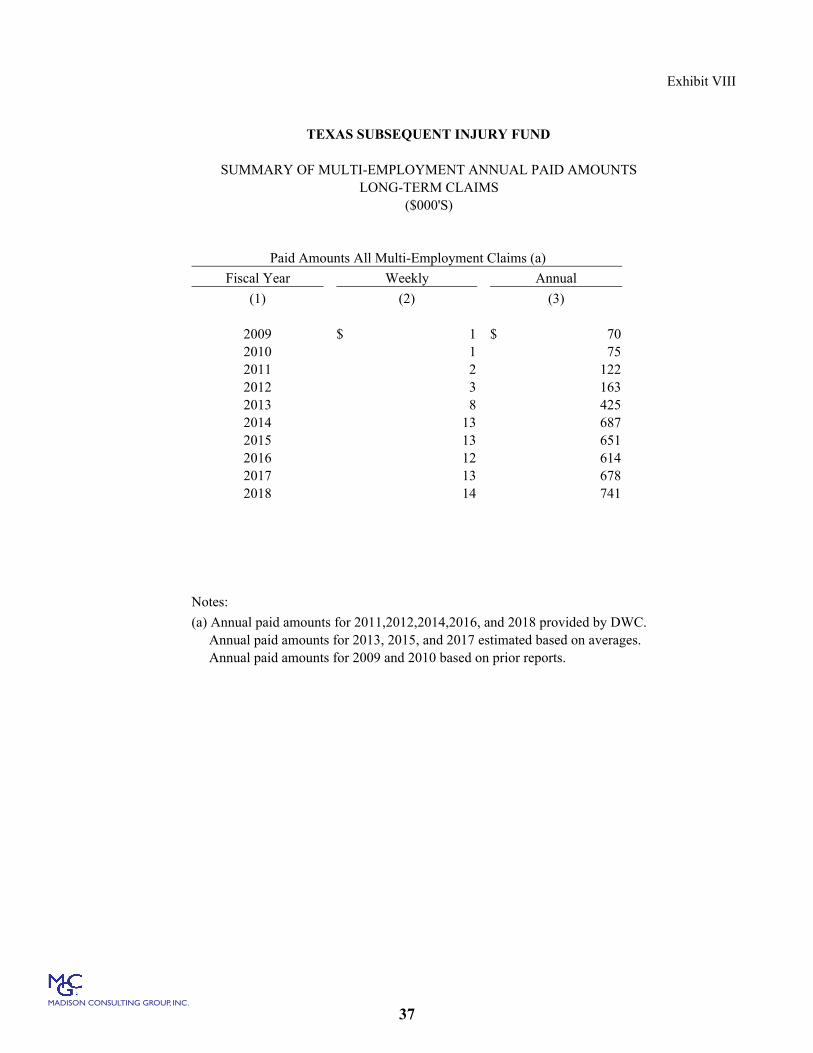
Exhibit VIII
Fiscal Year Weekly Annual
(1) (2) (3)
2009 1$ 70$ 2010 1 75 2011 2 122 2012 3 163 2013 8 425 2014 13 687 2015 13 651 2016 12 614 2017 13 678 2018 14 741
Notes:
(a) Annual paid amounts for 2011,2012,2014,2016, and 2018 provided by DWC. Annual paid amounts for 2013, 2015, and 2017 estimated based on averages. Annual paid amounts for 2009 and 2010 based on prior reports.
TEXAS SUBSEQUENT INJURY FUND
SUMMARY OF MULTI-EMPLOYMENT ANNUAL PAID AMOUNTSLONG-TERM CLAIMS
($000'S)
Paid Amounts All Multi-Employment Claims (a)
37

MADISON CONSULTING GROUP, INC.
Appendix ASheet 1 of 3
Estimated TotalNumber of Number of Estimated Number Number of LIB's
Fiscal Year Ending: Deceased LIB's (a) Open LIB's (a) Not Yet Awarded (b) [ (2) + (3) + (4) ]
(1) (2) (3) (4) (5)
Prior (1982-2001) 23.0 21.0 - 44.0 2002 - - 0.2 0.2 2003 - 1.0 0.2 1.2 2004 2.0 2.0 0.2 4.2 2005 - - 0.2 0.2 2006 - - 0.2 0.2 2007 - 1.0 0.2 1.2 2008 - - 0.2 0.2 2009 2.0 - 0.2 2.2 2010 - - 0.2 0.2 2011 - 1.0 0.4 1.4 2012 - - 0.5 0.5 2013 - - 0.6 0.6 2014 - - 0.7 0.7 2015 - - 0.8 0.8 2016 - - 1.0 1.0 2017 - - 1.1 1.1 2018 - - 1.2 1.2
Total 27.0 26.0 8.1 61.1 Average - All 1.7
Average - Last 10 Years 1.0
Notes: (a) Provided by DWC.(b) See Appendix A, Sheet 2.
TEXAS SUBSEQUENT INJURY FUND
SUMMARY OF NUMBER OF LIB'SAS OF AUGUST 31, 2018
38
MADISON CONSULTING GROUP, INC.
Appendix ASheet 2 of 3
Estimated Number Estimated % Initial Not Yet Awarded
Fiscal Year Ending: Unreported Estimated LIB's [(2) x (3)]
(1) (2) (3) (4)
2002 20% 1.2 0.2 2003 20% 1.2 0.2 2004 20% 1.2 0.2 2005 20% 1.2 0.2 2006 20% 1.2 0.2 2007 20% 1.2 0.2 2008 20% 1.2 0.2 2009 20% 1.2 0.2 2010 20% 1.2 0.2 2011 30% 1.2 0.4 2012 40% 1.2 0.5 2013 50% 1.2 0.6 2014 60% 1.2 0.7 2015 70% 1.2 0.8 2016 80% 1.2 1.0 2017 90% 1.2 1.1 2018 100% 1.2 1.2
Total 8.1
Note: Columns (2) and (3) estimated based on review of historicalexperience and judgment.
TEXAS SUBSEQUENT INJURY FUND
DEVELOPMENT OF ESTIMATED LIB'S NOT YET AWARDEDAS OF AUGUST 31, 2018
39
MADISON CONSULTING GROUP, INC.
Appendix ASheet 3 of 3
Fiscal Accident
Year Ending: 9/1/02-8/31/04 9/1/04-8/31/06 9/1/06-8/31/08 9/1/08-8/31/10 9/1/10-8/31/12 9/1/12-8/31/14 9/1/14-8/31/16 9/1/16-8/31/18
(1) (2) (3) (4) (5) (6) (7) (8) (9)
1992 - - - - - - - - 1993 - - - 1 - - - - 1994 - - - - - - 1 - 1995 1 - - - - - - - 1996 - - - - - - - - 1997 - - - - - - - - 1998 1 - - - - - - - 1999 - - - - - - - - 2000 - - - - - - - 1 2001 - - 1 - - - - - 2002 - - - - - - - - 2003 - - 1 - - - - - 2004 - 1 2 1 - - - - 2005 - - - - - - - - 2006 - - - - - - - - 2007 - - - 1 - - - - 2008 - - - - - - - - 2009 - - - - 1 - 1 - 2010 - - - - - - - - 2011 - - - - - - - - 2012 - - - - - - - - 2013 - - - - - - - - 2014 - - - - - - - - 2015 - - - - - - - - 2016 - - - - - - - - 2017 - - - - - - - - 2018 - - - - - - - -
Total 2 1 4 3 1 - 2 1 (10) Average Per Year 0.88 (11) Prior Selected 1.40 (12) Current Selected 1.20
Source: Based on information provided by DWC.
TEXAS SUBSEQUENT INJURY FUND
REVIEW OF NEW LIB'S
Date LIB's Awarded
40
MADISON CONSULTING GROUP, INC.
Appendix BSheet 1 of 2
Law Open Awards IBNR Total
Old - - - New 26.0 8.1 34.1
Total 26.0 8.1 34.1
Old 2,944,518$ -$ 2,944,518$ New 7,465,507 13,230,421 20,695,928
Total 10,410,025$ 13,230,421$ 23,640,446$
Old 2,099,493$ -$ 2,099,493$ New 4,959,532 7,068,183 12,027,715
Total 7,059,025$ 7,068,183$ 14,127,208$
Amount of Discount (c) 3,351,000$ 6,162,238$ 9,513,238$
Notes: (a) See Appendix A, Sheet 1.(b) Open Awards details available upon request. IBNR from Appendix B, Sheet 2.(c) [ Total Undiscounted Reserve - Total Discounted Reserve ]
Undiscounted Reserve (b)
Discounted Reserve (b)
Number of Outstanding Claims (a)
TEXAS SUBSEQUENT INJURY FUND
SUMMARY OF OUTSTANDING RESERVE FOR LIB'SAS OF AUGUST 31, 2018
41

MADISON CONSULTING GROUP, INC.
Appendix BSheet 2 of 2
EstimatedAverage Average
State Nominal Time From Time ForFiscal Average Weekly LIB Time To 8/31/2018 Escalation Escalation Discount Average AgeYear Wage (a) Payment (b) 8/31/18 To Award (c) [(4)+(5)] Factor (d) Factor (e) At Award (f)
(1) (2) (3) (4) (5) (6) (7) (8) (9)
2002 536$ 375$ 17.0 0.50 17.5 1.677 0.983 63 2003 536 375 16.0 0.50 16.5 1.629 0.983 62 2004 537 376 15.0 0.50 15.5 1.581 0.983 61 2005 539 377 14.0 0.50 14.5 1.535 0.983 60 2006 540 378 13.0 0.50 13.5 1.490 0.983 59 2007 674 472 12.0 0.50 12.5 1.447 0.983 58 2008 712 498 11.0 0.50 11.5 1.405 0.983 57 2009 750 525 10.0 0.50 10.5 1.364 0.983 56 2010 773 541 9.0 1.00 10.0 1.344 0.966 55 2011 766 536 8.0 1.50 9.5 1.324 0.950 55 2012 787 551 7.0 2.00 9.0 1.305 0.934 54 2013 818 573 6.0 2.50 8.5 1.286 0.918 54 2014 850 595 5.0 3.00 8.0 1.267 0.902 53 2015 861 603 4.0 3.50 7.5 1.248 0.887 53 2016 895 627 3.0 4.00 7.0 1.230 0.871 52 2017 913 639 2.0 4.50 6.5 1.212 0.857 52 2018 913 639 1.0 5.00 6.0 1.194 0.842 51
Life Estimated
Fiscal Expectancy Undiscounted Discounted IBNR Undiscounted Discounted
Year At Award (g) Undiscounted Discounted [(11)x(3)x(7)x52+50K] [(12)x(3)x(7)x(8)x52+50K] Count (i) [(13) x (15)] [(14) x (15)]
(1) (10) (11) (12) (13) (14) (15) (16) (17)
2002 18.29 25.80 17.38 893,699$ 608,690$ 0.2 178,740$ 121,738$ 2003 19.06 27.24 18.08 915,292 614,557 0.2 183,058 122,911 2004 19.85 28.75 18.79 938,712 620,957 0.2 187,742 124,191 2005 20.64 30.31 19.51 962,093 627,117 0.2 192,419 125,423 2006 21.45 31.94 20.23 985,441 632,413 0.2 197,088 126,483 2007 22.27 33.62 20.96 1,244,020 781,743 0.2 248,804 156,349 2008 23.10 35.36 21.70 1,336,534 826,108 0.2 267,307 165,222 2009 23.94 37.17 22.44 1,434,107 871,398 0.2 286,821 174,280 2010 24.79 39.04 23.19 1,526,079 896,989 0.2 305,216 179,398 2011 24.79 39.04 23.19 1,490,675 862,981 0.4 596,270 345,192 2012 25.65 40.99 23.95 1,582,651 886,407 0.5 791,326 443,204 2013 25.65 40.99 23.95 1,620,641 892,456 0.6 972,385 535,474 2014 26.52 43.01 24.72 1,736,034 924,081 0.7 1,215,224 646,857 2015 26.52 43.01 24.72 1,733,080 908,040 0.8 1,386,464 726,432 2016 27.40 45.10 25.48 1,858,642 940,007 1.0 1,858,642 940,007 2017 27.40 45.10 25.48 1,866,282 929,401 1.1 2,052,910 1,022,341 2018 28.28 47.26 26.26 1,925,004 927,234 1.2 2,310,005 1,112,681
Total 8.1 13,230,421$ 7,068,183$ Average: 1,633,385$ 872,615$
Notes: (a) Provided by DWC (and from TDI website).(b) Estimated as 70% of average weekly wage.(c) Based on judgment.(d) Reflects 3% escalation from date of injury based on time period in (6).(e) Reflects present value adjustment at 3.5% interest rate based on time period in (5).(f) Assumes average age at injury is 49 based on Sheet 2.(g) Based on 2001 CSO Mortality and 3% benefit escalation.(h) Calculations assume that award will include immediate $50,000 for accrued benefits.(i) See Appendix A, Sheet 2.
Reserve Factor At Award (g)
Cost per Case (h) Indicated Reserve
TEXAS SUBSEQUENT INJURY FUND
CALCULATION OF LIABILITY FOR IBNR LIB'S CLAIMSAS OF AUGUST 31, 2018
42
MADISON CONSULTING GROUP, INC.
Appendix CSheet 1 of 3
Open Awards IBNR Total
Total 26 3 29
Total 18,545,461$ 3,469,440$ 22,014,901$
Total 11,081,552$ 1,811,160$ 12,892,712$
Amount of Discount (c) 7,463,909$ 1,658,280$ 9,122,189$
Notes: (a) Open Awards details available upon request. IBNR estimated based Sheet 3.(b) Open Awards details available upon request. IBNR based on average severity
from Appendix C, Sheet 2 multiplied by estimated number of claims.(c) [ Total Undiscounted Reserve - Total Discounted Reserve ]
Discounted Reserve (b)
TEXAS SUBSEQUENT INJURY FUND
SUMMARY OF OUTSTANDING RESERVE FOR LONG-TERM MULTI-EMPLOYMENT CLAIMSAS OF AUGUST 31, 2018
Number of Outstanding Claims (a)
Undiscounted Reserve (b)
43
MADISON CONSULTING GROUP, INC.
Appendix CSheet 2 of 3
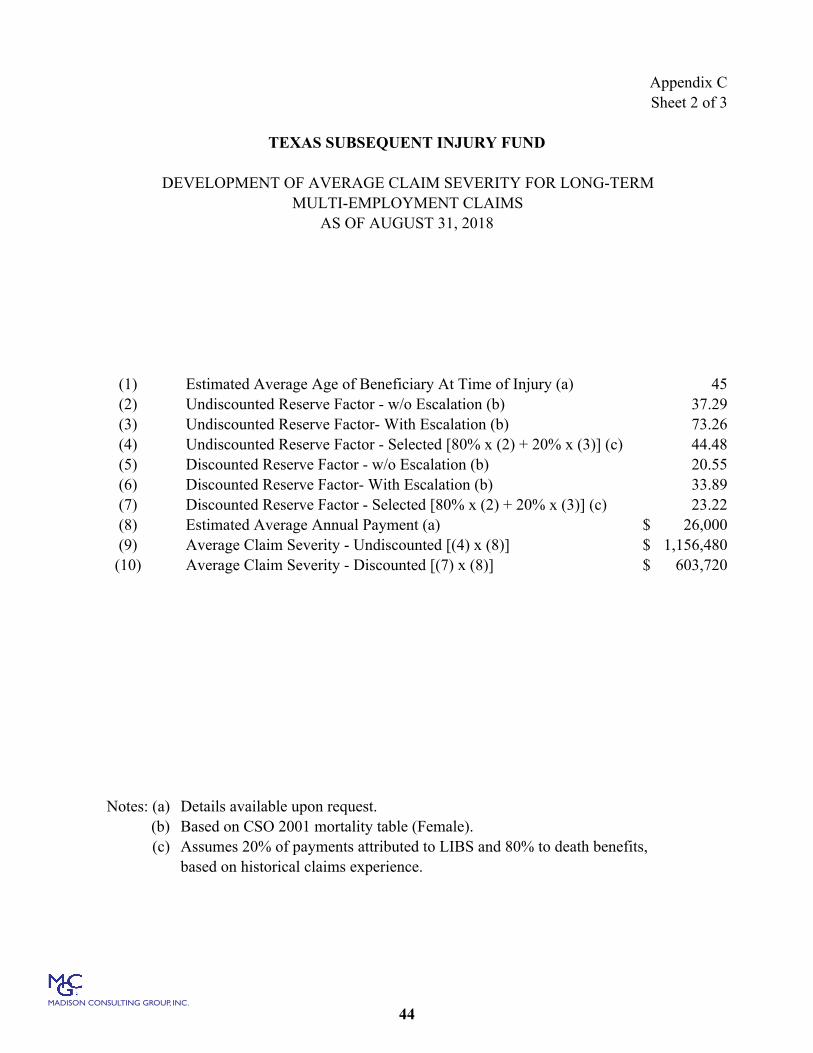
(1) Estimated Average Age of Beneficiary At Time of Injury (a) 45 (2) Undiscounted Reserve Factor - w/o Escalation (b) 37.29 (3) Undiscounted Reserve Factor- With Escalation (b) 73.26 (4) Undiscounted Reserve Factor - Selected [80% x (2) + 20% x (3)] (c) 44.48 (5) Discounted Reserve Factor - w/o Escalation (b) 20.55 (6) Discounted Reserve Factor- With Escalation (b) 33.89 (7) Discounted Reserve Factor - Selected [80% x (2) + 20% x (3)] (c) 23.22 (8) Estimated Average Annual Payment (a) 26,000$ (9) Average Claim Severity - Undiscounted [(4) x (8)] 1,156,480$
(10) Average Claim Severity - Discounted [(7) x (8)] 603,720$
Notes: (a) Details available upon request.(b) Based on CSO 2001 mortality table (Female).(c) Assumes 20% of payments attributed to LIBS and 80% to death benefits,
based on historical claims experience.
TEXAS SUBSEQUENT INJURY FUND
DEVELOPMENT OF AVERAGE CLAIM SEVERITY FOR LONG-TERMMULTI-EMPLOYMENT CLAIMS
AS OF AUGUST 31, 2018
44
MADISON CONSULTING GROUP, INC.
Appendix CSheet 3 of 3
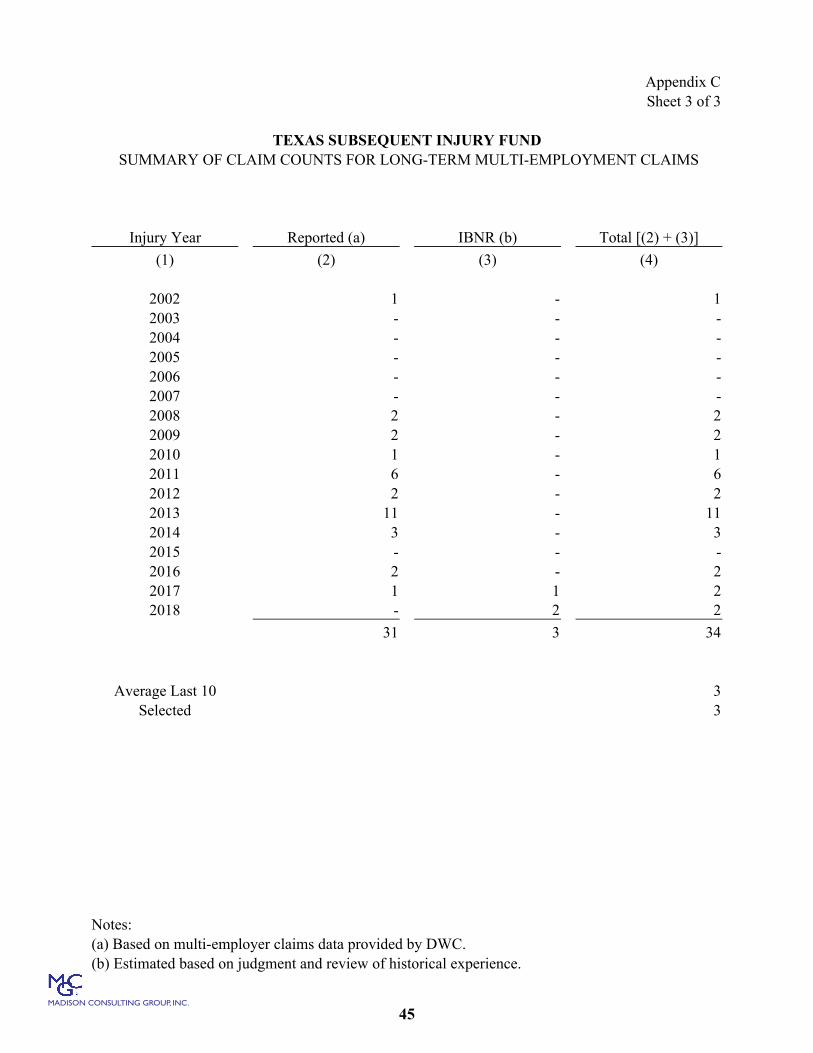
Injury Year Reported (a) IBNR (b) Total [(2) + (3)]
(1) (2) (3) (4)
2002 1 - 1 2003 - - - 2004 - - - 2005 - - - 2006 - - - 2007 - - - 2008 2 - 2 2009 2 - 2 2010 1 - 1 2011 6 - 6 2012 2 - 2 2013 11 - 11 2014 3 - 3 2015 - - - 2016 2 - 2 2017 1 1 2 2018 - 2 2
31 3 34
Average Last 10 3 Selected 3
Notes:(a) Based on multi-employer claims data provided by DWC.(b) Estimated based on judgment and review of historical experience.
TEXAS SUBSEQUENT INJURY FUNDSUMMARY OF CLAIM COUNTS FOR LONG-TERM MULTI-EMPLOYMENT CLAIMS
45
MADISON CONSULTING GROUP, INC.
Appendix DSheet 1 of 2
Male Male Female Female Male Male Female FemaleMortality Expectancy Mortality Expectancy Mortality Expectancy Mortality Expectancy
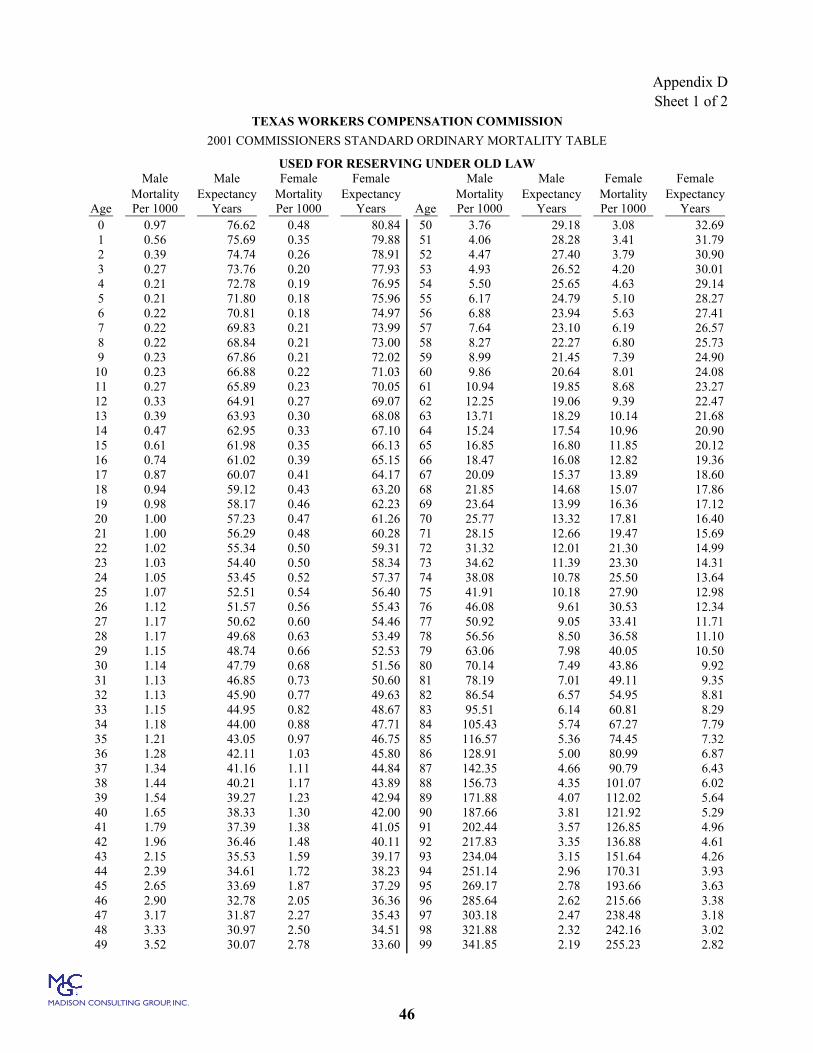
Age Per 1000 Years Per 1000 Years Age Per 1000 Years Per 1000 Years0 0.97 76.62 0.48 80.84 50 3.76 29.18 3.08 32.69 1 0.56 75.69 0.35 79.88 51 4.06 28.28 3.41 31.79 2 0.39 74.74 0.26 78.91 52 4.47 27.40 3.79 30.90 3 0.27 73.76 0.20 77.93 53 4.93 26.52 4.20 30.01 4 0.21 72.78 0.19 76.95 54 5.50 25.65 4.63 29.14 5 0.21 71.80 0.18 75.96 55 6.17 24.79 5.10 28.27 6 0.22 70.81 0.18 74.97 56 6.88 23.94 5.63 27.41 7 0.22 69.83 0.21 73.99 57 7.64 23.10 6.19 26.57 8 0.22 68.84 0.21 73.00 58 8.27 22.27 6.80 25.73 9 0.23 67.86 0.21 72.02 59 8.99 21.45 7.39 24.90
10 0.23 66.88 0.22 71.03 60 9.86 20.64 8.01 24.08 11 0.27 65.89 0.23 70.05 61 10.94 19.85 8.68 23.27 12 0.33 64.91 0.27 69.07 62 12.25 19.06 9.39 22.47 13 0.39 63.93 0.30 68.08 63 13.71 18.29 10.14 21.68 14 0.47 62.95 0.33 67.10 64 15.24 17.54 10.96 20.90 15 0.61 61.98 0.35 66.13 65 16.85 16.80 11.85 20.12 16 0.74 61.02 0.39 65.15 66 18.47 16.08 12.82 19.36 17 0.87 60.07 0.41 64.17 67 20.09 15.37 13.89 18.60 18 0.94 59.12 0.43 63.20 68 21.85 14.68 15.07 17.86 19 0.98 58.17 0.46 62.23 69 23.64 13.99 16.36 17.12 20 1.00 57.23 0.47 61.26 70 25.77 13.32 17.81 16.40 21 1.00 56.29 0.48 60.28 71 28.15 12.66 19.47 15.69 22 1.02 55.34 0.50 59.31 72 31.32 12.01 21.30 14.99 23 1.03 54.40 0.50 58.34 73 34.62 11.39 23.30 14.31 24 1.05 53.45 0.52 57.37 74 38.08 10.78 25.50 13.64 25 1.07 52.51 0.54 56.40 75 41.91 10.18 27.90 12.98 26 1.12 51.57 0.56 55.43 76 46.08 9.61 30.53 12.34 27 1.17 50.62 0.60 54.46 77 50.92 9.05 33.41 11.71 28 1.17 49.68 0.63 53.49 78 56.56 8.50 36.58 11.10 29 1.15 48.74 0.66 52.53 79 63.06 7.98 40.05 10.50 30 1.14 47.79 0.68 51.56 80 70.14 7.49 43.86 9.92 31 1.13 46.85 0.73 50.60 81 78.19 7.01 49.11 9.35 32 1.13 45.90 0.77 49.63 82 86.54 6.57 54.95 8.81 33 1.15 44.95 0.82 48.67 83 95.51 6.14 60.81 8.29 34 1.18 44.00 0.88 47.71 84 105.43 5.74 67.27 7.79 35 1.21 43.05 0.97 46.75 85 116.57 5.36 74.45 7.32 36 1.28 42.11 1.03 45.80 86 128.91 5.00 80.99 6.87 37 1.34 41.16 1.11 44.84 87 142.35 4.66 90.79 6.43 38 1.44 40.21 1.17 43.89 88 156.73 4.35 101.07 6.02 39 1.54 39.27 1.23 42.94 89 171.88 4.07 112.02 5.64 40 1.65 38.33 1.30 42.00 90 187.66 3.81 121.92 5.29 41 1.79 37.39 1.38 41.05 91 202.44 3.57 126.85 4.96 42 1.96 36.46 1.48 40.11 92 217.83 3.35 136.88 4.61 43 2.15 35.53 1.59 39.17 93 234.04 3.15 151.64 4.26 44 2.39 34.61 1.72 38.23 94 251.14 2.96 170.31 3.93 45 2.65 33.69 1.87 37.29 95 269.17 2.78 193.66 3.63 46 2.90 32.78 2.05 36.36 96 285.64 2.62 215.66 3.38 47 3.17 31.87 2.27 35.43 97 303.18 2.47 238.48 3.18 48 3.33 30.97 2.50 34.51 98 321.88 2.32 242.16 3.02 49 3.52 30.07 2.78 33.60 99 341.85 2.19 255.23 2.82
TEXAS WORKERS COMPENSATION COMMISSION
2001 COMMISSIONERS STANDARD ORDINARY MORTALITY TABLE
USED FOR RESERVING UNDER OLD LAW
46

MADISON CONSULTING GROUP, INC.
Appendix DSheet 2 of 2
Male Male Female Female Male Male Female FemaleMortality Escalated Mortality Escalated Mortality Escalated Mortality Escalated
Age Per 1000 Factor Per 1000 Factor Age Per 1000 Factor Per 1000 Factor0 0.97 314.75 0.48 360.96 50 3.76 49.50 3.08 59.32 1 0.56 304.91 0.35 349.65 51 4.06 47.26 3.41 56.80 2 0.39 295.22 0.26 338.61 52 4.47 45.10 3.79 54.36 3 0.27 285.77 0.20 327.86 53 4.93 43.01 4.20 52.00 4 0.21 276.55 0.19 317.41 54 5.50 40.99 4.63 49.73 5 0.21 267.58 0.18 307.25 55 6.17 39.04 5.10 47.53 6 0.22 258.87 0.18 297.38 56 6.88 37.17 5.63 45.41 7 0.22 250.41 0.21 287.80 57 7.64 35.36 6.19 43.36 8 0.22 242.20 0.21 278.51 58 8.27 33.62 6.80 41.39 9 0.23 234.23 0.21 269.48 59 8.99 31.94 7.39 39.49
10 0.23 226.49 0.22 260.72 60 9.86 30.31 8.01 37.65 11 0.27 218.97 0.23 252.21 61 10.94 28.75 8.68 35.87 12 0.33 211.68 0.27 243.95 62 12.25 27.24 9.39 34.16 13 0.39 204.61 0.30 235.94 63 13.71 25.80 10.14 32.50 14 0.47 197.76 0.33 228.16 64 15.24 24.42 10.96 30.90 15 0.61 191.12 0.35 220.62 65 16.85 23.10 11.85 29.36 16 0.74 184.69 0.39 213.30 66 18.47 21.83 12.82 27.87 17 0.87 178.47 0.41 206.19 67 20.09 20.61 13.89 26.43 18 0.94 172.45 0.43 199.30 68 21.85 19.44 15.07 25.04 19 0.98 166.62 0.46 192.61 69 23.64 18.32 16.36 23.71 20 1.00 160.95 0.47 186.11 70 25.77 17.23 17.81 22.42 21 1.00 155.45 0.48 179.80 71 28.15 16.19 19.47 21.18 22 1.02 150.10 0.50 173.68 72 31.32 15.19 21.30 19.99 23 1.03 144.91 0.50 167.73 73 34.62 14.23 23.30 18.85 24 1.05 139.86 0.52 161.96 74 38.08 13.33 25.50 17.76 25 1.07 134.96 0.54 156.35 75 41.91 12.46 27.90 16.71 26 1.12 130.20 0.56 150.91 76 46.08 11.64 30.53 15.70 27 1.17 125.57 0.60 145.63 77 50.92 10.85 33.41 14.74 28 1.17 121.09 0.63 140.50 78 56.56 10.10 36.58 13.82 29 1.15 116.73 0.66 135.52 79 63.06 9.39 40.05 12.93 30 1.14 112.49 0.68 130.69 80 70.14 8.73 43.86 12.09 31 1.13 108.36 0.73 126.00 81 78.19 8.11 49.11 11.28 32 1.13 104.35 0.77 121.45 82 86.54 7.53 54.95 10.52 33 1.15 100.46 0.82 117.03 83 95.51 6.98 60.81 9.81 34 1.18 96.67 0.88 112.74 84 105.43 6.47 67.27 9.14 35 1.21 93.00 0.97 108.58 85 116.57 6.00 74.45 8.51 36 1.28 89.43 1.03 104.55 86 128.91 5.56 80.99 7.92 37 1.34 85.96 1.11 100.64 87 142.35 5.15 90.79 7.35 38 1.44 82.60 1.17 96.85 88 156.73 4.78 101.07 6.83 39 1.54 79.34 1.23 93.16 89 171.88 4.44 112.02 6.35 40 1.65 76.17 1.30 89.59 90 187.66 4.14 121.92 5.91 41 1.79 73.10 1.38 86.12 91 202.44 3.86 126.85 5.50 42 1.96 70.13 1.48 82.76 92 217.83 3.60 136.88 5.07 43 2.15 67.25 1.59 79.49 93 234.04 3.37 151.64 4.65 44 2.39 64.46 1.72 76.33 94 251.14 3.15 170.31 4.27 45 2.65 61.76 1.87 73.26 95 269.17 2.95 193.66 3.92 46 2.90 59.15 2.05 70.29 96 285.64 2.77 215.66 3.64 47 3.17 56.62 2.27 67.41 97 303.18 2.60 238.48 3.40 48 3.33 54.17 2.50 64.63 98 321.88 2.44 242.16 3.21 49 3.52 51.80 2.78 61.93 99 341.85 2.29 255.23 2.99
TEXAS WORKERS COMPENSATION COMMISSION
2001 COMMISSIONERS STANDARD ORDINARY MORTALITY TABLE
USED FOR RESERVING UNDER NEW LAW (3% ESCALATION)
47
MADISON CONSULTING GROUP, INC.
Appendix E
Estimated EstimatedBacklog Payments
AY AY 2017 Trended @8/31/18 2017 Trended In 2019Item 2017 (a) 2018 (a) to 2018 (b) (4) - (3) to 2019 (b) [(5) + (6)]
(1) (2) (3) (4) (5) (6) (7)
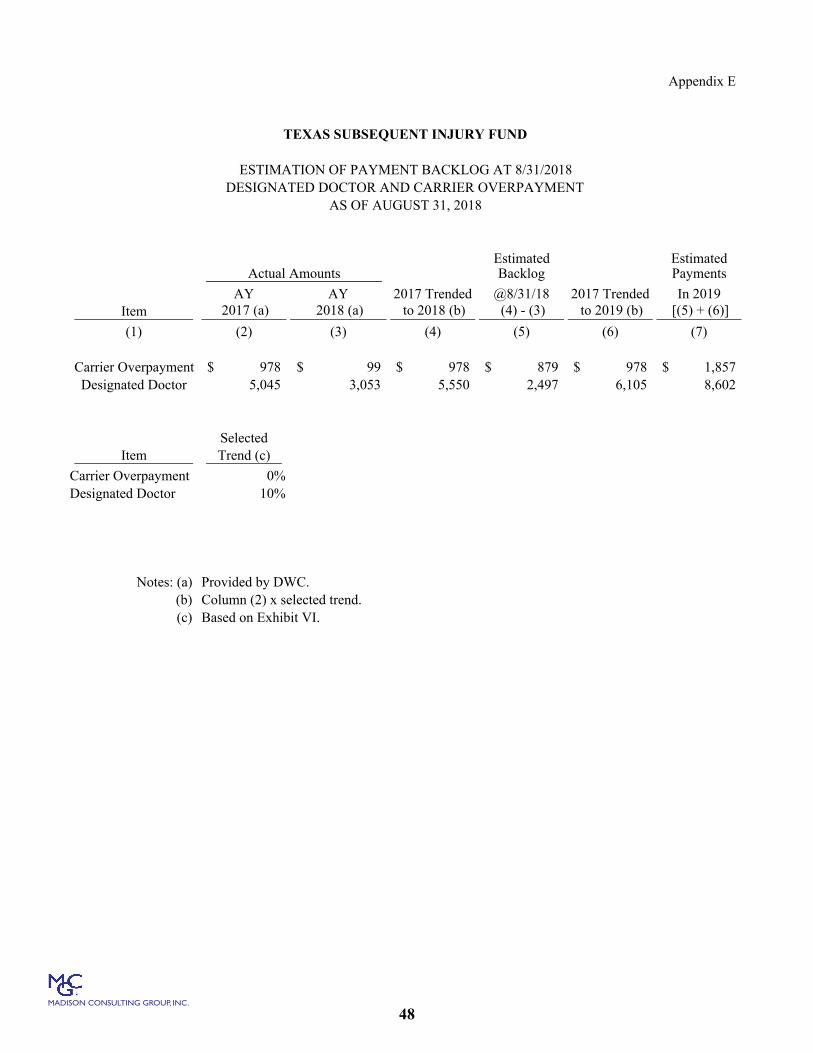
Carrier Overpayment 978$ 99$ 978$ 879$ 978$ 1,857$ Designated Doctor 5,045 3,053 5,550 2,497 6,105 8,602
SelectedItem Trend (c)
Carrier Overpayment 0%Designated Doctor 10%
Notes: (a) Provided by DWC.(b) Column (2) x selected trend.(c) Based on Exhibit VI.
TEXAS SUBSEQUENT INJURY FUND
ESTIMATION OF PAYMENT BACKLOG AT 8/31/2018
AS OF AUGUST 31, 2018DESIGNATED DOCTOR AND CARRIER OVERPAYMENT
Actual Amounts
48